Notícias do Mercado
-
23:49
Gold Price Forecast: XAU/USD pierces $1,800 as US T-bond yields rise
- Gold aims higher, as nervousness grows on investors, of what the Federal Reserve might do next.
- The ECB adds to the growing list of central banks, saying that inflation might not be as “transitory” as expected, but expects it to fade in 2022.
- XAU/USD: The yellow-metal gained traction, as the US dollar index plunged 0.71%, well below 93.40.
Gold (XAU/USD) climbs during the Asian session, is up 0.09%, trading at $1,800.00 a troy ounce at the time of writing. The non-yielding metal recovered some of its brightness as it seesawed on Thursday.
Risk-on market sentiment kept investors in and out of gold, thus spurring violent swings in the yellow metal. Further, slower than expected US economic growth and central bank tightening dents the prospects on the greenback, ultimately favoring gold.
In the meantime, the US T-bond yields rose in the session, with the 10-year note improving to 1.578%, up to four basis points. Meanwhile, the US Dollar Index fell 0.71%, sitting at 93.35.
On Thursday, the European Central Bank (ECB) President Christine Lagarde said that higher inflation might be around for longer than expected. However, the bank estimates prices will start moderating in 2022.
That said, expectations around gold lie heavily on the Federal Reserve November meeting. A $15 Billion bond taper is priced in. However, If the Federal Reserve aims for a quicker than expected bond-tapering, that might send gold tumbling below the $1,720 threshold and potentially towards a renewed test of 2021 lows.
XAU/USD Price Forecast: Technical outlook
Daily chart
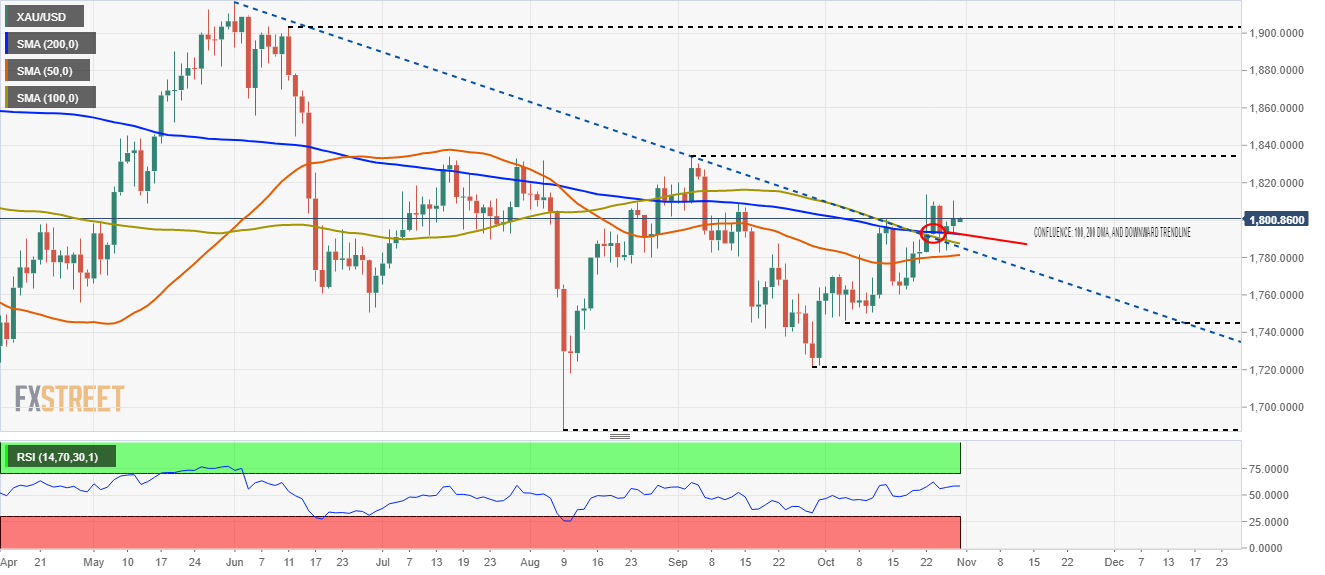
Gold (XAU/USD) spot price is above the confluence of the 100 and 200-day moving average (DMA) and on Tuesday broke a downward slope trendline previously resistance-turned-support, which could be viewed as a bullish signal. The Relative Strength Index (RSI) is at 58, aims slightly low, but as it remains above the 50-midline, it is bullish for the yellow metal.
To resume the upward trend, gold buyers will need a daily close above $1,800. In that outcome, the September 3 high at $1,834 would be the first resistance level. A clear break above the latter would expose the June 4 low at $1,855, followed by the $1,900 threshold.
-
23:41
AUD/USD consolidates gains above 0.7500 ahead of Aussie Retail Sales
- AUD/USD prints mild losses after refreshing three-month high.
- Market sentiment worsens amid an absence of US stimulus deal.
- Softer US GDP, ECB announcements dragged down USD despite firmer Treasury yields.
- Australia Q3 PPI, Retail Sales for September can direct immediate moves ahead of US Core PCE Inflation data.
AUD/USD struggles to extend the four-day uptrend around the highest levels since July, down 0.11% intraday around 0.7535 during Friday’s initial Asian session. In doing so, the quote portrays a cautious mood in the market ahead of the key Aussie and the US data.
In addition to the cautious mood ahead of Australia’s third-quarter (Q3) Producer Price Index (PPI) and September’s Retail Sales, an absence of a deal on the US President Joe Biden’s $1.75 trillion stimulus package also weigh on the market sentiment and the AUD/USD prices. On Thursday, US Democrats discussed details of President Biden’s infrastructure plan but some on the floor reject voting on the package unless getting final blueprints, delaying the vote to the next week.
Elsewhere, fresh chatters over inflation and firmer monetary policies also sour the sentiment. Although the US Q3 GDP’s weakness hints at the Fed’s slower rush towards monetary policy tightening, inflation expectations remain near a multi-year high in the US and Eurozone, which in turn joins the covid-led supply crunch to push policymakers towards tightening. Hence, the fears of the Fed calling an end to the easy money loom and challenge AUD/USD prices.
During the previous day, the US Dollar Index (DXY) dropped the most since October 13 after the US Q3 GDP US Q3 GDP slipped below 2.7% forecast to 2.0%, much lower than 6.7% prior. Also, the European Central Bank’s (ECB) hint to start tapering the monthly bond purchases and the PEPP (that’s the pandemic emergency purchase program) will end next March propelled the Euro and weighed down the USD. The regional central bank left monetary policy unchanged, as expected, with refinancing rate at 0.0% and deposit rates at -0.5%.
Amid these plays, the S&P 500 Futures print mild losses after the Wall Street benchmark closed positive, exerting additional downside pressure on the AUD/USD prices.
Given the anticipated QoQ weakness in the PPI, from 0.7% to 0.3%, contrasting the strong YoY expectations of 3.2% versus 2.2% prior, the Reserve Bank of Australia (RBA) may not gain much information about the factory gate inflation. Hence, the data may offer little direction to the AUD/USD prices. However, an anticipated jump in the Aussie Retail Sales, from -1.7% to +0.2% for September may hint at a further tightening of the monetary policy and rate hikes after the early week’s firmer inflation numbers, which in turn could help the quote poke July’s high of 0.7599 on positive release.
Following the Aussie data, Fed's preferred inflation gauge, namely Core Personal Consumption Expenditures (PCE) - Price Index for September will be in focus.
Read: Personal Consumption Expenditure Price Index September Preview: Transitory inflation becomes permanent
Technical analysis
AUD/USD grinds higher around July top amid sluggish Momentum line. However, the Aussie pair confirmed the bullish pennant and hence kept the buyers hopeful of revisiting the June high surrounding 0.7775 on the previous day’s sustained break of 0.7535. However, tops marked during late June around 0.7620 may offer an intermediate halt during the rally.
In a case where the bears sneak in, a downside break of the pennant’s support line, at 0.7485 by the press time, a convergence of the 100-SMA and monthly support line near 0.7420 will be eyed for further weakness.
-
23:41
USD/JPY refreshes daily lows below 113.55 ahead of UK/Japan data
- USD/JPY consolidates below 113.55 in the initial Asian session.
- The US dollar trades at four-week lows despite higher US T-bonds yields.
- BOJ interest rate decision and forecast, and mixed economic data supported the yen.
USD/JPY remains subdued on the last trading day of the week, following the previous session’s downside movement. The pair stayed in a narrow trading range. At the time of writing, USD/JPY is trading at 113.58, up 0.01% so far.
The US dollar index traded near, lowest in four weeks after GDP growth came below the forecast of 2% and PCE prices increased faster than anticipated.
On the other hand, the Japanese yen gained some traction after the Bank of Japan (BoJ) policy update. The BoJ maintained the status quo while keeping the cash rate low at -0.10%. The central bank also trimmed this year’s consumer inflation forecast to 0% from 0.6%.
It is worth noting that, S&P 500 Futures are trading at 4,577.50, down 0.23% so far.
As for now, traders are waiting for Japan Unemployment Rate, Consumer Confidence, US Personal Income and Spending to gauge the market sentiment.
-
23:22
AUD/JPY Price Analysis: Upside move capped at 86.00, doji clouds the uptrend
- AUD/JPY has been trapped within the 85.00-86.00 range in the last three days.
- AUD/JPY: Long-wicks on both sides of a doji depicts indecision between buyers/sellers.
- AUD/JPY: RSI at overbought levels could spur a correction towards 84.61 before resuming the uptrend.
The AUD/JPY hovers around familiar levels, unable to break in either direction, is trading at 85.57 during the day at the time of writing.
On Thursday, the market sentiment was upbeat, as portrayed by US stocks finishing in the green. Further, as the Asian session begins, investor mood turns sour, depicted by Asian equity futures dropping, except for the Japanese Topix and the Australian S&P/ASX 200.
AUD/JPY Price Forecast: Technical outlook
Daily chart
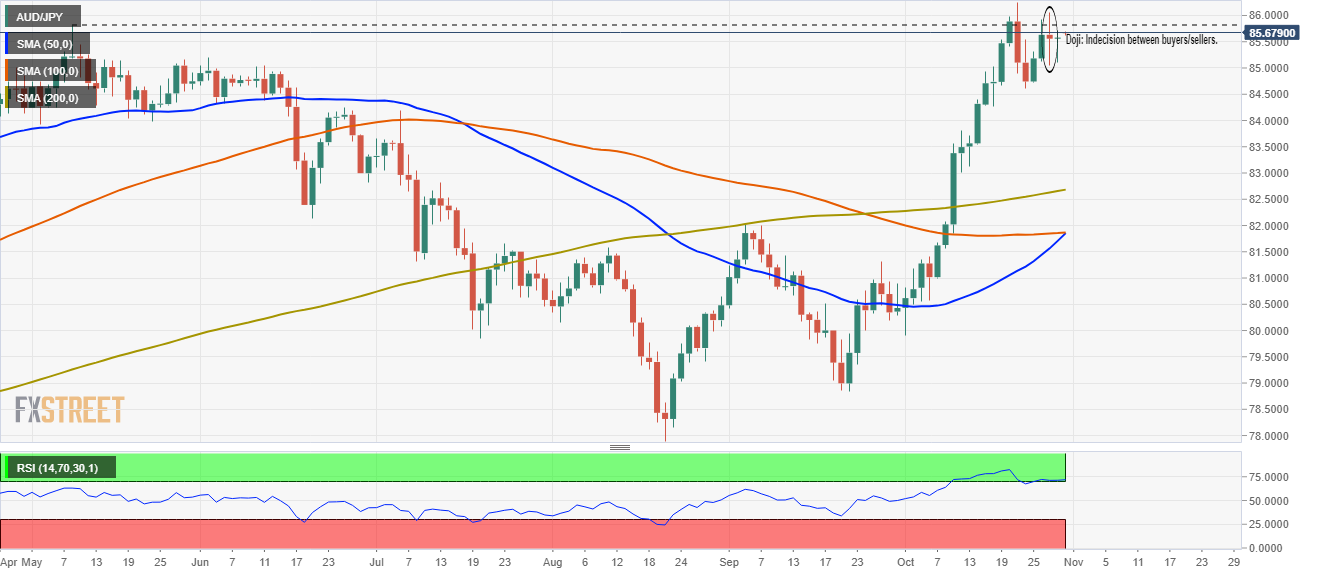
The daily chart portrays the cross-currency has an upward bias, depicted by the daily moving averages (DMA’s) remaining below the spot price with an upslope confirming the solid uptrend.
The pair has been unable to break to the upside, despite three previous attempts amid having a risk-on market sentiment, which usually benefits the risk-sensitive Australian dollar.
Furthermore, Wednesday’s price action formed a doji, with long wicks on both sides, confirming indecision between buyers/sellers.
Furthermore, the Relative Strength Index (RSI) is at 72 in overbought levels, indicating the AUD/JPY pair may retreat, allowing the RSI indicator to exit from the abovementioned conditions before resuming the uptrend.
Therefore, in case of a lower correction, the first meaningful support level would be the October 22 low at 84.61
-
23:15
EUR/USD Price Analysis: 50-DMA, monthly trend line check heaviest daily jump since May
- EUR/USD seesaws around monthly high following the biggest daily rise in five months.
- Bullish MACD, firmer RSI line keep buyers hopeful.
- Pullback moves may eye October 19 peak, key Fibonacci retracements can also test the bulls.
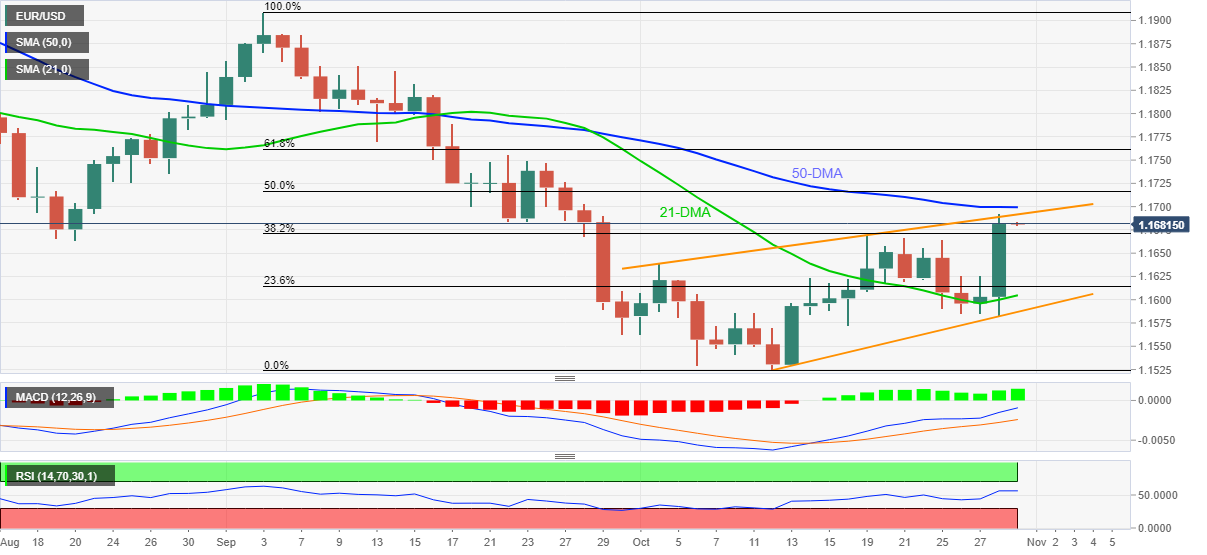
EUR/USD edges higher around one-month high, taking rounds to 1.1680 during Friday’s initial Asian session. The major currency pair jumped the most since early May the previous day and refreshed the monthly peak.
However, an upward sloping trend line from October 04 questioned the quote’s further upside before the 50-DMA hurdle that’s standing nearby.
Given the bullish MACD signals and the firmer RSI line, now overbought, the EUR/USD upside is likely to prevail. Though, a clear break of the stated resistance line and DMA, respectively around 1.1690 and 1.1700, becomes necessary to rule out chances of a pullback.
Following that, 50% and 61.8% Fibonacci retracement levels of September-October fall, near 1.1720 and 1.1760 in that order will question the EUR/USD bulls.
Meanwhile, pullback moves may test the previous high of the current month, around 1.1670, a break of which will recall the 1.1630 support to the chart.
It should be noted, however, that the 21-DMA at 1.1600 and an ascending support line from October 12 close to 1.1585 become tough challenges for EUR/USD sellers to tackle before retaking the controls.
EUR/USD: Daily chart
Trend: Pullback expected
-
22:52
GBP/USD: Softer USD cover Brexit wounds near 1.3800, focus on US Core PCE Inflation
- GBP/USD grinds higher following the biggest daily jump in over a week.
- France details UK ships, Britain summons French ambassador with readiness to retaliate.
- Softer US GDP, ECB announcements dragged down USD despite firmer Treasury yields.
- Risk catalysts can entertain ahead of Fed’s preferred inflation gauge’s release.
GBP/USD reacts to Brexit jitters with a cold heart, despite easing a bit from weekly top to 1.3800 by the press time of the initial Asian session on Friday. That being said, the cable pair seems to cheer the US dollar weakness amid risk-on mood.
“A British trawler has been seized by France and another has been fined, amid an escalating row over post-Brexit fishing rights,” said the BBC late Thursday to mark the fresh Brexit drama as the policymakers jostle over Article 16. Following that, an update showed that the UK summoned the French ambassador over the issue while Sky News reported Britain’s readiness to clash with the European Union (EU) over fallout from the key Northern Ireland (NI) protocol.
Read: Brexit saga continues and risk for GBP amount as traders brace for major clash
Other than the Brexit drama, the recent jump in the UK’s coronavirus cases and the covid-led fatalities also challenge the GBP/USD buyers. Britain registered the highest covid numbers and death toll since March before the figures eased on Thursday to 39,842 and 165 respectively. Even so, the UK removes the last seven countries from its travel red list.
UK Chancellor Rishi Sunak’s multi-billion Pound worth of budget 2021 and hints to taper the bond issuance, which indirectly signal the Bank of England’s (BOE) hawkish move, seems to play a distant role in the GBP/USD upside.
More importantly, the heaviest daily fall in 12 days by the US Dollar Index (DXY) could be linked to the cable pair’s run-up. The greenback gauge dropped the most since October 13 the previous day after US Q3 GDP slipped below 2.7% forecast to 2.0%, much lower than 6.7% prior. The softer GDP growth pushes the Fed to slow down on its monetary policy normalization rush.
It should be observed that the European Central Bank’s (ECB) hint to start tapering the monthly bond purchases and the PEPP (that’s the pandemic emergency purchase program) will end next March propelled the Euro and weighed down the USD. The regional central bank left monetary policy unchanged, as expected, with refinancing rate at 0.0% and deposit rates at -0.5%.
Amid these plays, Wall Street managed to recover Wednesday’s losses on Thursday while the US 10-year Treasury yields rose 4.9 basis points (bps) to 1.578% by the end of Thursday’s North American session.
Looking forward, Brexit, tapering and inflation headlines remain hot to determine near-term GBP/USD moves and hence today’s US Core PCE Inflation data for October, Fed’s favorite price pressure indicator will be important to watch. The Core Personal Consumption Expenditures (PCE) - Price Index for September is likely to ease to 0.2% from 0.3% prior on the MoM basis.
Read: Personal Consumption Expenditure Price Index September Preview: Transitory inflation becomes permanent
Technical analysis
GBP/USD rebounds from 50-DMA, around 1.3710 by the press time, to portray the previous day’s upside moves, which in turn joins bullish MACD signals and firmer RSI to direct the quote towards 200-DMA hurdle surrounding 1.3855.
-
22:32
NZD/USD hovers near 0.7200 amid broad US dollar weakness
- On Thursday, the NZD/USD trimmed Wednesday’s losses, approaching 0.7200.
- Overall, US dollar weakness dents the prospects of the greenback, despite higher US bond yields.
- US GDP for the Q3 was lower than expected shows that the US economy could be slowing.
The NZD/USD advances as the New York session end, is up 0.43%, trading at 0.7198 at the time of writing. Market sentiment is upbeat, portrayed by US equity indices finishing in the green, posting gains between 0.68% and 1.15%. Factors like US corporate earnings have kept investors looking for riskier assets, hurting safe-haven currencies like the US dollar, the Japanese yen, and the Swiss franc.
Furthermore, the US Dollar Index, which tracks the greenback’s performance against a basket of its peers, plummeted 0.71 %, to sit at 93.35, despite higher US Bond yields. In the meantime, the US 10-year benchmark note rose by five basis points, currently at 1.578%.
US GDP for the Q3, lower than expected, as growth seems to be peaking, but inflation not
An absent New Zealand economic docket left the pair’s behavior at the dynamics of the US dollar.
Meanwhile, the US economic docket unveiled mixed data, being the highlights the less than expected growth in the US economy, with the Gross Domestic Product for the third quarter growing 2%, just short of the 2.7% estimated, missing widely against 6.1% growth in the previous period reading. Contrary, the US Initial Jobless Claims rose to 281K, lower than the 290K estimated by analysts, showing the US labor market has been improving throughout the last month.
The NZD/USD traders now will turn their attention to the next week, when the Federal Reserve will unveil its monetary policy decision. Investors already priced in a mid-November bond tapering start, but recent US economic data could push it backward, resulting in US dollar weakness and New Zealand Dollar strength.
NZD/USD Price Forecast: Technical outlook
1-Hour chart
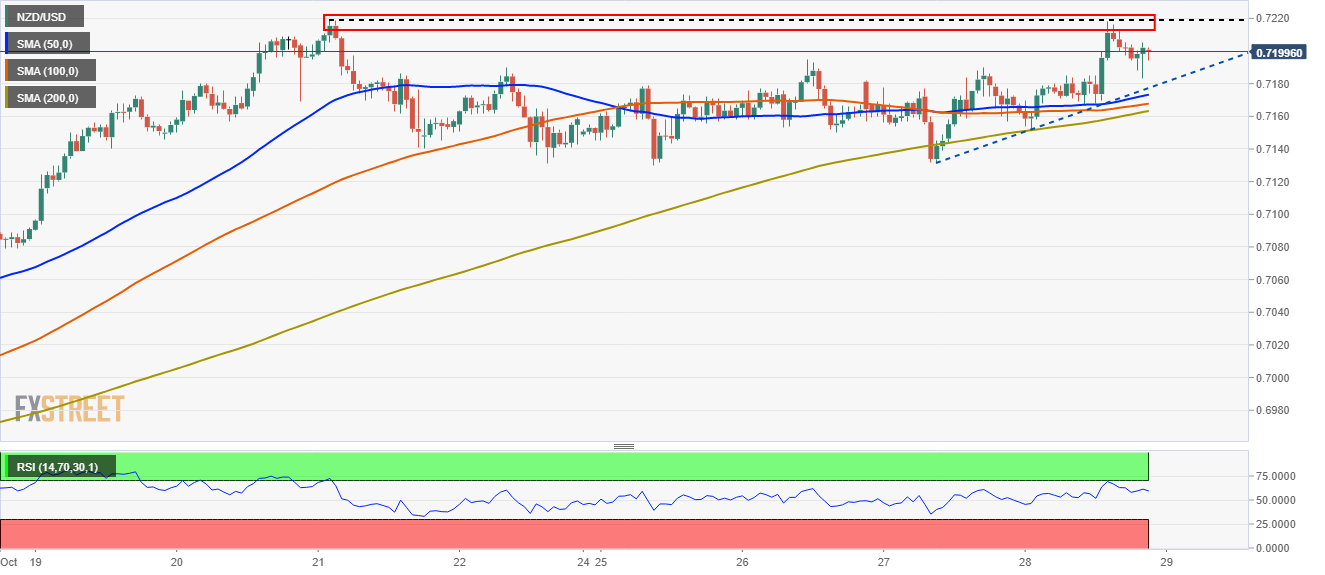
The 1-hour chart depicts the NZD/USD pair is tilted to the upside, with the 50, 100, and 200-simple moving averages (SMA’s) remaining beneath the spot price. Also, a rising upslope trendline that travels from the October 27 low towards the October 28 low would cap any downward move that could threaten to break below the SMA’s.
Furthermore, the Relative Strength Index at 61 aims higher with enough room to support another NZD/USD leg up before turning overbought.
Therefore, a break above the 0.7200 figure is on the cards, but strong resistance would lie on 0.7220, unsuccessfully tested three times before.
-
22:26
RBNZ’s Orr: We are now entering a different environment for rates, inflation
“Monetary policy has largely run its easing course globally,” said Reserve Bank of New Zealand (RBNZ) Governor Adrian Orr during early Friday morning in Asia.
The RBNZ boss adds, “We are now entering a different environment for rates, inflation.”
More to come….
FX implications
NZD/USD remains on the front-foot, backed by the broad US dollar weakness, despite the recent pullback to 0.7200.
-
22:01
AUD/USD Price Analysis: Bulls eye a fresh cycle high for the session ahead
- AUD/USD bulls eye a scalping opportunity for a fresh cycle high in today's Asian session.
- Weekly and daily resistance could be a tough nut to crack on the way to 0.76 the figure.
AUD/USD has been an impressive run of late to the upside and there are prospects of higher highs within this currency bullish cycle. However, we have both weekly and daily resistances surrounding 0.76 the figure, but a scalping opportunity is taking shape on the 1hour and 150min time frames for the session ahead.
AUD/USD daily chart
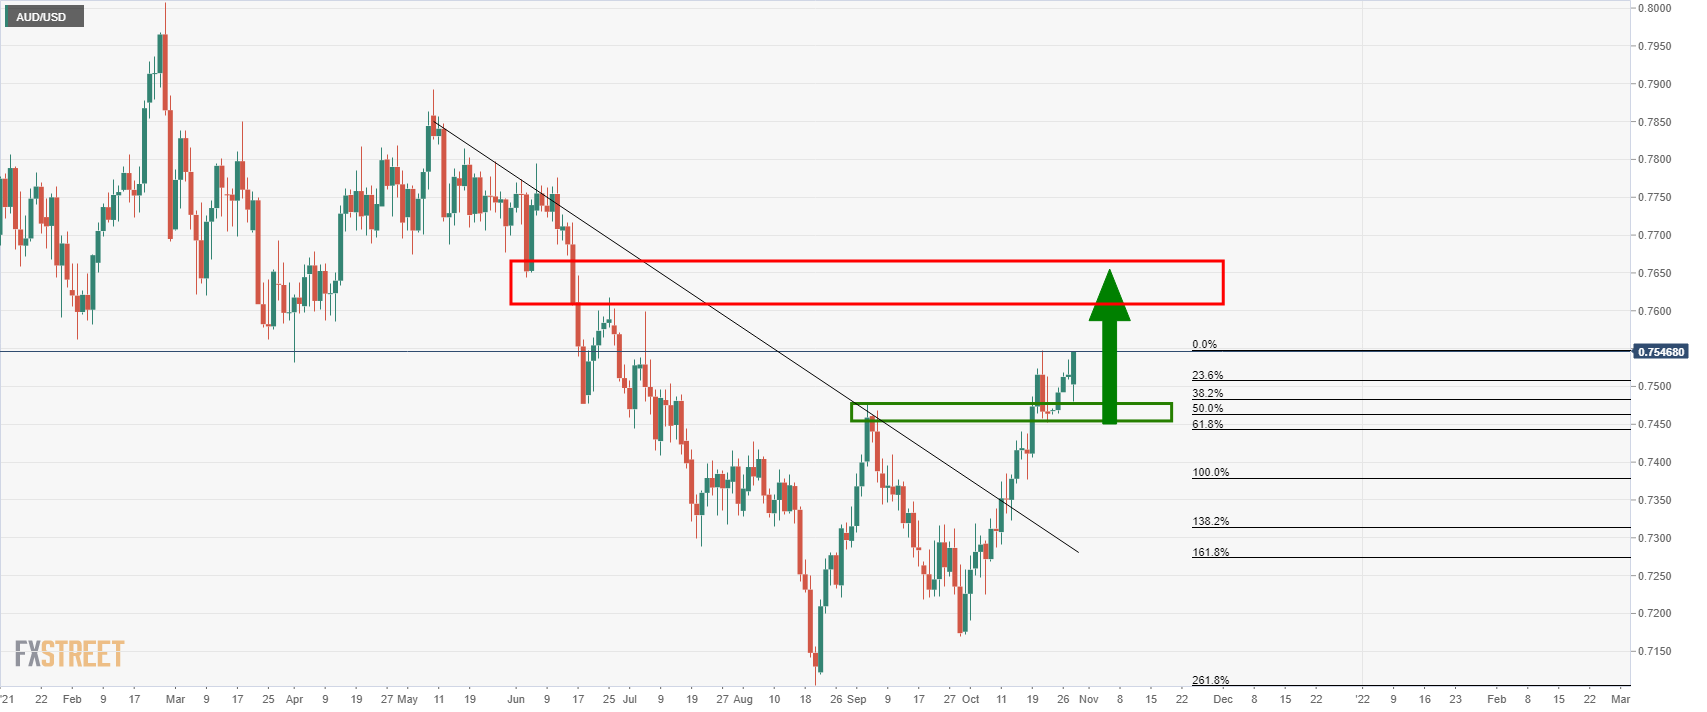
The price has moved higher in a fresh daily impulse which could equate to further upside to challenge the 0.7650s in the coming days. However, chasing the price at this stage is risky for there is yet to be a significant pull back into 10 and 21 moving averages:
As illustrated, there is a meanwhile resistance at this juncture when looking all the way back to the end of 2020. Also, more often than not, we get a convergence of the price with the EMAs shortly after such a breakout from where bulls might want to engage on signs of stabilisation and bullish tendencies in the price action.
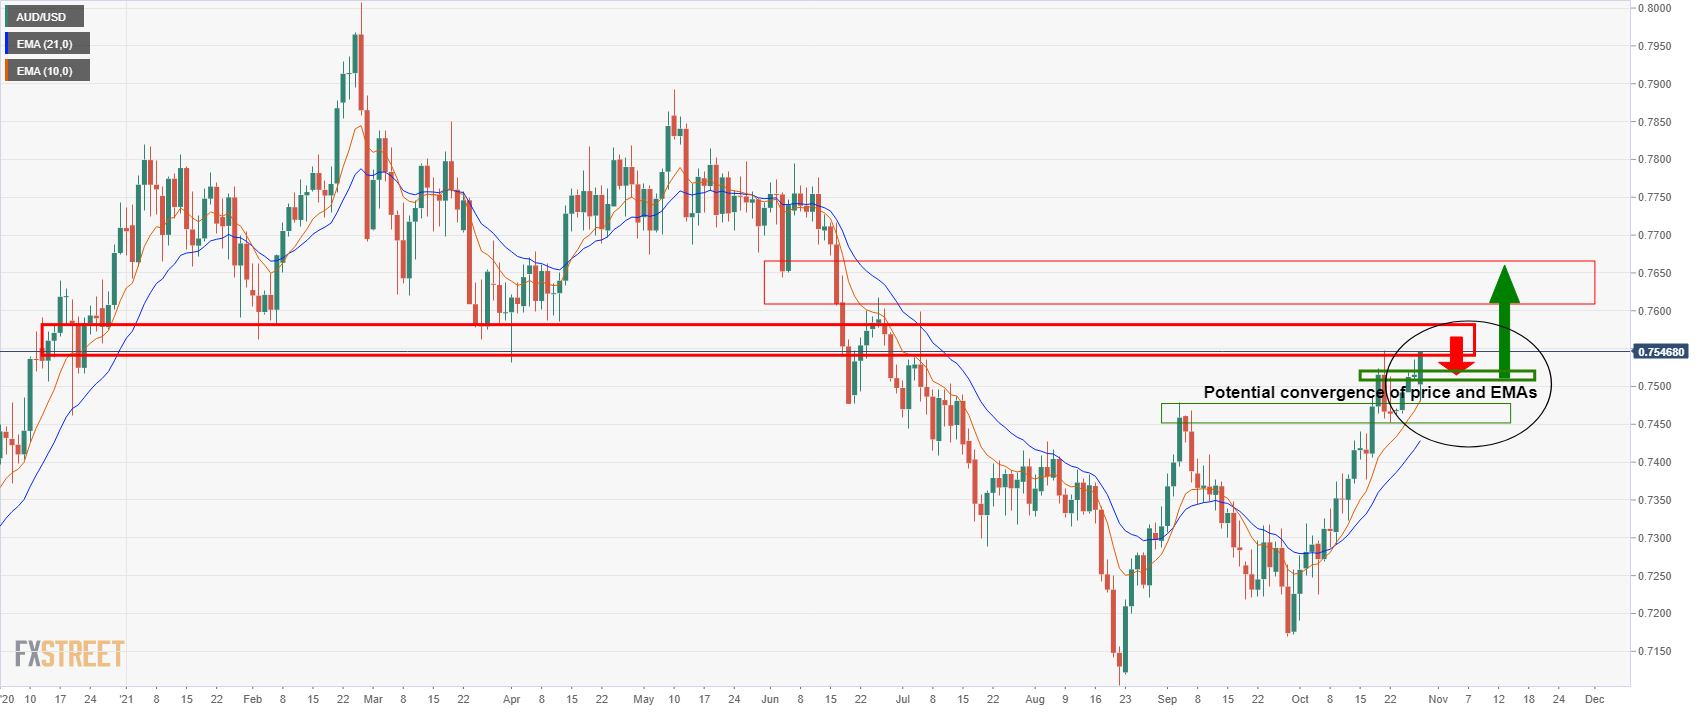
AUD/USD weekly chart
The weekly chart illustrates the resistance more clearly. The price has filled in last week's wick and faces 0.7600 psychological resistance.
However, from an hourly perspective, there are prospects of a scalp to the upside and to test the current daily support as follows:
AUD/USD 1HR chart
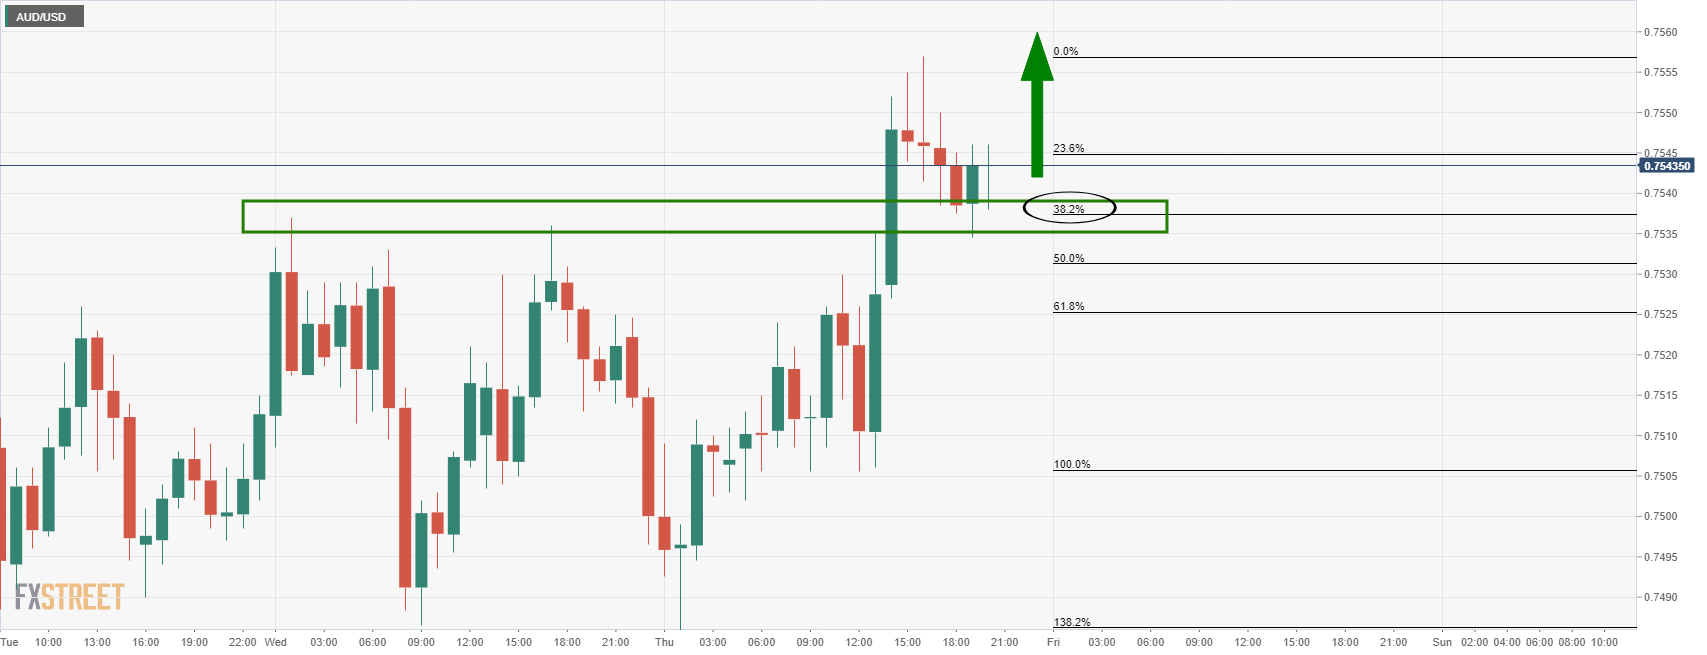
AUD/USD bulls are moving in on the correction of the hourly bullish impulse. Should there be a break of the 0.7545 level, bulls will be looking for an optimal entry point, potentially on a restest of 15-min structure as follows:
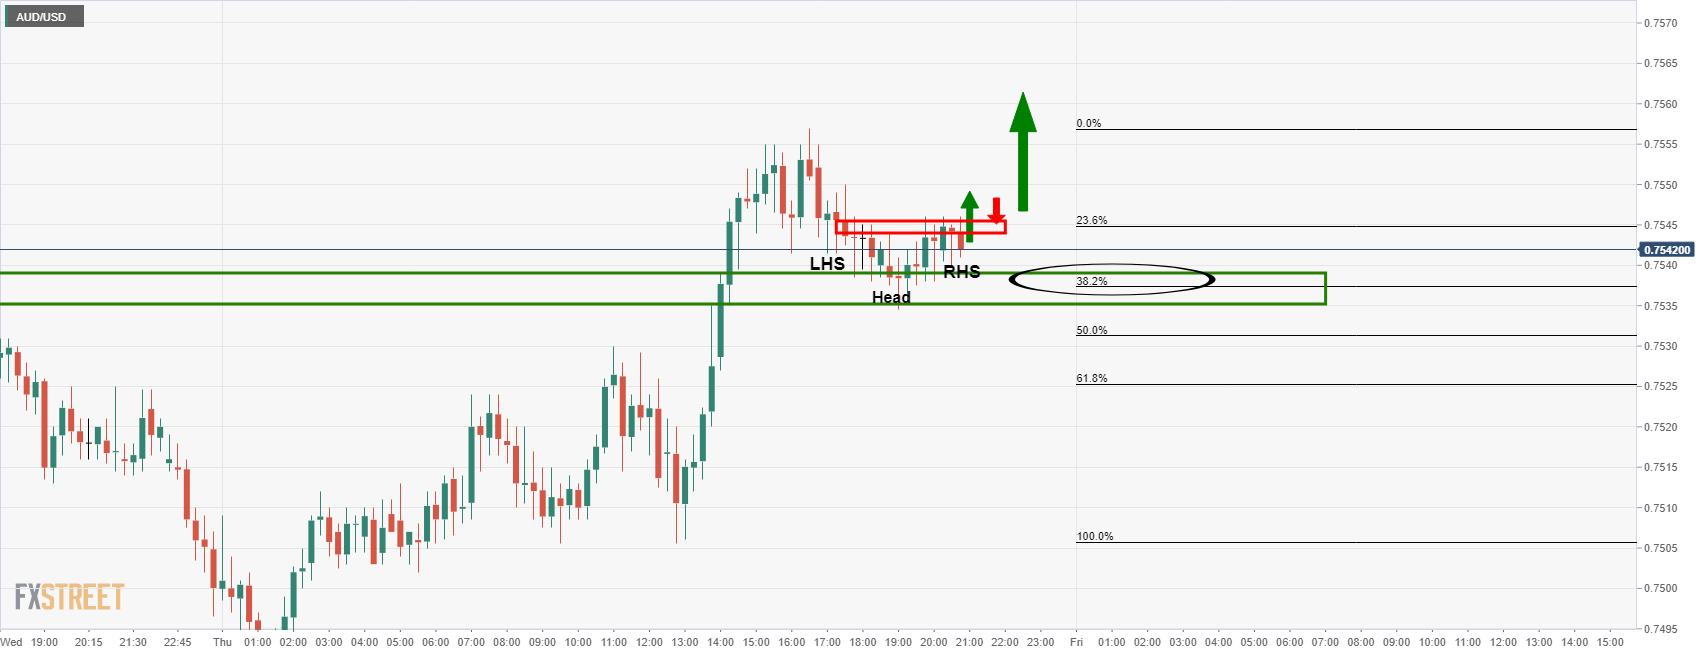
As illustrated, there are prospects of a bullish reverse head and shoulders in the making. A break of the neckline and restest could be where bulls will be interested to enter for a run into the 0.7560s for the Asian session. Retail Sales is going to be a potential mover today.
-
22:00
South Korea BOK Manufacturing BSI below expectations (91) in November: Actual (87)
-
21:31
Breaking: Apple (AAPL) Q4 misses on supply chain issues, CEO says holiday quarter impact to be worse
Update: Apple CEO Tim Cook told Reuters Apple had "larger than expected supply constraints" , "We're doing everything we can do to get more (chips) and also everything we can do operationally to make sure we're moving just as fast as possible," Cook said. "We're projecting very solid demand growth year over year. But we are also predicting that we're going to be short of demand by larger than $6 billion," Cook added.
Apple (AAPL) reported earnings after the close on Thursday. Earnings Per Share (EPS) came in at $1.24 versus the estimate of $1.24. Revenue came in at $83.36 billion versus the estimate of $84.85 billion.
Apple stock forecast
Apple stock is trading at $146.7 in the aftermarket for a loss of 3.85%.
-
21:05
Breaking: Amazon (AMZN) Q3 earnings misses estimates on EPS and revenue
Amazon (AMZN) reported earnings after the close on Thursday. Earnings Per Share (EPS) missed estimates, coming in at $6.12 versus $8.92. Revenue also missed estimates, coming in at $110.8 billion versus the $111.6 billion estimate.
Amazon stock forecast
Amazon (AMZN) stock is trading at $3300.70 in the after hours a loss of 4.2%.
-
20:46
EUR/GBP Price Analysis: Trapped market, but opportunities are ripening
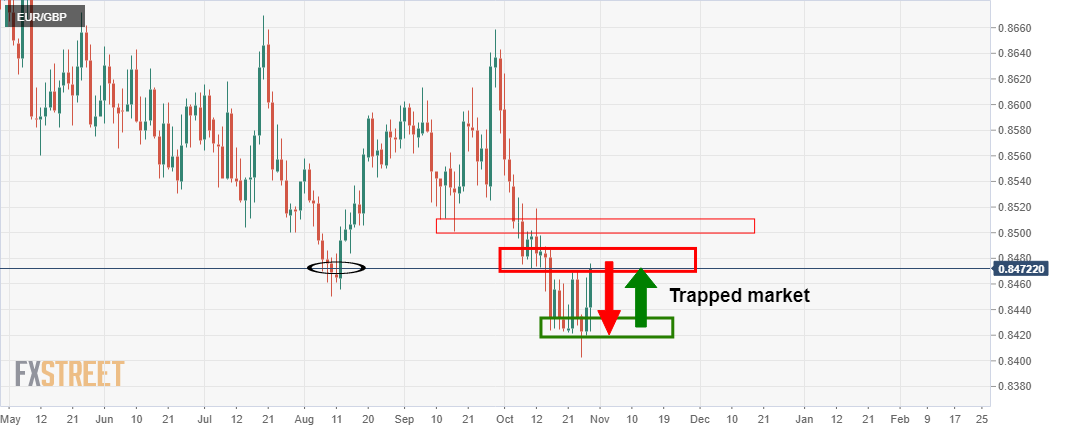
- EUR/GBP is trapped from a 4-hour perspective.
- Bulls are on the lookout for a break of current weekly resistance for a deeper correction.
- Scalpers are monitoring the faster price action and near-term support for a possible 50% mean reversion opportunity.
The price of the cross has been correcting the weekly bearish impulse and traders are awaiting the next moves in the pair for an optimal entry. The following illustrates the weekly, 4-hour and 1-hour markets structure and potential trading opportunities on the horizon.
EUR/GBP weekly chart
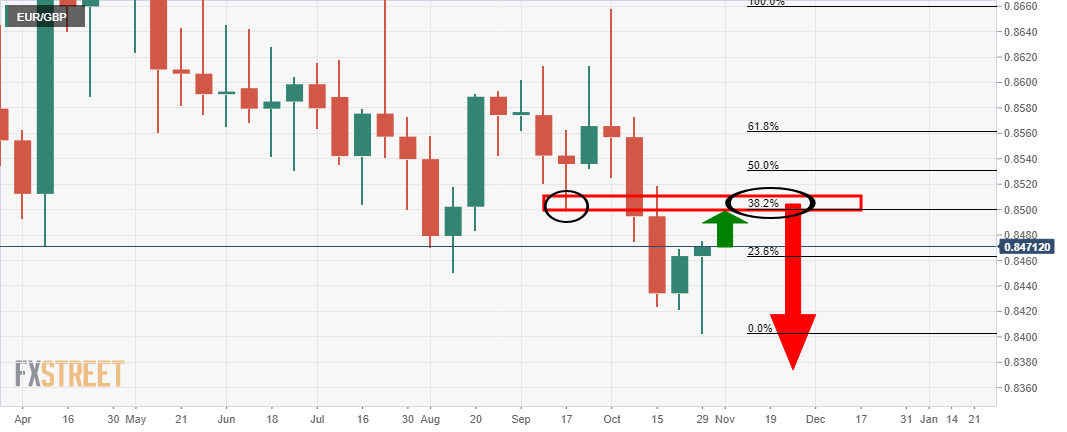
The price of EUR/GBP has seen a strong correction as per the weekly chart and the neckline of the M-formation is compelling given the confluence with the 38.2% Fibonacci retracement level near to 0.85 the figure. However, the price still needs to surpass the current resistance as illustrated below:
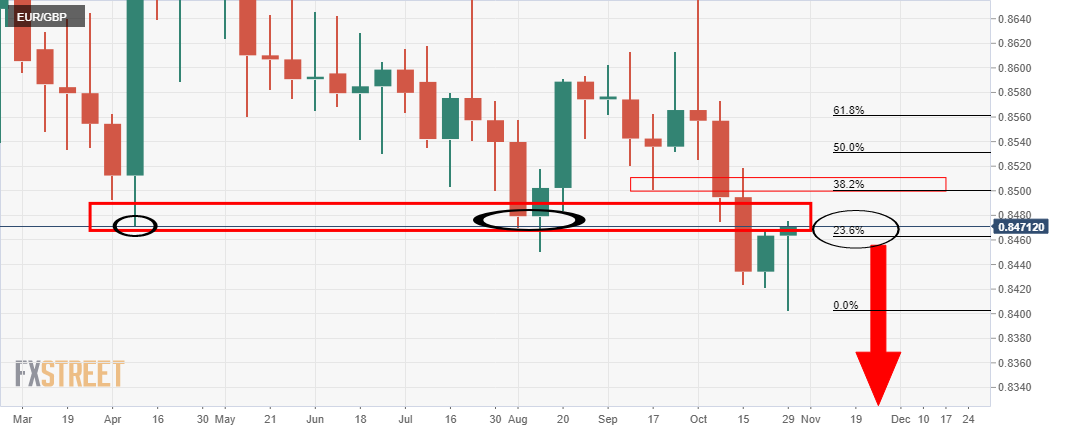
The price is meeting the 23.6% Fibo that has a confluence with the prior summer and April lows near 0.8472.
Meanwhile, from a 4-hour perspective the market is trapped between support and resistance as follows:
EUR/GBP 4HR chart
Until the price can break either above 0.8490 or below 0.8420, there is little bias one way or the other and scalping on the lower timeframes are where the opportunities stay for now.
EUR/GBP 1HR chart
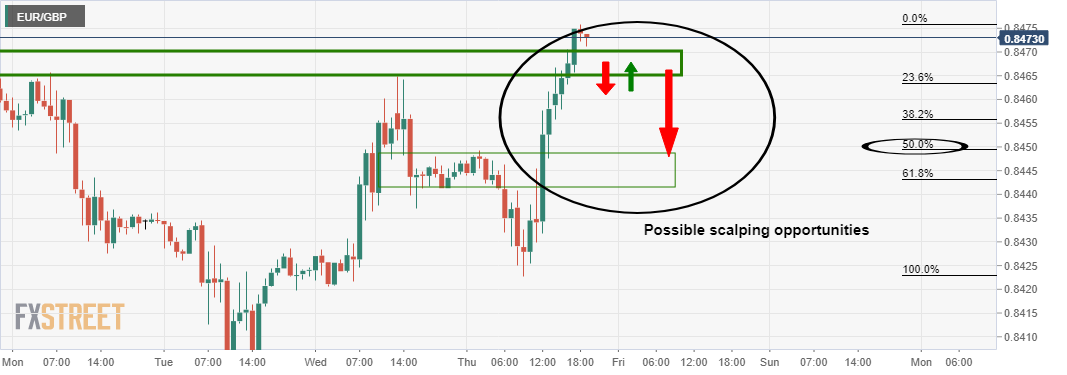
The 50% mean reversion target aligns well with the structure looking left from the current price. bears will likely look to engage once the current support is broken, looking for bearish structure and favourable momentum.
-
20:38
Forex Today: Dollar’s selling spiral may continue on Friday
What you need to know on Friday, October 29:
The dollar tumbled after two first-tier events, ending the day sharply lower across the FX board. The preliminary estimate of Q3 Gross Domestic Product was up a modest 2%, missing expectations. Wall Street recovered from Wednesday’s slump, as poor growth hints at less aggressive financial tightening.
The European Central Bank left its monetary policy unchanged as anticipated. The statement was pretty much a copy of the previous meeting, with policymakers pledging to maintain financial support for as long as needed and repeating that inflation will soon recede from the current 13-year high.
Among other things, President Christine Lagarde said that the PEPP will likely end on March 2020, as originally planned, but added that no rate hikes are to be expected throughout 2022. “What comes next, we will discuss in December,” she said. About inflation, she blamed it on higher energy prices and supply chain issues, but those able to read between lines noted that she and her colleges are more concerned than what they showed.
Brexit jitters returned. France detained a UK boat and another has been fined, amid an escalating row over fishing rights. The British government summoned France's ambassador to clarify the situation.
The EUR/USD pair flirted with the 1.1700 level, now hovering in the 1.1680 price zone. GBP/USD met sellers around 1.3800, with Brexit headlines capping the advance.
Commodity-currencies gained traction, with AUD/USD reaching its highest since early July. CAD gains were tepid, as oil prices remain subdued.
Gold struggled to overcome the 1,800 level despite the broad dollar’s weakness, settling at $1,798 a troy ounce. WTI ended the day at $82.80 a barrel.
Top 3 Price Prediction Bitcoin, Ethereum, Ripple: Cryptos slow down while bulls defend the uptrend
Like this article? Help us with some feedback by answering this survey:
Rate this content -
20:38
GBP/JPY struggles at 156.50 amid risk-on market sentiment, after BoJ meeting
- The British pound recovered from Wednesday’s losses, but the upside move was capped due to a lack of follow-through.
- The market sentiment is upbeat, boosting risk-sensitive currencies except for the GBP.
- GBP/JPY: Tilted to the upside from a technical perspective, but price action reflects exhaustion in the recent upside move.
The GBP/JPY edges up during the New York session, trading at 156.55, up 0.07% at the time of writing. Positive market sentiment surrounds the financial markets, with US stock indices rising between 0.37% and almost 1%. Furthermore, bond yields are rising during the day as more central banks become aware that the “transitory” thesis appears to wane.
On the subject mentioned above, the European Central Bank (ECB) President Christine Lagarde said that higher inflation might be around for longer than expected. However, the bank estimates prices will start moderating in 2022.
On Thursday, earlier in the Asian session, the Bank of Japan (BoJ) held its monetary policy decision. The BoJ kept interest rates at -0.10% as expected while maintaining the Yield Curve Control (YCC) in an 8-1 vote, with member Kataoka dissenting on the subject.
There was no follow-through to the BoJ announcement as most Japanese yen pairs remained at familiar levels.
On Friday, the Japanese economic docket will feature the Tokyo Consumer Price Index figures. Furthermore, employment figures with the Jobs / Applicants Ratio and Unemployment Rate will offer some insights to GBP/JPY traders about the Japanese economy.
GBP/JPY Price Forecast: Technical Outlook
Weekly chart
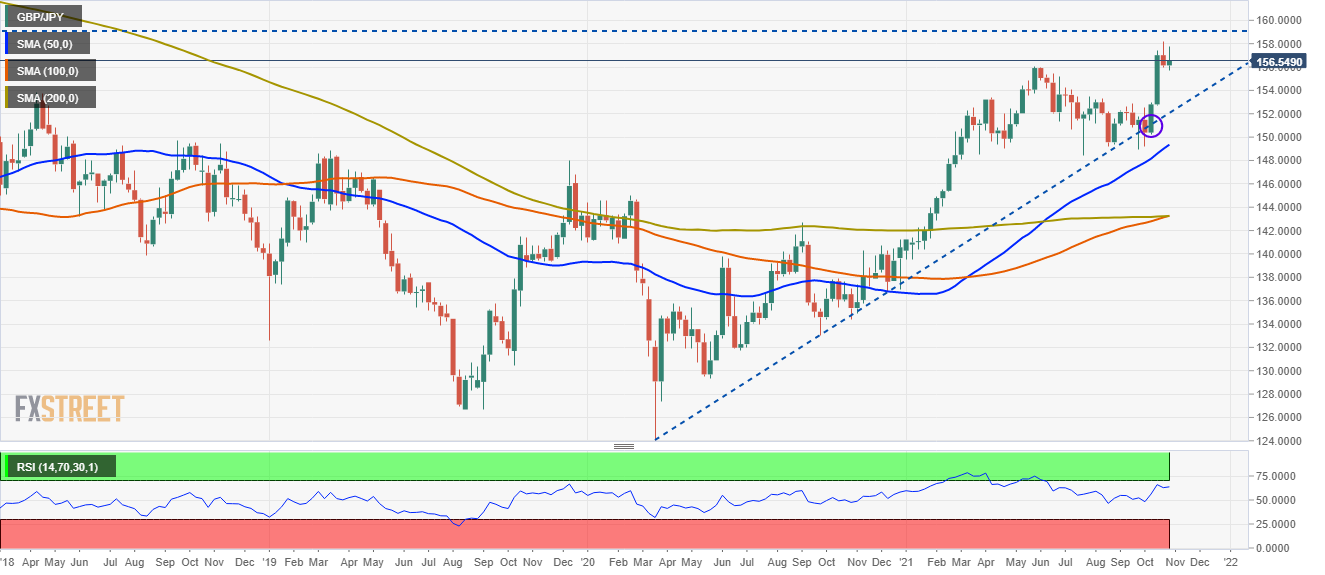
The weekly chart depicts the GBP/JPY pair is in a solid upward trend portrayed by rising slope weekly simple moving averages (WSMA’s) located beneath the spot price, alongside a test of the February 2, 2018, resistance level at 156.61. Since July, the cross-currency has appreciated 6.50%, and the 100-WSMA is just crossing over the 200-WSMA, adding another bullish sign to the previously mentioned hints.
Furthermore, an upward slope trendline that travels from March 2020 lows under September 2020 lows was unsuccessfully tested by the GBP/JPY pair, which bounced off at 150.00, rallying over 700 pips until finally settling at current levels.
Hence, the pair could be headed towards the upside. However, the lack of recent price action above the 156.00 threshold leaves June 24, 2016, swing highs around 159.20 as the next resistance level.
-
20:02
EUR/USD consolidates near 1.1700 as the US dollar tumbles
- The euro rallies towards 1.1700 against a weaker US dollar.
- The greenback tumbles as US GDP data disappoints.
- EUR/USD rally to 1.1680 expected to be short-lived – TDS.
The euro has surged about 0.75% against the US dollar so far today to post its strongest daily performance over the last months. The pair accelerated its recovery from week lows at 1.1580 area, to consolidate a few pips shy of 1.1700, favored by broad-based USD weakness.
The dollar dives on downbeat US GDP data
The US dollar has tumbled on Thursday, hammered by the disappointing Gross Domestic Product figures released by the US Commerce Department. According to advanced estimations, US economic growth decelerated to a 2% pace in the third quarter, from 6%, even below the 2.7% pace expected. Supply chain restrictions and a sharp decline in consumer spending have been singled out as the main reasons behind the economic slowdown.
The third quarter’s data represents the weakest performance since the second quarter of 2020, with economic activity hampered by the first COVID-19 restrictions, and have crushed hopes of a strong post-pandemic recovery.
Furthermore, the impact of the dovish European Central Bank’s monetary policy statement on the euro has been muted. The ECB has stuck to the plan, with President, Christine Lagarde pushing rate hike hopes back to, at least, late 2022, as, according to the Bank, inflationary pressures will decline in the course of next year.
EUR/USD rally is expected to be short-lived – TDS
FX Analysts at TD Securities, contemplate the current euro recovery as a corrective reaction with a limited scope: “We think that there is some risk of EUR/USD testing 1.1680 resistance, but extrapolating beyond that seems like a big ask a week ahead of the Fed's meeting where tapering will be announced (…) As much as we think there is scope to test 1.1680 resistance, this should be short-lived.”
Technical levels to watch
-
19:53
Gold Price Forecast: Bulls break the 200-day EMA, eye $1,830s
- Gold is trying to move through the 200-day EMA as the US dollar drops.
- ECB sound the inflation concerns which sends EUR higher across the board.
- US rates and DXY are in focus while US GDP disappoints and easy growth is in the rear-view mirror.
The price of gold has been rising across the daily trendline support and taking on the 200-day EMA. The upside in gold is lacking conviction as it struggles to take off despite the intensifying concerns about global inflation.
At the time of writing, XAU/USD is trading around $1,801.50. Gold has travelled between a low of $1,792.42 and $1,810.50 on a volatile day in the forex space which has taken the greenback lower, supporting gold.
The volatility came in a busy day of central bank-driven activity this week that started in Australia (Inflation came in hot), Japan (bucking the inflation trend) and then Europe and precedes a meeting of the US Federal Reserve next week.
"The market is very much triggered and sensitive to inflation worries and this notion that central banks are behind the curve," said Mazen Issa, senior currency strategist at TD Securities. A contributing factor to the volatility, Issa said, is the approaching end of the month when more investment managers rebalance their portfolios across currencies.
The key focus was with the European Central Bank. The outcome of the meeting on Thursday sent the euro rising sharply against the US dollar. Markets are trying to sort through moves in the interest rate markets and comments by the European Central Bank President Christine Lagarde.
Prior to her presser, the euro moved little as the ECB, as expected, kept policy unchanged, reaffirming its plan to keep buying bonds and hold down interest rates for years to come. However, Lagarde's comments were taken as less dovish for the concerns that inflation was not as transitory as first thought.
The ECB still sees the period of higher inflation as transitory but has become much more balanced with its inflation analysis, paving the way for further asset purchase reductions in December. Lagarde preempted parts of the ECB’s December debate by announcing that she expected the Pandemic Emergency Purchase Programme (PEPP) to end as planned in March next year.
US dollar sent packing
DXY has dropped to 93.278 on the day from a high of 93.969 which has seen a spike in the daily ATR and a test of the daily trendline support.
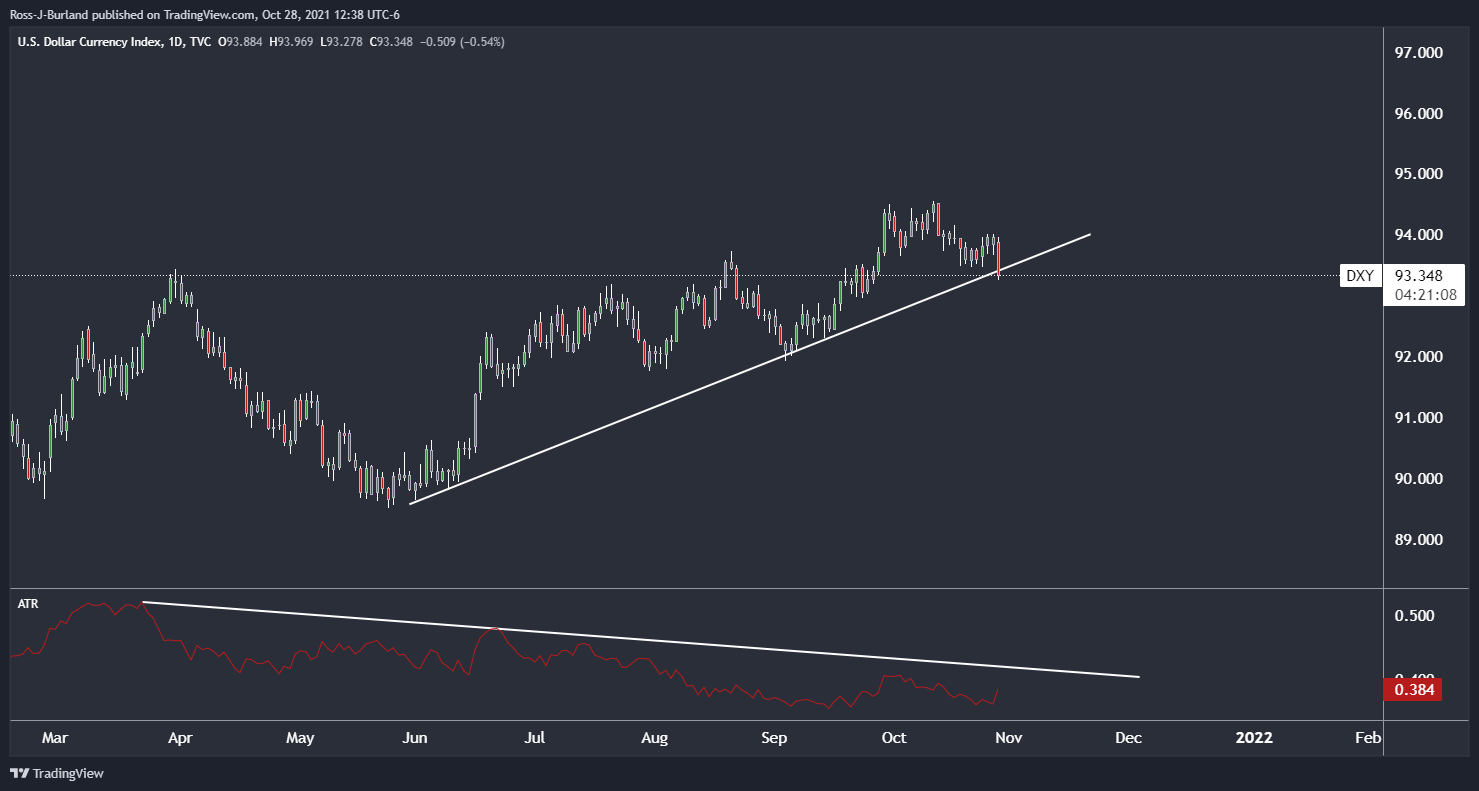
US yields are helping to support the greenback off the lows of the day. However, if the 10-year fails to reclaim territory back within the ascending trend, as marked by the daily counter-trendline, then the downside is more probable. A Head & Shoulders could be in the making here:

US GDP decelerates
Meanwhile, US Gross Domestic Product growth decelerated to 2.0% in Q3 from 6.7% in Q2. A large part of the slowing in US GDP growth in the third quarter can be attributed to supply chain disruptions limiting the availability of products for purchase.
The economy is expected to grow more quickly in the fourth quarter. ''Still, it looks increasingly likely that much of the 'easy' growth to be had from the re-opening of the economy is in the rear-view mirror, and further gains will be harder to come by,'' analysts at RBC Economics said. ''We look for GDP to increase at a stronger 4.5% annualized pace in Q4.''
Precious metals gear up for a breakout
Analysts at TD Securities have explained that the price action in precious metals has been building towards a breakout.
''While the yellow metal is dramatically underperforming against the sharp slump in real rates, it is holding firm against market pricing for more than 2 Fed hikes by year-end 2022.''
''The aggressive central bank pricing has reverberated across global bond curves as Treasuries price in the first hike in July 2022 and a 90% chance of a hike in June, despite the fact that tapering is on course to only ending by June.''
''The hunt for inflation protection should continue to prop up interest in the yellow metal as real rates sink. Reasons to own the yellow metal are growing more compelling as Fed pricing is likely to unwind in the coming months as a US fiscal drag starts to weigh on growth data.''
Gold technical analysis
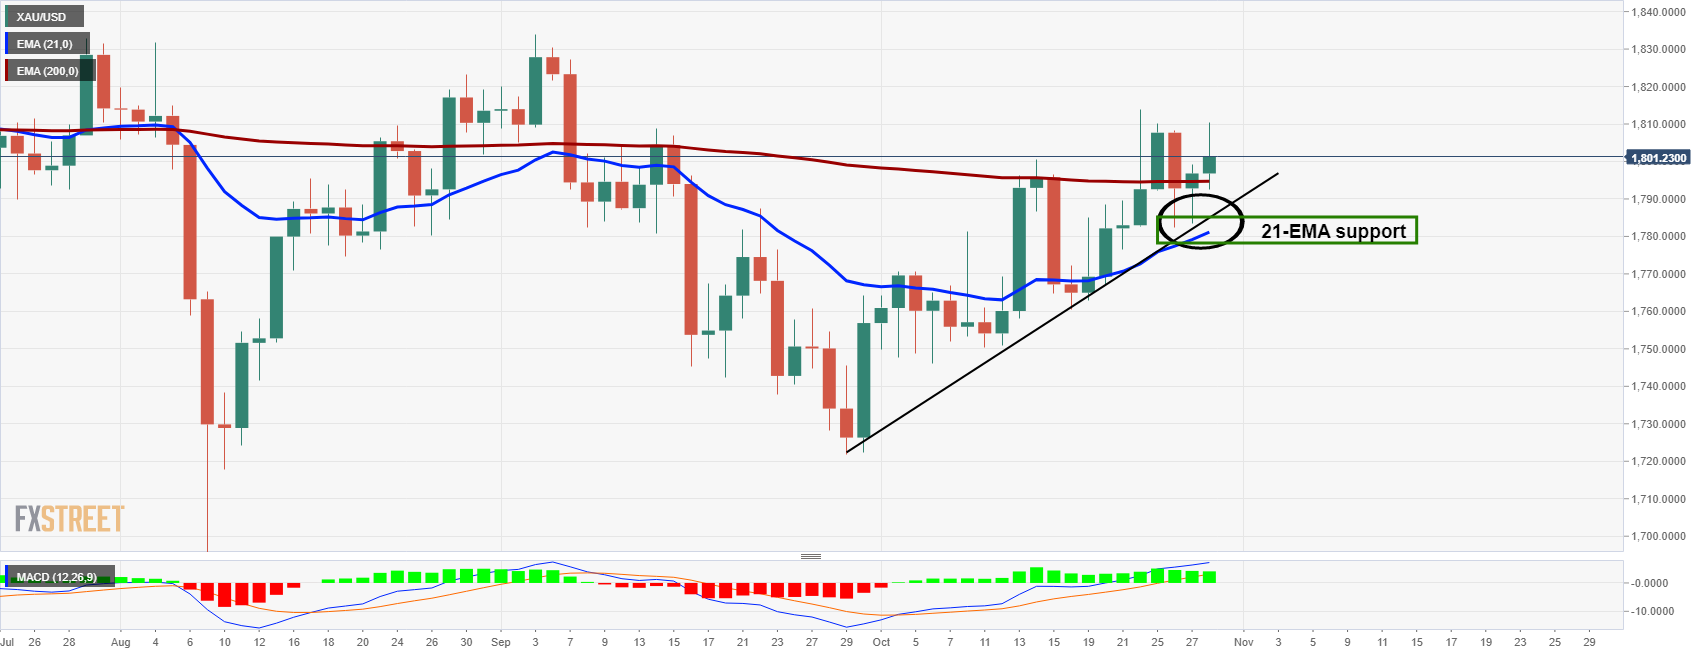
The bulls are breaking the 200-day EMA and riding the dynamic support that was reinforced by the 21-day EMA. The upside is more probable with a run towards $1,830 in prospect.
-
19:34
Brexit saga continues and risk for GBP amount as traders brace for major clash
A series of troublesome Brexit headlines have emerged in what has already been a volatile day in the forex space owing to the sensitivity to inflation worries and this notion that central banks are behind the curve.
With that aside, however, specifically for the pound, ''Britain has begun preparations for a major clash with the EU by activating a key government committee to look at the fallout from suspending cooperation over Northern Ireland,'' Sky News has learnt and reported today.
''Ministers are holding discussions inside the key cabinet committee, which oversaw Brexit fallout preparations, about the repercussions of triggering Article 16, which allows the UK to stop following some parts of the Northern Ireland Protocol.''
''The discussions on the practical implications of triggering the emergency mechanism in the Northern Ireland Protocol are being held in the "XO" cabinet committee, a pivotal institution inside government last year during Brexit talks when facing the threat of no-deal," the article said.
In other news and related to the fallout, Britain said it had summoned France's ambassador in an escalating row over post-Brexit fishing rights.
"We regret the confrontational language that has been consistently used by the French government on this issue," said a statement from British Prime Minister Boris Johnson's office.
It added: "As a next step, the Foreign Secretary has instructed Minister Morton to summon the French ambassador."
The BBC wrote that ''Britain earlier denounced France's seizure of a British boat in French waters and warned Paris against further retaliation.''
The article continued, ''A British trawler has been seized by France and another has been fined, amid an escalating row over post-Brexit fishing rights.
French maritime minister Annick Girardin said the ships were cautioned during checks off Le Havre overnight.
She said the first did not comply right away and the second was not allowed to fish in French waters so was detained.
No 10 said it was watching events closely and wanted France and EU talks but was ready to respond appropriately.
Earlier, the environment secretary said he was "urgently" investigating the situation in relation to the detained vessel - which has been named as the Cornelis Gert Jan.''
Market implications
It is well telegraphed that there are sticky and messy parts up in the air in the Brexit saga, most of which is likely already priced in, however, background stories and feelings of trouble escalation in the fall-out will leave the pound vulnerable. meanwhile, the markets are more aligned to what is happening between the central banks.
Sterling firmed a touch on Thursday against the euro and the dollar as investors assessed whether the Bank of England would proceed with an interest rate hike at the upcoming meetings or hold fire, given concerns around economic growth. Markets are pricing a chunky 34 cumulative bps in rate hikes rise from the BoE by year-end. GBP/USD is higher by some 0.4% on the day wheel EUR/GBP is also 0.4% higher following the ECB's emphasis on inflation pressures.
-
19:10
USD/CHF accelerates its downtrend and approaches 0.9100
- US dollar breaks below 0.9160 and nears 0.9100.
- Weak US economic growth figures hurt the USD.
- USD/CHF: Breach of 0.9160 support has increased downward momentum.
The US dollar has accelerated its reversal from week highs at 0.9225 on Tuesday, breaking below 0.9150 to reach fresh seven-week lows at 0.9120 so far.
Weak US data pulls the dollar further down
The greenback broke below intra-day support at 0.9160/70, hammered by the release of weaker than expected US Gross Domestic Product data. According to advanced estimations, the US economy decelerated to a 2% pace in the third quarter, from 6% in the second, even below the already slower 2.7% pace expected. Supply chain restrictions and a sharp decline in consumer spending have curbed economic growth.
These figures represent the weakest performance since the second quarter of 2020, when the first COVID-19 restrictions hit the US economy, and have crushed hopes of a strong post-pandemic recovery.
The upbeat quarterly earnings by Caterpillar and Merck released today, which helped US stock markets to pick up after a post-GDP dive, have failed to lift the US dollar, which remains sold across the board. The US Dollar Index has dropped 0.6% on the day to reach levels below 93.50 for the first time in the last four weeks.
USD/CHF: Break of 0.9150 support increases negative momentum
The pair has broken below at 0.9150 (October 22 and 24 lows) earlier today, which has increased bearish pressure. With technical indicators turning down, the next potential support levels are 0.9100 (August 18 and 30 lows) and then August 4 low at 0.9020 ahead of June lows at 0.8925.
On the upside, the pair should regain the mentioned 0.9050 and 0.9225 (October 26 high) to ease negative pressure and set its aim towards October 18 high at 0.9275.
Technical levels to watch
-
19:05
Silver Price Forecast: XAG/USD stalls around $24.20 as US T-bond yields rise
- Silver pares some weekly losses, clings to $24.00.
- An upbeat market sentiment dented investors' appetite for safe-haven assets.
- XAG/USD: The 1-hour chart depicts the white-metal is range-bound with no clear direction.
Silver (XAG/USD) trims its weekly losses, trading at $24.04 is barely up 0.04% during the New York session at the time of writing. Since Friday of last week, the yellow metal had struggled when it reached a new monthly high at $24.80. However, this week has failed to gain traction against the US Dollar, despite falling US T-bond yields.
Also, positive market sentiment has weighed on precious metals, not just silver. Investors seem to be moving flows towards riskier assets, as portrayed by US stock indices rising between 0.51% and 0.92% in the session. Moreover, US T-bond yields came back to the front seat on Thursday, with the 10-year benchmark note rising four basis points, sitting at 1.573%, weighing on the non-yielding metal.
That said, silver dynamics are lying in the dynamics of the US Dollar. In the next week, the Federal Reserve will host its November meeting. Market participants expect a bond taper announcement and the pace of it. Also, investors will keep a close eye on when it will begin the QE's reduction.
If it moves back to mid-December, it could signal that the Federal Reserve doubts so that a delay will give them more certainty in the future outlook. In that outcome, silver prices would rise in tandem with gold and other precious metals. On the flip side, the market has already priced in a bond taper to begin in mid-November.
XAG/USD Price Forecast: Technical outlook
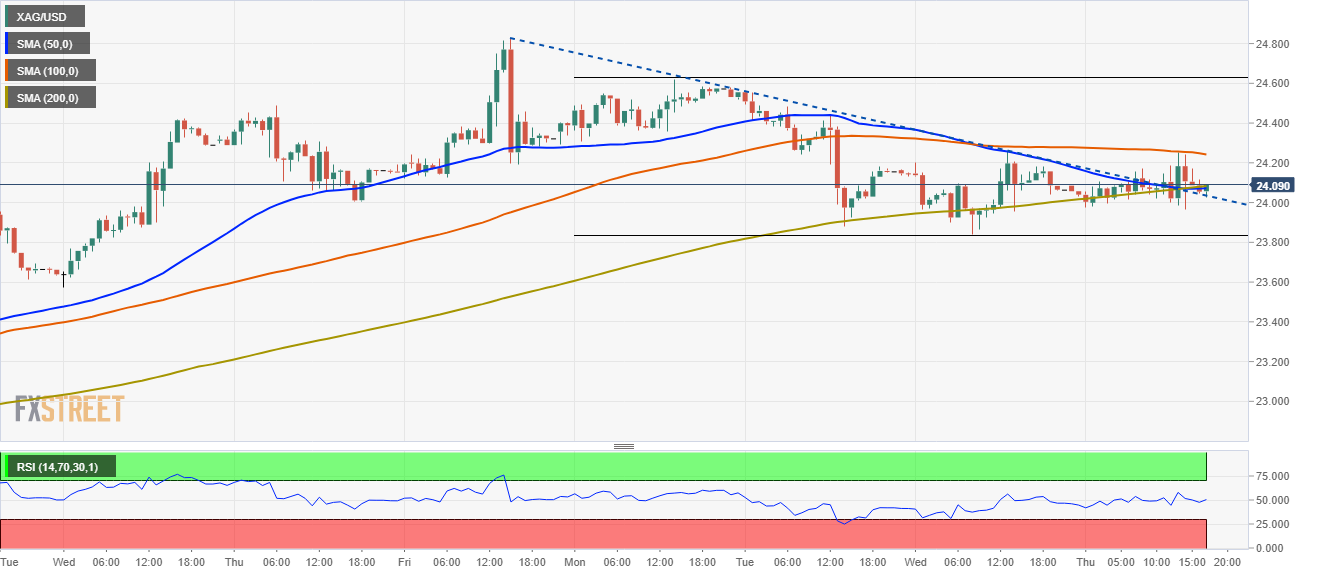
Silver (XAG/USD) 1-hour chart depicts, the white metal is range-bound, trapped inside the hourly simple moving averages (HSMA's). However, it is slightly tilted to the upside, as a broken downslope trendline triggered a bullish signal. It also confluences with the 200-hour simple moving average (HSMA), which could propel XAG/USD toward higher prices.
The Relative Strength Index (RSI) is at 49, a tick lower than the 50-midline, aims slightly up, but it does not have enough momentum to spur an upside move in silver.
Therefore, silver traders could wait until a fresh catalyst could give additional clues about the non-yielding metal's direction.
-
18:17
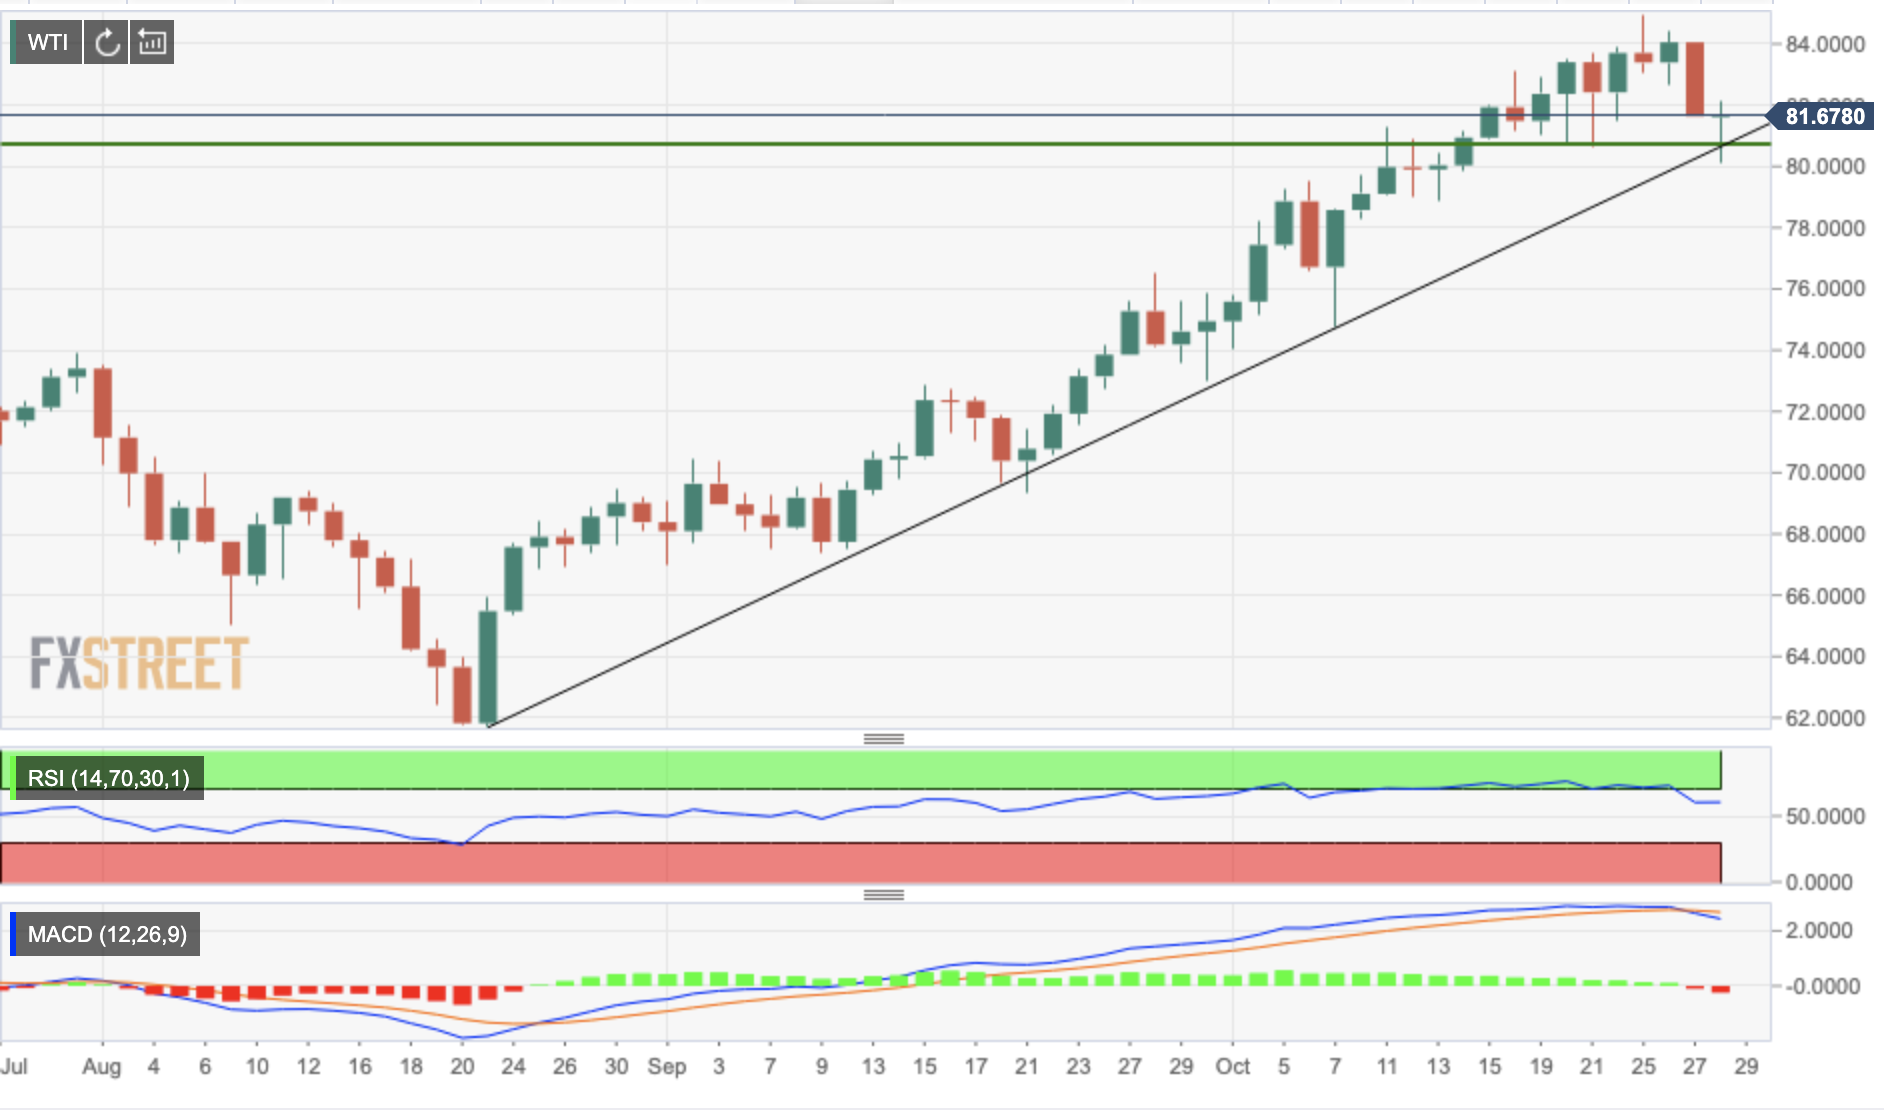
WTI prices pick up from two-week lows and return above $82.00
- WTI oil reversal from $84.95 extends below $82.00
- Higher US stocks, Iran cools off oil rally.
- WTI testing important support at $80.80.
Front-month WTI prices have picked up from day lows below $81.00, returning above $82.00 after having hit two-week lows below $81.00 earlier on Thursday.
Oil rally falters on US Stocks and nuclear talks with Iran
Crude prices have retreated about 3% over the last two days, weighed by an unexpected increase in stocks reported by the US Energy Information Administration on Wednesday. According to the EIA, commercial oil inventories increased by 4.3 million barrels last week, beating expectations of a 1.91 million barrel increase and easing fears about an energy crunch this winter.
Furthermore, rumors suggesting that Iran is ready to resume nuclear talks with the US and other global powers, which had been suspended before the Iranian elections, have contributed to cooling off oil’s rally. A tweet by one of Iran’s top negotiators, Al Bagheri Khani, stating that the Iranian authorities would agree to “start negotiations before the end of November” has boosted expectations of Iranian crude returning to the markets, which might have prompted some investors to close long positions.
Finally, Russian President Vladimir Putin assured that he is ready to start increasing gas supplies to Europe once Russian storages are full or, in any case, by November 8. This has triggered declines in gas prices, weighing further on oil futures.
WTI crude, testing an important support level at $80.60/70
WTI prices have picked up from session lows at $80.15 to return to the mid-range of $81.00 at the moment of writing. Oil futures, however, remain dangerously close to an important support level at $80.60/70, where the uptrend resistance line from late-August lows meets October 20 and 21 lows.
With technical indicators starting to point lower on daily and hourly charts, a confirmation below here might increase bearish pressure, sending prices towards $80.00 psychological level and October 13 low at 78.90.
On the upside, immediate resistance lies at intra-day highs, $82.15 and above here, October 27 high at 84.00 ahead of the $84.95 multi-year high.
WTI daily chart
Technical levels to watch
-
18:07
United States 7-Year Note Auction increased to 1.461% from previous 1.332%
-
17:51
AUD/USD struggles at 0.7550 amid risk-on market sentiment
- AUD/USD advances in the session, despite rising US T- bond yields.
- The US dollar weakens, weighed on by a slower rise in Q3 GDP.
- US Initial Jobless Claims rose to 281K, less than the 290K expected, improving for the third consecutive week.
The AUD/USD edges higher during the New York session, up 0.50%, trading at 0.7554 at the time of writing. Since Tuesday, the pair remained trapped around the 0.7490-0.7535 area, failing to gain traction either way. However, worse than expected US GDP figures for the third quarter spurred a sell-off of the greenback
In the Asian session, the AUD/USD traded near the daily lows, around 0.7480, due mainly to a mild risk-off environment. Investors ignored a tad that Australian inflationary figures rose sharply to the upside on Wednesday, increasing market participants’ bets of a possible rate hike by the Reserve Bank of Australia.
However, a slower than expected US economic growth boosted the AUD/USD pair, coupled with an upbeat market sentiment portrayed by US stocks edging higher, propelled the AUD/USD reaching a daily high at 0.7555.
In the meantime, the US Dollar Index, which measures the greenback’s performance, collapses 0.6%, down to 93.30, despite rising US T-bond yields with the 10-year benchmark note up to three basis points, sitting at 1.561%.
US Gross Domestic Product for Q3 expanded by 2%, worse than the 2.7% foreseen, the US dollar weakens
On the macroeconomic front, the US Gross Domestic Product for Q3 increased by 2%, lower than the 2.7% estimated by analysts. Moreover, the Federal Reserve’s favorite measure of inflation, the Personal Consumption Expenditure, remained high, expanding by 4.5% in the Q3, after a 6.1% bounce in the prior three months.
Nevertheless, there was a positive in the day. The US Initial Jobless Claims rose to 281K, lower than the 290K expected by analysts, dropping for the third consecutive week. Despite recent disappointments on the US Nonfarm Payrolls report, the labor market shows some signs of coming back to life.
Meanwhile, US Home Pending Home sales declined by 2.3% for September on a monthly basis, following the August reading that witnessed an increase of 8.31%, as reported by the US National Association of Realtors
AUD/USD Price Forecast: Technical outlook
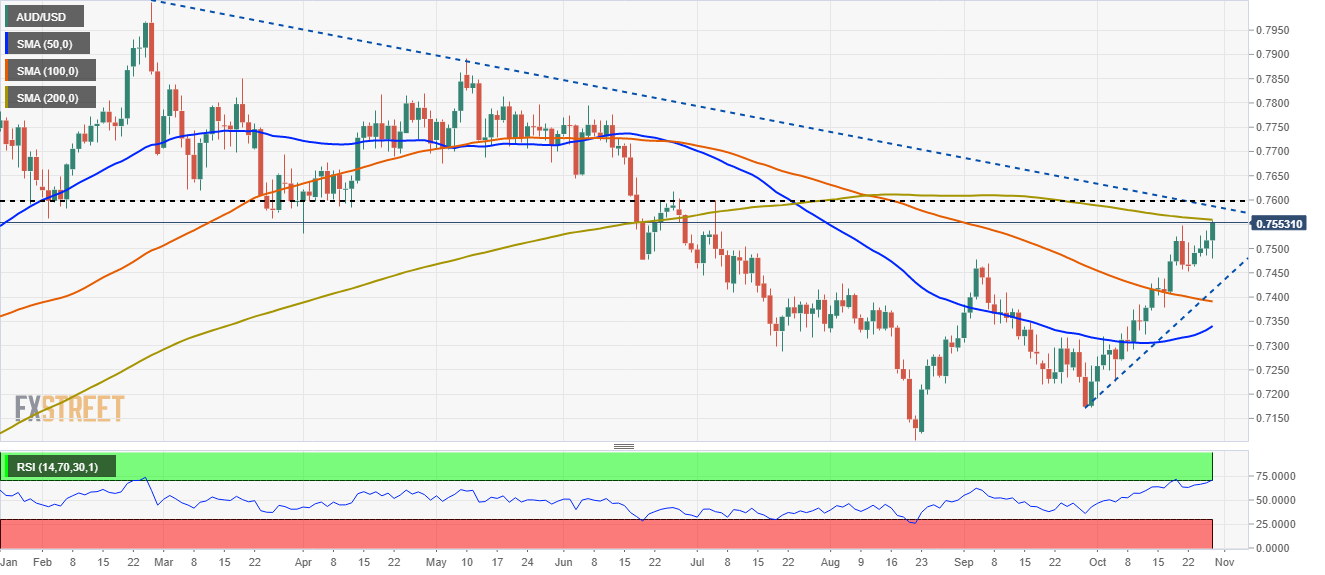
The daily chart depicts the AUD/USD has printed an upside break above 0.7550 but is facing strong resistance, at the 200-day moving average (DMA), which lies at 0.7560. The Relative Strength Index (RSI), a momentum indicator is at 71 inside overbought levels, coupled with the 200-DMA, could potentially exert downward pressure on the pair, so it is worth notice for AUD/USD traders.
Nevertheless, a daily close above the latter could open the way for 0.7600, that confluences with a six-month downslope falling trendline, that would oppose strong resistance.
Therefore, an upside break is on the cards, but caution is warranted as signals of potential price exhaustion lie ahead.
-
17:28
USD/JPY's decline extends to two-week lows at 113.25
- The dollar retreats further from the 114.75top, approaching 113.00.
- Weak GDP figures hit the USD.
- USD/JPY is expected to decline towards 112.00 – Rabobank.
The dollar maintains its weak tone against the Japanese yen on Thursday, extending its reversal from multi-year highs at 114.75 reached last week. The pair has to fresh two-week lows below the mid-range of 113.00 following weaker than expected US macroeconomic figures.
US dollar dives after weak GDP data
The greenback has dropped across the board following a softer than expected US Gros Domestic Product report. According to advanced figures released by the Commerce Department, US economic growth slowed down to a 2% annual rate in the third quarter, from 6% in the previous one, well below an already slower 2.7% reading expected by the market.
These figures have dampened expectations of a strong post-pandemic recovery showing evidence that the disruptions in the supply chain and shortages of raw materials are holding companies from meeting the growing demand.
The dovish monetary policy statement by the Bank of Japan has failed to offer any significant support to the USD either. The central bank has reaffirmed the commitment with its ultra-expansive monetary policy, as widely expected, keeping interest rates near zero, and while downgrading their economic growth and consumer inflation forecasts for 2021.
USD/JPY expected slide towards 112.00 in the next three months – Rabobank
From a wider perspective, FX Analysts at Rabobank expect the USD to extend its reversal towards 112.00: observe the pair in a consolidation phase, ahead of further appreciation: “This may be a warning to the market that in view of the inflationary implications the BoJ is not entirely happy with the JPY’s position at the worst-performing G10 currency in the year to date. This signal may be sufficient to limit upside potential for USD/JPY near-term, particularly since the weakness of US Q3 GDP data has also undermined the greenback today. We retain a 3 month USD/JPY forecast of 112.”
Technical levels to watch
-
17:08
US: Growth will rebound, albeit not to the pace seen earlier – Wells Fargo
Data released on Thursday showed the US economy grew at a 2% rate (annualized) during the third quarter, below the 2.7% of market consensus. Analysts at Wells Fargo expected the economy to rebound during the fourth quarter, but not to the pace seen earlier in 2021.
Key Quotes:
“Real GDP grew only 2.0% at an annualized rate in the third quarter, which marked a significant downshift from the rate of growth that the economy posted in the first half of the year. Supply chain constraints, which are causing many prices to rise sharply and making many goods simply unavailable, were evident in the underlying details. The only saving grace was that inventories did not decline as much in the third quarter as they did in Q2. Without that positive contribution from inventories, the U.S. economy would have essentially stalled in the third quarter.”
“We expect that growth will rebound, albeit not to the pace seen earlier this year, as supply chains become unglued. The need to re-stock empty shelves and continued resilience in consumer spending should underpin spending growth. But unblocking supply chains will take time. We look for the rate of consumer price inflation, which rose to a 31-year high in the third quarter, to slow next year. But we also do not think that it will recede all the way back to 2%, as some policymakers at the Federal Reserve expect.”
“We expect that the FOMC will look through the supply chain-induced increase in prices and not tighten monetary policy next year. However, we readily acknowledge the risk that higher-than-expected inflation could force the FOMC's hand next year.”
-
16:57
ECB says inflation surge is transitory, but markets doubt it – Danske Bank
On Thursday, the European Central Bank, as expected left its monetary policy stand unchanged. Analysts at Danske Bank point out the meeting ended with no new decisions or a signal about the decisions that are to be taken at the December meeting.
Key Quotes:
“We are of the view that ECB do not expect to hike rates in the foreseeable future given ECB transitory inflation narrative. Whether this new found data dependence will last remains unknown. In any case, if inflation proves longer-lasting, the comments today makes us less confident that ECB would not change policy rates eventually.”
“While inflation is expected to stay high in the near-term (lasting a bit longer than previously expected), ECB still expects inflation pressures to ease again over the course of next year.”
“With Spanish and German CPI inflation surging to the highest level since the 1990s in October and price expectations still adjusting upwards across sectors, markets are increasingly discounting ECB’s temporary inflation narrative.”
“Despite Lagarde’s very dovish signals and overall appearance, EUR/USD followed the rates market higher. In our view, this is likely a temporary correlation and likely to soon be replaced by more downside risk as the European economy underwhelms amid inflation surprises. We do not generally see much of a link between spot EUR/USD and rising expectations towards euro area interest rates.”
-
16:51
USD/JPY: Forecast remains for a slide to 112 in 3M – Rabobank
At this week meeting, the Bank of Japan reiterated its ultra-easing monetary policy stance and reduced both growth and inflation forecasts. Although USD/JPY has backed away from its recent highs in the 114.70 area, interest rate differentials have left the currency pair elevated, explained analysts at Rabobank.
Key Quotes:
“The Bank has described that it will be paying attention price risks. These include the possibility of pass-through of cost increases to selling prices and secondly to “future developments in foreign exchange rates and international commodity prices, as well as the extent to which such developments will spread to import prices and domestic prices”. While there was no suggesting as to what action the BoJ may take if these risks lead to inflation deviated from its central scenario, the BoJ did underline the risk the exchange rate/commodity price risk suggesting that this is being very closely watched.”
“This may be a warning to the market that in view of the inflationary implications the BoJ is not entirely happy with the JPY’s position at the worst performing G10 currency in the year to date. This signal may be sufficient to limit upside potential for USD/JPY near-term, particularly since the weakness of US Q3 GDP data has also undermined the greenback today. We retain a 3 month USD/JPY forecast of 112.”
-
16:45
USD/CAD approaches 1.2300 lows as the loonie builds up
- US dollar's recovery fails at 1.2380.
- Weak US GDP data has hurt the greenback.
- USD/CAD is expected to continue sliding towards 1.2208 – Credit Suisse.
The US dollar’s recovery attempt from Wednesday’s low at 1.2300 has been frustrated at 1.2380 and the pair turned lower against, retreating to 1.2330 against a somewhat firmer Canadian dollar.
The dollar dives after downbeat US GDP data
The greenback has accelerated its decline, following the release of disappointing Gross Domestic Product figures in the US. According to an estimate from the Commerce Department, the US economy slowed down to a 2% annual growth in the third quarter, from 6% in the second, hampered by supply chain disruptions and a slight increase of COVID-19 cases
These advanced figures have fallen short of the 2.7% growth forecasted by market analysts and actually represent the weakest performance since the second quarter of 2020 when the economic activity was hit by restrictions under the first COVID-19 wave.
On the other hand, the Canadian dollar has been showing muscle over the last sessions, buoyed by the hawkish monetary statement by the Bank of Canada. The BoC confirmed on Wednesday the end of their bond-buying program and hinted at an interest rate hike in the first half of next year, which pushed Canadian bond yields higher, ultimately increasing demand for the CAD.
USD/CAD to continue depreciating towards 1.2208 – Credit Suisse
From a wider perspective, FX Analysts at Credit Suisse contemplate further depreciation ahead: “We look for a break below the recent range low at 1.2287 for a move to 1.2252 next, with further retracement support just below here at 1.2208. This level is likely to prove a tough barrier in our view, however, we note that the next supports are seen at 1.2156/45.”
Technical levels to watch
-
16:33
United States 4-Week Bill Auction increased to 0.055% from previous 0.05%
-
16:26
EUR/USD extends gains and approaches 1.1700 as USD tumbles
- US dollar drops sharply versus its G10 rivals; DXY down by 0.58%.
- Euro among top performers holds to gains after ECB.
- EUR/USD heads for highest daily close in a month.
The EUR/USD broke a multi-day range to the upside and jumped toward 1.1700. Recently it printed a fresh monthly high at 1.1686 and remains near the top, with the bullish tone intact, supported by a decline of the US dollar across the board.
The decline of the greenback and technical factors are boosting EUR/USD further to the upside. The pair is trading at the highest level since late September, extending the recovery from 1.1523 (October 12 low).
After US data and ECB, focus starts to turn to FOMC
Economic data from the US showed mixed signs, with jobless claims (initial and continuing) falling more than expected to their lowest level since March 2020 and Q3 GDP data presenting a larger than forecast slowdown to 2% (consensus: 2.7%).
The European Central Bank, as expected kept its monetary policy unchanged. The next meeting will be more relevant, considering it will make decisions regarding QE programs.
“Despite Lagarde’s very dovish signals and overall appearance, EUR/USD followed the rates market higher. In our view, this is likely a temporary correlation and likely to soon be replaced by more downside risk as the European economy underwhelms amid inflation surprises”, warn analysts at Danske Bank.
The Federal Reserve will meet next week. At Danske, analysts see the Fed probably leaning more in to their hawkish views. “On net, we continue to forecast 1.10 in 12M EUR/USD.”
Technical levels
-
16:21
GBP/USD jumps on worse than expected US economic growth report, pierces 1.3800
- GBP/USD approaches 1.3800 on broad US dollar selling across the board.
- US economy slows its growing pace, but inflation keeps rising.
- Fed’s favorite inflation measure rose by 4.5%, lower than the 6.1% of the previous quarter.
The GBP/USD rises sharply during the New York session, above the 1.3800 figure, trading at 1.3803 at the time of writing. US mixed macroeconomic data trigger a dollar sell-off across the board. The US economy is growing slower than expected, contrary to rising inflation, showing no signs of peaking. The stagflation narrative clouds the market again.
During the Asian and European session, the GBP/USD seesawed near the bottoms of the day, around 1.3720, towards 1.3770, until stabilizing around current levels after the US GDP announcement.
US Q3 Gross Domestic Product grew 2% lower than the 2.7% estimated
An absent UK economic docket was no excuse for sterling to climb, helped by the risk-on market sentiment in the financial markets. Also, it got a boost due to the US Gross Domestic Product for the Q3, rising at a 2% pace, lower than the 2.7% estimated by analysts, leaving economists guessing if the bond-tapering announcement would spur a sharper US economic deceleration.
Further, the PCE, Fed’s favorite measure of inflation, remained elevated, increasing by 4.5% in the Q3, after a 6.1% bounce in the prior three months.
However, not everything is negative out of the US. The US Initial Jobless Claims rose to 281K, lower than the 290K expected by analysts, dropping for the third consecutive week. The labor market shows some signs of coming back to life, despite recent disappointments on the US Nonfarm Payrolls report.Meanwhile, US Home Pending Home sales declined by 2.3% for September on a monthly basis, following the August reading that witnessed an increase of 8.31%, as reported by the US National Association of Realtors
That said, investors’ focus shifts to the next week when the Federal Reserve and the Bank of England will reveal their monetary policy statements. The market expects a bond-tapering announcement by the Fed. Concerning the Bank of England, investors have priced in an 80% chance of a hike rate by the November meeting.
GBP/USD Price Forecast: Technical outlook
Daily chart
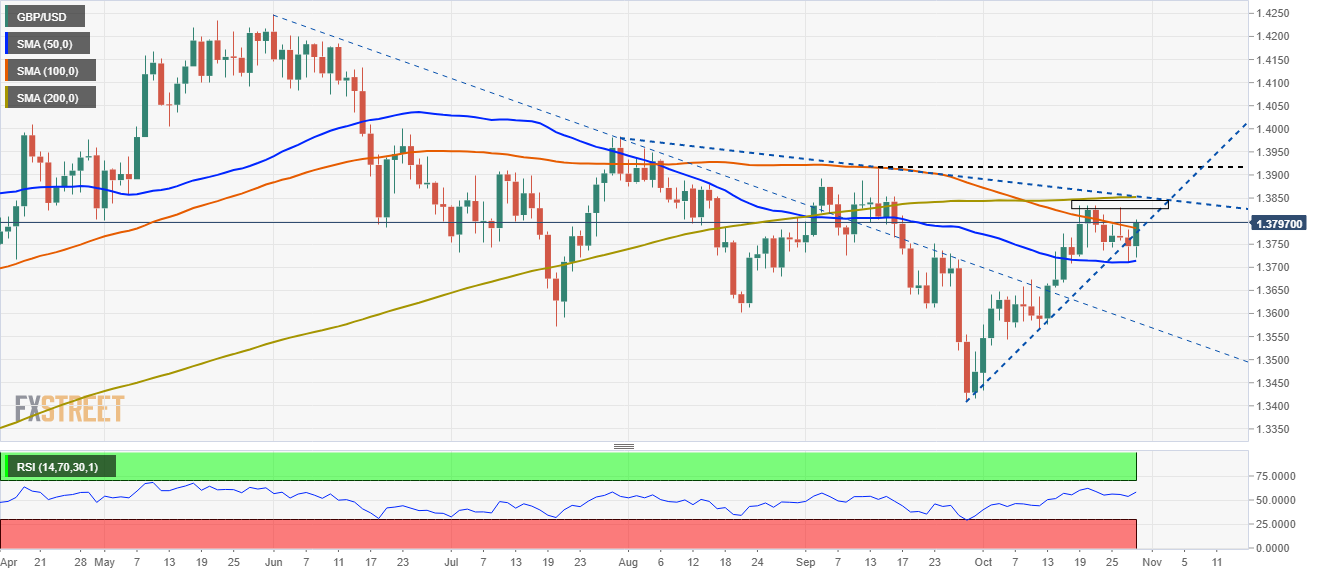
The GBP/USD has been trading within the 1.3700-1.3830 tight range in the last nine days, indicating no clear direction on the pair. The daily moving averages (DMA’s) act as support and resistance levels, as they remain trapped around the abovementioned area.
At press time, the spot price is above the 100-DMA lying at 1.3784, acting as support. Furthermore, a rising upslope trendline travels below the September 29 low towards the October 12 low, adding another support level for the GBP/USD. If it is broken, it would be a strong bearish signal for GBP/USD traders.
On the flip side, the pair would find strong resistance at 1.3800 and 1.3830. It is worth noting that the abovementioned level has been unsuccessfully tested four times, so GBP/USD traders should be aware of that. A break above 1.3830 would expose the 1.3900 as the next target for GBP/USD buyers.
-
16:01
United States Kansas Fed Manufacturing Activity came in at 25, above expectations (16) in October
-
15:47
Gold Price Forecast: XAU/USD revers sharply from $1810 and tumbles toward $1790
- Metals are unable to benefit from a sharp decline of the US dollar across the board.
- XAU/USD faces resistance at $1810 and fails to hold above $1800.
Gold dropped almost $20 during the last hour and turned negative for the day. XAU/USD jumped to $1810, reaching the highest level since last Friday and then it changed its direction falling toward $1790. It bottomed at $1792, and it is hovering around $1795, still looking for a direction.
The short-term trend still points to the upside in gold, but gains were capped again at $1810 and it is also showing difficulties holding above $1800, pointing to a lack of strength is moving higher. A key support is seen around $1785, an uptrend line that if broken could trigger more losses. On the upside, the key level is $1810.
The reversal in gold took place even amid a slide of the greenback across the board. The DXY trades at 93.39, down 0.50%, at the lowest level in a month. At the same time, the 10-year US yield is modestly higher.
Economic data from the US came in mixed. The preliminary reading of Q3 GDP showed an expansion at a 2% annualized rate, below the 2.7% expected. On the positive, jobless claims dropped more than expected to the lowest level since March 2020. The numbers are relevant ahead of next’s week FOMC meeting.
Technical levels
-
15:30
United States EIA Natural Gas Storage Change came in at 87B, above expectations (86B) in October 22
-
15:28
EUR/USD: Race higher towards 1.1680 to be short-lived – TDS
As expected, the European Central Bank (ECB) left its key policy measures on hold. President Lagarde noted that the impact of COVID-19 was fading and that the Governing Council spent most of its meeting discussing inflation. In the view of economists at TD Securities, EUR/USD is to test resistance near 1.1680 off the back of this.
Short-lived EUR pop
“As widely expected, the ECB had nothing on offer today and Lagarde reinforced that financing conditions will need to remain accommodative. And while they admit that inflationary forces will persist longer than expected, they remain confident – perhaps borderline arrogant – that price pressures will fade.”
“We think that there is some risk of EUR/USD testing 1.1680 resistance, but extrapolating beyond that seems like a big ask a week ahead of the Fed's meeting where tapering will be announced.”
“As much as we think there is scope to test 1.1680 resistance, this should be short-lived.”
“From a technical point of view, EURUSD momentum indicators suggest that price action is nearing fatigue above 1.16.”
-
15:08
US: Pending Home Sales decline by 2.3% in September vs. 0% expected
- Pending Home Sales in the US declined in September.
- US Dollar Index stays deep in the negative territory below 93.50.
Pending Home Sales in the US decreased by 2.3% on a monthly basis in September following August's sharp increase of 8.31, the data published by the US National Association of Realtors showed on Thursday. Investors were not expecting any changes.
Further details of the publication showed that, on a yearly basis, the change in Pending Home Sales was -8%, compared to the market expectation of -10.2%.
Market reaction
The greenback continues to weaken against its rivals during the American trading hours and the US Dollar Index was last seen losing 0.47% on a daily basis at 93.40.
-
15:00
United States Pending Home Sales (YoY) above expectations (-10.2%) in September: Actual (-8%)
-
15:00
United States Pending Home Sales (MoM) below forecasts (0%) in September: Actual (-2.3%)
-
14:58
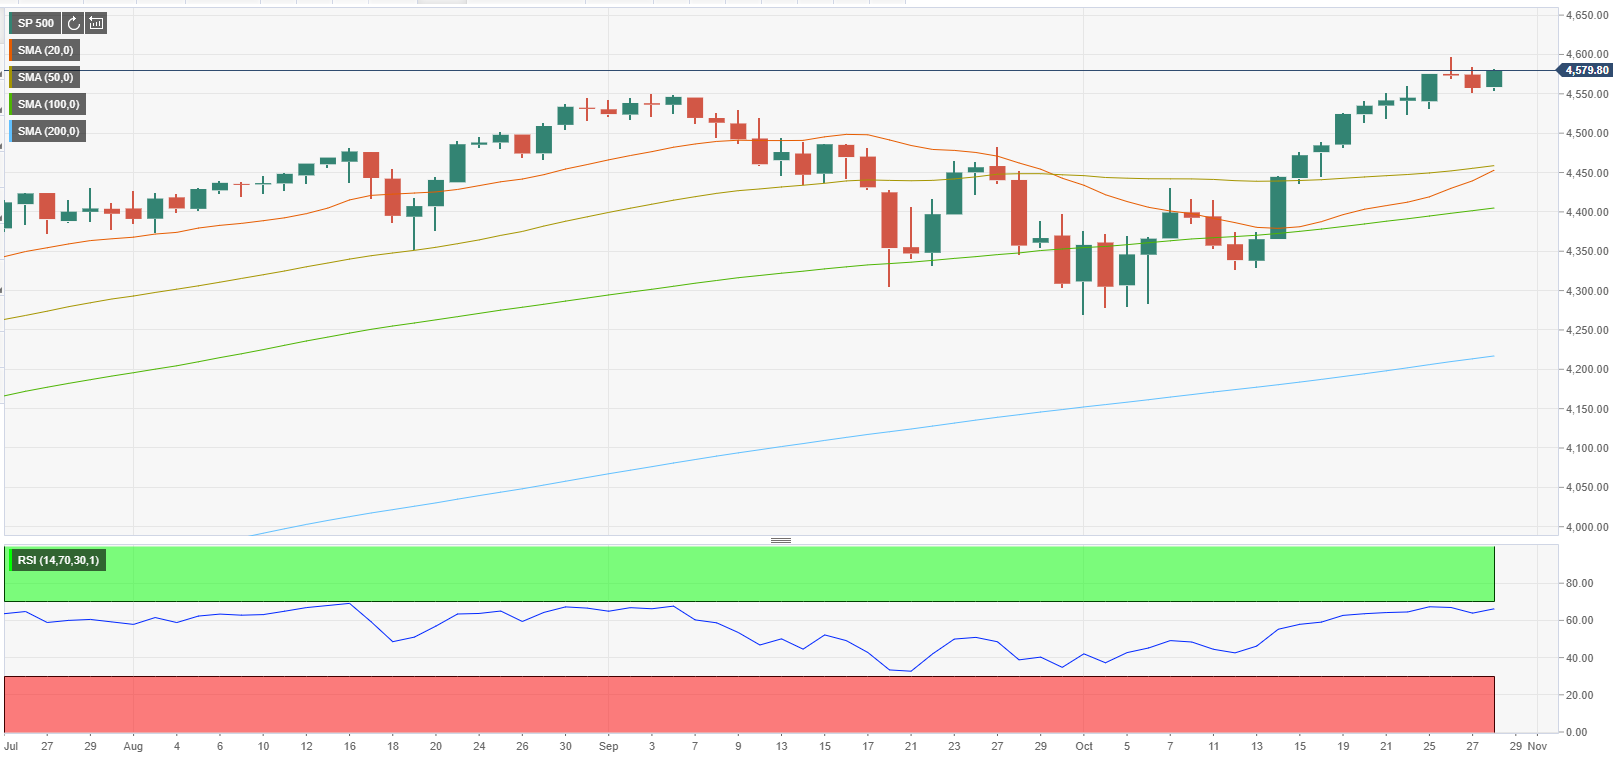
S&P 500 Index opens in the positive territory, closes in on all-time highs
- Wall Street's main indexes opened higher following Wednesday's slide.
- US economy grew at a softer pace than expected in Q3.
Following Wednesday's decline, major equity indexes in the US opened higher on Thursday despite disappointing growth data from the US. As of writing, the S&P 500 was up 0.6% on the day at 4,578, the Dow Jones Industrial Average was rising 0.5% at 35,664 and the Nasdaq Composite was gaining 0.66% at 15,337.
In its first estimate, the US Bureau of Economic Analysis said that the Real Gross Domestic Product expanded at an annualized rate of 2% in the third quarter. Although this reading came in lower than the market expectation of 2.7%, it doesn't seem to be having a negative impact on sentiment so far.
Among the 11 major S&P 500 sectors, the Real Estate Index is up 1% as the biggest gainer after the opening bell. On the other hand, the Communication Services Index is the only sector trading in the red, losing 0.15%.
S&P 500 chart (daily)
-
14:57
US Dollar Index drops to monthly lows around 93.50
- DXY loses the grip and recedes to the 93.50/45 band.
- Risk-on mood, steady US yields weigh on the dollar.
- Flash US Q3 GDP seen expanding 2.0% QoQ.
The US Dollar Index (DXY), which gauges the greenback vs. a bundle of its main competitors, accelerates the downside and challenges October lows near 93.50.
US Dollar Index looks supported near 93.50
The index extends the bearish note in the second half of the week and looks poised to challenge the area of decent contention in the mid-93.00s, where the monthly lows are located.
The dollar receded further following the steady activity in the US cash markets, where the flattening of the yield curve remains well in place. Indeed, yields in the front end surpassed the 0.56% level for the first time since March 2020, while longer-dated yields manage to marginally bounce off recent lows.
In addition, flash US GDP figures showed the economy is seen expanding at 2.0% QoQ in Q3 vs. expectations for a 2.7% expansion. On a brighter note, weekly Claims surpassed estimates at rose by 281K in the week to October 23.
Further weakness in the dollar came on the back of the firmer note in the euro after the ECB event.
US Dollar Index relevant levels
Now, the index is losing 0.40% at 93.48 and a break above 94.17 (weekly high Oct.18) would open the door to 94.56 (2021 high Oct.12) and then 94.74 (monthly high Sep.25 2020). On the flip side, the next down barrier emerges at 93.48 (monthly low October 28) followed by 93.31 (55-day SMA) and finally 92.98 (weekly low Sep.23).
-
14:37
GBP/USD to enjoy a gentle rise on a break above 1.38 – Scotiabank
GBP/USD gains marginally as Bank of England (BoE) hike pricing returns. Economists at Scotiabank see price action in the cable as marginally supportive and expect to see further gains on a break above 1.38.
GBP/USD to fall towards 1.36 on a break below 50-DMA at 1.3713
“After falling for three consecutive days, markets placed renewed bets on BoE tightening yesterday (likely as a consequence of the BoC’s hawkish announcement) which are continuing today to price in 17bps in hikes; December meeting OIS are pricing a similarly sized hike from November.”
“The 1.3770 area acted to limit further gains toward 1.38 that remains the key level to beat for the GBP to maintain its uptrend since early October.”
“The cable is being guided to the downside by its 50-day MA and to the topside by its 200-day MA (1.3713 and 1.3784, respectively), with a breach below the former and then the big figure leaving it at risk of declines to the 1.36 level.”
-
14:24
S&P 500 Index: Setback seen as corrective and temporary ahead of a move to 4750 – Credit Suisse
S&P 500 has extended its corrective setback and analysts at Credit Suisse see scope for slightly further near-term weakness. However this setback is very much seen as corrective ahead of a sustained break higher towards 4750 by year-end.
The current setback may extend slightly further
“The S&P 500 has reinforced its small bearish ‘shooting star’ candlestick reversal with a break below support from the recent small price gap at 4569/62, which suggests a short-term correction lower is underway, with supports seen at 4537, potentially 4524/20, but with fresh buyers expected again here for now.”
“Post this short-term setback, which we very much see as temporary and corrective, our core outlook stays higher.”
“A break above 4599/4604 is needed to reassert the prior strength for a move to the aforementioned 4622/25 ‘typical’ extreme. Although we look for a fresh pause here, above in due course can see resistance next at 4632, ahead of 4665/70, with 4750 our Q4 objective.”
-
14:22
EUR/USD probes tops above 1.1640 on Lagarde
- EUR/USD jumps to 3-day highs beyond 1.1640.
- The ECB sees inflation running hot for longer.
- Flash US Q3 GDP came at 2.0%; Claims rose by 281K.
The single currency manages well to keep the bid tone unchanged and pushes EUR/USD to fresh tops past the 1.1640 level on Thursday.
EUR/USD bid on Lagarde’s presser
EUR/USD gathers further traction as the press conference by Chairwoman Lagarde is under way on Thursday.
In fact, Lagarde said that the current phase of elevated inflation is expected to last longer than anticipated mainly due to the inability of supply to match the increasing demand. She noted that medium-term inflation is still below the bank’s 2% goal and admitted that elevated consumer prices will run hot for longer and are seen cooling down next year.
Still on the inflation issue, Lagarde said the ECB will be alert to the progress of wage inflation.
She once again reiterated that markets’ bets on a rates lift-off are not in line with the bank’s guidance.
On the data space, US flash Q3 GDP came short of estimates at 2.0% QoQ and weekly Claims rose by 281K.
EUR/USD levels to watch
So far, spot is losing 0.04% at 1.1597 and faces the next up barrier at 1.1669 (monthly high Oct.19) followed by 1.1699 (55-day SMA) and finally 1.1755 (weekly high Sep.22). On the other hand, a break below 1.1584 (weekly low Oct.26) would target 1.1571 (low Oct.18) en route to 1.1524 (2021 low Oct.12).
-
14:17
US Pres. Biden: I think we have enough votes for spending plan
US President Joe Biden told reporters on Thursday that he thinks they will have enough votes for his spending plan, as reported by Reuters.
Earlier in the day, the White House released the revised proposal of Biden's economic plan that will cost around $1.75 trillion.
Commenting on the proposal, progressive US Representative Pramilya Jayapal said that it is very difficult to make a decision without seeing the legislative text.
Market reaction
US stock index futures are up between 0.25% and 0.55%, pointing to a positive opening in Wall Street following these developments.
-
14:00
Russia Central Bank Reserves $ up to $621.6B from previous $620.3B
-
13:55
Lagarde speech: Market bets on rate hikes are not in line with guidance
Christine Lagarde, President of the Europen Central Bank (ECB), added to her earlier comments on the monetary policy outlook at the post-meeting press conference:
Key quotes:
- Market bets on rate hikes are not in line with guidance.
- Our analysis certainly does not support that the conditions of our forward guidance are satisfied at the time of lift-off as expected by markets, nor any time soon thereafter.
- The slowdown of PEPP purchases isn't tapering.
About ECB President Lagarde
The European Central Bank's President Christine Lagarde, born in 1956 in France, has formerly served as Managing Director of the International Monetary Fund, and minister of finance in France. She began her eight-year term at the helm of the ECB in November 2019. As part of her job in the Governing Council, Lagarde holds press conferences in detailing how the ECB observes the current and future state of the European economy. Her comments may positively or negatively the euro's trend in the short-term. Usually, a hawkish outlook boosts the euro (bullish), while a dovish one weighs on the common currency (bearish).
-
13:48
Lagarde speech: Phase of rising inflation will last longer than originally expected
Christine Lagarde, President of the Europen Central Bank (ECB), added to her earlier comments on the monetary policy outlook at the post-meeting press conference:
Key quotes:
- The phase of rising inflation will last longer than originally expected.
- This reflects energy, recovery demand outpacing supply.
- Medium-term inflation is still seen below the 2% target.
About ECB President Lagarde
The European Central Bank's President Christine Lagarde, born in 1956 in France, has formerly served as Managing Director of the International Monetary Fund, and minister of finance in France. She began her eight-year term at the helm of the ECB in November 2019. As part of her job in the Governing Council, Lagarde holds press conferences in detailing how the ECB observes the current and future state of the European economy. Her comments may positively or negatively the euro's trend in the short-term. Usually, a hawkish outlook boosts the euro (bullish), while a dovish one weighs on the common currency (bearish).
-
13:44
US: Weekly Initial Jobless Claims decline to 281K vs. 290K expected
- Weekly Initial Jobless Claims in US declined by 10,000.
- US Dollar Index stays relatively quiet below 94.00 after the data.
There were 281,000 initial claims for unemployment benefits in the US during the week ending October 23, the data published by the US Department of Labor (DOL) revealed on Thursday. This reading followed the previous print of 291,000 (revised from 290,000) and came in better than the market expectation of 290,000.
Market reaction
The US Dollar Index continues to fluctuate below 94.00 after this data.
Additional takeaways
"The 4-week moving average was 299,250, a decrease of 20,750 from the previous week's revised average."
"The advance seasonally adjusted insured unemployment rate was 1.7 percent for the week ending October 16."
"The advance number for seasonally adjusted insured unemployment during the week ending October 16 was 2,243,000, a decrease of 237,000 from the previous week's revised level."
-
13:37
Lagarde speech: Inflation to rise further, then decline in 2022
Christine Lagarde, President of the Europen Central Bank (ECB), is delivering her remarks on the monetary policy outlook at the post-meeting press conference:
Key quotes:
- Momentum has moderated but Eurozone continues to recover strongly.
- Expects inflation to rise further, then decline in 2022.
- The grip of the pandemic has weakened.
- High energy prices may reduce purchasing power.
- Economy expected to exceed pre-pandemic level by year-end.
About ECB President Lagarde
The European Central Bank's President Christine Lagarde, born in 1956 in France, has formerly served as Managing Director of the International Monetary Fund, and minister of finance in France. She began her eight-year term at the helm of the ECB in November 2019. As part of her job in the Governing Council, Lagarde holds press conferences in detailing how the ECB observes the current and future state of the European economy. Her comments may positively or negatively the euro's trend in the short-term. Usually, a hawkish outlook boosts the euro (bullish), while a dovish one weighs on the common currency (bearish).
-
13:33
United States Gross Domestic Product Price Index came in at 5.7%, above expectations (5.5%) in 3Q
-
13:31
Breaking: US economy grows by 2.0% in Q3 vs. 2.7% expected
The United States' Real Gross Domestic Product (GDP) expanded at an annual rate of 2.0% in the third quarter of 2021, the first estimate released by the US Bureau of Economic Analysis showed this Thursday. This marked a sharp deceleration from the 6.7% growth recorded in the second quarter and also missed consensus estimates for a reading of 2.7%.
Follow our live coverage of the US GDP report and the market reaction.
Initial Market reaction
The disappointing data did little to provide any meaningful impetus to the US dollar amid firming expectations for an early policy tightening by the Fed. Hence, the focus remains on next week’s FOMC monetary policy meeting.
About US GDP
The Gross Domestic Product Annualized released by the US Bureau of Economic Analysis shows the monetary value of all the goods, services and structures produced within a country in a given period of time. GDP Annualized is a gross measure of market activity because it indicates the pace at which a country's economy is growing or decreasing. Generally speaking, a high reading or a better than expected number is seen as positive for equities, while a low reading is negative.
-
13:31
United States Personal Consumption Expenditures Prices (QoQ) came in at 5.3%, above forecasts (4%) in 3Q
-
13:31
United States Core Personal Consumption Expenditures (QoQ) meets forecasts (4.5%) in 3Q
-
13:31
United States Gross Domestic Product Annualized below expectations (2.7%) in 3Q: Actual (2%)
-
13:31
United States Continuing Jobless Claims below forecasts (2.415M) in October 15: Actual (2.243M)
-
13:30
United States Initial Jobless Claims below forecasts (290K) in October 22: Actual (281K)
-
13:30
United States Initial Jobless Claims 4-week average down to 299.25K in October 22 from previous 319.75K
-
13:04
Germany: Annual HICP rises to 4.6% in October vs. 4.5% expected
- HICP inflation in Germany rose sharply in October.
- EUR/USD continues to fluctuate in a tight range around 1.1600.
Inflation in Germany, as measured by the Consumer Price Index (CPI), rose to 4.5% on a yearly basis in October from 4.1% in September. This reading came in higher than the market expectation of 4.4%.
More importantly, the annual Harmonized Index of Consumer Prices (HICP), the European Central Bank's preferred gauge of inflation, climbed to 4.6% from 4.1% in the same period, compared to analysts' estimate of 4.5%.
Market reaction
This data doesn't seem to be having a meaningful impact on the shared currency's performance against its rivals. As of writing, the EUR/USD pair was down 0.08% on the day at 1.1595. Investors await European Central Bank (ECB) President Christine Lagarde's press conference.
-
13:00
EUR/USD stays muted around 1.1600 post-ECB
- EUR/USD keeps business around the key 1.1600 area on Thursday.
- ECB kept the steady hand, as largely expected.
- Lagarde’s usual press conference comes up next.
EUR/USD manages to retest the area of daily highs in the 1.1615/20 band following the ECB decision on rates.
EUR/USD now looks to Lagarde
EUR/USD navigates the low-1.1600s after the ECB’s Governing Council left its monetary status quo on hold at Thursday’s event, matching the previous expectations.
In fact, the ECB left intact the interest rate on the main refinancing operations, the interest rate on the marginal lending facility and the deposit facility at 0.00%, 0.25% and 0 -0.50%, respectively.
The central bank kept the PEPP envelope unchanged at €1.85 trillion as well as the €20B pace of purchases under the APP. The ECB reiterated the "moderately lower pace" of net PEPP purchases. As in previous meetings, the ECB said rates are seen at current or lower levels until inflation hits the bank's 2% goal well ahead of the end of its forecast horizon and lastingly for the rest of the projection horizon.
Moving forward, market participants will now closely follow the usual press conference by Chairwoman Lagarde and the subsequent Q&A session.
On the data front, advanced inflation figures in Germany see the CPI rising 4.5% YoY in October and 0.5% from a month earlier.
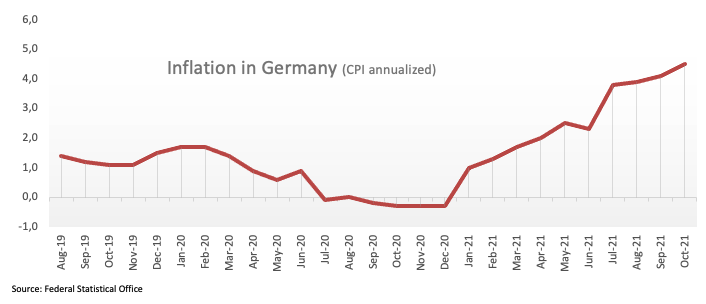
EUR/USD levels to watch
So far, spot is losing 0.05% at 1.1596 and faces the next up barrier at 1.1669 (monthly high Oct.19) followed by 1.1699 (55-day SMA) and finally 1.1755 (weekly high Sep.22). On the other hand, a break below 1.1584 (weekly low Oct.26) would target 1.1571 (low Oct.18) en route to 1.1524 (2021 low Oct.12).
-
13:00
Germany Harmonized Index of Consumer Prices (MoM) above forecasts (0.4%) in October: Actual (0.5%)
-
13:00
Germany Harmonized Index of Consumer Prices (YoY) came in at 4.6%, above expectations (4.5%) in October
-
13:00
Germany Consumer Price Index (YoY) above expectations (4.4%) in October: Actual (4.5%)
-
13:00
Germany Consumer Price Index (MoM) in line with expectations (0.5%) in October
-
12:45
Breaking: ECB leaves key rates unchanged, EUR/USD unfazed near 1.1600
The European Central Bank (ECB) decided to leave the interest rates on the main refinancing operations, the marginal lending facility and the deposit facility unchanged at 0.00%, 0.25% and -0.50%, respectively, as was widely expected.
Follow our live coverage of the ECB's policy announcements and the market reaction.
Market reaction
The initial market reaction, so far, has been muted and the EUR/USD pair was last seen trading with a neutral bias around the 1.1600 mark. Investors waited to hear the central bank's view on the inflation outlook and hence, the focus will be on ECB President Christine Lagarde's remarks at the post-meeting press conference.
-
12:45
European Monetary Union ECB Deposit Rate Decision meets expectations (-0.5%)
-
12:45
European Monetary Union ECB Interest Rate Decision in line with forecasts (0%)
-
12:39
USD/JPY: Elevated risk of a deeper corrective setback to 113.00 – Credit Suisse
Economists at Credit Suisse see an elevated risk that USD/JPY suffers a deeper corrective setback to the 38.2% retracement of the October rally at 113.08/00. But with a major base in place, they continue to view any weakness as corrective only.
Support remains seen at 113.41/39, then 113.08/00
“We see an elevated risk of a slightly deeper corrective setback and a close below 113.41/39 would warn of a fall to 113.29/21, with the 38.2% retracement of the October rally at 113.08/00 then ideally holding. Should weakness directly extend, we would see support next at 112.23 and then more importantly at 112.08/00.”
Whilst 113.41/39 holds, a deeper corrective setback can be avoided, “however a break above 114.21/31 is needed to ease the pressure of f this support for a fresh look at 114.73/92 – the high of November 2017 and 78.6% retracement of the December 2016/March 2020 fall.”
“With a major base in place above the 112.40 high of 2019, we look for an eventual break above 114.73/92 in due course for a move to 115.51 initially and then the long-term downtrend from April 1990 at 117.00/10.”
-
12:31
USD/CAD to continue its fall towards the 1.2208 support – Credit Suisse
USD/CAD remains trapped in a range after holding below short-term resistance at 1.2433/46. Analysts at Credit Suisse still see scope for support at 1.2252/2208.
Resistance stays at 1.2492/99
“We still believe that the recent break below the 200-day average and 3rd September low confirmed an irregular top, which suggests that further weakness is still likely, despite the turn in short-term momentum.”
“We look for a break below the recent range low at 1.2287 for a move to 1.2252 next, with further retracement support just below here at 1.2208. This level is likely to prove a tough barrier in our view, however, we note that the next supports are seen at 1.2156/45.”
“Resistance moves to 1.2433/46, above which would suggest a correction back higher and a test of 1.2492/99, which we would look to cap the market to maintain our downside bias.”
-
12:30
EUR/USD Price Analysis: Extra gains seen above 1.1670
- EUR/USD trades in an inconclusive fashion near 1.1600.
- The next target of note emerges around 1.1670.
EUR/USD wobbles around the 1.1600 mark and extends the weekly consolidative range for an extra session on Thursday.
In the meantime, the inability of the pair to retest recent tops around 1.1670 ideally in the short-term horizon could trigger some corrective move to, initially, the weekly low at 1.1590 (October 25). The surpass of monthly tops, on the other hand, should allow for a potential move to the 1.1700 neighbourhood, coincident with the 55-day SMA and the short-term resistance line.
In the meantime, the near-term outlook for EUR/USD is seen on the negative side below the key 200-day SMA, today at 1.1906.
EUR/USD daily chart
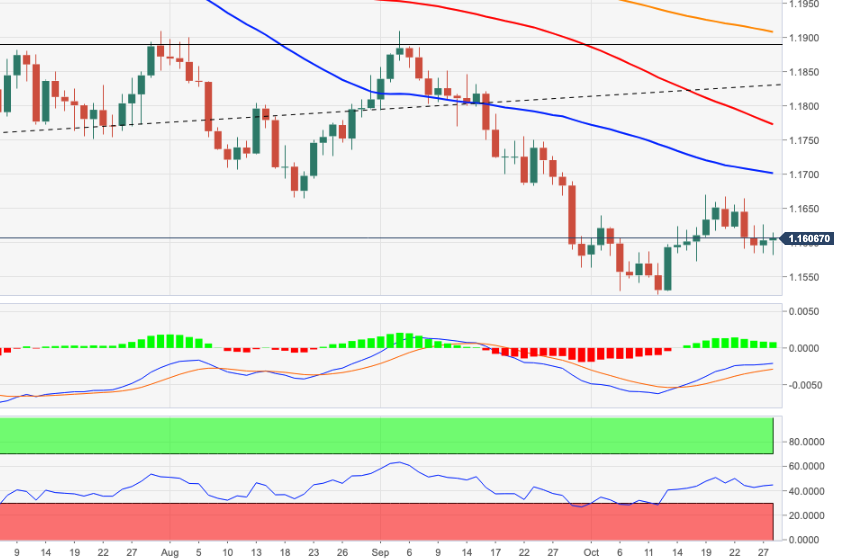
-
12:22
When is the US GDP report and how could it affect USD/CAD?
US Q3 GDP Overview
Thursday's economic docket highlights the release of the Advance third-quarter US GDP report, or the first estimate, scheduled at 12:30 GMT. Growth in the world's largest economy is expected to have decelerated sharply to a 2.7% annualized pace during the July-September period from 6.7% recorded in the second quarter.
Joseph Trevisani, Senior Analyst at FXStreet, offered his take on the upcoming release and explained:
“Economic growth in the US appears to have slowed dramatically in the third quarter as labor and supply constraints and lingering pandemic problems hampered operations at firms nationwide. The novelty of more than 10 million unfilled jobs and more than 5 million unemployed, unprecedented government spending, Covid and vaccine fears and a quickly evolving economy have left analysts uncertain about how much damage may have been inflicted on gross domestic product (GDP).”How Could it Affect USD/CAD?
A softer reading will add to signs of a slowing economic recovery and undermine speculations for an imminent (hawkish) shift in the Fed's policy stance, which should prompt some US dollar selling. That said, growing acceptance that the Fed would be forced to adopt a more aggressive policy response to contain stubbornly high inflation should continue to act as a tailwind for the greenback. A stronger report will reinforce expectations for an early policy tightening by the Fed, suggesting that the path of least resistance for the buck remains to the upside.
Meanwhile, a more hawkish turn by the Bank of Canada on Wednesday raised expectations for an interest rate hike as soon as April 2022. The markets, however, now seems to have fully priced in the next BoC policy move. Apart from this, a corrective slide in crude oil prices should keep the commodity-linked loonie under pressure and supports prospects for some meaningful appreciating move for the USD/CAD pair.
Looking at the technical picture, the pair was last seen hovering just below a resistance marked by the lower boundary of a downward sloping channel. A sustained move beyond the mentioned barrier, currently, around the 1.2405-10 region, could trigger a short-covering move and push the USD/CAD pair towards the key 1.2500 psychological mark, or the very important 200-day SMA.
On the flip side, immediate support is pegged near the 1.2340 horizontal zone, below which the pair could drop back towards the post-BoC swing lows, around the 1.2300 mark. Some follow-through selling will be seen as a fresh trigger for bearish traders and expose trend-channel support, currently around the 1.2225-20 region.
Key Notes
• US Third Quarter GDP Preview: A most uncertain estimate
• US GDP Preview: Forecasts from eight major banks, losing momentum in Q3
• USD/CAD Price Analysis: Descending channel hurdle might cap gains ahead of US GDP
About US GDP
The Gross Domestic Product Annualized released by the US Bureau of Economic Analysis shows the monetary value of all the goods, services and structures produced within a country in a given period of time. GDP Annualized is a gross measure of market activity because it indicates the pace at which a country's economy is growing or decreasing. Generally speaking, a high reading or a better than expected number is seen as positive for equities, while a low reading is negative.
-
12:22
ECB press conference: Lagarde speech live stream – October 28
Christine Lagarde, President of the European Central Bank (ECB), is scheduled to deliver her remarks on the monetary policy outlook in a press conference at 12:30 GMT.
Follow our live coverage of ECB's policy announcements and the market reaction.
About ECB's press conference
Following the ECB´s economic policy decision, the ECB President gives a press conference regarding monetary policy. Her comments may influence the volatility of EUR and determine a short-term positive or negative trend. Her hawkish view is considered as positive, or bullish for the EUR, whereas her dovish view is considered as negative, or bearish.
-
12:21
US Dollar Index Price Analysis: Gains remain capped by 94.00
- DXY extends the rejection from recent tops near 94.00.
- Another visit to the 93.50 area stays on the table.
The persevering selling pressure keeps DXY on the defensive for the second session in a row on Thursday.
If the index cannot clear recent tops around 94.00 in the near term, it could open the door to a deeper pullback in the next sessions. That said, the immediate target should be at the 93.50 region ahead of the 55-day SMA at 93.32.
Looking at the broader picture, the constructive stance on the index is seen unchanged above the 200-day SMA at 91.94.
DXY daily chart
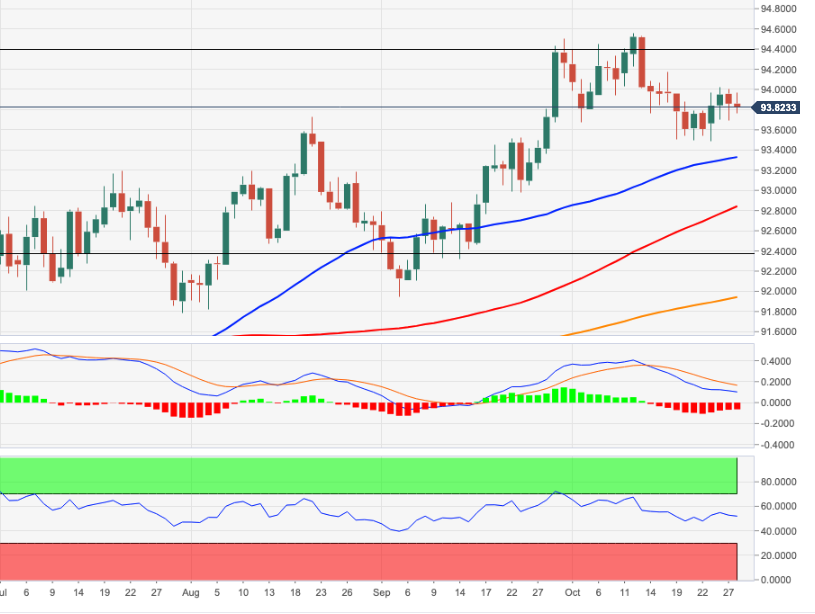
-
12:07
EUR/JPY Price Analysis: The mid-131.00s still offers initial contention
- EUR/JPY adds to Wednesday’s pullback and retests 131.60/50.
- Next on the downside comes the 20-day SMA above 131.00.
Sellers remain in control and keep EUR/JPY depressed near the 131.50 on Thursday.
The weekly pullback has met initial contention at the Fibo level near 131.50, which is expected to hold the downside for the time being. Further south from here emerges the 20-day SMA, today just above the 131.00 yardstick. This area is also reinforced by another Fibo level around 130.90.
In the broader scenario, while above the 200-day SMA at 130.17, the outlook for the cross is expected to remain constructive.
EUR/JPY daily chart
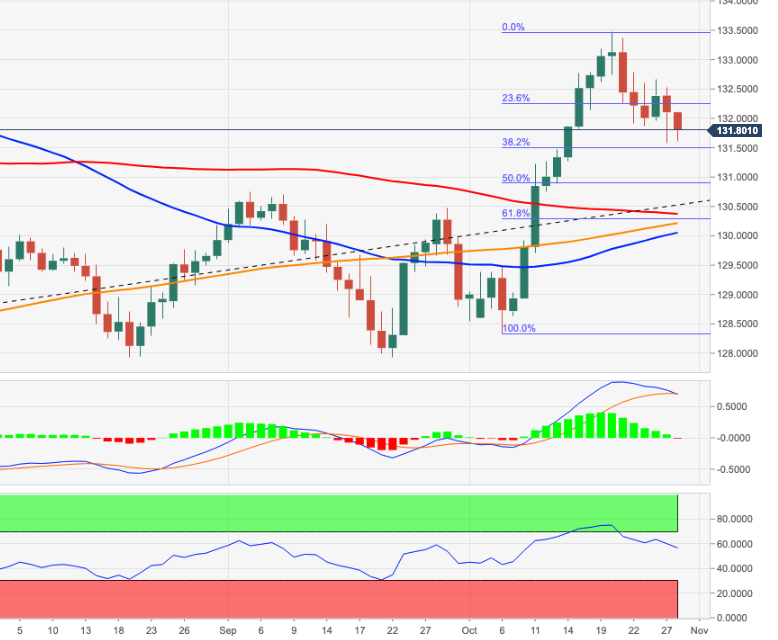
-
12:00
Brazil Inflation Index/IGP-M above forecasts (0.17%) in October: Actual (0.64%)
-
11:08
When is the European Central Bank (ECB) rate decision and how could it affect EUR/USD?
ECB monetary policy decision – Overview
The European Central Bank (ECB) is scheduled to announce its monetary policy decision this Thursday at 11:45 GMT, which will be followed by the post-meeting press conference at 12:30 GMT.
The ECB remains one of the more dovish major central banks and maintained its patient approach despite rising inflationary pressures. In fact, the headline Eurozone CPI accelerated to a 13-year high level of 3.4% in September. That said, core inflation remained below the 2% target and might allow the ECB to stick to the script that the post-lockdown inflation is transitory and leave its monetary policy settings unchanged.
The central bank would also prefer to wait for new economic projections at the December meeting before making any announcement. That said, investors will still look for clues about a potential withdrawal of monetary accommodation from the accompanying monetary policy statement and ECB President Christine Lagarde's remarks at the post-meeting press conference.
According to Valeria Bednarik, Chief Analyst at FXStreet: “Market participants are hoping President Christine Lagarde paves the way for a December announcement, as policymakers cannot keep ignoring mounting inflationary pressures. Headline inflation in the EU has printed at 3.4% YoY in September, a 13-year high, while the German Consumer Price Index in the same period rose by 4.1%, the highest in almost three decades.”
How could it affect EUR/USD?
The EUR/USD pair was seen hovering around the 1.1600 mark heading into the key event risk. A dovish message should prompt aggressive selling around the shared currency and set the stage for the resumption of the pair's recent downward trajectory from early September swing highs. Conversely, signs that the ECB is turning hawkish – though seems unlikely – should be enough to provide a strong boost to the major. Nevertheless, the ECB is more likely to infuse some volatility around the euro crosses.
Meanwhile, Valeria offered a brief technical outlook and outlined important technical levels to trade the EUR/USD pair: “From a technical point of view, the bearish trend is firmly in place, which means that a dovish stance from the ECB will likely have a larger impact on the pair. If policymakers retain their conservative stance without giving any hint of tapering, the pair could pierce the year low and extend its slump towards the 1.1470 price zone, a long-term static critical area.”
“In the unlikely case that Lagarde & Co hint at a tighter monetary policy, the pair could reach 1.1670 and later extend its rally towards the 1.1740 price zone. Selling interest will likely be strong around the latter, preventing EUR/USD from advancing further,” Valerian added further.
Key Notes
• European Central Bank Preview: Finally, some action, but no hopes for the EUR
• European Central Bank Preview: Three reasons why Lagarde is set to lower the euro
• ECB Preview: Forecasts from nine major banks, a dovish message of ongoing support
About the ECB interest rate decision
ECB Interest Rate Decision is announced by the European Central Bank. Usually, if the ECB is hawkish about the inflationary outlook of the economy and rises the interest rates it is positive, or bullish, for the EUR. Likewise, if the ECB has a dovish view on the European economy and keeps the ongoing interest rate, or cuts the interest rate it is seen as negative, or bearish.
-
11:06
EUR/USD: ECB’s lagged respose to raising rates to keep the euro on the back foot – MUFG
Will the European Central Bank (ECB) sound more hawkish following in the footsteps of the Bank of Canada and the Bank of England? Economists at MUFG Bank expect the ECB to look through higher energy prices and convey a dovish message.
ECB not to reveal details of tapering until December
“We do not expect the ECB to sound overly concerned by higher inflation at today’s policy meeting even with higher energy prices expected to lift inflation up towards 4.0% before the end of this year.”
“We continue to believe that the eurozone rate market has got ahead of itself in pricing in ECB rate hikes in the coming years, and would not be surprised to see some push back from President Lagarde today against higher market rates.”
“The ECB’s main policy focus next year will be slowing their QE programmes. However, we do not expect the ECB to reveal more details of their tapering plans until December.”
“The ECB’s lagged response to raising rates should keep the euro on the back foot while other major central banks are moving closer to raising rates.”
See – ECB Preview: Forecasts from nine major banks, a dovish message of ongoing support
-
11:01
Ireland Retail Sales (YoY) down to 0.7% in September from previous 6%
-
11:00
Ireland Retail Sales (MoM) declined to 0.3% in September from previous 3.5%
-
10:46
European Monetary Union Business Climate increased to 1.76 in October from previous 1.72
-
10:40
Italy 10-y Bond Auction: 1.05% vs 0.86%
-
10:40
Italy 5-y Bond Auction up to 0.28% from previous 0.11%
-
10:32
USD/TRY leaps to 3-day highs around 9.6000
- USD/TRY reverses the recent weakness and advances to 9.60.
- The lira loses ground following comments by CBRT Governor.
- Turkish markets will close earlier due to the Republic Day holiday.
The downside pressure accelerates around the Turkish lira and motivates USD/TRY to regain upside traction and advance past the 9.60 level to clinch new 3-day highs on Thursday.
USD/TRY keeps targeting the 10.00 yardstick
After three consecutive daily pullbacks, USD/TRY rebounds from weekly lows near 9.4000 and retakes the 9.6000 mark and above against the backdrop of a strong bout of selling interest hitting the lira.
Indeed, sellers continue to hit the Turkish currency after CBRT officials said that core inflation indicators are expected to lose traction in the near term. In addition, officials stressed that the current tight monetary policy conditions (wait, what?) will remain in place to ensure a drop in inflation as soon as possible.
Still around the CBRT, Governor S.Kavcioglu said that the reversion of the ongoing (and never-ending) dollarization process will mitigate pressure on the exchange rate, while he noted that the inflation target (5%) still remains in place.
No comments…
USD/TRY key levels
So far, the pair is gaining 1.27% at 9.6032 and a drop below 9.4128 (weekly low Oct.26) would aim for 9.1965 (weekly low Oct.21) and finally 9.1952 (20-day SMA). On the other hand, the next up barrier lines up at 9.8395 (all-time high Oct.25) followed by 10.0000.
-
10:30
South Africa Producer Price Index (MoM) came in at 0.9%, above expectations (0.45%) in September
-
10:30
South Africa Producer Price Index (YoY) registered at 7.8% above expectations (7.3%) in September
-
10:30
Belgium Consumer Price Index (MoM) climbed from previous -0.25% to 1.47% in October
-
10:30
Belgium Consumer Price Index (YoY) up to 4.16% in October from previous 2.86%
-
10:21
EUR/GBP flirts with daily lows, around 0.8425 region ahead of ECB
- EUR/GBP witnessed some selling on Thursday and extended the overnight retracement slide.
- The British pound’s relative outperformance could be attributed to hawkish BoE expectations.
- The downside seems limited as the focus remains on the highly-anticipated ECB policy meeting.
The EUR/GBP cross edged lower through the first half of the European session and dropped to fresh daily lows, around the 0.8425 region in the last hour.
The cross struggled to capitalize on its early uptick to mid-0.8400s, instead met with some fresh supply on Thursday and extended the previous day's pullback from the 0.8465-70 supply zone. The British pound's relative outperformance comes on the back of the UK finance minister Rishi Sunak's upbeat economic assessment during the annual budget presentation on Wednesday.
The Office for Budget Responsibility (OBR) forecasted UK GDP to grow 6.5% this year and 6% in 2022. The OBR sees inflation to average 4% next year, well above the Bank of England’s 2% target. This reinforced expectations that the BoE will hike interest rate at the upcoming policy meeting, which further acted as a tailwind for the sterling and exerted pressure on the EUR/GBP cross.
On the other hand, the emergence of fresh US dollar buying weighed on the shared currency and further contributed to the offered tone surrounding the EUR/GBP cross. The downside, however, seems cushioned amid fresh Brexit jitters. Investors might also refrain from placing aggressive bets ahead of the highly-anticipated European Central Bank (ECB) monetary policy meeting on Thursday.
In the latest Brexit-related developments, France announced that it will tighten checks on UK boats and trucks and may also restrict energy supplies to the Channel Islands if there is no agreement on fishing rights by November 2. Separately, the UK Prime Minister said that conditions had been met to invoke Article 16 unless they see rapid progress on the Northern Ireland protocol.
Even from a technical perspective, the EUR/GBP cross – barring a knee-jerk slide on Tuesday – has been oscillating in a broader trading range over the past two weeks or so. This constitutes the formation of a rectangle on short-term charts and points to indecision amongst traders. This further warrants some caution before positioning for a firm near-term direction.
Technical levels to watch
-
10:19
Gold Price Forecast: XAU/USD key levels to watch as US yield curve flattens – Confluence Detector
- Gold price consolidates the two-day recovery, as the US yield curve flattens.
- All eyes on Thursday’s critical ECB and US GDP data for the next big move in gold.
- Gold bears and bulls fight over $1,800, focus shifts to US GDP.
Spiking short-term US Treasury yields amid increasing bets of Fed’s monetary policy normalization, in the face of strengthening economic recovery, leading to the flattening of the yield curve. As the yield curve flattens, it also re-ignites stagflation fears amid the persistence of rising price pressures globally, which is possibly keeping the buoyant tone intact around the traditional safe-haven gold price. However, gold bulls remain cautious and refrain from placing any fresh bets ahead of the key event risks for this week.
Read: Gold Price Forecast: Risks appear skewed to the upside for XAU/USD heading into ECB, US GDP
Gold Price: Key levels to watch
The Technical Confluences Detector shows that gold is retreating after having faced rejection at $1804, the previous high four-hour.
At the press time, gold price is battling $1800, the confluence of the previous day’s high and the SMA5 four-hour.
If the selling pressure intensifies, the next relevant support is seen around $1793, where the SMA200, Fibonacci 38.2% one-day and one-week merge.
Further south, the Fibonacci 61.8% one-month at $1791 will play out, below which the convergence of the SMA100 one-day and Fibonacci 61.8% one-day at $1789 will be challenged.
On the upside, gold buyers will need acceptance above the aforesaid $1804 resistance level. The buyers will then target the pivot point one-day R2 at $1809.
Fresh buying opportunities above the latter will seek a test of the previous week’s high of $1814.
Further up, the bulls will then challenge a dense cluster of resistance levels around $1820, which is the intersection of the pivot point one-day R3, pivot point one-month R1 and pivot point one-week R1.
Here is how it looks on the tool
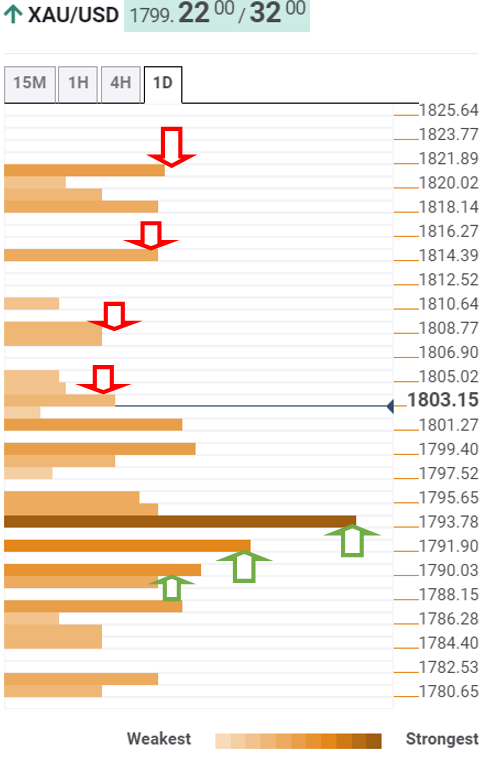
About Technical Confluences Detector
The TCD (Technical Confluences Detector) is a tool to locate and point out those price levels where there is a congestion of indicators, moving averages, Fibonacci levels, Pivot Points, etc. If you are a short-term trader, you will find entry points for counter-trend strategies and hunt a few points at a time. If you are a medium-to-long-term trader, this tool will allow you to know in advance the price levels where a medium-to-long-term trend may stop and rest, where to unwind positions, or where to increase your position size.
-
10:00
Belgium Gross Domestic Product (QoQ) meets forecasts (1.8%) in 3Q
-
10:00
European Monetary Union Services Sentiment above expectations (16.5) in October: Actual (18.2)
-
10:00
European Monetary Union Industrial Confidence above forecasts (12.5) in October: Actual (14.2)
-
10:00
European Monetary Union Economic Sentiment Indicator came in at 118.6, above forecasts (116.9) in October
-
10:00
European Monetary Union Consumer Confidence in line with expectations (-4.8) in October
-
09:53
USD/CAD Price Analysis: Descending channel hurdle might cap gains ahead of US GDP
- USD/CAD gained some positive traction on Thursday and moved away from the post-BoC lows.
- The descending channel formation warrants caution for bulls amid bearish technical indicators.
The USD/CAD pair built on the previous day's late rebound from the 1.2300 mark, or weekly lows and gained some positive traction on Thursday. The pair climbed to the 1.2380 region during the early part of the European session and has now reversed a major part of the post-BoC losses.
An extension of the corrective pullback in crude oil prices undermined the commodity-linked loonie and turned out to be a key factor that provided a modest lift to the USD/CAD pair. On the other hand, a goodish rebound in the US Treasury bond yields extended some support to the US dollar and remained supportive of the pair's intraday positive move.
Looking at the technical picture, the recent recovery from four-month lows faltered near the top end of a downward sloping channel in reaction to a more hawkish Bank of Canada on Wednesday. The mentioned barrier, currently around the 1.2410 region, should act as a pivotal point for traders as the focus remains glued to the Advance US Q3 GDP report.
Meanwhile, oscillators have been gaining positive traction lately and favour intraday bullish traders. That said, technical indicators on the daily chart – though have been recovering lately – are holding in the bearish territory. This makes it prudent to wait for a convincing break through the channel resistance before positioning for any further gains.
Above the mentioned barrier, the USD/CAD pair might then accelerate the momentum towards challenging the very important 200-day SMA, around the key 1.2500 psychological mark. Some follow-through buying will suggest that the recent leg down from September monthly swing lows has run its course and trigger a fresh bout of a short-covering move around the major.
On the flip side, the 1.2340 horizontal zone seems to protect the downside ahead of the 1.2300 round-figure mark. Failure to defend the said support levels will be seen as a fresh trigger for bearish traders and turn the USD/CAD pair vulnerable to break below the 1.2300 mark. The downward trajectory could get extended towards the ascending channel support, around the 1.2220 region.
USD/CAD daily chart
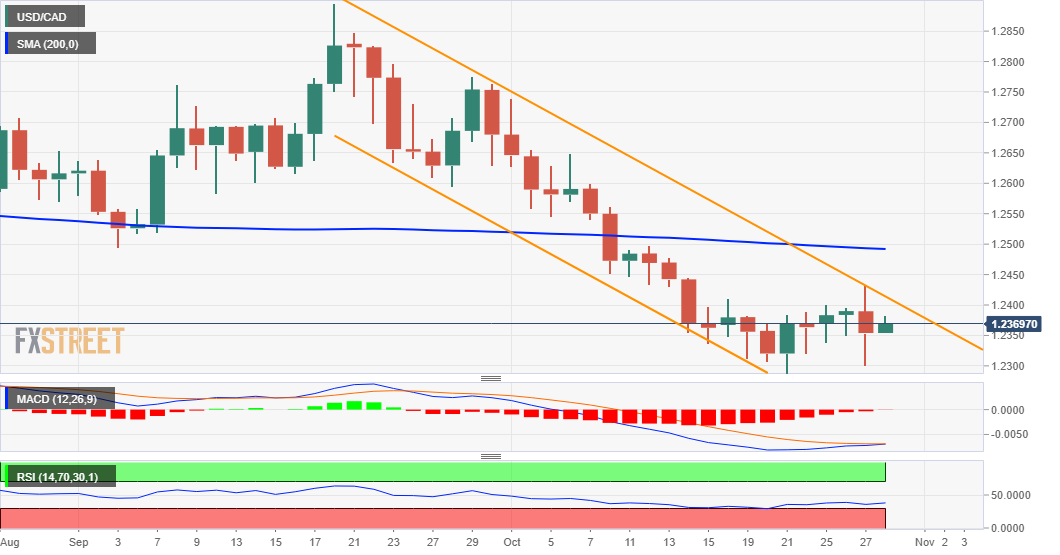
Technical levels to watch
-
09:37
Portugal Consumer Confidence: -10.9 (October) vs -12.9
-
09:32
Portugal Business Confidence increased to 2 in October from previous 1.6
-
09:08
EUR/USD stays cautious around 1.1600 ahead of data, ECB
- EUR/USD extends the consolidative mood around 1.1600.
- The German labour market report comes next in the docket.
- The ECB meets later on Thursday with focus on PEPP, inflation.
The single currency remains unable to gather serious traction in either direction and relegates EUR/USD to trade within a narrow range around the 1.1600 neighbourhood.
EUR/USD now looks to the docket, ECB
EUR/USD extends the erratic performance around the 1.1600 zone on Thursday against the backdrop of rising cautiousness among market participants ahead of the key ECB monetary policy meeting due later in the session.
The also steady activity in the greenback accompanies the side-lined mood around spot despite the risk-on sentiment appears to prevail in the wake of the opening bell in Euroland.
The dollar suffered the intense pullback in US yields in past sessions, particularly in the longer dated bonds, while the front end of the curve continues to edge higher and trades in levels last seen in March 2020.
In the docket, the German labour market report will be in the limelight later in the session followed by the preliminary inflation figures for the month of October. Still in the euro area, the ECB is expected to re-affirm the dovish stance at its meeting later in the session, where the Governing Council's views on the current elevated inflation will be in the centre of the debate along with the continuation/end of the ongoing stimulus programme.
Across the pond, all the attention will be on the release of another revision of the Q3 GDP along with the usual Initial Claims and Pending Home Sales.
What to look for around EUR
EUR/USD remains unable to push further north of the 1.1600 hurdle for the time being. While the improvement in the sentiment surrounding the risk complex lent extra wings to the par in past sessions, price action is expected to keep looking to dollar dynamics for the time being, where tapering chatter and a probable sooner-than-expected lift-off in rates remain well in centre stage. In the meantime, the idea that elevated inflation could last longer coupled with the loss of momentum in the economic recovery in the region, as per some weakness observed in key fundamentals, is seen pouring cold water over investors’ optimism as well as bullish attempts in the European currency.
Key events in the euro area this week: German labour market report, EMU final Consumer Confidence, ECB meeting, German flash CPI (Thursday) – Advanced German Q3 GDP, flash EMU CPI (Friday).
Eminent issues on the back boiler: Asymmetric economic recovery post-pandemic in the region. Sustainability of the pick-up in inflation figures. Probable political effervescence around the EU Recovery Fund in light of the rising conflict between the EU, Poland and Hungary. ECB tapering speculations.
EUR/USD levels to watch
So far, spot is up 0.04% at 1.1610 and faces the next up barrier at 1.1669 (monthly high Oct.19) followed by 1.1699 (55-day SMA) and finally 1.1755 (weekly high Sep.22). On the other hand, a break below 1.1584 (weekly low Oct.26) would target 1.1571 (low Oct.18) en route to 1.1524 (2021 low Oct.12).
-
09:03
EUR/USD: Break above 1.1670/1.1700 is needed to extend the bounce – SocGen
EUR/USD has so far struggled to overcome graphical levels of 1.1670/1.1700. The pair continues to tread water around 1.1600 and would need to surpass the aforementioned resistance to see further gains, economists at Société Générale report.
Support 1.1570, resistance 1.1670
“Daily MACD has posted positive divergence however it is still in negative territory which denotes a price breakout i.e. a break above the 1.1670/1.1700 resistance zone is essential to affirm an extended up-move.”
“Failure to defend 1.1570 can result in further down move towards recent low at 1.1525 with next significant support at March 2020 high of 1.1495/1.1450.”
-
09:01
Turkey Foreign Arrivals declined to 59.45% in September from previous 119.44%
-
09:00
Italy Business Confidence registered at 114.9 above expectations (112.2) in October
-
09:00
Italy Consumer Confidence registered at 118.4, below expectations (118.5) in October
-
08:59
AUD/USD may turn back lower towards 0.7450 in the short-term – Westpac
AUD/USD is dead flat over the week, just above 0.7500. Changes to the RBA’s language are likely to be less dramatic than implied by market pricing, suggesting the aussie may slip back to say 0.7450 near term but remains a buy on dips on the multi-month/quarter outlook, economists at Westpac report.
Dips offers a buying opportunity
“Westpac maintains its view for a steady cash rate until Feb 2023 and expects changes to the RBA’s language next week to be less dramatic than is implied by market pricing.”
“AUD/USD could slip back to say 0.7450 near-term but remains a buy on dips on the multi-month/quarter outlook.”
-
08:55
Germany Unemployment Rate s.a. meets forecasts (5.4%) in October
-
08:55
Germany Unemployment Change below expectations (-20K) in October: Actual (-39K)
-
08:54
GBP/USD Price Analysis: Refreshes daily tops, 1.3800 mark back in sight
- GBP/USD gained positive traction on Thursday and recovered further from one-week lows.
- The ascending channel breakdown seems to have shifted bias in favour of bearish traders.
- Follow-through weakness below the 1.3700 mark is needed to confirm the negative outlook.
The GBP/USD pair built on the previous day's recovery move from the 1.3700 neighbourhood, or over one-week lows and edged higher through the first half of the trading action on Thursday. The momentum pushed the pair fresh daily tops, around the 1.3770-75 region during the early European session.
The British pound was underpinned by the UK finance minister Rishi Sunak's upbeat economic assessment during the annual budget presentation on Wednesday. Adding to this, expectations for an imminent interest rate hike move by the Bank of England further acted as a tailwind for the sterling. This, along with a subdued US dollar price action, provided a modest lift to the GBP/USD pair.
That said, a goodish pickup in the US Treasury bond yields helped limit the USD losses and kept a lid on any meaningful gains for the GBP/USD pair. Investors also seemed reluctant to place aggressive bets and preferred to wait for the outcome of the highly-anticipated ECB meeting. Apart from this, the Advance US Q3 GDP report will be looked upon for some meaningful trading opportunities.
Looking at the technical picture, the recent strong rally from the vicinity of the 1.3400 mark touched in September faltered near a descending trend-line extending from late July. The subsequent pullback dragged the GBP/USD pair below support marked by the lower boundary of a one-month-old ascending channel on Wednesday. This might have already set the stage for a further depreciating move.
Meanwhile, technical indicators on the daily chart – though have been losing positive momentum – are yet to confirm a bearish bias. This, along with the emergence of dip-buying at lower levels, warrants some caution for bearish traders. Hence, it will be prudent to wait for some follow-through selling below the 1.3700 round-figure mark before positioning for an extension of the downfall.
The GBP/USD pair might then accelerate the downward momentum towards testing the next relevant support near mid-1.3600s before eventually dropping to test sub-1.3600 levels in the near term.
On the flip side, any subsequent positive move is more likely to meet with some fresh supply near the 1.3800 mark and remain capped near the descending trend-line resistance, around 1.3825-30 region. This is closely followed by the very important 200-day SMA, around mid-1.3800s, which if cleared decisively will negate any near-term negative bias and be seen as a fresh trigger for bullish traders.
The GBP/USD pair might then accelerate the momentum towards the 1.3900 round-figure mark. Some follow-through buying has the potential to push the pair further towards the 1.3960-65 resistance, above which bulls could aim to reclaim the key 1.4000 psychological mark.
GBP/USD daily chart
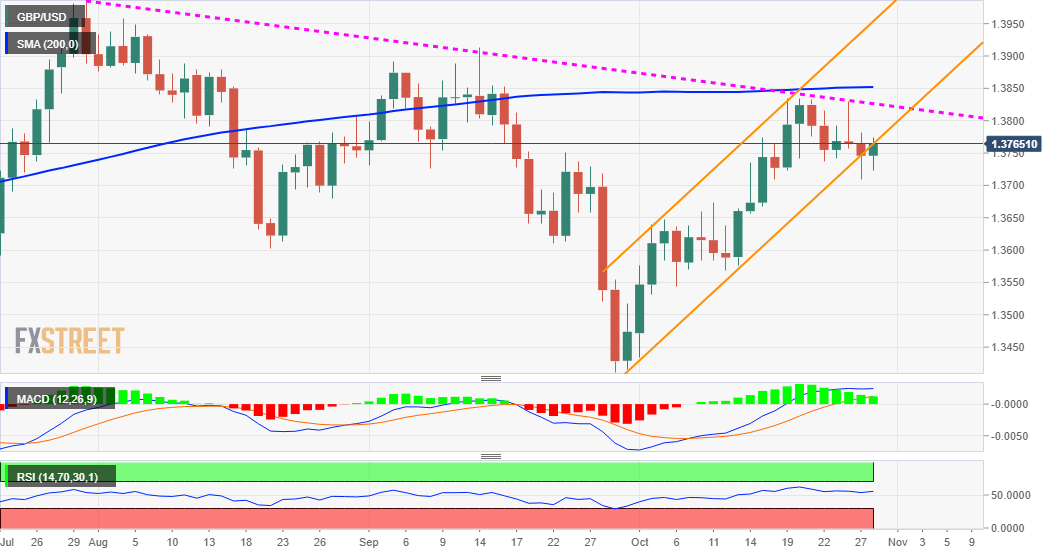
Technical levels to watch
-
08:42
US GDP Preview: Forecasts from eight major banks, losing momentum in Q3
The US Bureau of Economic Analysis will release its first estimate of the annualized GDP growth for Q3 at 12:30 GMT and as we get closer to the release time, here are the forecasts of economists and researchers of eight major banks, regarding the upcoming US data. Markets expect the US economy to expand by 2.5% on a yearly basis after growing by 6.7% in the second quarter.
ING
“Supply chain strains and labour shortages held back production, and this is likely to show up in another big drag lower from inventories. Government spending may rebound a touch, while investment should be OK, given construction numbers and durable goods orders data. Net trade may be positive, but not for the best of reasons, given the disruption in Chinese output and the long queues of ships trying to get into US ports. Putting this all together, we have 3Q GDP growth pencilled in at around 2.5% annualised.”
RBC Economics
“We expect US GDP grew by 3% in Q3, slowing from the previous quarter as consumer spending momentum faded amid Delta fears and goods shortages emerged from supply constraints.”
NBF
“The pace of the recovery likely decelerated in the quarter, as rising COVID-19 caseloads and supply chain constraints weighed on the economy. Positive contributions are nonetheless expected from consumption spending, business machinery/equipment investment and, to a lesser extent, trade. Residential investment, on the other hand, might have weighed on growth. Our call is for a 2.5% annualized expansion. In other news, the latest report on personal income could show a decrease for September (-0.3%) as solid wage gains were likely offset by the phasing out of some emergency income support programs.”
Westpac
“Over the year to June 2021, the US economy experienced a strong recovery from the depths of the pandemic recession. These gains were led by the consumer as households initially reset their lifestyles to weather the pandemic and later as a wave of stimulus rolled in. In the three months to September however, the US economy looks to have stalled, with growth seen around trend – at best. For the recovery, the timing of the delta wave is extremely problematic, occurring just as consumers were looking to get out and about and spend on services. However, with cases coming down and vaccinations continuing, this slowdown should prove temporary. While we have lowered our Q3 number from 3.5% to 2.0% annualised and see material risks to the downside, our 2021 and 2022 year-average forecasts are little changed at 5.6% and 4.0%.”
SocGen
“We look for slowing to just 2.1%, versus a 6.5% average for 1H and expectations at the start of 3Q of 5% growth. What happened? First, consumption slowed. Spending on autos fell precipitously and taken by itself, auto sales look recessionary. This is widely viewed as temporary.”
CIBC
“All signs point to a deceleration in GDP growth in the US in the third quarter as consumer spending on goods was stifled by supply chain bottlenecks, and momentum in services spending faded with the spread of the Delta variant. Exports appear to have been soft relative to imports, leaving our 2.6% annualized growth forecast driven by inventories. Excluding inventories, the economy would have contracted by nearly 1% annualized. We’re slightly above the consensus forecast, which could support the greenback and see bond yields rise.”
Citibank
“US GDP Annualized QoQ – Citi: 2.4%, median: 2.6%, prior: 6.7%; Personal Consumption – Citi: 0.7%, median: 0.7%, prior: 12.0%; Core PCE QoQ – Citi: 4.4%, median: 4.4%, prior: 6.1% - Citi analysts expect Q3 to be the softest quarter of growth in the pandemic recovery period, reflecting the now-higher level of activity, thus with less mechanical reopening upside as well as from supply constraints even if demand remains very strong.”
TDS
“Growth appears to have slowed sharply in Q3: Our 1.8% QoQ AR estimate is down from 6.7% in Q2 and 6.3% in Q1. Growth in real consumer spending was probably barely positive. (Full details in the main forecast table below.) The Delta COVID wave, the fading of fiscal stimulus and supply constraints likely all played a role in the slowing. Delta's drag should abate soon, but the fiscal fade will continue and supply issues are unlikely to disappear quickly. We forecast a 4% pace for Q4.”
-
08:30
Sweden Retail Sales (MoM) registered at -0.3%, below expectations (1%) in September
-
08:30
Sweden Retail Sales (YoY) came in at 4.8% below forecasts (6.4%) in September
-
08:30
NZD/USD to see further gains towards the 0.7315 mark – Westpac
NZD/USD spent the past week consolidating. Yield spreads, sentiment, and commodities are all supporting NZD/USD. The week ahead target is 0.7315, in the opinion of economists at Westpac.
NZ pricing intentions survey up to a fresh record high
“A break above 0.7220 would signal a move to 0.7315, and eventually to 0.7465 by year-end.”
“NZ-US yield spreads continue to rise. Interestingly, even though the Fed is being repriced in a hawkish direction, and RBNZ pricing is well above the RBNZ’s (and our) own OCR forecast, NZ’s beta has exceeded one.”
“Rising inflation expectations are surely one factor, but NZ interest rate markets also appear to be driven by positioning and domestic hedging flow from mortgage fixing, and the resultant yields are supporting the NZD. “
“Global sentiment is elevated, while the global commodity boom is starting to take agri-commodities for the ride.”
-
08:28
UK’s Sunak: Government debt is large
Expressing his take on the government debt, the UK Finance Minister Rishi Sunak said that “it is large.”
Additional quotes
“The cost of servicing the debt is currently quite low.”
“I have to protect us against the impact of increasing costs to service debt.”
more to come ...
-
08:26
Equities: Three sectors to benefit from higher inflation – Charles Schwab
Signs are growing that inflation may be more tenacious than originally expected. When inflation is stubbornly high, sectors such as Energy, Real Estate, Health Care, Utilities, and Consumer Staples historically have outperformed on average, as David Kastner, head of the Schwab Center for Financial Research, notes.
Energy
In the early stages of an inflationary cycle, energy typically benefits from the same factor that drives overall prices higher: demand that outstrips supply. Historically, the energy sector has often been one of the top relative performers when inflation in on the rise – at least until the Federal Reserve tightens monetary policy enough to slow economic growth, or excess supply causes prices to drop.”
Real Estate
“Rising inflation usually reflects an improving economy, which tends to be good for the real estate investment trusts (REITs) that make up the bulk of the real estate sector.”
Traditionally defensive sectors – Health Care, Utilities and Consumer Staples
“These sectors tend to outperform during periods of high inflation. In part, this is due to their relatively steady earnings no matter the economic conditions – people need medicine, heat, and food in any economy – and their ability to pass higher costs on to consumers.”
See – Equities: Four sectors to struggle amid higher inflation – Charles Schwab
-
08:19
GBP/USD to mull a push to the 1.40 level – Westpac
GBP/USD is moving sideways around mid-13700s. Despite cable dipping below 1.3750, a push to 1.40 anticipated range resistance could still develop, according to economists at Westpac.
Risk of early hike to persist on confirmation of improved growth forecast
“UK’s Autumn Budget proved to be more generous than expected, despite multiple detailed leaks. However, the Office of Budget Responsibility (OBR) forecasts lower Govt. debt and issuance due to firmer growth, lower unemployment and much improved Govt. revenue.”
“Growth (6.5% in ‘21, 6.0% in ‘22) and inflation (2.3% in ‘21, 4.0% in ’22, remaining at 2.0% or above through the forecast period) are high. Though yields are lower, on lower debt burdens, if BoE updated forecasts reflect these improvements, risk of an early hike will persist.”
“Despite GBP/USD dipping below 1.3750, a push to 1.40 anticipated range resistance could still develop.”
-
08:15
AUD/USD climbs to 0.7520-25 area, back closer to weekly tops set on Wednesday
- Rising bets for an early RBA rate hike helped AUD/USD to attract some dip-buying on Thursday.
- Rebounding US bond yields acted as a tailwind for the USD and could cap gains for the major.
- Investors now await ECB policy decision and the Advance US GDP report for a fresh impetus.
The AUD/USD pair managed to recover over 40 pips from daily lows and climbed to fresh daily tops, around the 0.7520-25 region in the last hour.
The pair attracted some dip-buying on Thursday and reversed an intraday fall to three-day lows, around the 0.7480-75 region amid rising bets for a rate hike move by the Reserve Bank of Australia (RBA). The speculations were fueled by Wednesday's release of RBA trimmed mean inflation for the third quarter, which indicated that consumer cost pressures are getting entrenched.
This, along with a subdued US dollar price action, helped offset a softer risk tone and acted as a tailwind for the perceived riskier aussie. The AUD/USD pair has now moved back closer to weekly tops touched on Wednesday, though any meaningful positive move seems elusive. A goodish rebound in the US Treasury bond yields should help limit the USD losses and cap gains for the major.
Investors might also refrain from placing aggressive bets, rather prefer to wait on the sidelines ahead of Thursday’s key event/data risks. The European Central Bank will announce its monetary policy decision during the mid-European session. Apart from this, the Advance US Q3 GDP report should infuse volatility in the markets and provide a fresh impetus to the AUD/USD pair.
Hence, any subsequent move up runs the risk of fizzling out rather quickly, warranting some caution before positioning for a further intraday appreciating move. Nevertheless, the pair, for now, has turned positive for the fourth successive day and the emergence of fresh buying at lower levels supports prospects for a move towards monthly swing highs, around the 0.7545 area.
Technical levels to watch
-
08:15
Equities: Four sectors to struggle amid higher inflation – Charles Schwab
In every market environment there tend to be winners and losers, and inflationary periods are no exception. Consumer Discretionary, Industrials, Materials and Financials have struggled in general, as David Kastner, head of the Schwab Center for Financial Research, notes.
Consumer Discretionary
“Higher energy costs and reduced purchasing power due to higher prices, in general, eat away at nonessential consumer spending, especially for lower-income consumers. Supply constraints are affecting sales and production. If the economy slows, the Fed tightens monetary policy because of mounting inflation concerns, and/or market volatility picks up, this cyclical sector could underperform.”
Financials
“Banks borrow at short-term rates (the rates they pay depositors) and lend at longer-term rates. When the Fed raises short-term rates aggressively, it typically leads to expectations for slower economic growth that can drive long-term rates lower, resulting in lower net interest margins and potentially weaker relative performance for financials.”
Industrials
“Companies typically face challenges from higher input costs along with ebbing demand for cyclical products such as construction equipment and industrial machinery. Current supply constraints, high labor costs, and the spike in fuel costs are all headwinds for the sector.”
Materials
“Concerns about slowing economic growth can take a toll. The recent slowdown in Chinese growth could mean that materials stocks would struggle even earlier and to a greater degree than usual.”
-
08:07
FX option expiries for October 28 NY cut
FX option expiries for October 28 NY cut at 10:00 Eastern Time, via DTCC, can be found below.
- EUR/USD: EUR amounts
- 1.1500 586m
- 1.1600-10 1.4b
- 1.1620-25 594m
- 1.1700 309m
- GBP/USD: GBP amounts
- 1.3750 296m
- 1.3780 238m
- USD/JPY: USD amounts
- 113.00 1.5b
- 113.75-84 1.6b
- USD/CHF: USD amounts
- 0.9180 650m
- AUD/USD: AUD amounts
- 0.7475 1.0b
- 0.7505 614m
- USD/CAD: USD amounts
- 1.2375 1.2b
-
08:03
ECB Preview: Forecasts from nine major banks, a dovish message of ongoing support
The European Central Bank (ECB) will announce its policy decisions at 11:45 GMT and as we get closer to the release time, here are the expectations as forecast by the economists and researchers of nine major banks, regarding the upcoming announcement.
The central bank is widely anticipated to keep policy rates unchanged but also to take its first step towards easing the massive financial support program meant to keep the system stable throughout the pandemic.
Danske Bank
“We expect the ECB to flag risks to the outlook and as such not deviate from the current baseline and send new policy signals already now but wait for a new projections round in December. That means that we still expect the ECB to repeat that they believe that the current inflation outlook is largely transitory but that narrative will be tested until the December meeting. We believe that the ECB will attempt to make the meeting as uneventful as possible.”
Rabobank
“The ECB may reiterate the growing divergence with other central banks. October’s meeting will reflect the increased uncertainty surrounding inflation. This shouldn’t derail the ECB’s plans of a post-PEPP ‘transition period.’ We fully expect ECB policy to remain on hold until December.”
TDS
“This was meant to be a placeholder meeting, but market re-pricing has put the ECB on the back foot. President Lagarde will likely try to push back against recent market moves. An emphasis on policy sequencing dynamics reinforce that the ECB is slated to be a laggard in the central bank tightening circuit. EUR/USD has several negatives going for it, and we could see it revert sub-1.16 in the weeks ahead if Lagarde can succeed in converting a push into a shove. We also like EUR/JPY downside to 131.”
ING
“Updating the ECB’s own technical assumptions from mid-August with the new market reality would mechanically lead to another increase in the inflation projections for 2022 and 2023, by 0.1% to 0.2%, even if the increase in bond yield by some 30 basis points should have a dampening effect. We expect a discussion on the following topics: extending the Pandemic Emergency Purchase Programme (PEPP) beyond March 2022; how to avoid a cliff-edge effect and how much (if any) QE is needed in the post-pandemic era to bring inflation sustainably back to 2%? In our view, the easiest solution would be to gradually phase out the PEPP purchases starting January next year, potentially with a new third asset purchase programme to maintain the PEPP’s flexibility, allowing the ECB to continue buying Greek bonds. As much course-setting this week’s ECB meeting will be, we doubt that ECB president Christine Lagarde will share any important details of it. She will need all her energy to moderate what in our view looks like a widening rift between hawks and doves; of those ECB members favoring an exit from the emergency tools and those still being more afraid of medium-term inflation being too low rather than too high. Pushing the debate publicly in a certain direction would widen the rift rather than closing it. This is why, at Thursday’s press conference, less (communication) should be more.”
Westpac
“They will clearly articulate they have confidence in the recovery, but will also note they see little need to raise rates to end-2023 given inflation. The medium-term rates outlook for the ECB is at odds with both the US FOMC and UK’s BoE.”
SocGen
“The ECB message should remain firmly on the dovish side, with the bank expecting high inflation to be only transitory. We expect the ECB will decide in December to end the PEPP in March next year, to raise the APP to EUR50 B per month as of April and to launch another TLTRO. It’s a very data-heavy week, and the figures should point to ‘growth-flation’ – a combination of solid growth and high inflation.”
Deutsche Bank
“This Governing Council meeting is likely to be a staging ground ahead of wide-ranging policy decisions in December, and will therefore be about tone and expectations management. One thing to keep an eye on in particular will be what is said about the recent surge in natural gas prices, as well as if ECB President Lagarde challenges the market pricing on liftoff as inconsistent with their inflation forecasts and new rates guidance. 5yr5yr Euro inflation swaps hit 2% for the first time on Friday so if the market is to be believed the ECB has achieved long-term success in hitting its mandate. With regards to the meeting, we think there’ll be more action in December where our baseline is that there’ll be confirmation that PEPP purchases will end in March 2022.”
Nordea
“Financial markets have started to price in clear risks of rate hikes starting already next year also in the euro area. Previous ECB comments have failed to change market pricing much, and we expect Lagarde to try to emphasize the ECB’s dovish guidance on rates. Rapidly rising inflation expectations may already worry the more hawkish Governing Council members. Short-end pricing may correct somewhat lower on Thursday, but in the bigger picture, global inflation worries still have room to escalate.
ABN Amro
“The big question of course is whether the ECB will succeed in pouring cold water on market expectations for early policy rate hikes. This might prove very challenging at the November meeting as ECB President Lagarde will have little other than words to try and shift expectations.”
-
08:00
Spain Consumer Price Index (MoM) above forecasts (1.2%) in October: Actual (2%)
-
08:00
Spain HICP (MoM) came in at 1.7%, above forecasts (0.9%) in October
-
08:00
Spain Unemployment Survey came in at 14.57%, above forecasts (14.2%) in 3Q
-
08:00
Sweden Consumer Confidence (MoM) came in at 103.1, below expectations (108.3) in October
-
08:00
Spain Consumer Price Index (YoY) came in at 5.5%, above expectations (4.5%) in October
-
08:00
Spain HICP (YoY) came in at 5.5%, above expectations (4.8%) in October
-
07:50
Forex Today: ECB policy decisions and US GDP data to ramp up volatility
Here is what you need to know on Thursday, October 28:
Market volatility increased in the second half of the day on Wednesday but major currency pairs closed not too far from their opening levels. Ahead of key events, the risk-averse market environment helps the dollar find demand. Meanwhile, short-term US T-bond yields continue to push higher while the 10-year reference is edging lower, causing a flattening yield curve and supporting the greenback. The European Central Bank (ECB) will announce its policy decisions at 1145 GMT and President Christine Lagarde will deliver her remarks in a press conference at 1230 GMT. The US Bureau of Economic Analysis will release its first estimate of the annualized GDP growth for Q3. September Pending Home Sales and the weekly Initial Jobless Claims will be featured in the US economic docket as well.
Macroeconomic events: On Wednesday, the Bank of Canada (BoC) left its policy rate unchanged as expected but decided to end its quantitative easing program in a surprise move. Moreover, the BoC signalled that rate hikes may be coming sooner than expected. The BoC’s hawkish shift triggered a sharp upsurge in the short-term Canadian rates with the one-year bond yield rising more than 20 basis points. More importantly, this development is seen as a sign that major central banks could pull support sooner than expected in order to control inflation expectations.
During the Asian trading hours, the Bank of Japan left its policy settings unchanged but lowered the 2021/22 growth forecast to 3.4% from 3.8%. “Japan's consumer inflation is likely to gradually accelerate,” the BoJ reiterated. USD/JPY largely ignored the BoJ’s inaction and continues to trade in a tight range below 114.00.
The data from the US showed on Wednesday that Durable Goods Orders contracted by 0.4% in September, compared to market expectation for a decline of 1.1%. The international trade deficit expanded to $96.3 billion from $89.4 billion. The US Dollar Index (DXY) finished the second straight day little changed below 94.00.
EUR/USD continues to tread water around 1.1600 as investors refrain from committing to large positions ahead of the ECB meeting.
European Central Bank Preview: Three reasons why Lagarde is set to lower the euro.
GBP/USD is moving sideways around mid-13700s as markets await the next catalyst. A strong reaction in EUR/GBP pair to the ECB could impact GBP/USD's movements.
Gold is testing the $1,800 handle for the second time this week but XAU/USD could have a difficult time making a sustained move unless the US GDP data triggers a USD selloff.
US Q3 GDP Preview: Gold stays fragile barring a negative surprise.
Cryptocurrencies: Bitcoin fell below $60,000 for the first time in nearly two weeks and the correction could deepen in case buyers fail to lift the price above that level. Ethereum seems to be barely holding above $4,000 after losing nearly 5% on Wednesday.
-
07:47
BOJ’s Kuroda: Don't think current weak yen is a bad thing
Commenting on the recent depreciation in the yen, the Bank of Japan (BOJ) Governor Haruhiko Kuroda said that he doesn’t think the current weak yen is a bad thing.
Additional quotes
No comment on forex levels, short-term moves.
Degree of weak yen pushing up exports has become lesser in extent.
Weak yen pushes up costs for households and importers.
Desirable for FX to move stably reflecting economic fundamentals.
Yen decline also leads to higher energy import costs.
Takes time for higher energy prices to be reflected in inflation data.
Biggest reason for rising product prices is expansion of global demand, positive for Japan exports.
YCC could bring weak yen as it widens interest rate differentials vs overseas.
Don't think US tapering has direct impact on interest rates, currencies.
Action by other central banks won't have impact on Japan’s monetary policy.
Current yen moving within range of economic fundamentals.
No comment on real effective yen rates.
Related reads
- BOJ’s Kuroda: Will ease monetary policy further without hesitation as needed
- USD/JPY hangs near two-week lows, around mid-113.00s after BoJ’s Kuroda
-
07:46
Brent Oil: $100? Here we go! – TDS
Oil inventory spike is not enough to derail bull run beyond the near-term, in the view of strategists at TD Securities. They see Brent trend into $100+/bbl territory.
Crude oil deficits pending as supply tries to keep pace with winter demand spikes
“Despite the fact that US crude inventories increased more than double expectations last week, they should moderate as Gulf refineries exit the ‘turnaround season,’ where plants recondition equipment and demand less crude throughput.”
“The continued OPEC+ supply discipline and a general lack of positive supply response to higher prices by other producers, along with the likley pending demand increases for petroleum products due to the raging energy crisis in Asia/Europe and the formation of La Niña weather patterns in the equatorial band of the Pacific Ocean, should all see crude oil prices bounce higher.”
“As pending demand spikes squeeze available supply in the depth of winter, the global crude benchmark may trade as high as $100/bbl.”
-
07:45
USD/JPY hangs near two-week lows, around mid-113.00s after BoJ’s Kuroda
- USD/JPY witnessed some selling for the second successive day on Thursday.
- A softer risk tone benefitted the safe-haven JPY and exerted some pressure.
- Bulls largely shrugged off a dovish BoJ outlook on GDP growth and inflation.
The USD/JPY pair remained depressed heading into the European session and was last seen hovering near the lower boundary of its intraday trading range, around mid-113.00s.
The pair struggled to capitalize on the previous day's late rebound from the 113.40-35 area, or near two-week lows and met with some fresh supply on Thursday. This marked the second successive day of a negative move and was sponsored by a weaker trading sentiment around the Asian equity markets, which tends to benefit the safe-haven Japanese yen.
Bulls failed to gain any respite after the Bank of Japan (BoJ) lowered its real GDP growth and consumer inflation estimates for the current fiscal. In the fresh quarterly report, the BoJ predicted growth of 3.4% for the year to March 2022, down from its previous estimate of 3.8%, and also revised down its inflation forecast to 0% from 0.6% previous.
This reinforced market expectations that the BoJ will maintain its ultra-loose monetary policy and lag other major central banks in rolling back the crisis-era stimulus. The Japanese central bank, however, sounded more positive about the longer-term outlook and revised up its growth forecast for the fiscal year to March 2023 to 2.9% from the previous estimate of 2.7%.
Nevertheless, the USD/JPY pair reacted little to the BoJ announcement and Governor Haruhiko Kuroda’s comments at the post-meeting press conference, showing readiness to ease policy further if needed. That said, a modest uptick in the US Treasury bond yields helped limit any deeper losses amid a subdued USD price action and ahead of Thursday's key event/data risks.
The European Central Bank is scheduled to announce its monetary policy decision later during the mid-European session. Apart from this, the Advance US Q3 GDP report should infuse some volatility in the markets and provide a fresh impetus to the USD/JPY pair. Traders might further take cues from the US bond yields and the broader market risk sentiment.
Technical levels to watch
-
07:44
US Dollar Index struggles for direction below 94.00 ahead of key data
- DXY navigates a tight range in the 93.80 region on Thursday.
- US 10y yields drop to the sub-1.55% area, 2y yields rise further.
- Flash Q3 GDP, weekly Claims next of note in the docket.
The greenback keeps the cautious note and hovers around the 93.80 region when measured by the US Dollar Index (DXY).
US Dollar Index now focuses on data
The index alternates gains with losses following Wednesday’s downtick and always looking to the performance of the US cash markets and the broad risk appetite trends.
Indeed, while yields in the front end of the curve extend the advance well north of the 0.50% yardstick - levels last seen back in March 2020 - the belly of the curve navigates the area below 1.55% and the long end dropped well past the 2.00% mark.
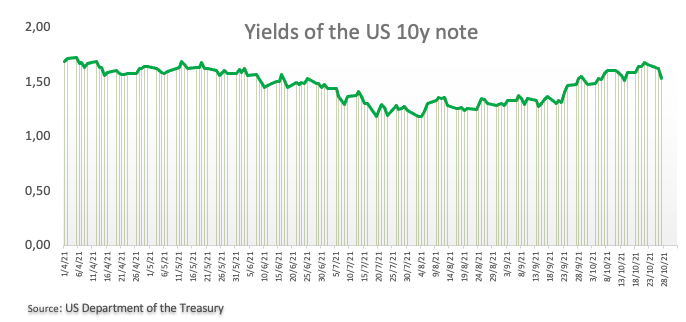
Very interesting session data wise in the US, where advanced Q3 GDP figures will take centre stage along with the usual Initial Claims and seconded by Pending Home Sales. In addition, market participants are expected to closely follow the ECB event, where consensus remains tilted towards a somewhat dovish message from Chairwoman Lagarde.
What to look for around USD
The index gives away some ground following the lack of follow through after the recent surpass of the 94.00 hurdle. The positive performance of US yields, supportive Fedspeak regarding the start of the tapering process as soon as in November or December (also bolstered by latest comments by Chief Powell) and the rising probability that high inflation could linger for longer remain as key factors behind the constructive outlook for the buck in the near-to-medium term.
Key events in the US this week: Flash Q3 GDP, Initial Claims, Pending Home Sales (Thursday) – PCE, Core PCE, Personal Income/Spending, Final Consumer Sentiment (Friday).
Eminent issues on the back boiler: Discussions around Biden’s multi-billion Build Back Better plan. US-China trade conflict under the Biden’s administration. Tapering speculation vs. economic recovery. Debt ceiling debate. Geopolitical risks stemming from Afghanistan.
US Dollar Index relevant levels
Now, the index is losing 0.03% at 93.83 and a break above 94.17 (weekly high Oct.18) would open the door to 94.56 (2021 high Oct.12) and then 94.74 (monthly high Sep.25 2020). On the flip side, the next down barrier emerges at 93.48 (monthly low October 25) followed by 93.32 (55-day SMA) and finally 92.98 (weekly low Sep.23).
-
07:40
USD/JPY: Scope remains to for a reattempt on the 114.55/69 highs – Commerzbank
USD/JPY has again retested the 23.6% retracement at 113.38. Attention is on Fibonacci support at 112.56, however, Karen Jones, Karen Jones, Team Head FICC Technical Analysis Research at Commerzbank, views this only as a correction lower and expects the pair to lurch higher towards 114.55.
USD/JPY may retrace towards the 111.66 July high
“The risk has increased for a deeper sell-off to 112.56, the 38.2% retracement, and potentially the 111.66 July high. This is viewed as a correction lower only and scope remains to for a reattempt on the 114.55/69 highs.”
“Above 114.55/69 we have 115.60, the 61.8% retracement of the move down from 2015 and then the 117.06 the 1998-2021 resistance line.”
-
07:39
BOJ’s Kuroda: Will ease monetary policy further without hesitation as needed
The Bank of Japan’s (BOJ) Haruhiko Kuroda reiterated that the central bank “will ease policy further without hesitation as needed” while speaking at its post-monetary policy meeting press conference scheduled on Thursday.
Additional quotes
Will ease monetary policy further without hesitation as needed.
Need to pay attention of impact from coronavirus on domestic and overseas economies.
Prolonged supply constraints would cause risk of higher inflation.
Risk of inflation as seen overseas would be limited in Japan.
more to come ...
Market reaction
USD/JPY is holding ground, testing daily lows of 113.50 on Governor Kuroda’s comments. The spot ignores the rebound in the US Treasury yields, as the risk-off trading in the global stocks overwhelms. The major was last seen trading at 113.52, 0.22% lower on the day.
-
07:34
Gold Price Forecast: XAU/USD looks north with eyes on ECB, US Q3 GDP
Gold price is building onto Wednesday’s recovery in the lead-up to the European Central Bank (ECB) decision and the US Q3 GDP release. In the view of FXStreet’s Dhwani Mehta, risks appear skewed to the upside for XAU/USD.
Gold teases descending triangle on the 4H chart
“Investors turn cautious and seek shelter in the traditional safe-haven gold, awaiting the ECB outcome for clues on whether they would consider tightening monetary policy earlier than thought.”
“The US Q3 growth figures will provide fresh signs on economic recovery, with the country likely to grow 2.7% QoQ vs. a 6.7% jump seen previously.”
“Gold’s four-hour chart shows that the price has been teasing a descending triangle breakout, with a candlestick closing above the falling trendline resistance at $1803 awaited. If the upside breakout from the triangle materializes, then a fresh advance towards the weekly highs of $1810 cannot be ruled out. The next goal for gold bulls remains the pattern target measured at $1835, where the September month highs coincide.”
“The 21-Simple Moving Average (SMA) at $1798 will be the immediate cushion, below which the daily lows of $1794 could get retested. A sharp drop towards the bullish 50-SMA at $1787 will be on the cards if the latter caves in.”
See – Gold Price Forecast: Nascent XAU/USD bull to knock on the $1980 door – DBS Bank
-
07:24
GBP/JPY consolidates near 156.00 post-BOJ interest rate decision
- GBP/JPY fell for the second straight day on Thursday.
- Brexit headlines, annual budget amid higher inflation expectations weigh on sterling.
- BOJ policy update, Retail Sales data directed the Japanese yen performance.
GBP/JPY continues to extend its previous session’s losses on Thursday . The pair opened higher but failed to sustain the gains and retreated toward the lower level. At the time of writing, the GBP/JPY pair is trading at 156.03 down 0.28% for the day.
The British pound lost against its peers, as investors digested Britain’s annual budget amid higher inflationary pressure, higher interest rates, and energy crisis.The Office for Budgetary Responsibility forecast the Gross Domestic Product (GDP) would grow by 6.5% in 2021, faster than a 4.0% expansion predicted in March.
In the latest development, France threatens to block UK ships from their ports in the next week should the UK refrain from easing controls over fishing. Britain on the other hand showed readiness to retaliate. This, in turn, weighs negatively on the British pound.
It is worth noting that the S&P 500 Futures are trading at 4,548 with 0.08% gains.
On the other hand, the Japanese yen edged higher after the Bank of Japan’s (BOJ) monetary policy decision and economic forecasts came as per the market expectations. The cash rate maintained at -0.1% and its 10-year government bond yield target around 0%.
As for now, the market dynamics continue to influence the pair’s performance in the near future.
GBP/JPY additional levels
-
07:07
USD/CAD: Potential to end the year at 1.20 as BoC pushes tightening expectations higher – ING
In a hawkish shift, the Bank of Canada has decided to end its QE asset purchases immediately and has brought forward its guidance on the first rate hike to mid-2022. In the view of economists at ING, there is the real prospect of 100bp of rate hikes next year, and CAD should remain broadly supported.
100bp for 2022?
“We got a decidedly hawkish outcome with a decision to end QE immediately and forward guidance on the timing of a likely rate hike moved from the second half of 2022 to ‘the middle quarters’ of 2022.”
“The risks appear to be increasingly skewed towards the Bank of Canada hiking interest rates by a full percentage point in 2022.”
“Looking at CAD’s outlook for the rest of 2021, we’d likely need to see some deterioration in market sentiment or witness a correction in oil prices for USD/CAD to stage a sustained rebound. That’s because we do not expect the forthcoming data-flow in Canada to be detrimental to the loonie or to cause a significant re-pricing of rate expectations.”
“We are currently targeting 1.23 in USD/CAD as a year-end forecast, but given the faster-than-expected move by the BoC and seasonal USD weakness in December, we see downside risks (i.e. USD/CAD closer to 1.20) to our scenario.”
-
07:02
Norway Labour Force Survey down to 4.2% in 3Q from previous 5.1%
-
07:02
Natural Gas Futures: Correction in the offing
In light of preliminary prints from CME Group for natural gas futures markets, open interest added to the previous drop and shrank by around 6.5K contracts on Wednesday. Volume followed suit and dropped by more than 3K contracts after two daily builds in a row.
Natural Gas still targets $6.50
Wednesday’s decent advance in prices of natural gas was amidst diminishing open interest and volume, allowing for some correction in the very near term. Looking at the broader picture, the commodity keeps targeting the YTD high around $6.50 per MMBtu (October 6).
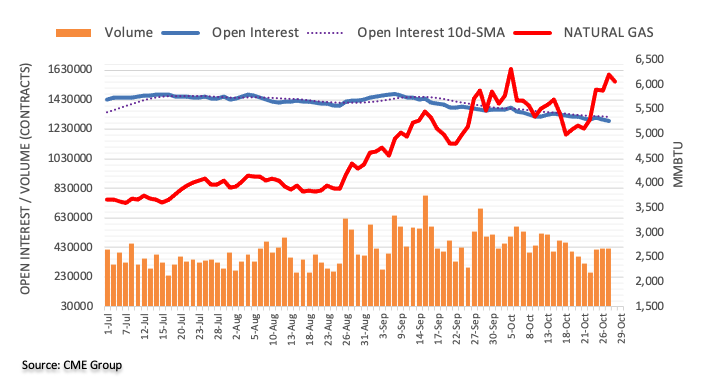
-
07:01
EUR/CHF: Major support down to 1.0623 to hold the initial test – Commerzbank
EUR/CHF is testing major support at 1.0623. Karen Jones, Team Head FICC Technical Analysis Research at Commerzbank, expects the pair to hold this to hold the initial test.
Negative below the 55-DMA at 1.0781
“EUR/CHF has reached its downside target of the 1.0623/43 November 2020 low, the 2016 low and 78.6% retracement at 1.0643. This is a major band of support and we would expect the market to at least hold the initial test.”
“Failure at 1.0623/43 would target the 1.0505 2020 low.”
“Near-term rallies will find initial resistance at the 1.0696 19th August low and the 55-day ma at 1.0781 and will stay offered while capped there. Above the 55-day ma lies the 1.0865 24th September high.”
-
07:00
Norway Retail Sales registered at 0.5% above expectations (-1%) in September
-
07:00
Denmark Industrial Outlook climbed from previous 3 to 10 in October
-
06:52
EUR/GBP Price Analysis: Bears keep reins around 0.8450 ahead of ECB
- EUR/GBP seesaws inside a fortnight-old range, barring early-week fall to 20-month low.
- 12-day-old resistance line, 100-SMA probes buyers ahead of 200-SMA.
- January 2020 bottom will lure the bears during fresh south-run.
- European Central Bank Preview: Finally, some action, but no hopes for the EUR
EUR/GBP remains sidelined around 0.8445, keeping a two-week-long trading range as European traders brace for the key Thursday.
Given the cross-currency pair’s failures to rise past 100-SMA, followed by a downside below a short-term resistance line, the sellers are likely to remain hopeful of printing a fresh multi-month low.
However, the lower end of the stated range around 0.8420 will precede Tuesday’s bottom surrounding the 0.8400 threshold, also the lowest levels since February 2020, to challenge the EUR/GBP bears.
In a case where the quote remains weak past 0.8400, January 2020 bottom and the last year’s low, respectively around 0.8385 and 0.8280, will gain the market’s attention.
On the flip side, the stated trend line resistance and 100-SMA, at 0.8450 and 0.8460 in that order by the press time, will challenge the quote’s corrective pullback.
Even if the quote remains firmer past 0.8460, it needs to cross the weekly top near 0.8470 to recall the EUR/GBP bulls. Following that, the 0.8500 round figure and the mid-October high near 0.8520 should be watched carefully for upside moves.
Overall, the EUR/GBP pair remains inside the bearish trajectory but the European Central Bank (ECB) can direct the moves more precisely.
EUR/GBP: Four-hour chart
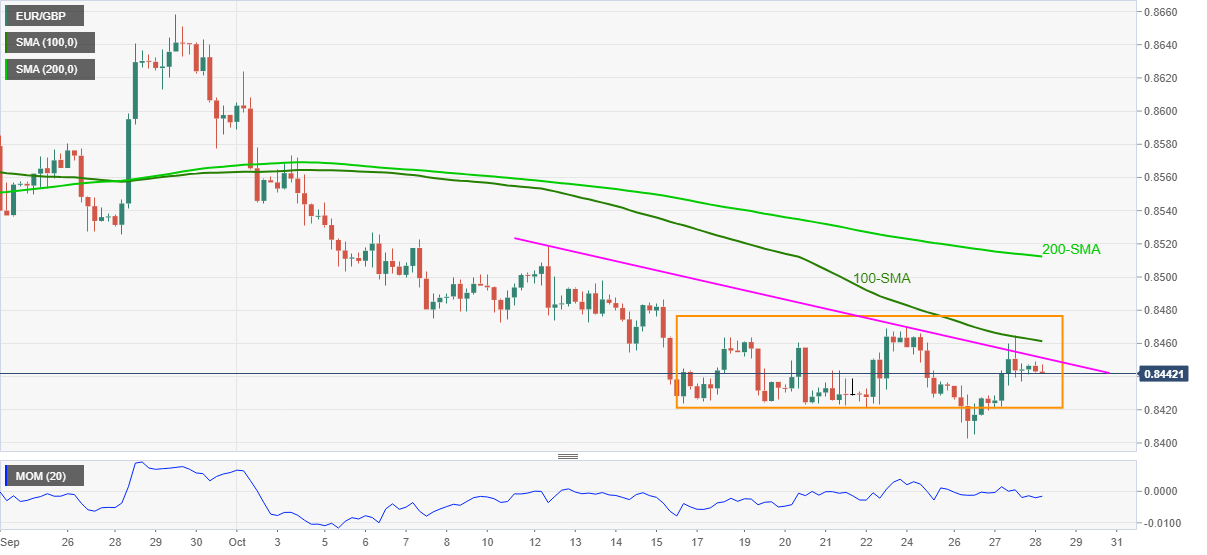
Trend: Bearish
-
06:48
Crude Oil Futures: A sustainable retracement appears unlikely
CME Group’s advanced figures for crude oil futures markets noted investors trimmed their open interest positions for the fifth consecutive session on Tuesday, this time by around 5.7K contracts. In the same line, volume dropped by more than 15K contracts, recording the second pullback in a row.
WTI now looks to $80.00
Wednesday’s selloff in prices of the WTI came in tandem with shrinking open interest and volume. Despite a technical correction was overdue in light of the overbought conditions of the commodity, a convincing and sustainable drop seems to be out of favour at least in the very near term. In the meantime, the $80.00 mark per barrel emerges as the next magnet for sellers for the time being.
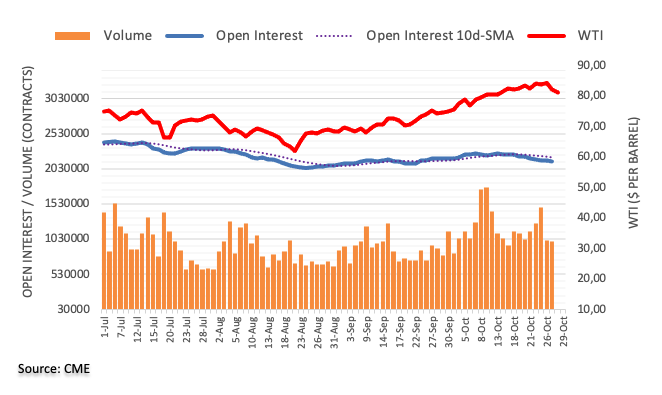
-
06:36
NZD/USD Price Analysis: Upside needs validation above 0.7200
- NZD/USD edges higher on Thursday in the early European trading hours.
- Additional gains for the pair if the price decisively breaks 0.7200.
- Momentum oscillator holds onto the oversold zone with upside bias.
NZD/USD prints gains on Thursday in the initial European trading hours. The pair recovered from the lows of 0.7151 and touched the high of 0.7180. At the time of writing, NZD/USD is trading at 0.7177, up 0.14% for the day.
NZD/USD daily chart
-637709960308425797.png)
On the daily chart, the NZD/USD pair has been on the bull run since October 13, after testing the low of 0.6911. The spot faces pressure near 0.7220, critical resistance zone.
A daily close above the psychological 0.7200 level would meet the next resistance level at 0.7220. The Moving Average Convergence Divergence (MACD) indicator trades in an oversold zone. Any uptick in the MACD could trigger more buying opportunities in the pair to reach the 0.7250 horizontal resistance level.
Next, the bulls would be moving in a fresh upside momentum to recapture the high of May 31 at 0.7285.
Alternatively, if the price breaks below the intraday low it could test the 0.7120 horizontal support level followed by the low of October 19 at 0.7079. The NZD/USD bears would next target the 0.7050 horizontal support level.
NZD/USD additional levels
-
06:29
USD/CAD pares post BOC losses below 1.2400 on downbeat oil prices ahead of US GDP
- USD/CAD consolidates the biggest daily losses in a week, grinds higher of late.
- Oil prices bear the burden of growth fears, DXY fails to justify firmer Treasury yields.
- BOC surprised markets with end of bond purchases, US GDP eyed.
USD/CAD pokes intraday high around 1.2375, up 0.18% on a day while licking the Bank of Canada (BOC)-led wounds ahead of Thursday’s European session. Also adding to the loonie pair’s recent strength could be the weaker prices of Canada’s biggest export item, WTI crude oil.
WTI crude oil drops for the second consecutive day to refresh the fortnight low, down 1.06% around $80.70 by the press time. The black gold remains pressured for the second consecutive day global traders fear monetary policy tightening in the West while the pandemic-linked losses aren’t set in all.
Also underpinning the USD/CAD upside could be the hopes of the US stimulus and Fed tapering tantrums. The White House policymakers push for faster progress on the stimulus and budget talks favor optimists while the escalating US-China tussles over telecom, Taiwan and Afghanistan weigh on the sentiment. Also challenging the mood is the cautious mood ahead of the preliminary reading for the Q3 US GDP which is expected to confirm that the world’s largest economy did suffer from Delta variant breakout and hence it isn’t a good time for the Fed rate hikes.
It’s worth noting that the BOC left the benchmark policy rate unchanged at 0.25%, matching the wide market forecast. However, the Canadian central bank’s end to the weekly purchases of the government bonds surprised markets. Also fueling the Canadian dollar (CAD) were the comments from Governor Tiff Macklem who said, “We will consider raising rates sooner than we had previously thought.
Amid these plays, US Treasury yields consolidate the heaviest daily fall since mid-August, recently picking up bids to 1.55%, up 2.6 basis points (bps), whereas the stock futures print mild gains at the latest.
Although the mixed concerns highlight oil moves as the key catalyst for the immediate USD/CAD performance, today’s US Q3 GDP will be crucial to watch.
Read: US Third Quarter GDP Preview: A most uncertain estimate
Technical analysis
The 100-SMA on the four-hour (4H) chart and the upper line of a seven-week-old falling wedge, around 1.2430, becomes the key short-term hurdle for the USD/CAD traders to watch during further recovery moves.
-
06:26
Gold Futures: Room for some consolidation
Open interest in gold futures markets shrank by just 52 contracts on Wednesday, reaching the second consecutive daily pullback considering flash data from CME Group. In the same line, volume maintained the choppiness unchanged an went down by nearly 15K contracts.
Gold looks to regain $1,800
Gold prices reversed Tuesday’s sharp pullback and managed to regain the 200-day SMA and above around $1,790. The move, however, was amidst shrinking open interest and volume, which opens the door to some corrective move or the start of some consolidation in the very near term.
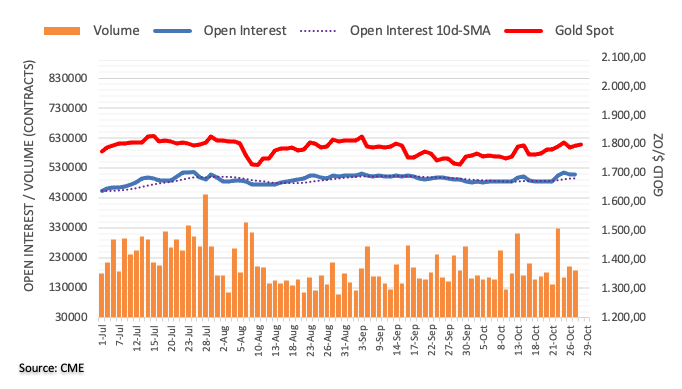
-
05:54
Asian Stock Market: Fears of central banks moves dominate ahead of US GDP
- Asian equities remain pressured amid hopes of monetary policy tightening, challenges to growth.
- US stimulus expectations fail to recall bulls amid Sino-American tussles.
- RBA refrains from intervention despite firmer yields, Debelle cites inflation fears.
- US GDP eyed to confirm Fed tapering tantrums, ECB on the watcher’s list too.
Asia-Pacific markets print losses during early Thursday as investors fear an end to the easy money policies even when the world isn’t fully recovered from the pandemic-led losses. While portraying the mood, the MSCI’s index of Asia-Pacific shares outside Japan drops 0.22% while Japan’s Nikkei 225 portrays 1.0% daily loss heading into the European session.
Market sentiment dwindles amid firmer US Treasury yields, ignoring the mildly bid S&P 500 Futures. That said, the US 10-year Treasury yields consolidate the heaviest daily fall since mid-August, recently picking up bids to 1.55%, up 2.6 basis points (bps).
The underlying reasons could be linked to the Bank of Canada’s (BOC) end of bond purchases as well as the UK’s tapering news. Further, the RBA Deputy Governor Guy Debelle also accepted the fears of heating inflation pressure inside the Pacific economy, indirectly signaling the rate hike woes.
It’s worth mentioning that US-China tussles escalate over telecom, Taiwan and Afghanistan while the policymakers in the White House push for faster progress on the stimulus and budget talks.
Amid these plays, shares indices from Australia and New Zealand fall around half a percent whereas those from China and Hong Kong replicate the downside moves. South Korea’s KOSPI bucks the trend with mild gains whereas Indonesia’s IDX Composite and India’s BSE Sensex remain on the backfoot.
The market fears could also be witnessed in the commodity prices but the US dollar index struggles to cheer the cautious moves as traders await the preliminary readings of the US Q3 GDP. Although the downbeat expectations from the US GDP can challenge the Fed tapering concerns, multi-year high inflation expectations and global bond rally, coupled with the steepening of the yield curves underpin fears of the tighter monetary policy and exert downside pressure on the equities.
Read: US Third Quarter GDP Preview: A most uncertain estimate
-
05:42
USD/INR Price News: Retreats below 75.00 ahead of US GDP data
- USD/INR edges lower on Thursday in the early European session.
- INR appreciates amid a risk-on mood.
- The US Dollar Index remains steady near 93.80, exterting pressure on USD/INR.
USD/INR came under pressure after testing the intraday high around 75.15 on Thursday. The pair continued to trade in the 74.80 and 75.20 range for the past four sessions, following the depreciative move in the greenback. At the time of writing, USD/INR is trading at 74.95, down 0.13% for the day.
The US Dollar Index, which tracks the greenback performance against its six major rivals, trades at 94.83 with 0.02% losses. Investors digested Bank of Canada’s (BOC) hawkish tone. The BOC ended its quantitative easing (QE) and signaled that an interest rate hike may be coming sooner than expected amid concerts over higher inflation. The Bank of Japan (BOJ) maintained the status quo.
In addition to that, the European Central Bank (ECB) meeting is due later in the day.
As for now, investors are waiting for the US Gross Domestic Product, and Initial Jobless Claims data to gauge the market sentiment.
USD/INR additional levels
-
05:21
GBP/USD: Brexit woes battle bond tapering around 1.3750, US GDP eyed
- GBP/USD consolidates weekly losses, picks up bids to refresh intraday high of late.
- France threatens to block UK ships, Britain vows to retaliate in a fresh Brexit tussle.
- Chatters around BOE rate hike renews on reduced bond issuance in budget 2021.
- Bears await US GDP to justify Fed tapering tantrums, multi-year high inflation expectations.
GBP/USD pokes intraday high around 1.3750 as traders pare weekly losses heading into Thursday’s London open.
In doing so, the cable pair portrays the market’s indecision ahead of the key preliminary reading of the US Q3 GDP and the European Central Bank (ECB) meeting. Also restricting the quote’s moves are the mixed signals from home.
Among the negative catalysts are the fears of Fed tapering and Brexit drama at home. On the contrary, the likely BOE rate hike and optimism surrounding the US stimulus keep GBP/USD buyers hopeful.
In a stark Brexit action, France showed readiness to block the British ships from their ports in the next week should the UK refrain from easing controls over fishing. Britain, on the other hand, marked the ability to retaliate. Amid these plays, Chairman of the UK’s Office for Budget Responsibility (OBR) Richard Hughes said, per the BBC, “The impact of Brexit on the UK economy will be worse in the long run compared to the coronavirus pandemic.”
Alternatively, UK Chancellor Rishi Sunak announced measures relating to infrastructure, alcohol duty cuts and an increased budget for all departments totalling around £75 billion of giveaways. However, the emphasis on bond purchase reduction teased GBP bulls amid hopes of the Bank of England (BOE) rate hike.
On a different page, US-China tussles escalate over telecom and Taiwan while the policymakers in the White House push for faster progress on the stimulus and budget talks. It should be noted, however, that the escalating Fed tapering concerns underpin the US Treasury yields and probe the US Dollar Index (DXY) bears ahead of the key GDP data.
While the Brexit drama is likely to weigh on the GBP/USD prices, stronger-than-expected US Q3 GDP will strengthen the Fed rate hike expectations and add to the bearish impulse.
Read: US Third Quarter GDP Preview: A most uncertain estimate
Technical analysis
The cable pair broke an ascending support line, now resistance, from September 30 the previous day but refrained from closing below 50-DMA, around 1.3710 now. Given the bullish MACD signals and multiple supports around the 1.3710-3700 area, comprising 50-DMA and 50% Fibonacci retracement (Fibo.) of late July-September fall, the GBP/USD pair’s further downside remains doubtful. Meanwhile, a convergence of the previous support and 61.8% Fibo. level near 1.3770-75 guards the quote’s corrective pullback ahead of the 200-DMA level surrounding 1.3855.
-
04:51
WTI Price Analysis: Renews fortnight low near $80.00, focus on short-term support line
- WTI takes offers to refresh multi-day day low as sellers attack two-month-old trend line support.
- Pullback in RSI from overbought area, bearish MACD signals hints at further pullback.
WTI remains on the back foot around a two-week bottom close to $80.00 during early Thursday. In doing so, the black gold pokes the key support line from late August while declining for the second consecutive day.
Given the RSI pullback from the overbought area and recently bearish MACD signals giving support to the latest WTI weakness, the quote is likely to extend the losses.
However, a daily closing below the stated support line near $80.70 becomes necessary for the short-term oil bears to take entries. Also acting as a hurdle is the $80.00 psychological magnet.
Should the quote stay depressed past $80.00, odds of witnessing a WTI fall towards July’s top near $76.40 can’t be ruled out.
Alternatively, corrective pullback needs to cross the $82.70 support to recall the WTI bulls. However, an upward sloping trend line from early March, near $84.55, will be a tough nut to crack for them.
Overall, oil prices are likely to witness a pullback but the trend reversal isn’t on the cards.
WTI: Daily chart
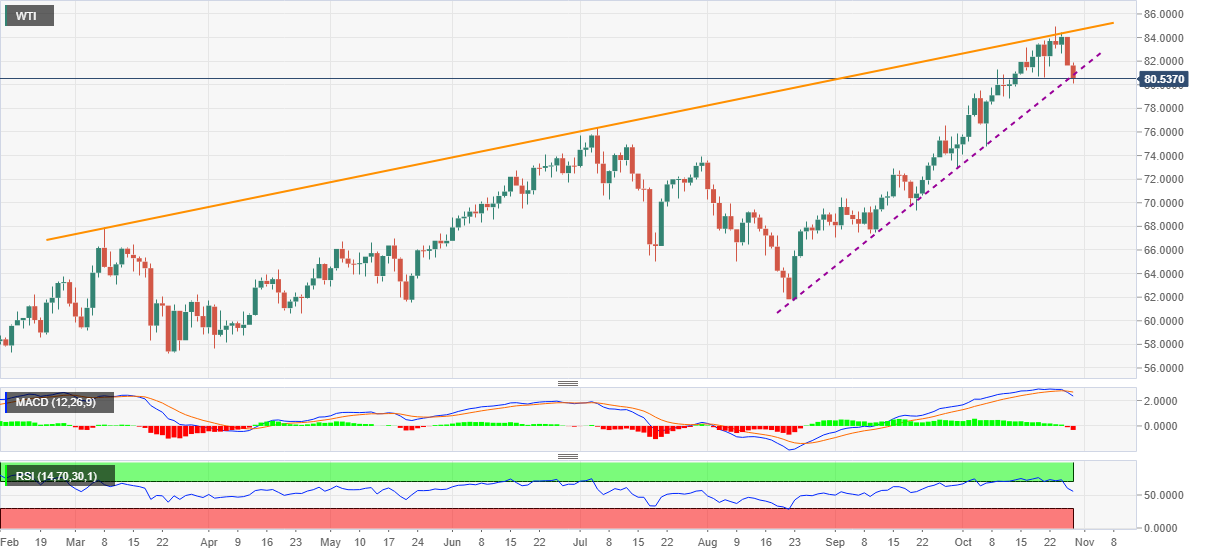
Trend: Further weakness expected
-
04:48
AUD/JPY defends 85.00 post-BOJ decision
- AUD/JPY pares part of its ealry losses in the Asian session on Thursday.
- Major Australian banks project early RBA rate hike estimates.
- BOJ maintains the status quo, slashes GDP and inflation forecasts.
AUD/JPY edges lower for the second straight day. After testing the high of 86.07 in the US session, the pair closed lower near 85.50. As of writing, the AUD/JPY is trading at 85.26, down 0.29% for the day.
Investors favored the riskier asset after the Bank of Japan (BOJ) kept its benchmark rate unchanged at -0.10% with the 10-year Japanese Government Bond (JGB) yield rate at around 0% during its October meeting by an 8-1 vote, as widely expected. Further, in its latest publications, the BOJ expects core CPI at 0.0% versus 0.6% forecast in July while the FY 2021-22 Gross Domestic Product (GDP) arrives at +3.4% compared to +3.8% previous expectations.
It is worth noting that S&P 500 Futures are trading at 4,551, up 0.14% for the day.
On the other hand, the aussie holds the gains on the early rate hikes by the Reserve Bank of Australia (RBA). The Commonwealth Bank of Australia (CBA),one of Australia’s ‘Big 4’ banks, forecasted a rate hike in November of 2022, to 0.25% from previous bets for a May 2023 hike.
As for now, the divergent policy stand between RBA and BOJ amid risk-on mood will affect the pair’s performance in the short term.
AUD/JPY additioanl levels
-
04:34
Gold Price Forecast: XAU/USD stays on the way to $1,810 hurdle ahead of ECB, US GDP
- Gold consolidates weekly losses during two-day uptrend, eases from daily high of late.
- US dollar differs from firmer Treasury yields, helps gold buyers amid market’s indecision, central bank moves.
- US GDP, ECB and US stimulus updates are the key for fresh impulse.
- Gold Price Forecast: Bulls trying to recover the 1,800 mark
Gold (XAU/USD) flirts with the $1,800 threshold, keeps the previous day’s rebound amid softer USD during early Thursday.
The yellow metal recovered the previous day from the weekly bottom as the US dollar faded the bounce off a one-month low, tracking the US Treasury yields. The latest run-up in the gold prices, however, could be linked to the market’s fears of an end to the easy money policies introduced during the pandemic. It’s worth noting that the hopes of US stimulus and Sino-American tussles are extra catalysts that helped the gold buyers at the latest.
The US 10-year Treasury yields consolidate the heaviest daily fall since mid-August, recently picking up bids to 1.55%, up 2.6 basis points (bps). The reason could be linked to the expectations that the US Federal Reserve (Fed) and the European Central Bank (ECB) will track their global counterparts and tighten the strings of monetary policies. The market consensus takes clues from the firmer inflation expectations and recently firmer data from the developed economies, as well as receding fears of the coronavirus.
On Wednesday, the Bank of Canada (BOC) announced the end of bond purchases and the UK also cuts bond issuance. Further, Australia’s strong prints of the RBA Trimmed Mean CPI also push the Reserve Bank of Australia (RBA) towards a rate hike.
Talking about the data, a lower-than-expected US Good Trade Balance and improvement in Durable Goods Orders probed the US dollar bulls ahead of the key Q3 GDP, indirectly helping gold buyers.
Elsewhere, the White House’s (WH) push for faster progress over the budget talks ahead of the December deadline for the debt ceiling extension keeps the gold buyers hopeful. The news joins the Democratic Party members’ scheduling of an additional meeting for President Joe Biden to sort out some last issues with expectations of a deal on the much-awaited stimulus.
Furthermore, the US-China tussles regain momentum, recently over telecom and Taiwan whereas the Evergrande fears aren’t off the table, which in turn underpin the gold’s safe-haven demand.
Against this backdrop, the US stock futures ignore the firmer Treasury yields and the US Dollar Index (DXY) stays on the back foot ahead of the key data/events.
Looking forward, firmer-than-expected preliminary prints of the US Q3 GDP will help the Fed hawks and weigh on the market sentiment, helping the US dollar to regain upside momentum. However, the ECB’s likely hawkish performance may challenge the greenback and help the gold buyers to keep the reins.
Read: US Third Quarter GDP Preview: A most uncertain estimate
Technical analysis
Gold’s failure to cross a two-month-old horizontal hurdle doesn’t allow sellers to sneak in as a convergence of 50-DMA and a fortnight-long rising trend line restricts short-term downside.
Hence, bullish MACD and firmer RSI line, not overbought, keeps gold buyers hopeful to cross the key resistance area surrounding $1,810-11 until staying beyond $1,780 support confluence.
During the quote’s upside past $1,811, the double tops marked in July and September close to $1,834 will be crucial to watch.
On the contrary, a sustained downside below $1,780 may aim for the latest swing low around $1,760 before directing gold sellers to the horizontal line comprising multiple levels marked since September 16, near $1,745.
To sum up, gold remains in a bullish consolidation phase but has tough barriers to the north.
Gold: Daily chart
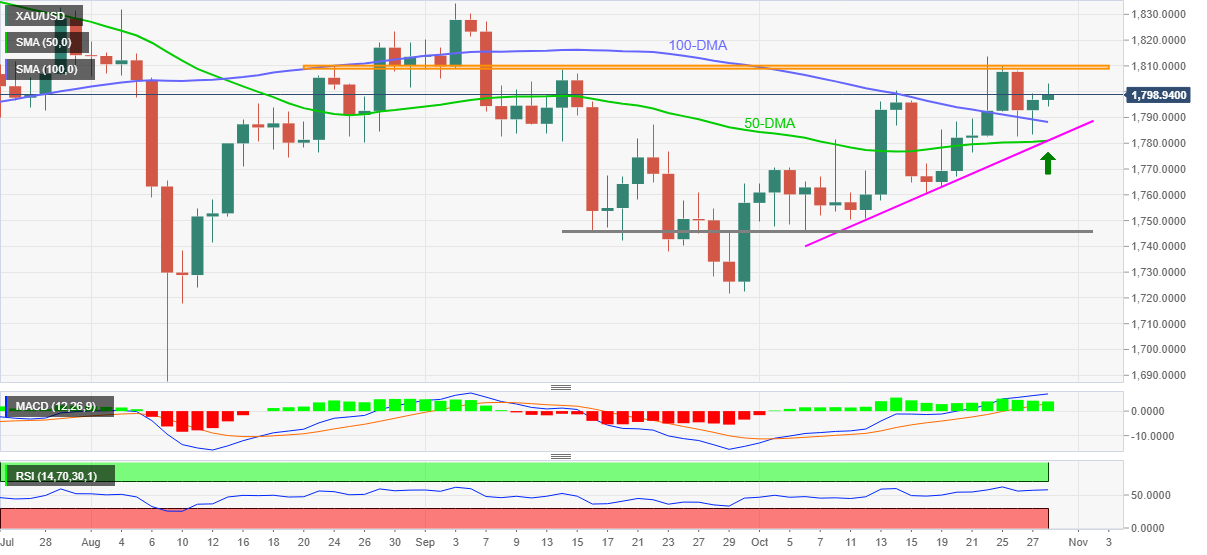
Trend: Further upside expected
-
04:08
USD/JPY remains pressured around 113.50 on BOJ inaction, Kuroda, US GDP eyed
- USD/JPY holds lower grounds near intraday low following the BOJ status quo.
- BOJ matches wide market forecast for inaction, revises down inflation and GDP forecasts.
- Market’s indecision ahead of the US GDP, ECB restricts moves amid cautious optimism.
USD/JPY tests the intraday low surrounding 113.50 during the second consecutive daily fall on early Thursday. In doing so, the yen pair pays a little heed to the Bank of Japan’s (BOJ) widely anticipated moves.
The BOJ once again proved the market right by holding the benchmark rate unchanged at around -0.10% with the 10-year Japanese Government Bond (JGB) yield target near 0%. In addition to the rate settings and bond targets, the BOJ also announced a downward revisiting to the quarterly economic forecasts for 2021-22. In its latest prediction, the BOJ expects core CPI to print 0.0% figures versus 0.6% forecast in July while the FY 2021-22 real GDP consensus arrives at +3.4% compared to +3.8% previous expectations.
Read: BOJ downgrades FY 2021/22 growth and inflation outlooks
It should be noted that the virus-led moves have already been expected and the same could keep the carry better the US Federal Reserve (Fed) and the BOJ, which in turn may favor the JPY demand. Also, the risk-safety allure of the Japanese currency gains momentum in times when the leading central banks are up for dialing back the easy money policies.
That being said, risk appetite dwindles amid firmer US Treasury yields and mildly bid stock futures. The US 10-year Treasury yields recover the heaviest daily fall since mid-August, recently picking up bids to 1.55%, up 2.2 basis points (bps), as market players expect further tightening of the monetary policies by the key global central banks. The market consensus could be linked to the firmer inflation expectations and recently firmer data from the developed economies, as well as receding fears of the coronavirus.
Backing the moves are the latest updates from Canada, the UK and Australia that should have favored the US Treasury yields to consolidate the previous day’s heavy fall. The Bank of Canada (BOC) announced the end of bond purchases and the UK also cuts bond issuance. Further, Australia’s strong prints of the RBA Trimmed Mean CPI also push the Reserve Bank of Australia (RBA) towards a rate hike.
Other than the central bank chatters, cautious mood ahead of the US Q3 GDP and European Central Bank (ECB) meeting joins the fresh US-China tussles over telecom and Taiwan issues to weigh on the USD/JPY prices. It should be noted that the early Asian releases of Japanese Retail Sales for August were firmer and added strength to the JPY.
Looking forward, the pair traders will pay attention to the speech from BOJ Governor Haruhiko Kuroda for fresh impulse ahead of the key US GDP. Also important will be chatters surroudning the US stimulus package and budget deal as Democrats eye an agreement on Thursday.
Technical analysis
USD/JPY remains in a bullish consolidation mode between 113.20 and 114.45 irrespective of the bearish MACD signals. However, a downside break of the monthly support can entertain short-term sellers.
-
04:04
EUR/USD hovers around 1.1600 ahead of ECB, US GDP
- EUR/USD consolidates near 1.1600 ahead of the ECB verdict.
- US Treasury yields rebound despite the lower global stocks.
- ECB policy meeting, US GDP and Initial Jobless Claims hold the key this Thursday.
EUR/USD trades cautiously on Thursday in the Asian trading hour. The pair recovered from the recent lows around the 1.1580 zone. At the time of writing, EUR/USD is trading at 1.1608, up 0.03% for the day.
The shared currency gained some traction following Germany's GFK Consumer Confidence, which improved from 0.4 to 0.9 in October, beating market expectations. Also, the EU reported September Money Supply, which increased by 7.4%, below the market consensus.Traders are now bracing for the European Central Bank (ECB) monetary policy decision. The ECB is widely expected to maintain its dovish stance but policymakers may pave the way for a tighter monetary policy.
The greenback remains steady at around 93.80, underpinned by the rebound in the US T-bonds yields. The US Durable Goods Orders fell 0.4% in September, better than the -1.1% expected. The preliminary estimate of the September Goods Trade Balance posted a deficit of $96.3 billion, larger than the previous $-89.4 billion.
As for now, traders are waiting for the Eurozone Consumer Confidence, ECB Interest Rate Decision, US Gross Domestic Product (GDP), and Initial Jobless Claims to take fresh trading impetus.
EUR/USD technical levels
-
03:54
BOJ downgrades FY 2021/22 growth and inflation outlooks
Core CPI median forecast for fiscal 2021/22 at 0.0% vs +0.6% in July
Core CPI median forecast for fiscal 2022/23 at +0.9% vs +0.9% in July
Core CPI median forecast for fiscal 2023/24 at +1.0% vs +1.0% in July
Real GDP median forecast for fiscal 2021/22 at +3.4% vs +3.8% in July
Real GDP median forecast for fiscal 2022/23 at +2.9% vs +2.7% in July
Real GDP median forecast for fiscal 2023/24 at +1.3% vs +1.3% in July
Japan's economy likely to recover, accelerate pace of growth as pandemic's impact subsides.
Japan's consumer inflation likely to gradually accelerate.
Must be vigilant to risks including developments of pandemic, impact on economies.
Japan's economy remains in severe state but picking up as a trend.
Exports, output weak due to supply constraints but increasing as a trend.
Capex showing weakness in some sectors but picking up as a whole.
Service spending remains under pressure but consumption showing signs of pickup.
Japan inflation expectations picking up.
High uncertainties over COVID-19 impact on consumption activities.
Need to pay attention to effects of supply-side constraints.
As impact of COVID-19 wanes demand imbalances and output and shipping bottlenecks likely to go to resolution.
more to come ...
-
03:49
BOJ keeps policy on hold, tweaks forecasts
At its October monetary policy meeting, the Bank of Japan (BOJ) left its policy settings unadjusted once again but revised the economic forecasts.
Key takeaways
Maintains short-term interest rate target at -0.1%.
BOJ maintains 10-year JGB yield target around 0%.
BOJ made decision on yield curve control by 8-1 vote.
Market reaction
USD/JPY remains unfazed near daily lows of 113.54 on the BOJ’s status-quo, down 0.18% on the day.
-
03:47
Japan BoJ Interest Rate Decision meets forecasts (-0.1%)
-
03:45
Japan: BoJ Interest Rate Decision, -0.1% (forecast -0.1%)
-
03:38
AUD/USD bounces-back above 0.75 amid rising bets of earlier RBA rate hike
- AUD/USD recaptures 0.7500 amid hawkish RBA expectations.
- Leading Australian banks bring forward their RBA rate hike calls.
- The aussie April 2024 yields jump, focus shifts to the US Q3 GDP release.
AUD/USD is staging a decent comeback above 0.7500, in a turnaround from daily lows of 0.7480, as the investors shrug off the risk-off market mood amidst rising bets of an earlier rate hike by the Reserve Bank of Australia (RBA).
In evidence of increased hawkish expectations from the RBA, the Australian April 2024 bond yield jumped to 0.5%, five times higher than the central bank’s target of 0.1%. This comes after the country’s RBA Trimmed Mean CPI rose to 0.7% QOQ in Q3 vs. 0.5% expectations and 0.5% last.
Surging price pressures fanned RBA rate hike calls, with the Commonwealth Bank of Australia (CBA) bringing forward its rate hike expectations to November 2022 from previous bets for a May 2023 hike. The bank said that Wednesday’s Q3 CPI data was an inflection point.
However, the renewed upside in the pair could lack follow-through buying, as the US dollar remains on the front foot amid persisting risk-off mood. The US earnings reports underscored the supply chain crisis amid the persistence of growing price pressures, weighing down on the investors’ sentiment.
Investors also remain cautious ahead of the critical US Q3 GDP release, which could throw further light on the economic recovery while the Fed remains on track to scale back bond-buying next month.
AUD/USD technical levels to consider
-
03:30
Commodities. Daily history for Wednesday, October 27, 2021
Raw materials Closed Change, % Brent 84.04 -2.37 Silver 24.038 -0.4 Gold 1796.648 0.21 Palladium 1954.19 -2.12 -
03:01
S&P 500 Futures: US stimulus hopes favor bulls despite Treasury yields rebound
- S&P 500 Futures consolidates recent losses amid cautious optimism.
- US Democrats expect deal on President Biden’s stimulus plan on Thursday.
- Fed tapering tantrum, cautious mood ahead of US GDP, ECB challenge buyers.
S&P 500 Futures print mild gains around 4,550 during early Thursday. The risk barometer cheers the hopes of US stimulus while also marking a cautious mood ahead of the key data/events to consolidate the latest losses around the record top.
Late on Wednesday, Bloomberg came out with the news suggesting the White House’s (WH) push for faster progress over the budget talks ahead of the December deadline for the debt ceiling extension. The news joins the Democratic Party members’ scheduling of an additional meeting for President Joe Biden to sort out some last issues with expectations of a deal on the much-awaited stimulus.
Elsewhere, the US 10-year Treasury yields recover the heaviest daily fall since mid-August, recently picking up bids to 1.55%, up 2.2 basis points (bps), as market players expect further tightening of the monetary policies by the key global central banks. The market consensus could be linked to the firmer inflation expectations and recently firmer data from the developed economies, as well as receding fears of the coronavirus.
Also, the latest updates from Canada, the UK and Australia hints at an end to the easy money saga and should have favored the US Treasury yields. That being said, the Bank of Canada (BOC) announced the end of bond purchases and the UK also cuts bond issuance. Further, Australia’s strong prints of the RBA Trimmed Mean CPI also push the Reserve Bank of Australia (RBA) towards a rate hike.
Additionally favoring the US Treasury yields were the latest challenges to the market sentiment from the US-China front as the world’s top two economies again jostle over issues concerning telecom and Taiwan.
It’s worth noting that a good start to the Q3 earnings season and the recent positive performance of Wall Street adds to the S&P 500 Futures’ strength.
Amid these plays, the US Dollar Index (DXY) remains pressured around 94.00 while the commodities trade is mixed at the latest.
Moving on, the ECB and the US Q3 GDP will be the key events for the day while chatters concerning US stimulus adds burden on the market watchers.
Read: US Stocks Forecast: Nasdaq supported by tech big caps
-
02:59
USD/INR Price News: Indian Rupee on the verge of an upside breakout
- USD/INR is attempting a breakout of the daily flag pattern.
- Bulls have their eyes on a run towards 75.60 recent highs.
USD/INR has been drifting higher on Thursday and is on the verge of a significant breakout to the upside. The following illustrates the relationship to the performs in the US yield curve, the greenback as measured by the DXY index and USD/INR.
USD/INR daily chart
-637709826224775283.png)
The price is creeping higher and despite the overnight drop in 10-year US yields on Wednesday. US benchmark 10-year Treasury yields dropped to a two-week low while the 2-year Treasury yields hit 19-month highs, further flattening the yield curve, as the possible timing of the Federal Reserve's first interest rate rise came into sharper focus.
The US dollar remains firm regardless but it is being helped along in Asia by a rise in the 2-year yield which has extended the prior day's jump of 17.5%. Today, they are up 3.3%.
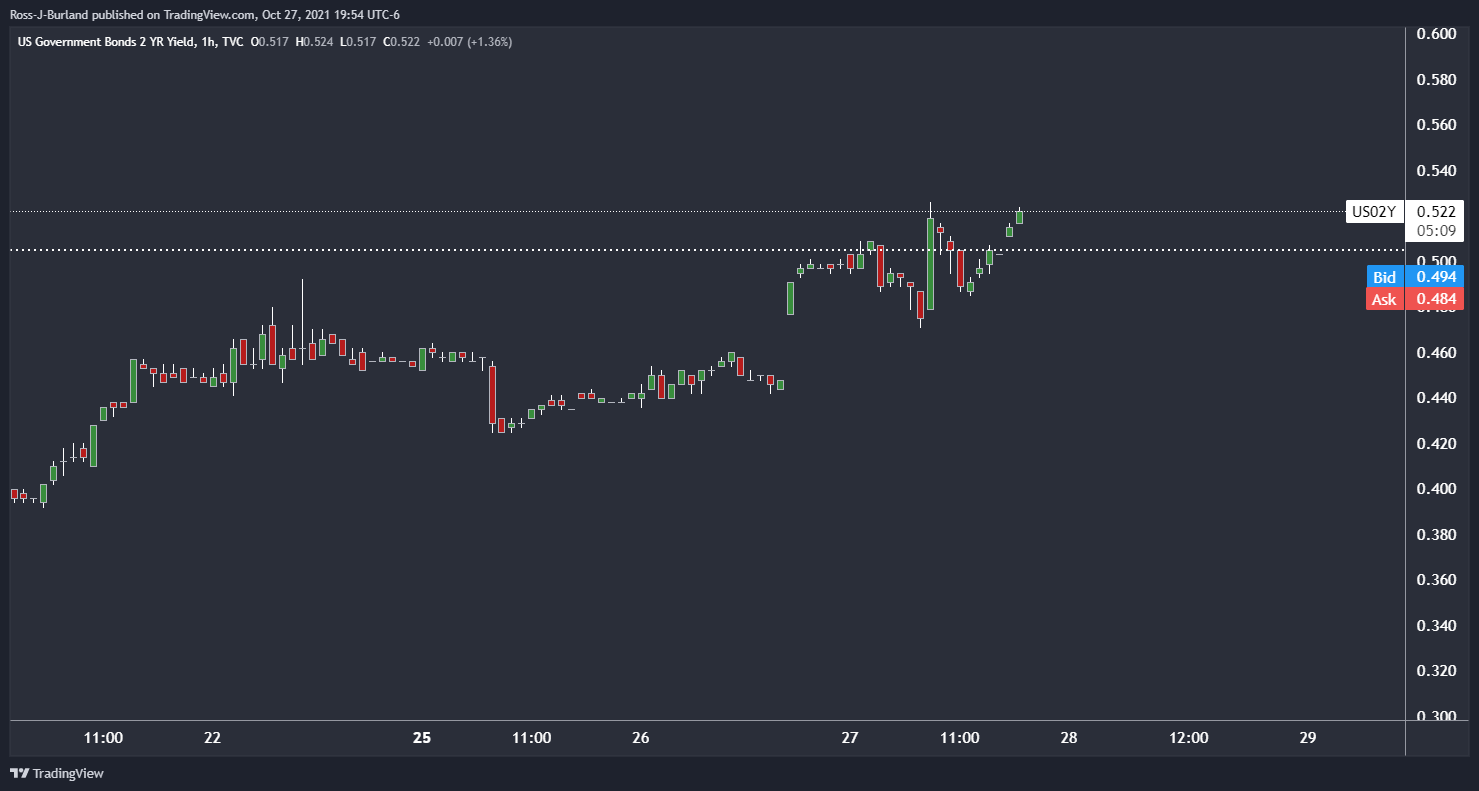
The DXY, however, struggles to break the daily horizontal resistance as follows:
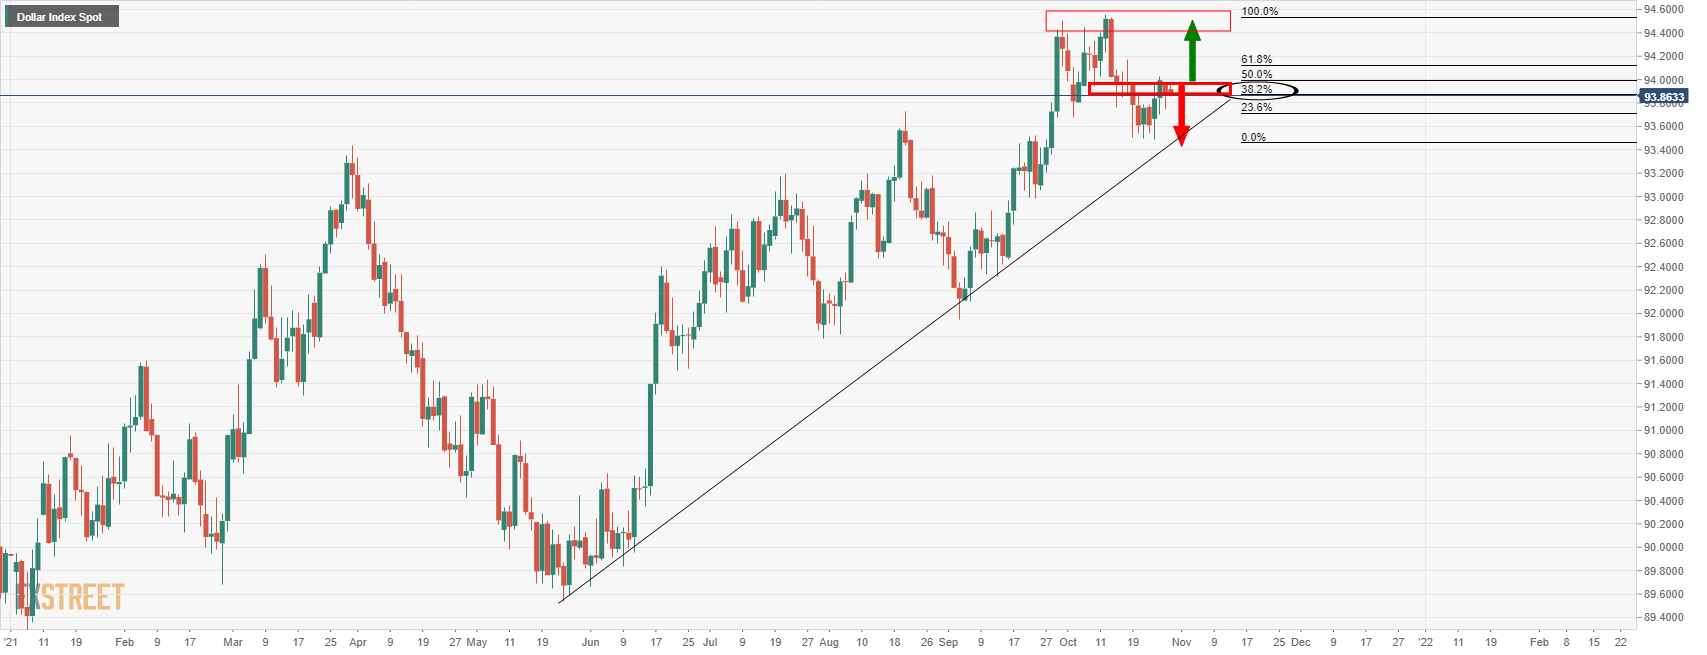
-
02:44
New Zealand’s Hipkins: Will begin phased easing of border restrictions for fully vaccinated
New Zealand will begin phased easing of border restrictions for fully vaccinated people arriving from abroad, the country’s COVID-19 Response Minister Chris Hipkins said in a news conference in Wellington on Thursday.
Additional takeaways
The amount of time travelers will have to spend in government-run hotel quarantine facilities will be halved to 7 from 14 days from Nov. 14.
“When managed isolation and quarantine system MIQ was introduced we didn’t have the vaccine so every arrival posed a high level of risk.”
“With most people returning now fully vaccinated the risk profile of international arrivals has changed so it is time to start changing our MIQ settings.”
Market reaction
These comments fail to have any impact on the kiwi dollar, as NZD/USD is testing lows near 0.7150, down 0.17% on the day.
-
02:36
USD/TRY Price Analysis: 50-SMA, three-week-old support line test bears
- USD/TRY snaps three-day downtrend, remains sidelined of late.
- Sluggish momentum line doubts further weakness, 100-SMA adds to the downside filters.
USD/TRY takes rounds to $9.5130, portraying the sideways move to consolidate weekly losses during early Thursday.
In doing so, the Turkish Lira (TRY) pair seesaws around 50-SMA and an ascending support line from October 08.
Given the sluggish Momentum line and the stated strong supports, the latest pullback is likely to be reversed.
However, $9.6000 and $9.7180 may challenge the USD/TRY bulls before directing them to the record top surrounding $9.8505.
On the contrary, the 50-SMA and near-term key support line, respectively around $9.4550 and $9.4100, could challenge the quote’s immediate declines.
Even if the quote drops below the $9.4100 level, the 100-SMA surrounding $9.2400 will be challenging the USD/TRY bears.
To sum up, USD/TRY bulls remain in command despite the latest pullback.
USD/TRY: Four-hour chart
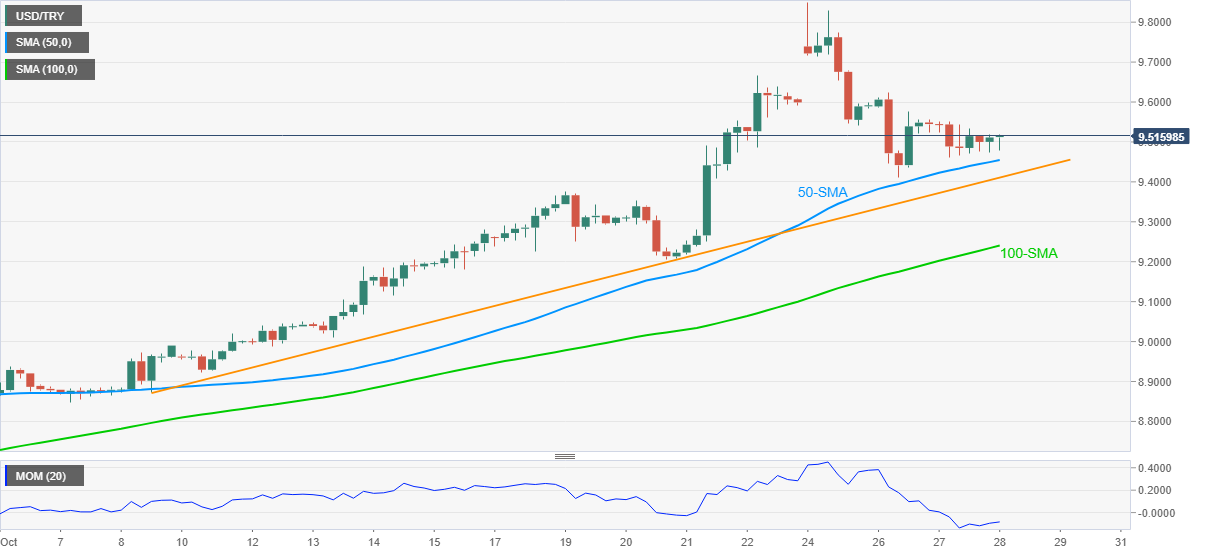
Trend: Recovery expected
-
02:20
When is the BOJ rate decision and how could it affect USD/JPY?
Early on Thursay, around 03:00 AM GMT, the Bank of Japan (BOJ) will provide the decision of its routine monetary policy meeting. Following the rate decision, BOJ Governor Haruhiko Kuroda will attend the press conference, around 06:00 AM GMT, to convey the logic behind the latest policy moves.
The Japanese central bank is widely expected to keep the short-term interest rate target at -0.1% while directing 10-year Japanese Government Bond (JGB) yields toward zero.
Although the BOJ isn’t expected to offer any change in its monetary policy, the quarterly economic forecasts will be important to watch following the multi-day activity restrictions in the key prefectures, including Tokyo, due to the coronavirus (COVID-19). Hence, today’s monetary policy meeting is less likely to become a non-event like always.
Ahead of the event, Westpac said,
The Bank of Japan is expected to keep its basic policy settings intact yet again, most notably the “around zero percent” yield on the 10-year bond. In the quarterly forecasts, the BoJ is expected to trim its 2021 GDP projection but nudge up 2022. Inflation forecasts are likely to remain below the 2% target through 2023 – no troubling inflation surge in Japan at this stage.
Additionally, FXStreet’s Dhwani Mehta said,
The Fed-BOJ monetary policy divergence will continue to play out in favor of the US dollar in the coming months. However, the Japanese yen could likely extend the correction from multi-year lows of 114.69 against the greenback on the BOJ announcements. The prevalent market mood and the dynamics in the dollar and yields will also have a significant bearing on the major at the time of the BOJ decision.
How could it affect the USD/JPY?
USD/JPY remains sidelined around 113.80 following the first daily loss of the week. The yen pair remains pressured as the US Treasury yields pick up in a consolidation mode before the key preliminary US Q3 GDP and monetary policy meeting of the European Central Bank (ECB). Also challenging the quote is the market’s rush for risk-safety ahead of the BOJ event.
While portraying the market moves, the 10-year Treasury yields drop 2.3 basis points (bps) to 1.55% but the S&P 500 Futures print mild gains by the press time.
Given the wide division between the policymakers of the US Federal Reserve (Fed) and the BOJ, the carry trade opportunities may widen should the BOJ choose to keep the easy money flowing by citing the virus-led economic hardships. The same should help the USD/JPY prices if the policymakers choose to keep the monetary policy unchanged and sound dovish. In an alternative case, the USD/JPY reaction will depend upon today’s preliminary US Q3 GDP amid the Fed tapering tantrums.
Technically, USD/JPY remains in a bullish consolidation mode between 113.20 and 114.45.
Key Notes
USD/JPY consolidates below 114.00 ahead of BOJ decision, US critical data
BOJ Preview: Focus on outlook tweaks ahead of general election
About BoJ Rate Decision
BoJ Interest Rate Decision is announced by the Bank of Japan. Generally, if the BoJ is hawkish about the inflationary outlook of the economy and rises the interest rates it is positive, or bullish, for the JPY. Likewise, if the BoJ has a dovish view on the Japanese economy and keeps the ongoing interest rate, or cuts the interest rate it is negative, or bearish.
-
02:18
USD/CNY fix: 6.3957 vs the last close of 6.3915
In recent trade today, the People’s Bank of China (PBOC) set the yuan (CNY) at 6.3957 vs the last close of 6.3915.
About the fix
China maintains strict control of the yuan’s rate on the mainland.
The onshore yuan (CNY) differs from the offshore one (CNH) in trading restrictions, this last one is not as tightly controlled.
Each morning, the People’s Bank of China (PBOC) sets a so-called daily midpoint fix, based on the yuan’s previous day closing level and quotations taken from the inter-bank dealer.
-
01:58
Central bank moves and supply shocks among top risks to global economy – Reuters poll
“Central banks reducing emergency stimulus too quickly and further supply chain disruption are among the top risks to the world economy next year as the COVID-19 pandemic lingers,” per the latest Reuters poll covering more than 500 economists from around the world.
The survey results also highlight a shift in the economists’ view, contrasting the top central bankers who term that the recent surge in inflation as transitory. Even so, “Some stock markets are trading close to record highs even as interest rates are now on the rise,” adds the poll.
Key findings
Reuters polls covering more than 500 economists from around the world concluded that 13 of 25 central banks would raise interest rates at least once before the end of next year. Some already have, like central banks of New Zealand, Russia and Brazil.
But about one-quarter of 171 economists responding to an extra question said central banks dialing down stimulus too quickly was one of the biggest downside risk to the global economy.
A similar number of respondents said more supply chain disruptions or flare-ups in the COVID-19 pandemic, set to enter its third year in 2022 as a much-diminished but still not vanquished threat, were the top risks.
Indeed, global growth was expected to slow to 4.5% next year from a blistering 5.9% this year, largely unchanged from July. That slowdown next year is a bit sharper than International Monetary Fund's (IMF) latest projection of 4.9%.
Growth was forecast to slow to around that pace in 2023, at 3.5%, according to the poll.
Read: US Dollar Index rebound eyes 94.00 even as DXY bulls await US GDP, ECB duet
-
01:57
RBA's Debelle: Little more inflation welcome, lot more inflation is not
The Reserve Bank of Australia Deputy Governor Guy Debelle says monetary policy is looking to generate higher inflation.
Debelle says a little more inflation welcome, a lot more inflation is not welcome.
More to come...
-
01:51
AUD/USD bulls shy away from 200 DMA and 0.7550s
- AUD/USD bulls are failing to convince as price melts from CPI provoked highs near 200 DMA.
- Inflation risks are being accounted for in the markets with a focus on central banks.
Strong inflation data and growing concerns about the persistence of price pressures intensified this week throughout the commodity bloc. Yesterday, Australian Consumer price Index data came in hotter than expected which suggests that underlying inflation is more widespread than thought.
''While some of these price pressures will likely ease through 2022, others will emerge as wages growth accelerates. This suggests the RBA may have less time on the policy front than it (and we) believed,'' analysts at ANZ bank explained. ''If the RBA’s guidance about the move in the cash rate is brought into 2023, we think it likely the 10bp yield target will be dropped. Next week’s RBA statement just got a lot more interesting,'' the analysts added.
Meanwhile, the focus was on Wednesday's Bank of Canada meeting. The central bank responded to inflation pressures with a more hawkish message than markets had anticipated, bringing forward the expected timing of economic slack being absorbed. The BoC has clearly opened its doors to a rate hike in April. The other key policy decision—ending QE by moving into the “reinvestment phase” of that program—was as expected.
RBA to be forced into action?
As for the RBA, the swaps market is now pricing in nearly 60 bp of tightening over the next twelve months, up from 50 bp at the start of this week. ''We believe the bank will push back against these market expectations rather than validate them,'' analysts at Brown Brothers Harriman argued.
''New macro forecasts will be released then and will be a big part of the forward guidance. We also think the RBA could push back against recent currency strength, though AUD gains have been capped around 0.7550, just below the 200-day moving average near 0.7560 currently.''
''The RBA might be forced into action after all," wrote Commerzbank analyst Antje Praefcke in a note to clients, referring to rising 3-year yields.
"The market is likely to increasingly assume that the RBA will have to rethink its expansionary monetary policy further due to economic and inflationary developments, which is likely to principally support AUD."
-
01:48
Silver Price Analysis: XAG/USD bears eye monthly support line below $24.00
- Silver remains offered for the third consecutive day, refreshes intraday low.
- 12-day-old support line breakdown joins bearish MACD signals to favor sellers.
- Weekly falling trend line adds to the resistance.
Silver takes offered around $23.95, down 0.37% intraday, to refresh the daily lows during early Thursday. In doing so, the bright metal extends the previous day’s downside break of two-week-old support, now resistance, while also printing a three-day south-run.
Given the bearish MACD signals joining the recent support break, XAG/USD sellers are hopeful to challenge an ascending support line from September 30, near $23.60.
However, any further weakness past $23.60 will be challenged by the 200-SMA level near the $23.00 round-figure, a break of which will direct silver sellers toward a 61.8% Fibonacci retracement level of September 29 to October 22 upside, around $22.70.
Alternatively, a one-week-long resistance line around $24.15 guards the quote’s immediate upside ahead of the previous support line near $24.25.
During the XAG/USD upside beyond $24.25, the monthly high near $24.85 and September’s peak close to $24.90 will be crucial levels to watch.
Silver: Four-hour chart
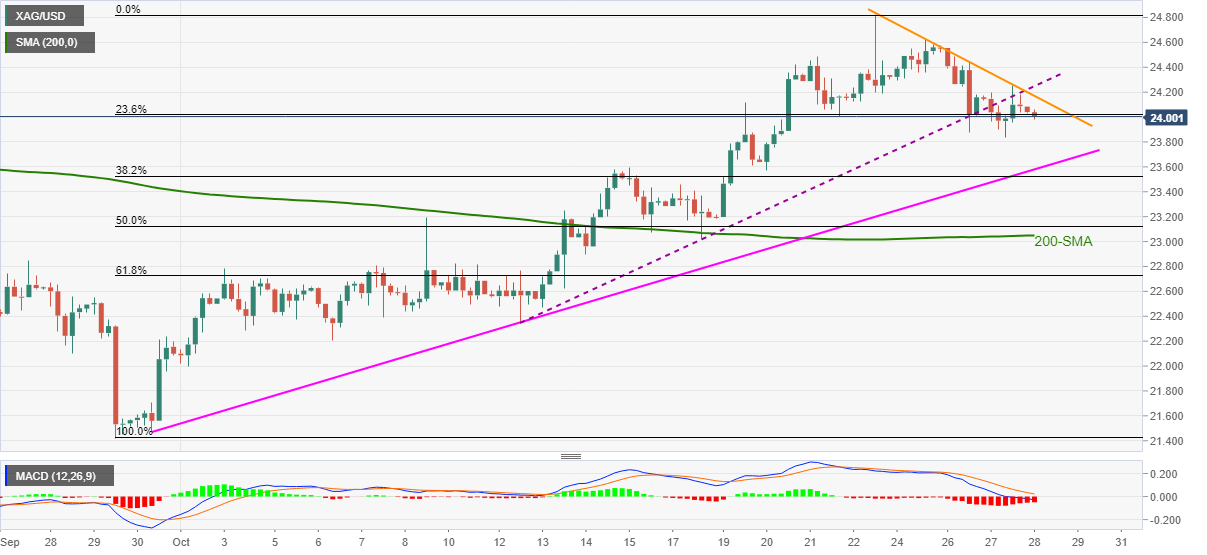
Trend: Further weakness expected
-
01:38
EUR/JPY Price Analysis: Retreats from 23.6% Fibonacci retracement level
- EUR/JPY declines for the second consecutive session on Thursday.
- BOJ and ECB rate decisions will set the course of trade for the pair.
- Momentum oscillator signals caution before placing any aggressive bids.
EUR/JPY edges lower on Thursday in the early Asian session. The pair opened higher but fizzled out quickly to test the intraday low of 131.92. At the time of writing, EUR/JPY is trading at 131.99, down 0.08% for the day.
EUR/JPY daily chart
-637709781227163437.png)
On the daily chart, the EUR/JPY cross-currency pair peaked at a four-month high near 133.50 on October 20, before testing the low of 131.58 in the previous session. The pair breaks below the 23.6% Fibonacci retracement level, which extends from the low of 127.92 at 132.21.
If the price sustains below the intraday low it could re-test the low of 131.58 made a day earlier. The Moving Average Convergence (MACD) indicator holds above the overbought zone. Any downtick in the MACD would prompt EUR/JPY bears to meet the October 14 low of 131.26. Upon successful testing of the mentioned level, the spot might extend the losses toward the 50% Fibonacci retracement level at 130.75.
Alternatively, if the price reverses direction it could move back to the 132.50 horizontal resistance level. Next, the market participants would keep their eyes on the psychological 133.00 mark, followed by the four-month high of 133.48.
EUR/JPY additional levels
-
01:30
Australia Export Price Index (QoQ) came in at 6.2%, above expectations (3%) in 3Q
-
01:30
Australia: Export Price Index, q/q, Quarter III 6.2%
-
01:30
Australia: Import Price Index, q/q, Quarter III 5.4%
-
01:30
Australia Import Price Index (QoQ) registered at 5.4% above expectations (0.6%) in 3Q
-
01:30
Schedule for today, Thursday, October 28, 2021
Time Country Event Period Previous value Forecast 00:30 (GMT) Australia Export Price Index, q/q Quarter III 13.2% 00:30 (GMT) Australia Import Price Index, q/q Quarter III 1.9% 03:00 (GMT) Japan BOJ Outlook Report 03:00 (GMT) Japan BoJ Interest Rate Decision -0.1% -0.1% 07:55 (GMT) Germany Unemployment Change October -30 -20 07:55 (GMT) Germany Unemployment Rate s.a. October 5.5% 5.4% 09:00 (GMT) Eurozone Industrial confidence October 14.1 09:00 (GMT) Eurozone Consumer Confidence October -4 -4.8 09:00 (GMT) Eurozone Economic sentiment index October 117.8 11:45 (GMT) Eurozone ECB Interest Rate Decision 0.0% 0% 12:00 (GMT) Germany CPI, m/m October 0% 0.5% 12:00 (GMT) Germany CPI, y/y October 4.1% 4.4% 12:30 (GMT) U.S. Continuing Jobless Claims October 2481 2415 12:30 (GMT) U.S. PCE price index, q/q Quarter III 6.5% 12:30 (GMT) U.S. Initial Jobless Claims October 290 290 12:30 (GMT) Eurozone ECB Press Conference 12:30 (GMT) U.S. GDP, q/q Quarter III 6.7% 2.7% 14:00 (GMT) U.S. Pending Home Sales (MoM) September 8.1% 23:30 (GMT) Japan Unemployment Rate September 2.8% 2.8% 23:30 (GMT) Japan Tokyo CPI ex Fresh Food, y/y October 0.1% 0.3% 23:30 (GMT) Japan Tokyo Consumer Price Index, y/y October 0.3% 23:50 (GMT) Japan Industrial Production (MoM) September -3.6% -3.2% 23:50 (GMT) Japan Industrial Production (YoY) September 8.8% -
01:29
EUR/USD: Options market turns most bullish in a week ahead of ECB, US GDP
One-month risk reversal (RR) of the EUR/USD, a gauge of calls to puts, prints +0.050 readings for Wednesday, per the latest data from Reuters.
The figures suggest that the pair traders are the most bullish since October 19 when the RR marked +0.0932 level. It’s worth noting that the positive RR level also consolidates the previous day’s negative prints of -0.063.
However, the EUR/USD pair’s latest price action refrains from portraying the bullish bias, down 0.06% intraday around 1.1600.
The quote’s latest moves could be linked to the US Dollar’s pick-up tracking the US Treasury yields. The US 10-year Treasury yields gain two basis points (bps) to regain 1.55% after dropping the most since mid-August the previous day. The consolidation of the US Treasury yields portrays the market’s rush for risk-safety ahead of the preliminary US Q3 GDP and monetary policy meeting of the European Central Bank (ECB).
The US Q3 GDP is expected to have eased from 6.7% to 2.7% during the preliminary forecast, which in turn may allow the Fed to take some time before announcing the details for tapering.
Read: US Third Quarter GDP Preview: A most uncertain estimate
On the contrary, the ECB is likely to portray a hawkish play but there are reasons for the Euro (EUR) bulls to consider before eyeing the EUR/USD run-up.
Read: European Central Bank Preview: Finally, some action, but no hopes for the EUR
-
01:16
AUD/NZD Price Analysis: Bulls fail to convince on the breakout
- AUD/USD is failing to convince on the upside breakout of accumulation.
- The daily chart warns of a break below 1.0480 in the coming sessions.
AUD/NZD has failed to move higher on the breakout of the hourly accumulation following the prior session's Aussie Consumer Price Index. This gives rise to prospects of a downside continuation from a daily perspective.
AUD/NZD 1HR chart
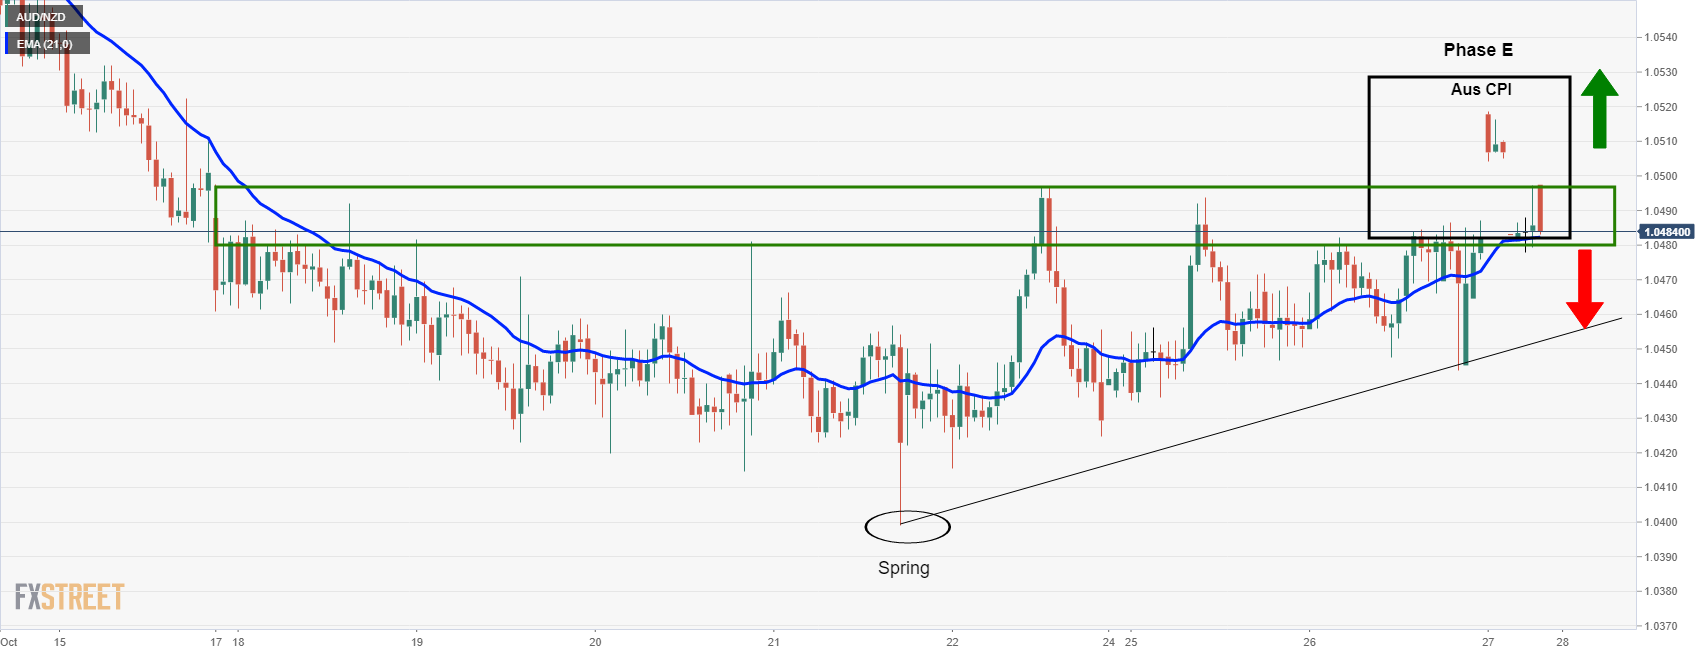
The price has failed to maintain its breakout course of trajectory but sliding back into the accumulation's old resistance area, as illustrated above. While there are still prospects of a move higher, the daily chart could now be paining a different story.
AUD/NZD daily chart
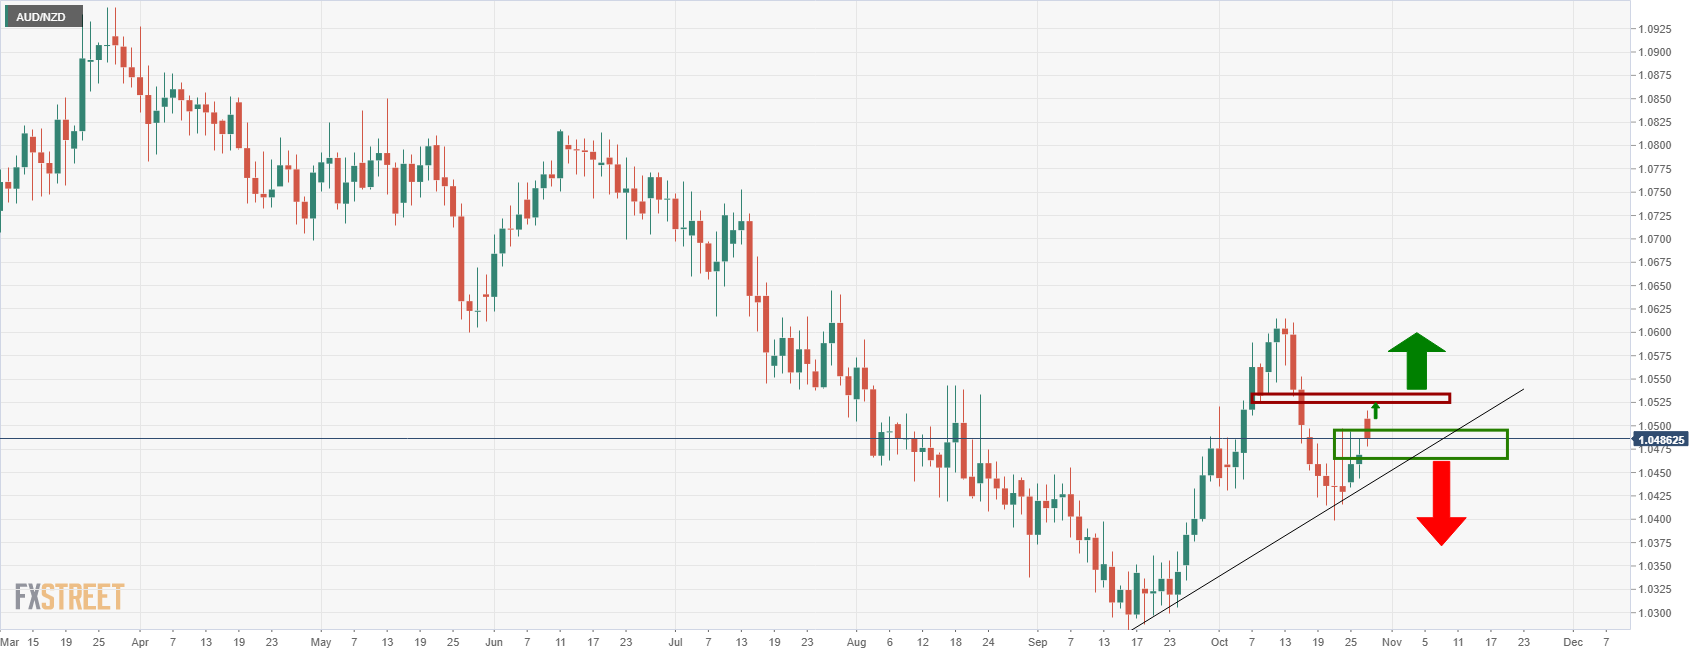
The price has come in very close to the neckline of the M-formation and has failed to maintain momentum. Should the price remain below the 1.0520 level, there will be higher prospects of a downside continuation once a break of the dynamic trendline support breaks near 1.0480.
-
01:16
US Dollar Index rebound eyes 94.00 even as DXY bulls await US GDP, ECB duet
- DXY consolidates losses after snapping two-day recovery from monthly low.
- Fed tapering tantrums gain momentum amid firmer inflation expectations, stronger US GDP can favor bulls.
- ECB may print hawkish mood but greenback buyers will have fewer challenges to note.
US Dollar Index (DXY) rebound aim for another battle with the 94.00 threshold during early Thursday. The greenback gauge dropped for the first time in three days the previous day as cautious sentiment weighed on the US Treasury yields. However, the following recovery moves fail to regain traction amid a wait-and-watch mode of the markets ahead of the preliminary US Q3 GDP and monetary policy meeting of the European Central Bank (ECB).
Although fears of fresh US-China tussles, over issues concerning telecom and Taiwan, put a carpet under the US dollar weakness, the DXY tracked the US Treasury yields to print the heaviest daily fall of the week. That being said, the US 10-year Treasury yields dropped the most since mid-August on Wednesday, recently picking up bids to 1.54%, up 1.2 basis points (bps).
Also weighing on the US Treasury yields and the DXY were hopes of tighter monetary elsewhere, reducing the safe-haven appeal of the US currency. Recently, the Bank of Canada (BOC) announced the end of bond purchases and the UK also cuts bond issuance. Further, Australia’s strong prints of the RBA Trimmed Mean CPI also push the Reserve Bank of Australia (RBA) towards a rate hike.
It’s worth noting that the US inflation expectations step back from the highest since May 2006 and add to the downside pressure on the DXY. Furthermore, mixed data could also be cited as an additional catalyst for the greenback’s recent weakness. The US Good Trade Balance shrank more than expected in September but the Durable Goods Orders dropped lesser-than-forecast for the stated month.
Looking forward, the US Q3 GDP will be crucial for the DXY bulls as hopes of a firmer outcome backing the Fed tapering plans are high. It should be observed that any negative surprise will also be dealt with with a magnified response.
Read: US Third Quarter GDP Preview: A most uncertain estimate
Additionally, the ECB is up for a hawkish show but the Euro region problems, including Brexit, politics and deficits, may dim the event’s impact on the US Dollar Index.
Read: European Central Bank Preview: Finally, some action, but no hopes for the EUR
Technical analysis
The 21-DMA hurdle surrounding the 94.00 threshold challenges the DXY bulls targeting the yearly top near 94.55. However, downside moves remain less worrisome until staying beyond the weekly swing low near 93.50.
-
01:15
Currencies. Daily history for Wednesday, October 27, 2021
Pare Closed Change, % AUDUSD 0.75168 0.25 EURJPY 132.013 -0.19 EURUSD 1.16014 0.08 GBPJPY 156.359 -0.45 GBPUSD 1.37377 -0.18 NZDUSD 0.71659 0.07 USDCAD 1.23587 -0.25 USDCHF 0.91635 -0.31 USDJPY 113.801 -0.28 -
00:53
AUD/JPY eases below 85.50 ahead of BOJ decision, Japan Retail Sales disappoint
- AUD/JPY posts losses for the second straight day on Thursday.
- Traders look up to RBA Deputy Governor Debelle speech on inflation.
- BOJ interest rate decision and Retail sales data will be in focus.
AUD/JPY surrenders gain in the early Asian session on Thursday. The pair touched the highs of 0.8600 post upbeat Australia’s inflation data in the previous session,but failed to preserve the momentum. As of writing, the AUD/JPY is trading at 85.40, down 0.15% for the day.
The aussie remained cautious ahead of the remarks from the Reserve Bank of Australia (RBA) Deputy Governor Debelle on inflation. Earlier gains for the pair evaporated after the Australia's headlines Consumer Price Index (CPA) came in line with market expectations of 0.8% QoQ basis for the September quarter (Q3) while the YoY figures dropped below 3.8% as compared to previous one to 3.0% below the market projections of 3.1%. The RBA Trimmed Mean CPI came at 2.1% versus 1.8% expected.
On the other hand, the Japanese yen lost its momentum amid an improved risk appetite among investors. It is worth noting that S&P 500 Futures are trading at 4,552.50, up 0.18% for the day. Further, the market is bracing for the Bank of Japan (BOJ) dovish monetary policy announcement on Thursday. The BoJ is expected to maintain its target for short-term interest rates at -0.1% and that for 10-year bond yields near 0%.
The Japan's Retail Sales declined 0.60% in September.
As for now, traders turn their attention to Japan’s Retail Sales data, and BOJ Interest Rate Decision to gauge the market sentiment
AUD/JPY additional levels
-
00:51
Japan Large Retailer Sales climbed from previous -4.7% to -1.3% in August
-
00:51
Japan Retail Trade s.a (MoM) climbed from previous -4.1% to 2.7% in August
-
00:50
Japan Retail Trade (YoY) above expectations (-2.3%) in August: Actual (-0.6%)
-
00:50
Japan Foreign Bond Investment: ¥-604.5B (October 22) vs previous ¥1221.3B
-
00:50
Japan Foreign Investment in Japan Stocks fell from previous ¥960.1B to ¥229.7B in October 22
-
00:50
Japan: Retail sales, y/y, September -0.6% (forecast -2.3%)
-
00:43
AUD/USD Price Analysis: Further downside hinges on 0.7500 breakdown
- AUD/USD takes offers to snap three-day uptrend, sellers attack monthly support line.
- Hidden bullish divergence keeps buyers hopeful, 100-DMA adds to the downside filters.
AUD/USD refreshes intraday low with 0.7502 marking the first negative daily performance in four during Thursday’s Asian session. In doing so, the Aussie pair sellers battle with an ascending support line from September 30.
In addition to the stated trend line support, a hidden bullish divergence, a condition where prices make lower high but the RSI prints higher high, also challenges the bear’s return around the 0.7500 threshold.
While a clear downside break of the 0.7500 round figure will direct the AUD/USD prices towards the 100-DMA near 0.7390, September’s peak around 0.7480-75 acts as an extra challenge for the pair sellers.
Should AUD/USD sellers dominate past 100-DMA, the late September’s wing top around 0.7315 will be in focus.
Meanwhile, the corrective pullback will aim for the monthly high, also the highest since July, around 0.7550 before highlighting the 200-DMA hurdle near 0.7565.
During the AUD/USD run-up beyond 0.7565, the late June’s swing high close to 0.7620 may lure the bulls.
AUD/USD: Daily chart
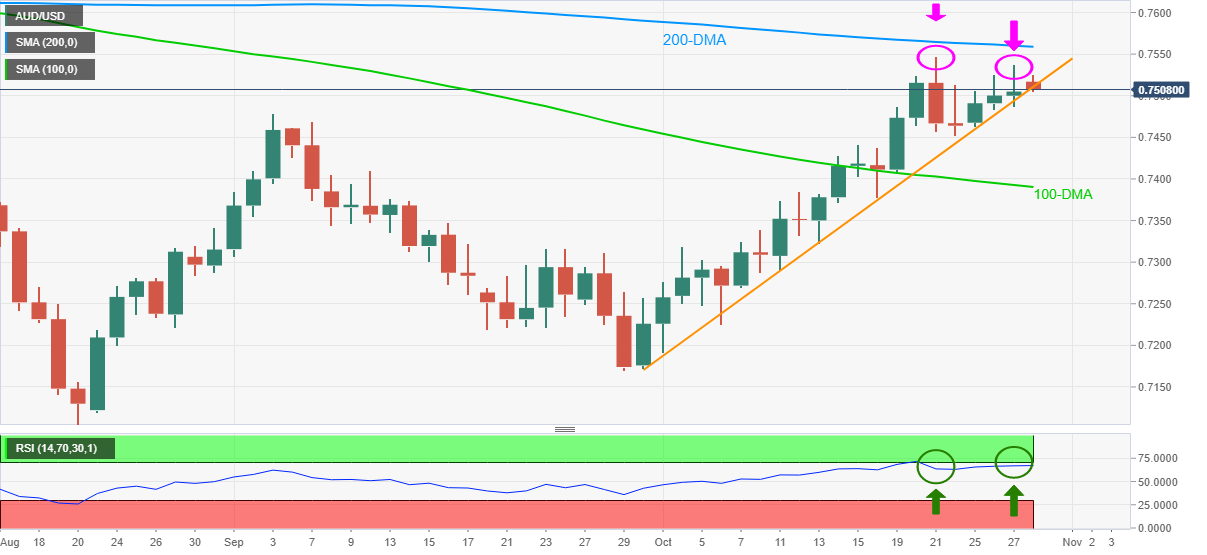
Trend: Bullish
-
00:34
Gold Price Forecast: Bounded in familiar territory, riding dynamic support
- Gold holds in a critical support structure on the daily chart.
- XAU/USD leans with a bullish bias with eyes on a break of $1,830.
- Lower US yields are supporting the bullish bias and are weighing on the greenback.
Trading at $1,796, the price of gold is flat within bullish territory on Thursday and rides daily dynamic support near the 50-day EMA. Gold is holding in a tight range mid-week while global equity markets gave up recent gains on Wednesday.
It was a mixed session while US Treasury yields fell to a two-week low as traders weighed continued positive corporate results and a resurgence in US-China tensions that could compound supply-chain worries.
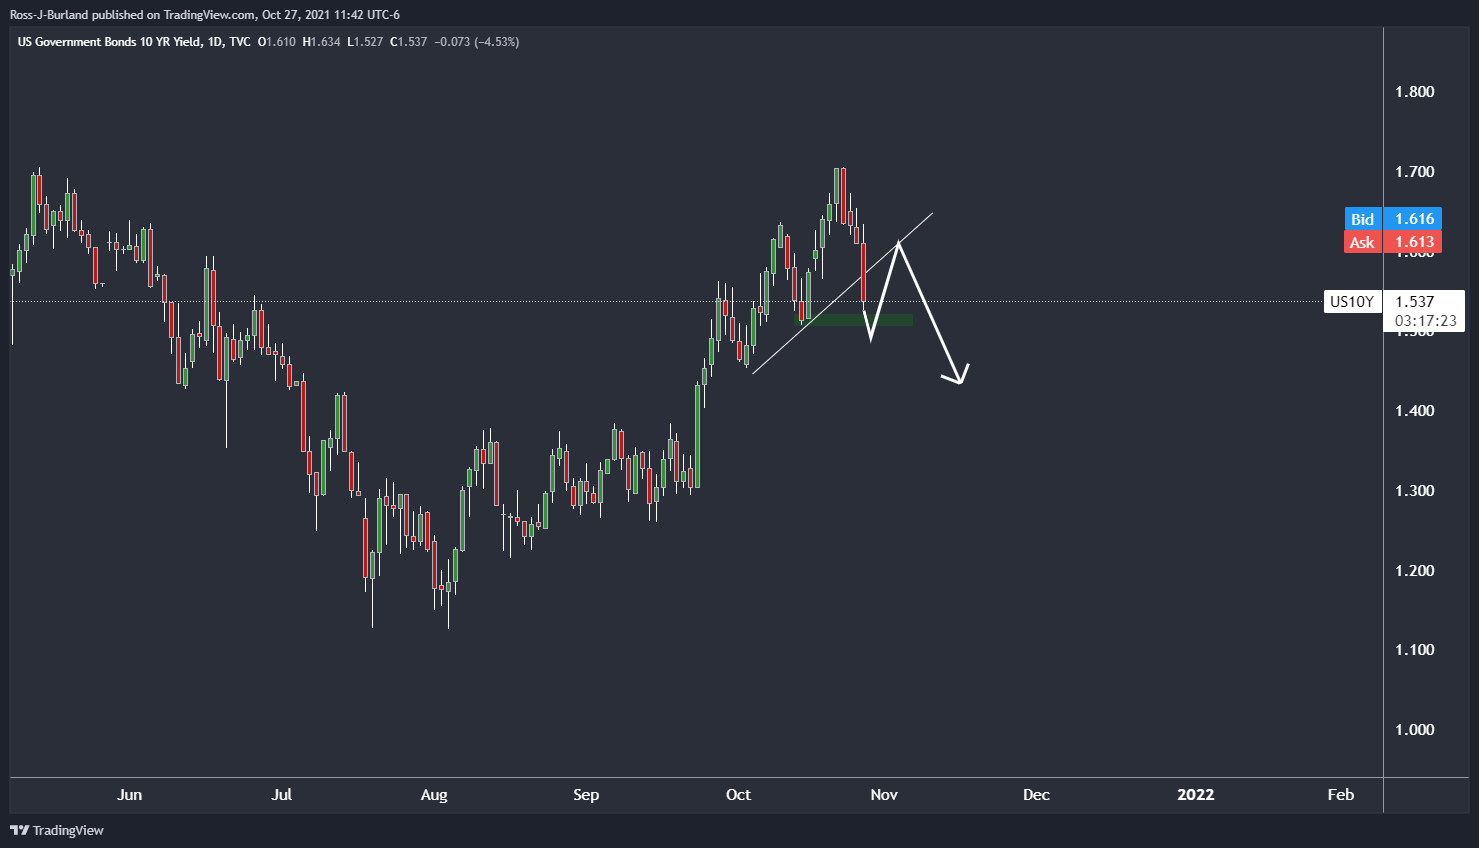
Bonds also rallied overnight on the back of a larger-than-expected reduction in UK bond issuance (a cut was expected due to the UK budget deficit coming in better than forecast).
Consequently, the US dollar lost value against major currencies as the Bank of Canada started off a series of awaited central bank policy comments with a hawkish tone. The outcome broke a calm that had settled over the forex space this week and the US dollar index met resistance in the daily chart. 93.70 was the low on the day.
The Bank of Canada signaled it could hike interest rates earlier than previously thought and became the first central bank from a G7 country to exit quantitative easing. The BoC maintained guidance to leave rates on hold until economic slack is absorbed, but it now expects that to happen sometime in the middle quarters of 2022 rather than in the second half of 2022. Markets will look to the ECB meets tonight. President Lagarde may have a difficult time convincing markets to reverse rising expectations of higher interest rates next year.
Meanwhile, the hunt for inflation protection continues to prop up interest in the yellow metal as real rates sink, analysts at TD Securities said.''Ten year breakeven yields continue to firm at their highest levels since 2012, as speculators brace for inflation. While the interest in inflation is supporting gold, global markets remain intensely focused on pricing the Fed's exit, with the recent surge in market-based inflation expectations also fueling bets for an earlier Fed hike.''
''The market is increasingly pricing in a policy mistake which is unlikely to take place, considering that central banks are likely to look past these disruptions as their reaction functions have been historically more correlated to growth than inflation. In this sense, reasons to own the yellow metal are growing more compelling as Fed pricing is likely to unwind in the coming months,'' the analysts explained.
''While this narrative has yet peaked, we expect a deceleration in US economic activity, as a result of a growing fiscal drag, to catalyze a repricing.''
Gold technical analysis
From a daily perspective, the price has been trying to move higher as illustrated in the following pre-market open analysis: Chart of the Week: Gold bears lurk at weekly trend line resistance
''$1,835 guards territory to $1,880 as follows:
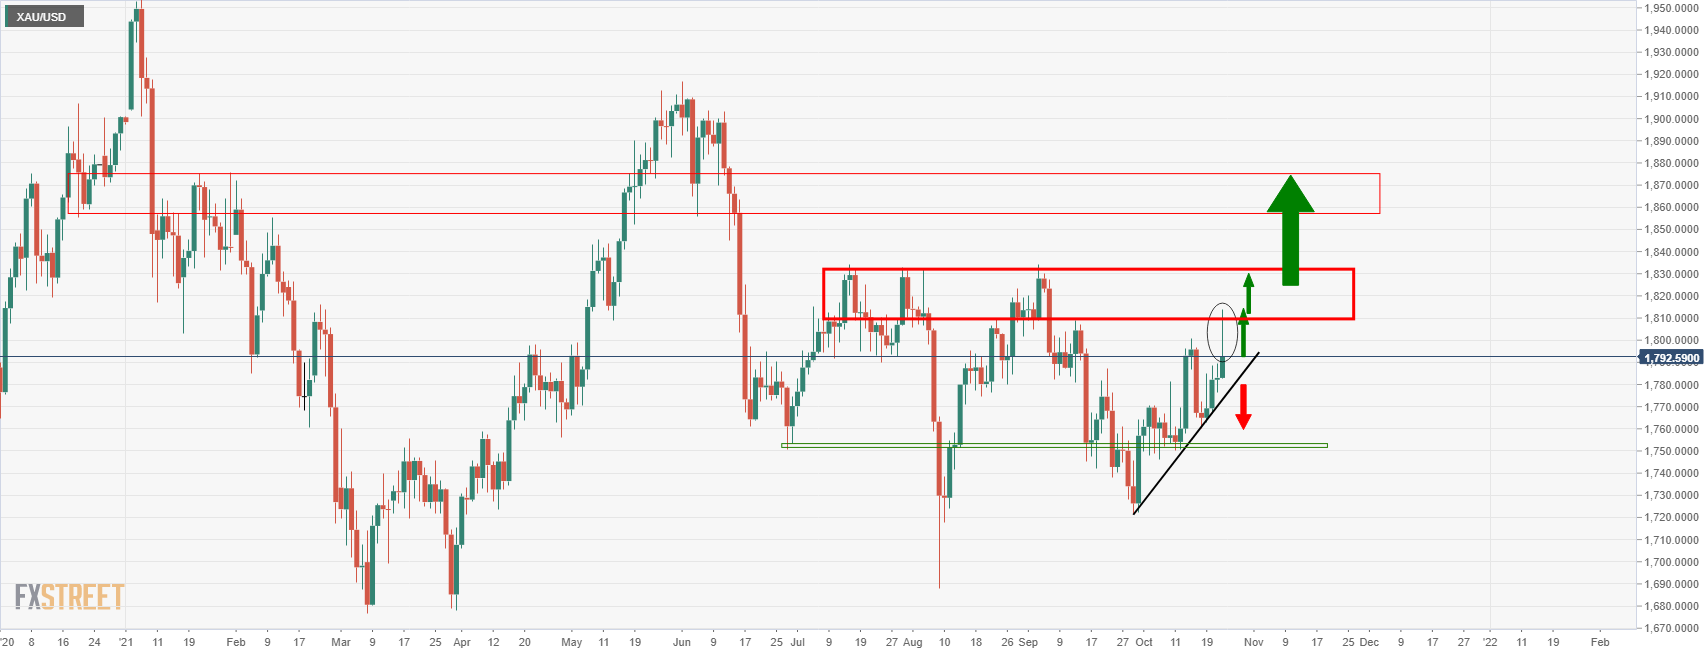 ''
''Gold bulls were making progress
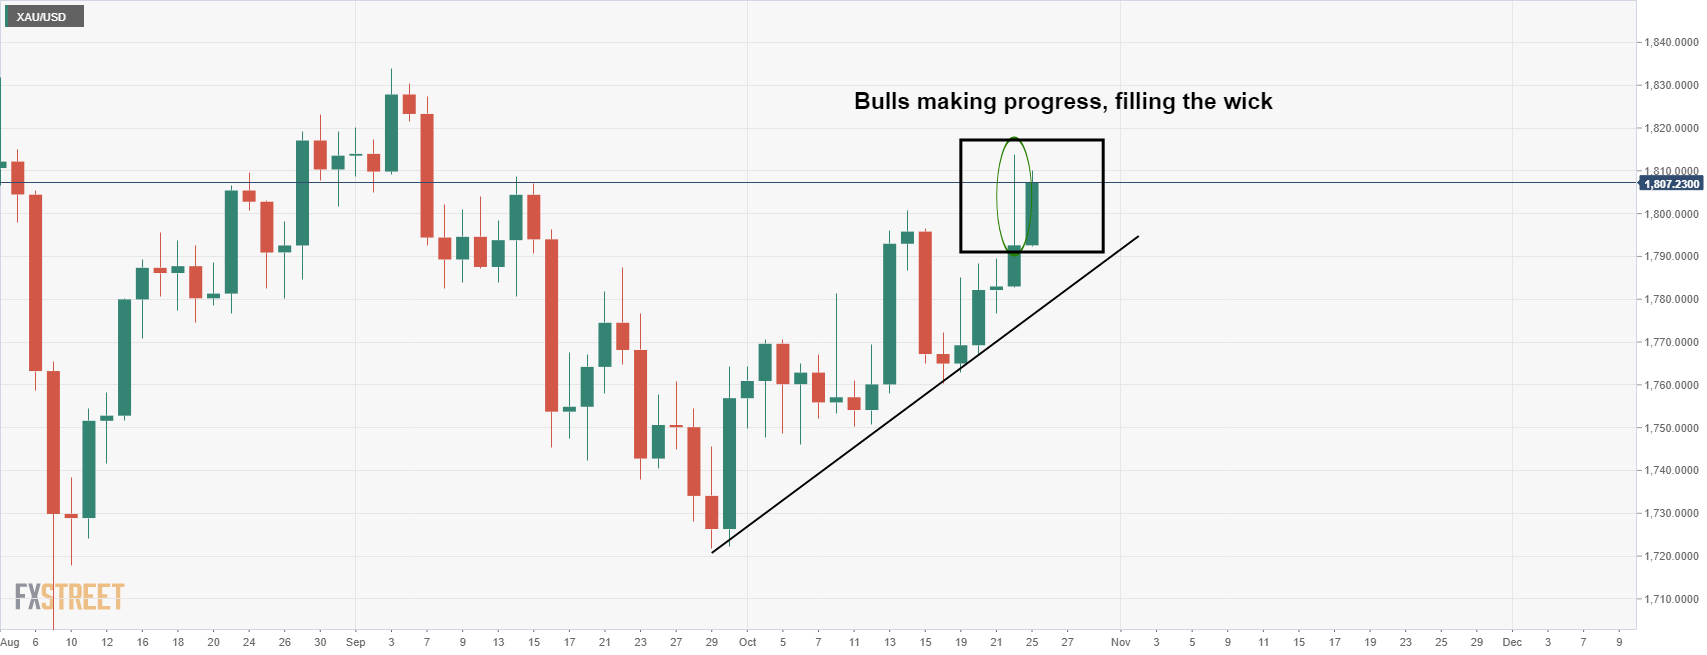
The price action on Tuesday, however, has moved in for a significant test of the dynamic support as follows:
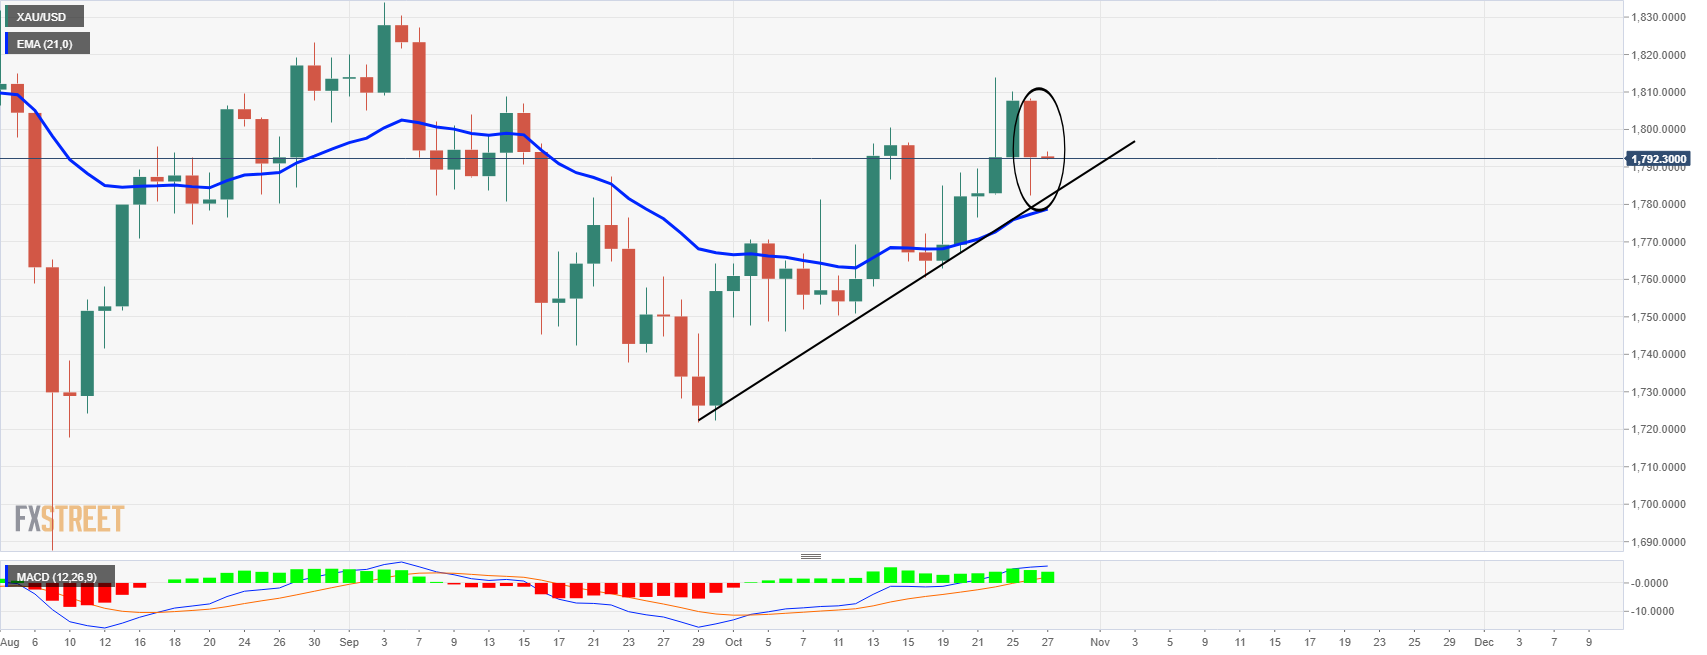
The price had left a tweezer top which indicated that the price could move in for another test of the dynamic support and the 21-day moving average:
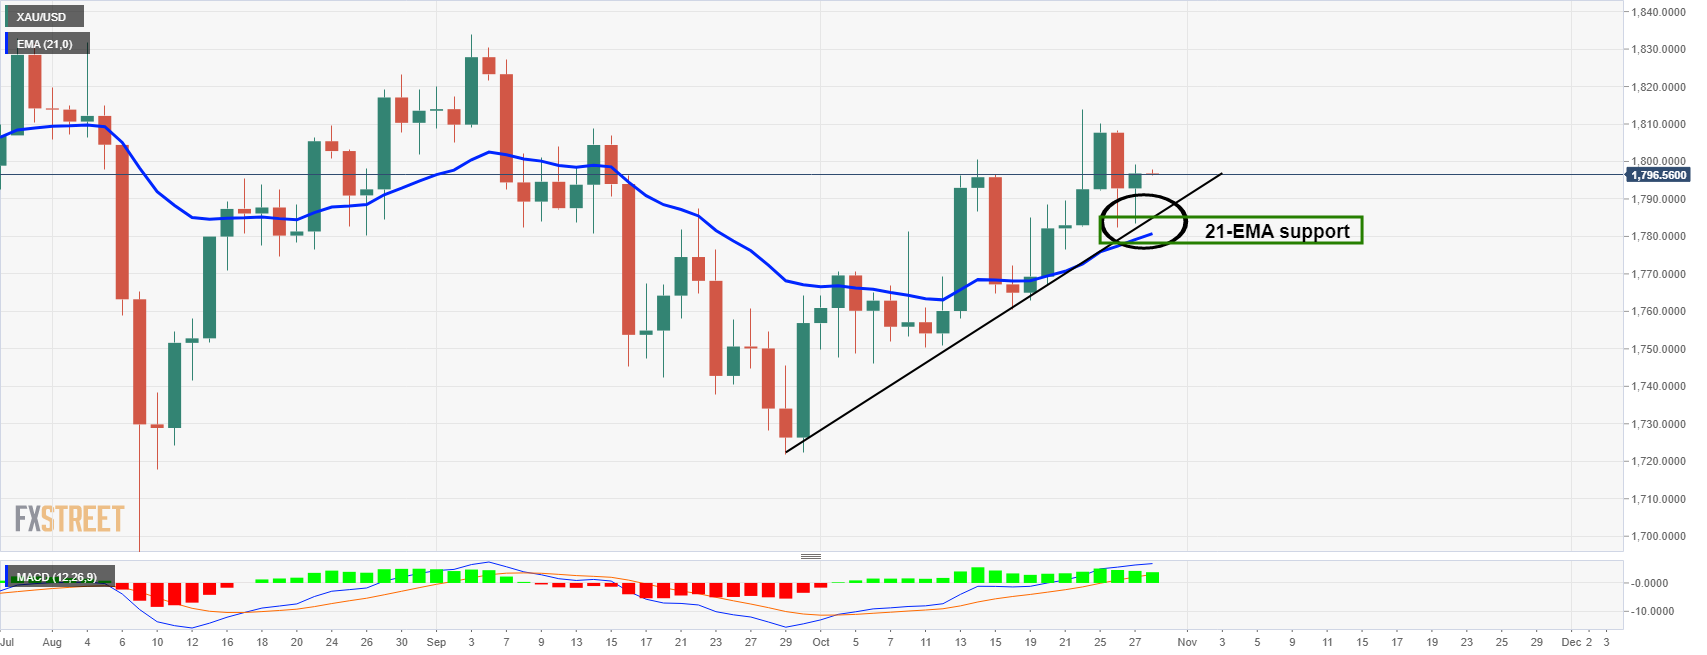
So long as this structure holds, the bias is bullish with positive MACD.
-
00:34
EUR/JPY steady around 132.00 ahead BoJ and ECB monetary policy meetings
- EUR/JPY dropped almost 100 pips amid mixed-market sentiment as investors flew towards safe-haven assets.
- EUR/JPY might trade within tight ranges as investors await central bank’s monetary policy meetings.
The EUR/JPY retreats for the second time in the week dropped from 132.52 to 131.58 but stabilized at 132.06 amid mixed-market sentiment as the Asian session begins
Mixed market sentiment ahead BoJ and ECB central bank meetings, to keep EUR/JPY within a tight range
A mixed market sentiment spurred a flight to safe-haven assets, boosting the prospects of the Japanese yen and the Swiss franc. Also, precious metals appreciated as government bond yields around the globe, headed by US Treasury yields, plummeted, reinforcing the inflation hedge status of gold and silver.
US political uncertainties around the budget and the spending bills, among central bank tightening with the Bank of Canada adding its name to the list of policymakers normalizing its monetary policy, kept investors at bay. Further, month-end flows prompted market participants to dump anything with the “risk” word attached to it.
Bank of Japan (BoJ) Monetary Policy Preview
On Thursday, the Japanese economic docket will feature the Bank of Japan, which will release its Interest Rate decision, Monetary Policy Statement, and Outlook Report.
According to Dhwani Metha, Analyst at FX Street, “the BOJ will keep the benchmark policy rate on hold at -10bps while maintaining its pledge to buy J-REITS at an annual pace of up to JPY180 bln.” Furthermore, she added that the stimulus measures would likely remain as the Bank of Japan diverges from fellow counterparts looking toward exiting the easy-money cycle.
The economic outlook is seen slashing down the 2021’s growth and inflation estimates, followed by a weaker summer due to the COVID-19 lockdowns and supply chain disruptions.
Nevertheless, the bank will stick to its forecast of a moderate recovery, per Reuters report.
Read more: BOJ Preview: Focus on outlook tweaks ahead of general election
European Central Bank (ECB) Monetary Policy Preview
The European Central Bank will unveil its Interest Rate Decision on the Eurozone front, alongside the Monetary Policy Decision. Furthermore, ECB President Christine Lagarde will host a press conference. Additionally, Germany will feature the Harmonized Index of Consumer Prices for October, estimated at 4.5%.
According to Yohay Elam, Analyst at FX Street, “the bank is set to leave its policy unchanged and wait for its December meeting – when it compiles new economic forecasts – to make any potential announcements. That means investors will be focused on ECB President Christine Lagarde’s press conference.”
Furthermore, he commented that lower economic growth, and fewer inflation worries, would lead to a dovish message of more support from the ECB.
Read more: European Central Bank Preview: Three reasons why Lagarde is set to lower the euro
All that said, both currencies are in the hands of policymakers. Though the Japanese yen is “very” sensitive to risk-flows, any fear surrounding the market would trigger Yen appreciation.
Contrarily, the shared currency has relied upon its counterparts like the USD and the JPY to determine the trend direction of the EUR/USD and the EUR/JPY pairs.
EUR/JPY TECHNICAL LEVELS TO WATCH
-
00:25
WTI remains depressed around weekly low below $82.00, US GDP eyed
- WTI stays pressured after posting the heaviest daily fall in three weeks.
- Fears of tighter monetary policies joined dovish EIA stockpiles to please bears.
- Risk catalysts may entertain traders ahead of preliminary US Q3 GDP.
WTI holds lower ground near $81.60 after printing the heaviest downside play since early October.
The oil benchmark dropped the most in three weeks the previous day as market players feared the end of easy money from the key global central banks. The bearish impulse gained extra strength from the weekly official inventory data from the Energy Information Administration (EIA).
As per the latest release, the commercial crude oil inventories in the US increased by 4.3 million barrels in the week ending October 22, versus the expectation for an inventory build of 1.9 million barrels. On Tuesday, the Weekly Crude Oil Stock data from the American Petroleum Institute (API) also rose past 1.65M expected build to 2.318M previous readouts for the period ended on October 22.
Market sentiment dwindled on Wednesday after the UK announced bond tapering and the Bank of Canada (BOC) end the asset purchases. The news also joins multi-year high inflation expectations concerning the Eurozone and the US, as well as a jump in Aussie inflation data, to hint at further monetary policy tightening going forward.
It’s worth noting that the fresh US-China tussles, recently over telecom and Taiwan issues, add to the catalysts challenging the commodity prices.
To portray the mood, the US 10-year Treasury yields dropped the most since mid-August and weighed on the US Dollar Index (DXY). However, the equities were mixed and the futures are mildly bid by the press time.
Moving on, the market’s cautious mood ahead of the key US GDP and the European Central Bank (ECB) meeting may question the oil buyers.
Technical analysis
Despite the latest pullback, WTI remains above a two-month-old support line, around $80.70 by the press time, which in turn question the trend reversal expectations.
-
00:06
USD/CAD Price Analysis: Keeps post BOC pullback from 1.2430 as MACD flirts with bears
- USD/CAD consolidates the heaviest daily fall in a week.
- Convergence of 100-SMA, falling wedge resistance guards immediate upside.
- Monthly low, late June’s bottom remains on seller’s radar.
USD/CAD licks the Bank of Canada (BOC) led wounds around 1.2360, keeping the bound off weekly low during Thursday’s Asian session.
The Loonie pair dropped the most in one week the previous day following the BOC’s surprise end to asset purchases.
As the corrective pullback remains below 100-SMA and the upper line of a seven-week-old falling wedge bullish chart pattern, amid bearish MACD, USD/CAD prices are likely to remain pressured.
The same will help the pair bears to aim for the monthly low surrounding 1.2290. However, lows marked during the late June and support line of the stated wedge, respectively around 1.2250 and 1.2235, can challenge the USD/CHF downside afterward.
On the flip side, the 200-SMA level of 1.2555 will probe the run-up beyond the 1.2430 resistance confluence, including 100-SMA and wedge’s upper line.
During the quote’s successful rise past 1.2555, late September highs of 1.2775 and the yearly top marked in August, around 1.2950, will gain the market attention.
USD/CAD: Four-hour chart
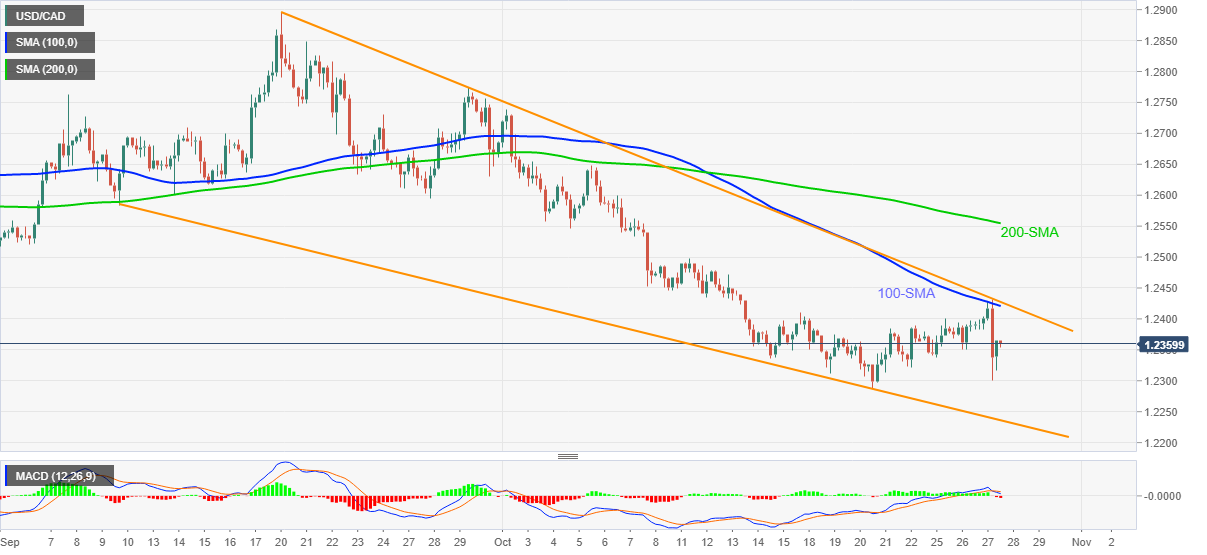
Trend: Further weakness expected
-
00:05
USD/CHF Price Analysis: Buyers face three-month resistance near 0.9200
- USD/CHF remains muted in the early Asian session on Thursday.
- The pair face trades below the 50-day SMA for past one week.
- Upside momentum faces pressure in the 0.9220 and 0.9220 zone.
USD/CHF tardes with no clear movement on Thursday. After testing 0.9200 in the US session, the pair retreated and closed below 0.9200. At the time of writing, USD/CHF is trading at 0.9181, down 0.01% for the day.
USD/CHF daily chart
-637709726105612897.png)
On the daily chart, after testing 5-month highs at 0.9368 on September, 30, the pair has been under downward pressure.The pair dropped below the critical 0.9275 support area. Further, the spot trades the 50-day Simple Moving Average (SMA) at 0.9217.
If the price breaks below the intraday low then it would test the 0.9155 horizontal support level. A daily close below the crucial 0.9150 mark could drag the spot toward the September, 3 low at 0.9115. Next, the bears will keep their eyes on the low of August 30 at 0.9101.
Alternatively, the Moving Average Convergence Divergence (MACD) trades below the midline. Any uptick in the MACD could reverse the prevailing trend with the first upside target at the 50-day SMA at 0.9218. A daily close above the 50-day SMA would see a high of October, 20 at 0.9252, followed by the 0.9275 horizontal resistance level.
USD/CHF additional levels
-