Market news
-
23:51
Japan: Current Account, bln, October 1720 (forecast 1577.2)
-
23:51
Japan: GDP, y/y, Quarter III 1.3% (forecast 2.4%)
-
23:50
Japan: GDP, q/q, Quarter III 0.3% (forecast 0.6%)
-
23:28
Currencies. Daily history for Dec 07’2016:
(pare/closed(GMT +3)/change, %)
EUR/USD $1,0751 +0,32%
GBP/USD $1,2622 -0,43%
USD/CHF Chf1,0072 -0,28%
USD/JPY Y113,76 -0,21%
EUR/JPY Y122,33 +0,11%
GBP/JPY Y143,58 -0,64%
AUD/USD $0,7480 +0,16%
NZD/USD $0,7164 +0,64%
USD/CAD C$1,3232 -0,33%
-
23:13
Schedule for today,Thursday, Dec 08’2016 (GMT0)
00:30 Australia Trade Balance October -1.23 -0.8
02:00 China Trade Balance, bln November 49.06 46.3
05:00 Japan Eco Watchers Survey: Outlook November 51.4
05:00 Japan Eco Watchers Survey: Current November 49.3
06:30 France Non-Farm Payrolls (Finally) Quarter III 0.2% 0.3%
12:45 Eurozone ECB Interest Rate Decision 0.0% 0%
13:15 Canada Housing Starts November 192.9 191.2
13:30 Eurozone ECB Press Conference
13:30 Canada Capacity Utilization Rate Quarter III 80%
13:30 Canada Building Permits (MoM) October -7% -0.7%
13:30 Canada New Housing Price Index, MoM October 0.2% 0.2%
13:30 U.S. Continuing Jobless Claims 2081 2059
13:30 U.S. Initial Jobless Claims 268 258
23:50 Japan BSI Manufacturing Index Quarter IV 2.9 3.4
-
20:00
U.S.: Consumer Credit , October 16.02 (forecast 19.0)
-
15:45
ECB Could Disappoint Investors Betting On More Stimulus - Dow Jones
-
15:30
U.S.: Crude Oil Inventories, December -2.389 (forecast -1.5)
-
15:16
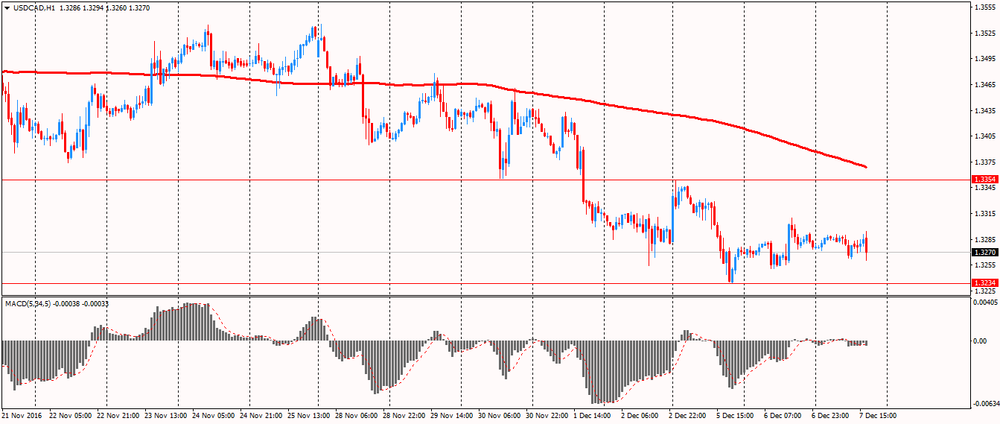
The Canadian dollar rose after the Bank of Canada left the interest rate unchanged at 0.5%. After the decision the pair USD / CAD has lost around 30 pips, reaching session lows
Now the pair is trading at 1.3260. The nearest resistance is located at the 1.3354 (5 December high). Strong support is at 1.3234 (December 5 low).
-
15:05
NIESR estimates UK GDP at +0.4%
Monthly estimates of GDP suggest that output grew by 0.4 per cent in the three months ending in October 2016 after growth of 0.5 per cent in the three months ending in September 2016.
Oriol Carreras, Research Fellow at NIESR, said "Our estimates suggest the economy grew by 0.4 per cent in the three months to October. Robust consumer spending growth continues to support the economy. Looking ahead, this contribution from consumers is expected to wane over the course of next year due to a substantial rise in the rate of inflation."
NIESR's latest quarterly forecast (published 2nd November 2016) projects GDP growth of 2 per cent per annum in 2016 and 1.4 per cent in 2017. CPI inflation is expected to reach 3.8 per cent at the end of 2017
-
15:03
US JOLTS job openings little changed in October
The number of job openings was little changed at 5.5 million on the last business day of October, the U.S. Bureau of Labor Statistics reported today. Over the month, hires and separations were also little changed at 5.1 million and 4.9 million, respectively. Within separations, the quits rate was unchanged at
2.1 percent and the layoffs and discharges rate was also unchanged at 1.0 percent. This release includes estimates of the number and rate of job openings, hires, and separations for the nonfarm sector by industry and by four geographic regions. -
15:01
Bank of Canada holds as expected. Says total CPI inflation has picked up
The Bank of Canada today announced that it is maintaining its target for the overnight rate at 1/2 per cent. The Bank Rate is correspondingly 3/4 per cent and the deposit rate is 1/4 per cent.
Economic data suggest that global economic conditions have strengthened, as the Bank anticipated in its October Monetary Policy Report (MPR). However, uncertainty, which has been undermining business confidence and dampening investment in Canada's major trading partners, remains undiminished. Following the election in the United States, there has been a rapid back-up in global bond yields, partly reflecting market anticipation of fiscal expansion in a US economy that is near full capacity. Canadian yields have risen significantly in this context.
In Canada, the dynamics of growth are largely as the Bank anticipated. Following a very weak first half of 2016, growth in the third quarter rebounded strongly, but more moderate growth is anticipated in the fourth quarter. Consumption growth was robust in the third quarter, supported by the new Canada Child Benefit, while the effects of federal infrastructure spending are not yet evident in the GDP data. Meanwhile, business investment and non-energy goods exports continue to disappoint. There have been ongoing gains in employment, but a significant amount of economic slack remains in Canada, in contrast to the United States. While household imbalances continue to rise, these will be mitigated over time by announced changes to housing finance rules.
Total CPI inflation has picked up in recent months but is slightly below expectations, largely because of lower food prices. Core inflation is close to 2 per cent because the effect of persistent economic slack is still being offset by that of past exchange rate depreciation, although the latter effect is dissipating.
-
15:00
Canada: Bank of Canada Rate, 0.5% (forecast 0.5%)
-
15:00
U.S.: JOLTs Job Openings, October 5.534 (forecast 5.5)
-
14:59
United Kingdom: NIESR GDP Estimate, November 0.4%
-
14:54
ING Sees EUR/USD Steady Around $1.07 Before ECB
-
14:31
Russian spokesman: All companies supported proposals on production cuts - Forexlive
-
13:39
Option expiries for today's 10:00 ET NY cut
EUR/USD 1.0500 (EUR 580m) 1.0650 (464m) 1.0750 (1.07bln) 1.0800 (456m)
USD/JPY 114.50 (USD 337m)
GBP/USD 1.2665 (GBP 318m) 1.2840 (595m)
AUD/USD 0.7500 (AUD 496m)
USD/CAD 1.3500 (USD 576m)
-
13:23
Bank of America Merrill Lynch expect the Bank of Canada to hold at 0.50%
"We expect the Bank of Canada (BoC) to keep policy rates on hold at 0.50% at is meeting on Wednesday as is widely expected. In the absence of a Monetary Policy Report (MPR) or press conference, the tone of the statement will be a key determinant of the market reaction. With data since the October MPR largely in line or a bit better-thanexpected, the BoC will likely maintain its assessment that risks around the inflation outlook are "roughly balanced." Additionally, the overall tone is still likely to be one of cautious optimism even as Governor Poloz noted that uncertainty remains extremely high in recent comments. Overall, the statement will suggest-as Poloz did in comments this week-that absent a material shock to their inflation outlook the bar for a cut remains relatively high.
Data: good, not great. Recent data leaves little to push the BoC off its comfortable, on-hold perch. Q3 GDP outpaced the BoC's October MPR forecasts of 3.2%, driven encouragingly by a rebound in exports from Q2 and still strong household consumption (Chart 1). The bounce in exports fits the BoC narrative the exports will help support a rebound in H2 growth, but it still wasn't enough to offset the sharp Q2 decline. Additionally, the continued weakness in business investment is likely to leave them cautious about a strong pickup in manufacturing in coming quarters. Employment data has also remained strong with the 6m trend accelerating to an above-trend 20k. On the flip side, the trade balance reached its widest level on record (about 3% of GDP) as export growth remains uneven...
Tighter financial conditions from US spillovers. The 50 basis point rise in US yield since the election has brought Canadian yields higher as well, posing some concern about a premature tightening of financial conditions. Despite the rise in US yields, the Canadian dollar trails only the British pound in its relative outperformance versus the USD since the election. It is likely too early to expect.
FX: Focus on Fed, US yields with high hurdle for near-term BoC cut. The BoC's on-hold stance is likely to have short-term little impact on USD/CAD, particularly with market pricing consistent with little (if any) BoC action through mid- 2017. However, with the OIS curve relatively flat (Chart 2), we continue to believe the market is underpricing the risks around the Canadian economy. The pricing out of cuts since the October meeting has been one reason the C$ has performed well, despite broader USD strength and additional risk premia from Trump-induced trade policy uncertainty. However, USD/CAD's inability to sustainably selloff following OPEC's surprise decision to cut production by 1.2 mn bbl/day suggests the market is more focused on the global yield story than oil price movements. Indeed, $50/bbl WTI prices are still below the full cycle breakeven costs of many Canadian producers.
We continue to expect a sustained move higher in USD/CAD towards year-end and over the course of 2017 driven by: 1) a faster pace of Fed hikes than the market is currently expecting, 2) a tepid pace of Canadian growth as capacity and competitiveness issues hamper non-energy exports leading to a BoC cut in H2 2017, and 3) increased uncertainty with respect to Canadian trade as President-elect Trump seeks to renegotiate trade deals.
With oil prices likely to move higher post-OPEC, implicitly we are assuming the recent decline in correlation between CAD and oil will continue to be displaced by rate differentials. As we have show empirically, CAD's sensitivity to rate differentials has increased in recent years. While higher oil will lend some residential demand for CAD, we expect the rate story to dominate over the coming years, underpinning our bearish view.
BofA Merrill targets USD/CAD at 1.36 by year-end and at 1.38, 1.40, 1.41, 1.43 by the end of Q1, Q2, Q3, and Q4 of 2017 respectively".
Copyright © 2016 BofAML, eFXnews™
-
13:18
NOK Could Face Pressure Ahead of Meeting of OPEC, Non-OPEC
-
12:59
Orders
EUR/USD
Offers : 1.0735 1.0750 1.0780-85 1.0800 1.0820 1.0850 1.0875-80 1.0900
Bids: 1.0700 1.0680 1.0650 1.0620 1.0600 1.0580 1.0550
GBP/USD
Offers : 1.2655-60 1.2685 1.2700 1.2725-30 1.2750 1.2780-85 1.2800
Bids: 1.2600 1.2585 1.2550-55 1.2530-35 1.2500 1.2480 1.2450
EUR/GBP
Offers : 0.8520-25 0.8550 0.8575-80 0.8600
Bids: 0.8480 0.8460 0.8430 0.8400 0.8380 0.8350
EUR/JPY
Offers : 122.60 122.85 123.00 123.50 124.00 124.50 124.80 125.00
Bids: 122.00 121.80 121.50 121.00 120.80-85 120.50
USD/JPY
Offers : 114.50 114.80-85 115.00 115.25 115.45-50
Bids: 114.00 113.80 113.50-60 113.20 113.00 112.85 112.50 112.20 112.00
AUD/USD
Offers : 0.7475-80 0.7500-05 0.7520 0.7545-50 0.7580 0.7600
Bids: 0.7420 0.7400 0.7380 0.7355-60 0.7325-30 0.7300 0.7285 0.7250
-
12:40
Daily technical analysis for USD / JPY
Resistance 3: Y115.83 (9 February high)
Resistance 2: Y115.26 (10 February high)
Resistance 1: Y114.82 (1 December high)
Current price: Y114.01
Support 1: Y112.87 (5 December low)
Support 2: Y112.06 (30 of November low)
Support 3: Y110.84 (23 of November low)
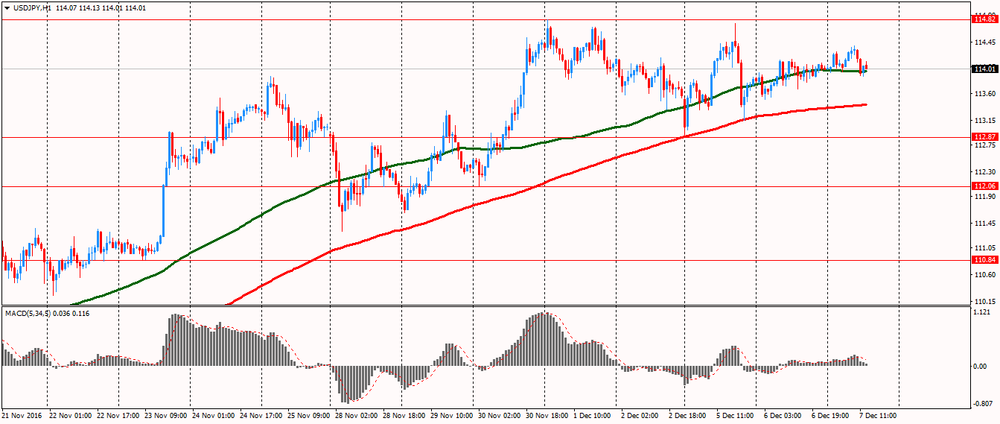
On the hour, four-hour and daily chart the pair is trading above the MA 200. In addition, 14-day relative strength index (RSI (14) on the D1), above the level of 70 that signals a possible reversal.
-
11:05
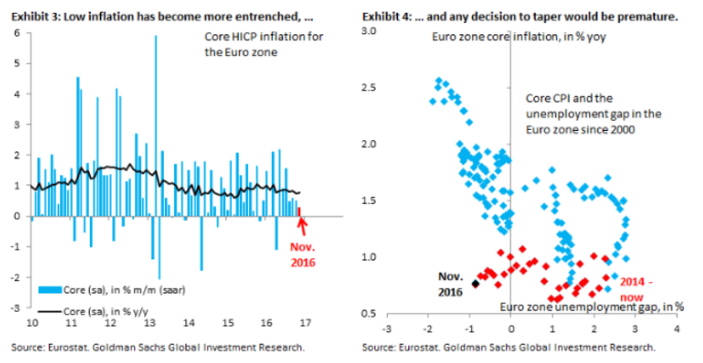
Goldman think markets will put more weight on the ECB tapering signal, rather than any kind of program extension
"For markets, this week's ECB holds two questions.
First, will there be a formal taper decision. Second, if there is no formal announcement to this effect (our base case is for a continuation of the bond buying program at an unchanged pace through late 2017), is the backdrop to the Governing Council sufficiently caustic that President Draghi in the press conference essentially signals that a taper will soon be coming. We think markets will treat either outcome with little distinction. EUR/$ would go up, perhaps substantially.
Some have been discussing scenarios that aim to split the difference for the ECB, for example tapering purchases to a monthly pace of EUR 40-50 bn, but then extending the program for longer, say through Q1 2018. We think such proposals fail to take account of how skeptical markets have become where the ECB is concerned. After all, the December 2015 meeting and the misfire in March of this year have taught markets to be extremely skeptical as to the ECB's willingness and ability to ease.
As a result, we think markets will put more weight on the tapering signal, rather than any kind of program extension (which is subject to modification anyway).
We think this is no time to taper, simply because of the challenging inflation dynamics in the Euro zone, in line with our European economics team's assessment A premature taper, which a decision to this effect at this meeting would certainly be, will only complicate the ECB's task of getting the Euro zone out of lowflation and fundamentally banishing deflation risk".
Copyright © 2016 Goldman Sachs, eFXnews™
-
10:33
RBI May Resume Rate Cut After Dust Settles on Big Note Ban
-
09:36
UK industrial production down 1.3% on mining and quarrying downward pressure
In October 2016, total production is estimated to have decreased by 1.3% compared with September 2016. Mining and quarrying provided the largest downward pressure, due to ongoing maintenance reducing production in the oil and gas extraction industry. You should note that we always warn against overly interpreting 1 month's figures.
Manufacturing decreased by 0.9% on the month to October 2016, following an increase of 0.6% in the previous month. The decreases were broad-based across the sector, with the largest downward pressure coming from pharmaceuticals, which fell by 3.6%.
The month on same month a year ago picture shows a decrease in total production of 1.1% in October 2016 with decreases in 3 of the 4 main sectors. The largest downward contribution came from mining and quarrying, falling by 8.7%, mainly due to maintenance in the oil and gas industry in October 2016.
-
09:30
United Kingdom: Industrial Production (YoY), October -1.1% (forecast 0.5%)
-
09:30
United Kingdom: Manufacturing Production (MoM) , October -0.4% (forecast 0.2%)
-
09:30
United Kingdom: Industrial Production (MoM), October -1.3% (forecast 0.2%)
-
09:30
United Kingdom: Manufacturing Production (YoY), October -0.4% (forecast 0.8%)
-
09:21
ING Advises Short GBP/USD Above $1.2630, Sees $1.15 in 1Q 2017
-
09:00
Option expiries for today's 10:00 ET NY cut
EUR/USD 1.0500 (EUR 580m) 1.0650 (464m) 1.0750 (1.07bln) 1.0800 (456m)
USD/JPY 114.50 (USD 337m)
GBP/USD 1.2665 (GBP 318m) 1.2840 (595m)
AUD/USD 0.7500 (AUD 496m)
USD/CAD 1.3500 (USD 576m)
-
08:37
UK house price index rose in line with expectations in November
House prices in the three months to November were 0.8% higher than in the previous three months (JuneAugust). This is an improvement on the two previous months when the quarterly rate was broadly unchanged. Nonetheless, the quarterly rate of change remains well below the 3.0% increase recorded in February.
Prices in the three months to November were 6.0% higher than in the same three months a year earlier. This was the first increase for eight months and compared to 5.2% in October. Overall, the annual rate has been on a steady downward trend in recent months since reaching a peak of 10.0% in March. November's 6.0% is the highest since August 2016 (6.9%).
Martin Ellis, Halifax housing economist, said: "Despite November's pick-up, the annual rate has been on a steady downward trend in recent months since reaching a peak of 10.0% in March. Heightened affordability pressures, resulting from a sustained period of house price growth in excess of earnings rises, appear to have dampened housing demand, contributing to the slowdown in house price inflation. Very low mortgage rates and an ongoing, and acute, shortage of properties available for sale should help support price levels although annual house price growth may slow over the coming months."
-
08:30
United Kingdom: Halifax house price index, November 0.2% (forecast 0.2%)
-
08:30
United Kingdom: Halifax house price index 3m Y/Y, November 6% (forecast 6%)
-
08:26
Today’s events
-
At 10:30 GMT, Britain will hold an auction of 30-year bonds
-
At 15:00 GMT the Bank of Canada decision on the basic interest rate and the accompanying statement of the Central Bank
-
-
07:19
ANZ thinks GBP/USD stability to be short-lived
"The UK November services PMI rose to its highest level since January (55.2 vs 54.5 in October), indicating that growth continues to hold up well so far in Q4. Services account for nearly 80% of UK GDP, so that bodes well for spending and employment growth as 2017 unfolds. The economic reality (at least as far as coincident data is concerned) is that the economy has received a significant monetary stimulus via the exchange rate and additional BoE easing measures.
Given that Article 50 hasn't been triggered and the UK remains a full member of the EU, it is business as usual for now and the economy is performing well. Sterling's recent stabilisation in part reflects that, as well as some possible signs that the government is maintaining a pragmatic approach to Brexit rather than hurtling down the hard Brexit route.
Brexit minister David Davis indicated recently the government could consider making some payments to the EU in return for access to the single market. That struck a different tone from the hard Brexit ethos evident at the October Tory Party conference. Meanwhile, the market awaits the Supreme Court's decision in early January on whether the government needs to consult with Parliament before triggering Article 50. That could delay an announcement beyond March 2017. Once Article 50 is triggered, uncertainty is likely to rise and financing the BoP deficit remains a major issue. Investment spending and inward FDI may fall whilst rising inflation will eat into real incomes. Against that backdrop, GBP's decline is likely to resume.
ANZ targets GBP/USD at 1.22 by the end of Q1 2017".
Copyright © 2016 ANZ, eFXnews™
-
07:18
Options levels on wednesday, December 7, 2016:
EUR/USD
Resistance levels (open interest**, contracts)
$1.0874 (3327)
$1.0838 (5660)
$1.0782 (3027)
Price at time of writing this review: $1.0718
Support levels (open interest**, contracts):
$1.0640 (3734)
$1.0573 (6047)
$1.0533 (3337)
Comments:
- Overall open interest on the CALL options with the expiration date December, 9 is 89903 contracts, with the maximum number of contracts with strike price $1,1400 (6406);
- Overall open interest on the PUT options with the expiration date December, 9 is 76027 contracts, with the maximum number of contracts with strike price $1,0450 (6106);
- The ratio of PUT/CALL was 0.85 versus 0.84 from the previous trading day according to data from December, 6
GBP/USD
Resistance levels (open interest**, contracts)
$1.2900 (745)
$1.2801 (1768)
$1.2704 (2022)
Price at time of writing this review: $1.2648
Support levels (open interest**, contracts):
$1.2598 (1224)
$1.2499 (2484)
$1.2400 (1564)
Comments:
- Overall open interest on the CALL options with the expiration date December, 9 is 35977 contracts, with the maximum number of contracts with strike price $1,3400 (2561);
- Overall open interest on the PUT options with the expiration date December, 9 is 36328 contracts, with the maximum number of contracts with strike price $1,2000 (2586);
- The ratio of PUT/CALL was 1.01 versus 0.97 from the previous trading day according to data from December, 6
* - The Chicago Mercantile Exchange bulletin (CME) is used for the calculation.
** - Open interest takes into account the total number of option contracts that are open at the moment.
-
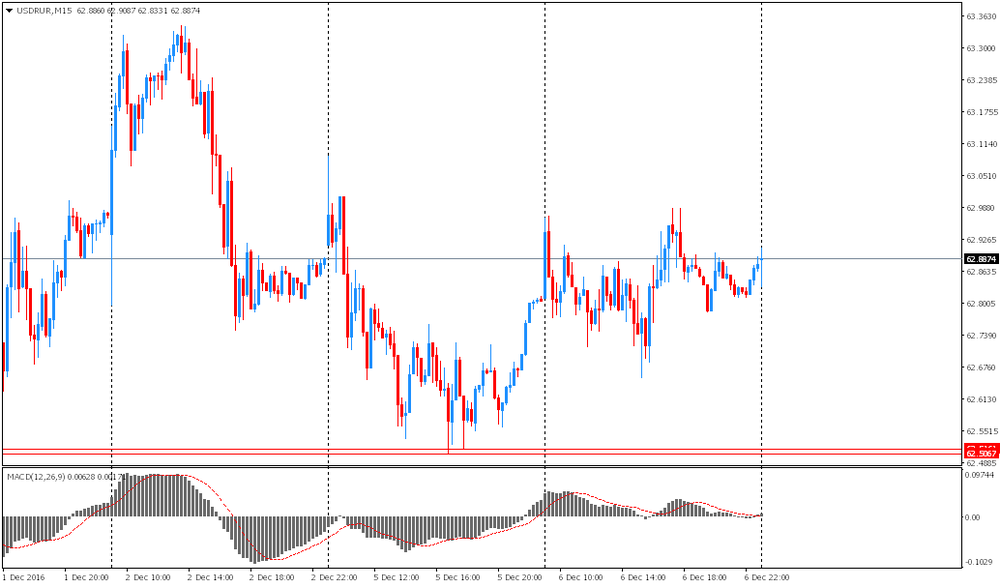
07:16
USD / RUR opened flat
After opening USD / RUR was trading at yesterday's close, at around 62.85. Oil prices showed a slight decrease, which in turn supports USD / RUR. Currently the nearest support is the area of 1 and 5 December lows - 62.50.
-
07:10
The index of construction activity in Australia increased in November
The index of activity in the construction sector of Australia, published by the Australia Industry Group (AiG) and the Association of the housing industry was 46.6 points in November, higher than the previous value of 45.9. This indicator is based on a survey of 120 companies and reflects the conditions in the construction sector in the short and medium term. Companies respond to questions relating to production, employment, supplier prices, stocks and new orders. The high value of the index is positive, or bullish for the Australian currency.
The AiG report noted that an increase of 0.7 points from October indicates a somewhat slower rate of decline in the construction industry as a whole. Softer reduction was due to a less pronounced decline in new orders and deliveries from suppliers.
-
07:08
Reserve Bank of New Zealand, Graeme Wheeler: I expect a return to target levels of inflation in the 4th quarter
During his speech before the parliamentary committee Reserve Bank of New Zealand governor said he expected the return to target levels of inflation in the 4th quarter. Responding to parliamentary questions, Wheeler noted that the country's economy is relatively stable. However, the head of the RBNZ has admitted that was concerned about the pace of growth in labor productivity, as well as indicators of GDP growth.
-
07:03
German industrial production rose less than expected in October
In October 2016, production in industry was up by 0.3% from the previous month on a price, seasonally and working day adjusted basis according to provisional data of the Federal Statistical Office (Destatis). In September 2016, the corrected figure shows a decrease of 1.6% (primary -1.8%) from August 2016.
In October 2016, production in industry excluding energy and construction was up by 0.1%.
Within industry, the production of capital goods increased by 0.5% and the production of consumer goods by 0.1%.The production of intermediate goods shows a decrease by 0.5%. Energy production was down by 0.5% in October 2016 and the production in construction increased by 1.7%.
-
07:02
Germany: Industrial Production s.a. (MoM), October 0.3% (forecast 0.8%)
-
06:58
First quarter of negative growth for Aussie GDP since 2011
The volume of activity in the Australian economy decreased 0.5 per cent in the September quarter 2016, the first quarter of negative growth since the Queensland flood affected March quarter 2011. Through the year growth remains positive at 1.8 per cent, reflecting the three previous quarters of growth.
Economic activity contracted in a number of areas this quarter. Private investment in new buildings detracted 0.3 percentage points from GDP growth, while new engineering and new and used dwellings detracted 0.2 and 0.1 percentage points respectively. Public capital expenditure detracted 0.5 percentage points from growth as it declined from elevated levels in the June quarter. Net exports detracted an additional 0.2 percentage points from growth. Australia's terms of trade rose 4.5 per cent through the September quarter.
The reduced building activity is reflected in the output of the construction industry which fell 3.6 per cent for the quarter and was the largest contributor to the fall in GDP growth on an industry basis. A number of other industries also recorded below trend growth, or declined, this quarter, including financial and insurance services, professional scientific and technical services, rental hiring and real estate services and administrative support services. The largest offset to these falls was agriculture which grew 7.5 per cent. Mining production contributed no growth, but maintained its historically high levels of production.
-
05:16
Japan: Leading Economic Index , October 101
-
05:02
Japan: Coincident Index, October 113.9
-
00:30
Australia: Gross Domestic Product (QoQ), Quarter III -0.5% (forecast 0.3%)
-
00:30
Australia: Gross Domestic Product (YoY), Quarter III 1.8% (forecast 2.5%)
-