Market news
-
23:28
Currencies. Daily history for Dec 08’2016:
(pare/closed(GMT +3)/change, %)
EUR/USD $1,0614 -1,29%
GBP/USD $1,2584 -0,30%
USD/CHF Chf1,0161 +0,88%
USD/JPY Y114,03 +0,24%
EUR/JPY Y121,03 -1,07%
GBP/JPY Y143,48 -0,07%
AUD/USD $0,7462 -0,24%
NZD/USD $0,7172 +0,11%
USD/CAD C$1,3189 -0,33%
-
23:00
Schedule for today,Friday, Dec 09’2016 (GMT0)
00:30 Australia Home Loans October 1.6% -1%
01:30 China PPI y/y November 1.2% 2.2%
01:30 China CPI y/y November 2.1% 2.2%
06:45 Switzerland Unemployment Rate (non s.a.) November 3.2%
07:00 Germany Current Account October 24.2
07:00 Germany Trade Balance (non s.a.), bln October 24.4
07:45 France Industrial Production, m/m October -1.1% 0.6%
09:30 United Kingdom Total Trade Balance October -5.2
15:00 U.S. Wholesale Inventories October 0.1% -0.4%
15:00 U.S. Reuters/Michigan Consumer Sentiment Index (Preliminary) December 93.8 94.5
-
15:53
OECD: Leading index indicates stable growth
The Organization for Economic Cooperation and Development reported that the index of leading indicators suggests a steady growth momentum for the world economy.
The composite index of leading indicators remained stable at 99.8 in October, OECD said on Thursday.
LED indicates that the pace of growth accelerated in several developed economies and strengthened in the major emerging economies.
Signs of growth, which is gaining momentum, appeared in the composite index of leading indicators for the United States, Canada, Germany and France, according to the OECD.
Growth is expected to gain momentum in the emerging markets, namely China and India. At the same time, a steady growth momentum was recorded in Japan and the Euro Zone.
-
15:18
Nowotny: I personally think ECB measures suffice for '17, inflation likely to rise
-
15:09
Earthquake M6.8: Ferndale, California
-
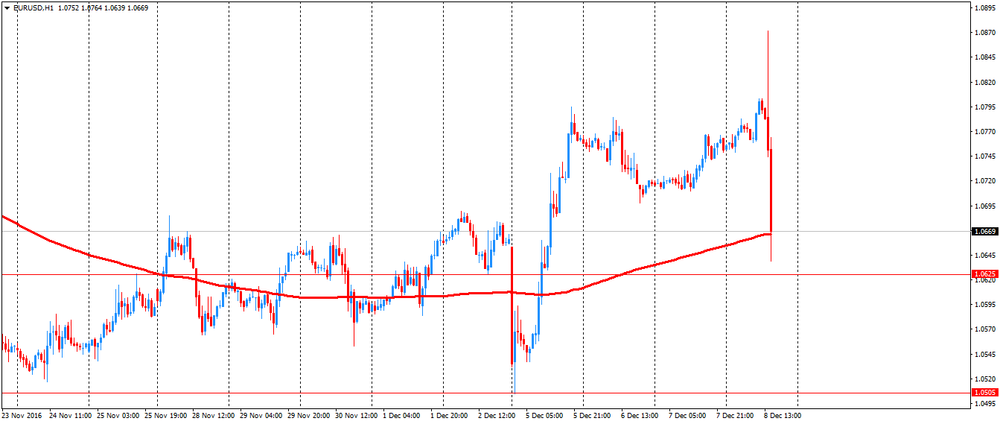
14:32
The US dollar continued to rise against the ECB press conference. EUR / USD has fallen about 250 pips from session highs and is currently trading at $ 1.0669.
The nearest resistance is at $ 1.0953 (November 10 high). Strong support at $ 1.0625 (December 2 low).
-
13:56
Draghi: Tapering Has Not Been Discussed Today
-
Tweaks Eligibility Criteria for Bonds
-
Confident Italian Government Knows What to Do
-
Indicates Consensus, but Not Unanimity Behind QE Decision
-
Gradually Moving Purchases to Zero Wasn't Discussed
-
'Sustained Presence' of ECB in Markets Is Message of Today's Decision
-
-
13:54
Canadian municipalities issued $7.6 billion worth of building permits in October, up 8.7% from September
Municipalities issued $7.6 billion worth of building permits in October, up 8.7% from September. Higher construction intentions for commercial structures and residential dwellings in Alberta were responsible for much of the gain, as builders filed permits in advance of the changes in the provincial Building Code.
The value of residential building permits rose 7.7% to $5.2 billion in October. This was the third consecutive monthly increase. Advances were posted in eight provinces, led by Alberta and followed by British Columbia and Ontario.
Construction intentions for non-residential buildings increased 10.7% to $2.5 billion in October, following a 21.4% drop in September. Gains were registered in eight provinces, led by Alberta. Quebec and Manitoba reported declines in the non-residential sector.
-
13:50
Option expiries for today's 10:00 ET NY cut
EUR/USD 1.0500 (EUR 1.08bln) 1.0650 (482m) 1.0750 (722m) 1.0800 (1.51bln)
USD/JPY 111.00 (USD 798m) 113.00 (820m) 113.15 (400m) 114.60 (618m) 116.05-15 (621m)
GBP/USD 1.2500 (GBP 684m)
USD/CHF 0.9950 (400m)
AUD/USD 0.7250 (416m) 0.7350 (473m)
USD/CAD 1.3450 (USD 850m)
-
13:39
Canadian capacity utilization rate rose
Canadian industries operated at 81.9% of their production capacity in the third quarter, up from 79.7% in the previous quarter. The increase was mainly attributable to the oil and gas extraction industry as operations resumed following the Fort McMurray wildfires.
The 2.2 percentage point gain was the largest quarterly increase recorded by Canadian industries since industrial capacity utilization rates were first published in their current form starting in the first quarter of 1987.
-
13:36
Draghi: Extension of Purchases Allows for More Lasting Transmission
-
See Moderate, Firming Recovery, Subdued Inflationary Pressure
-
Extension of Program Calibrated to Preserve Substantial Accommodation
-
Purchases With Yield Below Deposit Rate Permitted to Extent Necessary
-
Maturity Range of Public Sector Program Broadened
-
Conducted Comprehensive Assessment of Outlook and Policy Stance
-
See Continuation of Growth Trend in 4Q
-
Will Act, If Warranted, By Using All Instruments
-
-
13:33
US unemployment claims in line with expectations
In the week ending December 3, the advance figure for seasonally adjusted initial claims was 258,000, a decrease of 10,000 from the previous week's unrevised level of 268,000. The 4-week moving average was 252,500, an increase of 1,000 from the previous week's unrevised average of 251,500.
There were no special factors impacting this week's initial claims. This marks 92 consecutive weeks of initial claims below 300,000, the longest streak since 1970.
-
13:31
Canada: Capacity Utilization Rate, Quarter III 81.9%
-
13:30
Canada: Building Permits (MoM) , October 8.7% (forecast -0.7%)
-
13:30
Canada: New Housing Price Index, MoM, October 0.4% (forecast 0.2%)
-
13:30
U.S.: Initial Jobless Claims, 258 (forecast 258)
-
13:30
U.S.: Continuing Jobless Claims, 2005 (forecast 2059)
-
13:19
Canadian housing starts kept a steady pace in November
The trend measure of housing starts in Canada was 199,135 units in November compared to 199,641 in October, according to Canada Mortgage and Housing Corporation (CMHC). The trend is a six-month moving average of the monthly seasonally adjusted annual rates (SAAR) of housing starts.
"Housing starts kept a steady pace in November as upward trends observed in British Columbia and the Prairies offset downward trends recorded in Ontario, Quebec and the Atlantic provinces," said Bob Dugan, CMHC Chief Economist. "We're also seeing that housing starts are on track to have moderated in 2016 compared to 2015 in most centres where we detected overbuilding."
-
13:15
Canada: Housing Starts, November 184 (forecast 191.2)
-
13:01
ECB will continue to buy assets at current rates until the end of March 2017
-
until April 2017 the purchase will continue at 60 billion euros
-
we expect that rates will remain at current or lower levels for an extended period
-
we can increase the amount or duration of the QE program in the event of deterioration in prospects
-
some parameters of asset purchase program will be changed
-
the ECB will announce a change in the parameters of the purchase of assets at the press conference
-
-
12:48
ECB holds rates. EUR/USD up 90 pips so far
At today's meeting the Governing Council of the ECB decided that the interest rate on the main refinancing operations and the interest rates on the marginal lending facility and the deposit facility will remain unchanged at 0.00%, 0.25% and -0.40% respectively. The Governing Council continues to expect the key ECB interest rates to remain at present or lower levels for an extended period of time, and well past the horizon of the net asset purchases.
-
12:45
Eurozone: ECB Interest Rate Decision, 0.0% (forecast 0%)
-
11:15
Goldman Sachs: ECB Meeting Holds 2 Questions For Markets
For markets, this week's ECB holds two questions. First, will there be a formal taper decision. Second, if there is no formal announcement to this effect (our base case is for a continuation of the bond buying program at an unchanged pace through late 2017), is the backdrop to the Governing Council sufficiently caustic that President Draghi in the press conference essentially signals that a taper will soon be coming. We think markets will treat either outcome with little distinction. EUR/$ would go up, perhaps substantially. As a result, we think markets will put more weight on the tapering signal, rather than any kind of program extension (which is subject to modification anyway). We think this is no time to taper, simply because of the challenging inflation dynamics in the Euro zone, in line with our European economics team's assessment A premature taper, which a decision to this effect at this meeting would certainly be, will only complicate the ECB's task of getting the Euro zone out of lowflation and fundamentally banishing deflation risk.
-
11:05
The volume of trade between Russia and China increased by 1.6% to $ 62.4 billion
Trade turnover between Russia and China in the first 11 months of 2016 grew by 1.6% y/y and reached 62.37 billion dollars. This is stated in the report of the General Customs Administration of China released today.
During the same period, the volume of deliveries of Russian goods to China fell by 4.1% and amounted to 28.98 billion dollars. Chinese exports to the Russian Federation in January - November increased by 7.2% - to 33.39 billion dollars.
Trade turnover between Russia and China decreased by 27.8% in 2015 to 422.7 billion yuan (64.2 billion US dollars). The volume of exports of Chinese goods to Russia fell by 34.4% last year to 216.2 billion yuan (32.9 billion dollars), while imports of Russian goods to China decreased by 19.1% to 206.5 billion yuan (31.4 billion dollars).
-
10:22
BNPP: EUR/USD To Struggle To Extend Upside Much Beyond 1.08.
Our economists also note that in light of the 'no' vote, the likelihood of the ECB announcing a scaling back of asset purchases is now less likely at their meeting this Thursday, and that a change in forward guidance in order to give some sort of signal to the markets that QE cannot continue indefinitely in the current form is instead more probable. We would expect EUR/USD to struggle to extend upside much beyond 1.08.
-
09:12
Morgan Stanley: Justification For A Mild EUR Weakness Over ECB The Meeting
We believe the reaction of the EUR over the ECB meeting will ultimately depend on the probability of tapering in the next 12m. In particular, EURUSD will depend on the short end rate differential between EMU and the US. Our more medium term view, beyond this ECB meeting, is that we expect EURUSD to fall based on the rate differential staying wide and broad USD strength. Our economist's assumption is that the ECB will keep rates on hold at this week's meeting but add a 6m extension to its QE purchase programme. Since the ECB will come back with results from its committees on which QE constraints to relax, investors may have to deal with a plethora of information over the press conference, including new macro economic forecasts. Here are some points we will be looking for as FX watchers and the potential impact it would have on the EUR when taking each measure in isolation. We see justification for the EUR to weaken mildly over the ECB meeting.
-
09:04
Option expiries for today's 10:00 ET NY cut
EUR/USD 1.0500 (EUR 1.08bln) 1.0650 (482m) 1.0750 (722m) 1.0800 (1.51bln)
USD/JPY 111.00 (USD 798m) 113.00 (820m) 113.15 (400m) 114.60 (618m) 116.05-15 (621m)
GBP/USD 1.2500 (GBP 684m)
USD/CHF 0.9950 (400m)
AUD/USD 0.7250 (416m) 0.7350 (473m)
USD/CAD 1.3450 (USD 850m)
Информационно-аналитический отдел TeleTrade
-
08:30
Today’s events
-
At 12:45 GMT publication of the ECB's decision on the basic interest rate
-
At 13:30 GMT the ECB Press Conference
-
-
07:37
Credit Agricole: Limited Room For ECB To Extend Dovish Expectations; EUR/USD A Buy
The EUR has been broadly range-bound after rebounding from this year's lows. The main focus should turn to this week's ECB monetary policy announcement as a currency driver, especially as political uncertainty is unlikely to increase further in the short-term. As reported by "La Republica" yesterday morning Renzi may press for early elections in January/February next year in return for staying in power until then. However, according to President Mattarella early elections are technically not feasible because changes would be needed to the country's election law. We remain of the view that EUR/USD is a buy. Limited room of the ECB exceeding dovish expectations coupled with speculative short positioning close to multi-week extremes should keep the risk of further position squaring upside intact. This is especially true should the Fed fail to consider a more than anticipated hawkish forward guidance.
-
07:29
Japan's GDP lower than expected in the third quarter
Real gross domestic product of Japan in the third quarter was 0.3%, which is below analysts' forecast of 0.6%. The second quarter was marked by Japan's economy grew by 0.5%. On an annualized basis GDP increased by 1.3% compared with the previous quarter of +2.2%. Economists had forecast a GDP growth of 2.3%.
The yen fell slightly after the publication of GDP data, but recovered.
-
07:25
Options levels on thursday, December 8, 2016:
EUR/USD
Resistance levels (open interest**, contracts)
$1.0877 (3603)
$1.0844 (5976)
$1.0797 (3019)
Price at time of writing this review: $1.0765
Support levels (open interest**, contracts):
$1.0720 (3304)
$1.0666 (3710)
$1.0589 (6193)
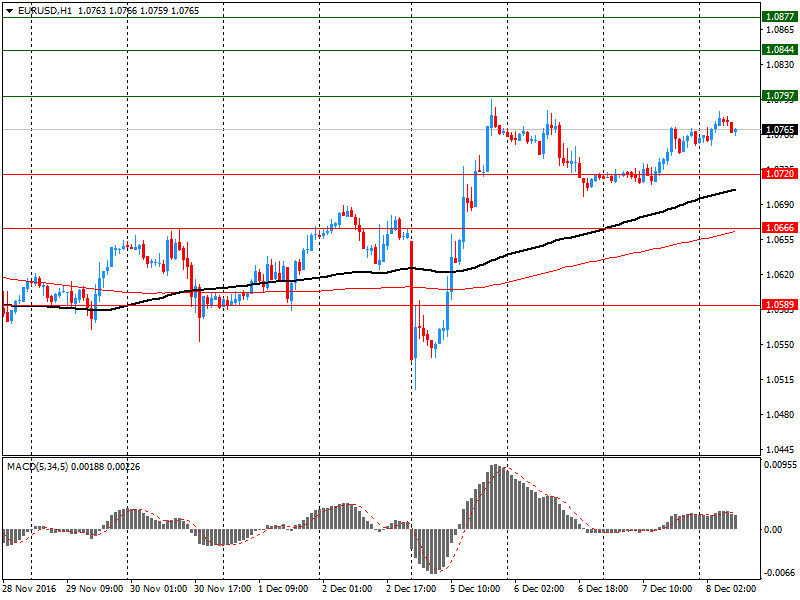
Comments:
- Overall open interest on the CALL options with the expiration date December, 9 is 90023 contracts, with the maximum number of contracts with strike price $1,1400 (6406);
- Overall open interest on the PUT options with the expiration date December, 9 is 75479 contracts, with the maximum number of contracts with strike price $1,0600 (6193);
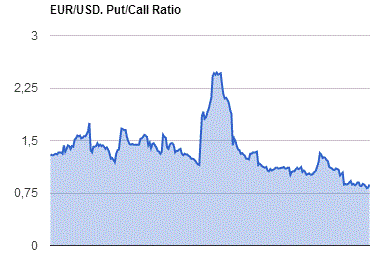
- The ratio of PUT/CALL was 0.84 versus 0.85 from the previous trading day according to data from December, 7
GBP/USD
Resistance levels (open interest**, contracts)
$1.2900 (705)
$1.2801 (1760)
$1.2702 (1995)
Price at time of writing this review: $1.2647
Support levels (open interest**, contracts):
$1.2597 (1204)
$1.2499 (2499)
$1.2400 (1563)
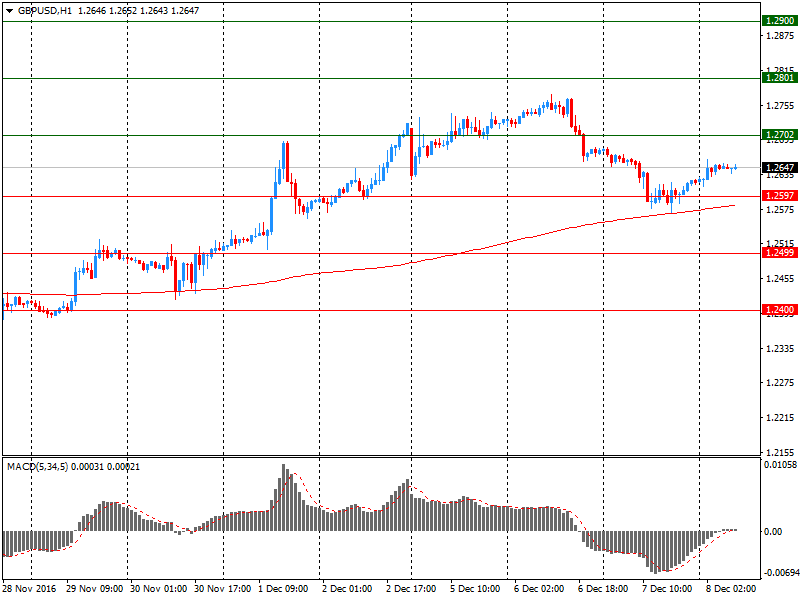
Comments:
- Overall open interest on the CALL options with the expiration date December, 9 is 36115 contracts, with the maximum number of contracts with strike price $1,3400 (2561);
- Overall open interest on the PUT options with the expiration date December, 9 is 36221 contracts, with the maximum number of contracts with strike price $1,1750 (2539);
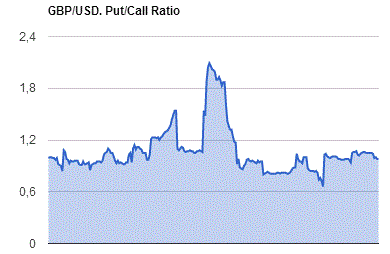
- The ratio of PUT/CALL was 1.00 versus 1.01 from the previous trading day according to data from December, 7
* - The Chicago Mercantile Exchange bulletin (CME) is used for the calculation.
** - Open interest takes into account the total number of option contracts that are open at the moment.
-
07:22
China's trade surplus declined in November
According to data released by the Customs General Administration of China, the trade balance was $ 44.61 bln in November, after the growth recorded in October to $ 49.06 billion. Economists had expected the growth rate to $ 46.30 billion. This indicator measures the ratio of the total exports and imports of all goods and services. A positive balance indicates a surplus, while a negative, deficit. As China's economy has a major impact on the global economy, this indicator has a specific meaning for the Forex market.
Export of goods and services from China increased by 5.9% in November, after declining in October to -7.3%.
Imports rose much higher than expected to 13.0%, after falling in the previous month by 1.4%.
-
07:14
Aussie trade balance deficit rose in October
In trend terms, the balance on goods and services was a deficit of $1,565m in October 2016, a decrease of $154m (9%) on the deficit in September 2016.
In seasonally adjusted terms, the balance on goods and services was a deficit of $1,541m in October 2016, an increase of $269m (21%) on the deficit in September 2
In seasonally adjusted terms, goods and services credits rose $389m (1%) to $27,631m. Non-rural goods rose $223m (1%) and non-monetary gold rose $198m (13%). Rural goods fell $150m (4%) and net exports of goods under merchanting fell $3m (6%). Services credits rose $121m (2%).
-
07:10
Moody's says that Australian banks demonstrated mildly deteriorating asset quality
Moody's Investors Service says that Australian banks demonstrated mildly deteriorating asset quality metrics during the six months to 31 September 2016, although they remain well capitalized to withstand an adverse shocks. At the same time, their funding profiles have improved.
"We expect that asset quality will continue to be supported by low interest rates, but that gradual pressure will be exerted by multiple headwinds," says Maadhavi Ramanayake, a Moody's Associate Analyst. "However, the banks are well capitalized to absorb any losses."
Moody's expects asset quality metrics to gradually come under further pressure as a result of multiple headwinds, including stress in resources-related sectors and regions; underemployment and weak wage growth; a worsening outlook for residential property developments; and the cumulative effects of weak milk prices on the dairy sector, notably in their New Zealand subsidiaries. Housing risks also remain elevated as house prices continued to appreciate in the key Sydney and Melbourne markets, which eroded modest improvements in housing affordability.
-
07:04
French payroll employment continued to increase
In Q3 2016, payroll employment in the non-farm market sectors continued to increase (+51,200 jobs, that is 0.3%, after +29,400 jobs in the previous quarter). This slight acceleration compared to the second quarter is due to temporary employment (+29,500 jobs, i.e. +5.0%, after −200 jobs in Q2 2016). Year-on-year, the principally market sectors created 178,700 net jobs (+1.1%).
-
05:16
Japan: Eco Watchers Survey: Outlook, November 53.0
-
05:01
Japan: Eco Watchers Survey: Current , November 48.6
-
04:03
China: Trade Balance, bln, November 46.3 (forecast 46.3)
-
00:30
Australia: Trade Balance , October -1.54 (forecast -0.8)
-