Market news
-
23:28
Currencies. Daily history for Dec 20’2016:
(pare/closed(GMT +3)/change, %)
EUR/USD $1,0386 -0,14%
GBP/USD $1,2366 -0,21%
USD/CHF Chf1,0286 +0,16%
USD/JPY Y117,84 +0,64%
EUR/JPY Y122,41 +0,51%
GBP/JPY Y145,72 +0,45%
AUD/USD $0,7258 +0,22%
NZD/USD $0,6914 -0,19%
USD/CAD C$1,3366 -0,30%
-
23:00
Schedule for today,Wednesday, Dec 21’2016 (GMT0)
04:30 Japan All Industry Activity Index, m/m October 0.2%
09:30 United Kingdom PSNB, bln November -4.3 -11.3
14:00 Belgium Business Climate December -1.8 -1.3
14:00 Switzerland SNB Quarterly Bulletin
15:00 Eurozone Consumer Confidence (Preliminary) December -6.1 -6
15:00 U.S. Existing Home Sales November 5.6 5.5
15:30 U.S. Crude Oil Inventories December -2.563
21:45 New Zealand Current Account Quarter III -0.94 -5.015
21:45 New Zealand GDP q/q Quarter III 0.9% 0.9%
21:45 New Zealand GDP y/y Quarter III 3.6% 3.7%
-
22:01
New Zealand: Visitor Arrivals, November 11%
-
21:45
New Zealand: Trade Balance, mln, November -705
-
15:22
EUR/SEK is moving lower as market participants don't believe the Riksbank will cut rates on Wednesday
-
15:08
Hungary's central bank revises considerably its 2017 growth forecast to 3.6% from 3.0%
-
14:48
UK PM May: Exit negotiations will not be extended but they might be concluded sooner than two years
-
Art. 50 process will not be extended
-
The governments machinery to prepare for Brexit is running well
-
Will not give a running commentary on negotiations
-
Fully expects to operate within the timetable set out by art50 and to leave the EU by Apr 2019
-
Will introduce a repeal bill next year to come into effect when we leave the EU
-
Will make a speech early next year to set out the Brexit approach
-
When we are outside the EU, British courts will set all the law in UK
*via forexlive -
-
14:16
Global dairy trade price index -0.5%
-
Prior 3.5%
-
Average auction price $3656 MT
-
-
14:14
EUR/USD Falls to Lowest Since 2003
-
13:51
Option expiries for today's 10:00 ET NY cut
EUR/USD 1.0400 (EUR 937m) 1.0500 (1.65bln) 1.0510-15 (836m)
USD/JPY 115.35-50 (USD 1bln) 116.25 (441m)
GBP/USD 1.2100 (GBP 405m)
AUD/USD 0.7200 (AUD 997m) 0.7390-0.7400 (818m) 0.7500 444m)
USD/CAD 1.3300 (USD 808m) 1.3800 (801m)
NZD/USD 0.6900 (526m)
-
13:39
Ex Deutsche Bank employee has earned 255 million rubles by manipulating "blue chip" stocks
The Bank of Russia has established that the Moscow stock exchange trading of 8 large companies was manipulated from January 2013 to July 2015, in which a group of people made a profit of about 255 million rubles.
Transactions within the specified period of time were made with ordinary shares of Gazprom, VTB, MMC Norilsk Nickel, Lukoil, Magnet and Rosneft.
-
13:33
Canadian wholesale sales increased offsetting most of September's 1.5% decrease
Wholesale sales increased 1.1% to $56.6 billion in October, offsetting most of September's 1.5% decrease. Gains were recorded in five subsectors, led by higher sales in the building material and supplies, motor vehicle and parts, and food, beverage and tobacco subsectors.
In volume terms, wholesale sales increased 0.9%.
Sales rose in five of seven subsectors, representing approximately 87% of total wholesale sales.
The building material and supplies subsector recorded the largest increase in dollar terms, up 2.8% to $7.6 billion on the strength of sales in the lumber, millwork, hardware and other building supplies industry, which recorded the lone increase (+5.6%) and reached a record high. Exports of forestry products and building and packaging materials increased in October.
Sales in the motor vehicle and parts subsector rose 1.8% to $11.3 billion in October. While sales increased in two of three industries in the subsector, sales in the motor vehicle industry (+1.2%) rose to a record high and accounted for more than half of the advance in the subsector. Imports and exports of motor vehicles and parts increased in October.
-
13:30
Canada: Wholesale Sales, m/m, October 1.1% (forecast 0.6%)
-
13:05
BNP expects USD to gain broadly in 2017
"We think FX market price action in Q4 2016 will prove to be a reliable template for much of the year ahead, with the USD expected to gain broadly.
Our forecasts, as illustrated in Chart 1, call for the USD to gain ground vs most major and EM currencies, with the BRL and MXN representing notable exceptions.
We expect EURUSD to reach parity by year-end 2017, and we are even more ambitious for USDJPY, which we target at 128.
we remain positioned for USD gains via derivatives in USDJPY (targeting 128 by the end of 2017) and USDCAD (targeting 1.36 by the end of Q1 2017
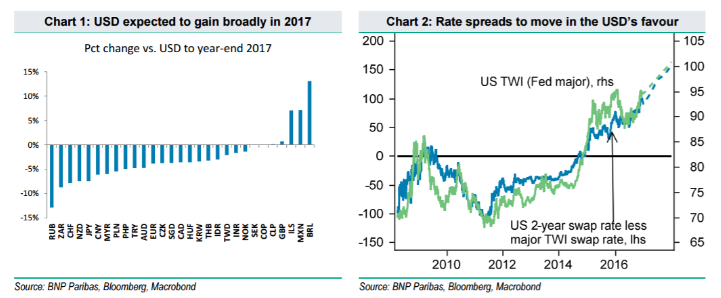
Our forecasts imply that the Fed's broad tradeweighted USD index will appreciate by about 3% in 2017, topping its 2002 peak, and the major currency index will gain about 4%, falling short of its best levels in 2002. As has been the case for most of the past five years, the case for USD appreciation vs. G10 currencies is based on expectations for policy divergence. However, while policy divergence during 2011-16 was mainly driven by policy easing outside of the US, the next phase of USD gains is likely to be driven by Fed rate hikes. Our economists forecast above-trend growth averaging 2.4% in the US in 2017, spurred by fiscally stimulative tax reform and infrastructure spending programs we expect to be passed in the second half of the year.
With the US labour market operating close to full capacity and growth running above trend, we expect wage pressures to rise in 2017 and CPI to accelerate to a 2.2% y/y pace. Against this backdrop, we expect the Fed to deliver two rate hikes in the second half of 2017 and markets will likely price for rate hikes to continue through 2018. Consistent with this, we expect the two-year Treasury yield to reach 1.9% by the end of 2017, up from the current 1.28%. And, with other G10 central banks on hold or even easing further, front-end rate differentials should move substantially further in the USD's favour".
Copyright © 2016 BNP Paribas™, eFXnews™
-
13:00
Orders
EUR/USD
Offers : 1.0400 1.0420-25 1.0450-55 1.0485 1.0500 1.0525 1.0550-55 1.0585 1.0600
Bids: 1.0365 1.0350 1.0335 1.0300
GBP/USD
Offers : 1.2400 1.2425-30 1.2450 1.2485 1.2500-10 1.2530 1.2550
Bids: 1.2355-60 1.2330-35 1.2300 1.2285 1.2250 1.220-25 1.2200
EUR/GBP
Offers : 0.8400-05 0.8420-25 0.8450 0.8460-65 0.8480 0.8500
Bids: 0.8370 0.8350-55 0.8330-35 0.8300 0.8285 0.8250
EUR/JPY
Offers : 122.60 122.80 123.00-05 123.30 123.60 123.85 124.00-10
Bids: 122.00 121.75 121.50 121.00 120.80 120.50 120.00
USD/JPY
Offers : 118.00 118.20-25 118.45-50 118.80 119.00 120.00
Bids: 117.70 117.50 117.25-30 117.00-116.95 116.70 116.50 116.30 116.00
AUD/USD
Offers : 0.7270 0.7285 0.7300 0.7320 0.7350 0.7365 0.7380 0.7400
Bids: 0.7220-25 0.7200 0.7170 0.7145-50 0.7100
-
11:45
Turkish central bank held interest rates steady despite hike exptectations
The Turkish central bank on Tuesday held interest rates steady, surprising economists who had expected an increase, while the local currency remained under pressure against the dollar amid rising security threats, mounting geopolitical risks and expectations of further rate increases by the U.S. Federal Reserve, says Dow Jones.
-
11:06
UK retail sales growth accelerated - CBI
Retail sales growth accelerated in the year to December, with volumes rising at the fastest pace since September 2015, according to the CBI's latest monthly Distributive Trades Survey.
The survey of 112 firms consisting of 53 retailers showed that sales volumes for the time of year were considered well above average, but growth is expected to slow somewhat in the year to January. Meanwhile, orders placed on suppliers rose at the fastest pace in over a year, but are expected to be broadly stable in January.
-
11:02
GBP/USD Falls to 1-Month Low of $1.2344
-
10:31
Thailand's Central Bank Expected to Keep Policy Rate Stable: Poll
-
09:55
Option expiries for today's 10:00 ET NY cut
EUR/USD 1.0400 (EUR 937m) 1.0500 (1.65bln) 1.0510-15 (836m)
USD/JPY 115.35-50 (USD 1bln) 116.25 (441m)
GBP/USD 1.2100 (GBP 405m)
AUD/USD 0.7200 (AUD 997m) 0.7390-0.7400 (818m) 0.7500 444m)
USD/CAD 1.3300 (USD 808m) 1.3800 (801m)
NZD/USD 0.6900 (526m)
Информационно-аналитический отдел TeleTrade
-
09:29
Switzerland's foreign trade surplus increased in November
Switzerland's foreign trade surplus increased in November, as imports fell faster than exports, the State Secretariat for Economic Affairs said Tuesday.
The trade surplus rose to CHF 3.6 billion in November from CHF 2.7 billion in October. Economists had expected the surplus to climb to CHF 3.56 billion.
In real terms, exports dropped 0.4 percent month-over-month in November and their by reaching at its lowest level since September 2015. Imports declined 4.2 percent over the month, rttnews says.
-
09:07
The current account of the euro area recorded a higher than expected surplus
The current account of the euro area recorded a surplus of €28.4 billion in October 2016 (see Table 1). This reflected surpluses for goods (€26.0 billion), services (€9.3 billion) and primary income (€6.1 billion), which were partly offset by a deficit for secondary income (€13.0 billion).
The 12-month cumulated current account for the period ending in October 2016 recorded a surplus of €344.3 billion (3.2% of euro area GDP), compared with one of €320.2 billion (3.1% of euro area GDP) for the 12 months to October 2015 (see Table 1 and Chart 1). This was due to increases in the surpluses for goods (from €340.2 billion to €364.8 billion) and services (from €60.0 billion to €62.4 billion), as well as a decrease in the deficit for secondary income (from €132.5 billion to €129.9 billion). These were partly offset by a decrease in the surplus for primary income (from €52.6 billion to €47.1 billion).
-
09:00
Eurozone: Current account, unadjusted, bln , October 32.8
-
08:09
Today’s events
-
At 14:00 GMT China will publish leading indicators index for November
-
At 12:00 GMT the global dairy product auction
-
-
07:29
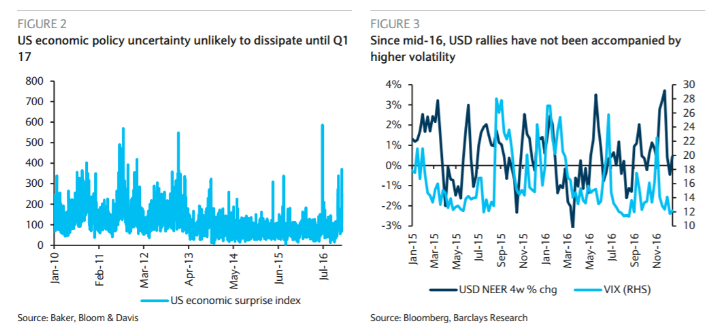
Barclays has 3 reasons for sharper near-term USD upside risks
"Last week's FOMC meeting was more eventful than what we and the market were expecting. We read subtle hawkish signals regarding the outlook of monetary policy, therefore tilting risks for the USD toward a sharper appreciation in the months to come (see USD upside risks), against our expectations of USD consolidation
First, because any potential fiscal boost from the Trump administration is still very uncertain (Figure 2), it has yet to be incorporated into the FOMC's economic outlook, as only "some" members included it in their projections. Therefore, we see further room for the market to price in a steeper path for the fed funds rate in 2017, as fed funds futures are pricing only 55bp of hikes in the year to come.
Second, the FOMC seems less concerned about the effect of a higher USD and rates. Unlike previous episodes, the USD recent uptrend has not been accompanied by higher volatility or a sharp move lower in commodity prices (Figure 3), something that had constrained the Fed before from accelerating its normalization pace. It looks like Chair Yellen now sees the re-pricing in US assets as consistent with the improvement in the job, growth and inflation outlook stemming from the market's implicitly pricing a more expansionary fiscal policy.
Third, the appetite for running a "high pressure" economy to boost productivity growth at this point of the business cycle is diminishing. Although Chair Yellen emphasized the fact that the revision in the median projection of the 2017 dots, employment and growth outlook was very moderate, she did not stress as much as in the past the fact that the normalization process should be gradual".
Copyright © 2016 Barclays Capital, eFXnews™
-
07:25
USD / RUR opened lower
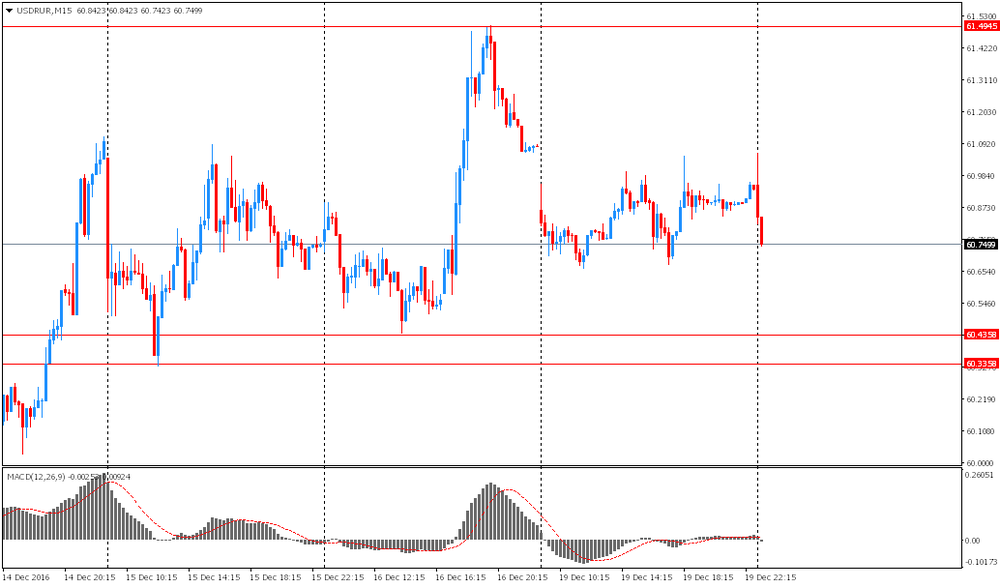
USD / RUR was marked by a slight decrease by 15 cents to 60.75. Yesterday the pair traded in a range of 40 cents, while remaining in the correction, however, the overall trend remains downward. Immediate support is the area of 15 and 16 December lows (60.34-44), and resistance - Friday's high (61.49).
-
07:22
Options levels on tuesday, December 20, 2016:
EUR/USD
Resistance levels (open interest**, contracts)
$1.0675 (795)
$1.0628 (201)
$1.0589 (223)
Price at time of writing this review: $1.0388
Support levels (open interest**, contracts):
$1.0354 (1079)
$1.0318 (1988)
$1.0274 (2860)
Comments:
- Overall open interest on the CALL options with the expiration date March, 13 is 43112 contracts, with the maximum number of contracts with strike price $1,1500 (3217);
- Overall open interest on the PUT options with the expiration date March, 13 is 53157 contracts, with the maximum number of contracts with strike price $1,0000 (5599);
- The ratio of PUT/CALL was 1.23 versus 1.23 from the previous trading day according to data from December, 19
GBP/USD
Resistance levels (open interest**, contracts)
$1.2615 (995)
$1.2520 (329)
$1.2425 (172)
Price at time of writing this review: $1.2391
Support levels (open interest**, contracts):
$1.2282 (342)
$1.2186 (545)
$1.2089 (378)
Comments:
- Overall open interest on the CALL options with the expiration date March, 13 is 10087 contracts, with the maximum number of contracts with strike price $1,2600 (995);
- Overall open interest on the PUT options with the expiration date March, 13 is 12932 contracts, with the maximum number of contracts with strike price $1,1500 (2947);
- The ratio of PUT/CALL was 1.28 versus 1.28 from the previous trading day according to data from December, 19
* - The Chicago Mercantile Exchange bulletin (CME) is used for the calculation.
** - Open interest takes into account the total number of option contracts that are open at the moment.
-
07:22
Italy will allocate $ 21 billion to rescue troubled banks
Bloomberg published a report on the intention of the Government of Italy to expand the country's public debt by 20 billion euros (21 billion dollars) in order to support the country's troubled banks. Sources say that it is primarily about Banca Monte dei Paschi di Siena.
-
07:19
IMF board reaffirms "full confidence" in Lagarde despite French ruling
-
07:16
Bank of Japan: Japan's economy continues a moderate recovery trend
-
We continue to buy government bonds in accordance with the previous rate of 80 trillion yen per year
-
The target level for 10-year bonds remained at about 0%
-
Inflation will reach 1.1% in fiscal year 2017 versus 0% in 2016 fiscal year
-
We forecast GDP growth of 1.5% in the 2017 fiscal year, compared to 1.3% in 2016 fiscal year
-
Inflation expectations remained weak
-
Production increased against the background of exports above expectations
-
-
07:15
Bank of Japan holds interest rate at -0.10%. USD/JPY up 100 pips on the asian session
-
07:12
RBA meeting minutes: Wage growth had remained low and continued to be lower than implied by the historical relationship with the unemployment rate
Members commenced their discussion of the domestic economy by noting that the unemployment rate was unchanged at 5.6 per cent in October, somewhat more than ½ percentage point below its peak in mid 2015. Despite a rise in full-time employment in October, all of the growth in employment over 2016 had been in part-time employment, with an increased share of people in the labour force reporting that they would like to work more hours. Members discussed various measures of labour underutilisation, including those that account for the number of hours sought by the unemployed and the additional hours desired by those who are underemployed (and who are also recorded as actively searching for additional hours). Such hours-based measures of underutilisation had declined to a similar extent as the unemployment rate since late 2015 and, unlike the heads-based measure, had not increased recently.
Wage growth had remained low and continued to be lower than implied by the historical relationship with the unemployment rate. The wage price index (WPI) had increased by a little less than expected in the September quarter and year-ended growth in the WPI had eased a little further. Although there had been some evidence from enterprise agreements that growth in construction wages had picked up recently, these agreements covered a relatively small share of the total workforce.
-
07:03
German producer prices for industrial products rose by 0.1%
In November 2016 the index of producer prices for industrial products rose by 0.1% compared with the corresponding month of the preceding year. This was the first positive annual rate of change since June 2013 (+0.1%). In October 2016 the annual rate of change all over had been -0.4%.
Compared with the preceding month October 2016 the overall index rose by 0.3% in November 2016 (0.7% in October and - 0.2% in September).
In November 2016 energy prices decreased by 1.7% compared with November 2015, prices of intermediate goods rose by 0.4%. In contrast prices of non-durable consumer goods rose by 1.5%, prices of capital goods by 0.6% and prices of durable consumer goods by 1.0%.
The overall index disregarding energy rose by 0.8% compared with November 2015 and by 0.3% compared with October 2016.
-
07:01
Germany: Producer Price Index (YoY), November 0.1% (forecast -0.2%)
-
07:00
Switzerland: Trade Balance, November 3.64
-
07:00
Germany: Producer Price Index (MoM), November 0.3% (forecast 0.1%)
-
03:00
Japan: BoJ Interest Rate Decision, -0.1% (forecast -0.1%)
-