Market news
-
23:32
Japan: Unemployment Rate, September 3.0% (forecast 3.1%)
-
23:31
Japan: Household spending Y/Y, September -2.1% (forecast -3%)
-
23:31
Japan: Tokyo Consumer Price Index, y/y, October 0.1% (forecast -0.5%)
-
23:30
Japan: National Consumer Price Index, y/y, September -0.5% (forecast -0.5%)
-
23:30
Japan: National CPI Ex-Fresh Food, y/y, September -0.5% (forecast -0.5%)
-
23:30
Japan: Tokyo CPI ex Fresh Food, y/y, October -0.4% (forecast -0.5%)
-
22:28
Currencies. Daily history for Oct 27’2016:
(pare/closed(GMT +3)/change, %)
EUR/USD $1,0896 -0,09%
GBP/USD $1,2165 -0,58%
USD/CHF Chf0,9935 +0,01%
USD/JPY Y105,24 +0,73%
EUR/JPY Y114,68 +0,64%
GBP/JPY Y128,03 +0,16%
AUD/USD $0,7586 -0,74%
NZD/USD $0,7118 -0,41%
USD/CAD C$1,3388 +0,09%
-
22:00
Schedule for today, Friday, Oct 28’2016
00:00 Australia HIA New Home Sales, m/m September 6.1%
00:30 Australia Producer price index, q / q Quarter III 0.1%
00:30 Australia Producer price index, y/y Quarter III 1%
07:00 Switzerland KOF Leading Indicator October 101.3 101.8
09:00 Eurozone Economic sentiment index October 104.9 104.8
09:00 Eurozone Consumer Confidence (Finally) October -8.2 -8
09:00 Eurozone Business climate indicator October 0.45 0.44
09:00 Eurozone Industrial confidence October -1.7 -1.6
12:00 Germany CPI, y/y (Preliminary) October 0.7% 0.8%
12:00 Germany CPI, m/m (Preliminary) October 0.1% 0.1%
12:30 U.S. PCE price index, q/q(Preliminary) Quarter III 2% 1.4%
12:30 U.S. PCE price index ex food, energy, q/q (Preliminary) Quarter III 1.8% 1.6%
12:30 U.S. GDP, q/q (Preliminary) Quarter III 1.4% 2.5%
15:00 U.S. Reuters/Michigan Consumer Sentiment Index (Finally) October 91.2 88.1
-
15:44
Oil moderately higher
Oil prices rose by more than 1 percent, helped by comments that OPEC members are ready to cut production volumes. Support for oil also provided yesterday's data on US petroleum inventories.
Sources familiar with the matter, reported that Saudi Arabia and its allies in the Persian Gulf are willing to reduce oil production by 4% and will discuss the proposal at the talks in Vienna this week. However, the source pointed out the exception ofIraq, which refuses to reduce the production, referring to the loss of the war with "Islamic state".
Some experts have warned that OPEC statements are no more than a verbal intervention, and in fact, will not be able to agree on production cuts. The only solution that can be accepted - freezing oil production by individual countries.
The cost of the December futures on US light crude oil WTI (Light Sweet Crude Oil) rose to 49.78 dollars per barrel on the New York Mercantile Exchange.
December futures price for Brent crude rose to 50.62 dollars a barrel on the London Stock Exchange ICE Futures Europe.
-
15:10
UK deploys hundreds of troops and aircraft to eastern Europe. UK joins biggest post-cold war buildup of Nato forces as Russian military engages in series of high-profile manoeuvres - The Guardian
-
14:17
US Pending home sales shifted higher in September
Pending home sales shifted higher in September following August's notable dip and are now at their fifth highest level over the past year, according to the National Association of Realtors. Increases in the South and West outgained declines in the Northeast and Midwest.
The Pending Home Sales Index, a forward-looking indicator based on contract signings, grew 1.5 percent to 110.0 in September from a slight downward revision of 108.4 in August. With last month's gain, the index is now 2.4 percent higher than last September (107.4) and has now risen year-over-year for 22 of the last 25 months.
Lawrence Yun, NAR chief economist, says a robust increase in the West and a healthy bump in the South pushed pending sales upward in September. "Buyer demand is holding up impressively well this fall with Realtors® reporting much stronger foot traffic compared to a year ago 1," he said. "Although depressed inventory levels are keeping home prices elevated in most of the country, steady job gains and growing evidence that wages are finally starting to tick up are encouraging more households to consider buying a home."
-
14:00
U.S.: Pending Home Sales (MoM) , September 1.5% (forecast 1.2%)
-
13:46
Option expiries for today's 10:00 ET NY cut
EUR/USD 1.0880 ( EUR 514m) 1.0890 (403m) 1.0900 (867m) 1.0920 (362m) 1.0925-30 (406m) 1.0935 (381m) 1.0950 (713m) 1.0970 (676m) 1.1000 (1.51bln) 1.1050 (826m)
USD/JPY 102.00 (USD 1.28bln) 103.50 (838m) 103.95-104.00 (376m) 105.00-05 (439m) 106.00 (1.25bln)
GBP/USD 1.2000 ( GBP 300m) 1.2400 (551m)
AUD/USD 0.7500 (AUD 278m) 0.7540 (1.51bln) 0.7575 (1.21bln) 0.7600 (532m) 0.7620 (911m) 0.7625-35 (406m) 0.7660-63 (949m)
USD/CAD: 1.3150 (USD 290m) 1.3200 (1.29bln) 1.3300 (358m)
1.3350 (571m) 1.3500 (1.72bln) 1.3600 (1.65bln)
NZD/USD 0.7165 (NZD 286m) 0.7300-05 (333m)
-
13:25
Whats next for EUR/USD, GBP/USD - Credit Suisse
"Recent data such as Germany's Ifo survey or composite PMI data have been far from shabby. And rate differentials vs. the US have largely been stable of late. Why then has EURUSD been trending lower again? We repeat our view that we believe the political environment in Europe is a major drag on the single currency.
The UK's Brexit vote - and the subsequent GBP collapse - helped highlight the structural political and economic vulnerabilities that can hurt European currencies even when underlying economic data are still decent. In this context, the apparent failure of the EU and Canada to agree a free-trade deal due to the objections of Belgium's Wallonia region further underlines not only the profusion of political forces capable of hurting sentiment but also the timing randomness of their appearances.
Going into 2017 with multiple European elections scheduled, there seem to be numerous possibilities for political strife within countries (e.g., traditional vs radical parties in general elections) and between them too (e.g., the UK vs. EU-27 over Article 50). With ECB chief Draghi pointing out again this week that the best way to raise longer-term interest rates is to boost trend growth rates and productivity, it is hard to imagine how a trade policy mishaps and general political noise will help to create a constructive environment.
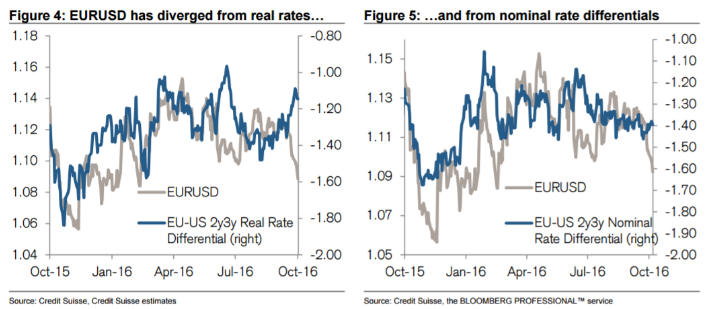
Still, at least on the monetary policy front, some near-term respite came through this week for EUR and GBP. Both currencies benefitted from comments by their respective central bank governors suggesting that monetary policymakers are not entirely unmoved by the loss of purchasing power and potential inflationary pressures weaker ultra-low rates, QE and ever-weaker currencies can bring about. After months (years?) of relative neglect of this dimension while central banks fought economic weakness and disinflationary pressure, even this modest acknowledgement may provide some near-term benefits. We would nonetheless see any consolidation in EUR or GBP vs. USD temporary and any material rally as a selling opportunity.
As technical-based trades, CS is short EUR/USD and run a limit order to sell GBP/USD".
Copyright © 2016 Credit Suisse, eFXnews™
-
12:34
Durable goods orders down 0.1% in September
New orders for manufactured durable goods in September decreased $0.3 billion or 0.1 percent to $227.3 billion, the U.S. Census Bureau announced today. This decrease, down following two consecutive monthly increases, followed a 0.3 percent August increase. Excluding transportation, new orders increased 0.2 percent. Excluding defense, new orders increased 0.7 percent. Transportation equipment, also down following two consecutive monthly increases, drove the decrease, $0.6 billion or 0.8 percent to $77.5 billion.
Shipments of manufactured durable goods in September, up three of the last four months, increased $2.0 billion or 0.8 percent to $234.5 billion. This followed a virtually unchanged August decrease.
Nondefense new orders for capital goods in September increased $1.0 billion or 1.5 percent to $68.2 billion. Shipments increased $1.5 billion or 2.2 percent to $71.8 billion. Unfilled orders decreased $3.6 billion or 0.5 percent to $692.8 billion. Inventories increased $0.5 billion or 0.3 percent to $170.4 billion.
-
12:32
US unemployment claims stable
In the week ending October 22, the advance figure for seasonally adjusted initial claims was 258,000, a decrease of 3,000 from the previous week's revised level. The previous week's level was revised up by 1,000 from 260,000 to 261,000. The 4-week moving average was 253,000, an increase of 1,000 from the previous week's revised average. The previous week's average was revised up by 250 from 251,750 to 252,000.
There were no special factors impacting this week's initial claims. This marks 86 consecutive weeks of initial claims below 300,000, the longest streak since 1970.
-
12:31
U.S.: Durable goods orders ex defense, September 0.7%
-
12:30
U.S.: Initial Jobless Claims, 258 (forecast 255)
-
12:30
U.S.: Durable Goods Orders ex Transportation , September 0.2% (forecast 0.2%)
-
12:30
U.S.: Continuing Jobless Claims, 2039 (forecast 2068)
-
12:30
U.S.: Durable Goods Orders , September -0.1% (forecast 0.1%)
-
12:08
The U.K. economy hasn't been knocked off course by Brexit yet. The Economy Shrug Off Brexit fears as economic indicators keep improving
-
12:03
UK retailers reported the strongest pace of growth since September 2015
UK retailers reported the strongest pace of growth since September 2015 over the year to October, with sales expected to expand at similar pace next month, according to the latest CBI monthly Distributive Trades Survey.
The survey of 126 firms, of which 60 were retailers, showed that sales for the time of year were considered to be above average and are expected to be in line with seasonal norms in November.
The volume of orders placed upon suppliers was broadly flat in October, having declined steadily during the previous six months, but orders are expected to fall further year-on-year in November.
The rise in overall sales volumes was driven by retailers of clothing, furniture & carpets, and hardware & DIY, while sales by grocers and department stores were flat.
-
12:00
Orders
EUR/USD
Offers : 1.0920-25 1.0950 1.09801.1000 1.1030 1.1050 1.1080 1.1100
Bids : 1.0900 1.0875-80 1.0850 1.0825-30 1.0800 1.0785 1.0750 1.0700
GBP/USD
Offers : 1.2225-30 1.2250 1.2280 1.2300 1.2325-30 1.2350
Bids : 1.2200 1.2180 1.2150 1.2130 1.2100 1.2080-85 1.2050 1.200
EUR/GBP
Offers : 0.8950 0.8965 0.8980 0.9000 0.9025-30 0.9050
Bids : 0.8900 0.8880-85 0.8870 0.8850-55 0.8835 0.8800
EUR/JPY
Offers : 114.20-25 114.50 114.70-75 115.00 115.40 116.00
Bids : 113.70 113.50 113.30 113.00 112.85 112.60 112.00
USD/JPY
Offers : 104.70-80 105.00 105.30 105.50 106.00
Bids : 104.30 104.00 103.80-85 103.50 103.20-25 103.00
AUD/USD
Offers : 0.7650 0.7660 0.7685 0.7700-10 0.7730-35 0.7750
Bids : 0.7620 0.7600 0.7580 0.7555-60 0.7540 0.7500
-
09:02
Option expiries for today's 10:00 ET NY cut
EUR/USD 1.0880 ( EUR 514m) 1.0890 (403m) 1.0900 (867m) 1.0920 (362m) 1.0925-30 (406m) 1.0935 (381m) 1.0950 (713m) 1.0970 (676m) 1.1000 (1.51bln) 1.1050 (826m)
USD/JPY 102.00 (USD 1.28bln) 103.50 (838m) 103.95-104.00 (376m) 105.00-05 (439m) 106.00 (1.25bln)
GBP/USD 1.2000 ( GBP 300m) 1.2400 (551m)
AUD/USD 0.7500 (AUD 278m) 0.7540 (1.51bln) 0.7575 (1.21bln) 0.7600 (532m) 0.7620 (911m) 0.7625-35 (406m) 0.7660-63 (949m)
USD/CAD: 1.3150 (USD 290m) 1.3200 (1.29bln) 1.3300 (358m)
1.3350 (571m) 1.3500 (1.72bln) 1.3600 (1.65bln)
NZD/USD 0.7165 (NZD 286m) 0.7300-05 (333m)
-
08:33
UK GDP above expectations. The pattern of growth continues to be broadly unaffected following the EU referendum. Time to buy the pound?
Change in gross domestic product (GDP) is the main indicator of economic growth. GDP was estimated to have increased by 0.5% in Quarter 3 (July to Sept) 2016 compared with growth of 0.7% in Quarter 2 (Apr to June) 2016. GDP was 2.3% higher in Quarter 3 2016 compared with the same quarter a year ago.
This is the first release of GDP covering a full quarter of data following the EU referendum. The pattern of growth continues to be broadly unaffected following the EU referendum with a strong performance in the services industries offsetting falls in other industrial groups.
In Quarter 3 2016, the services industries increased by 0.8%. In contrast, output decreased in the other 3 main industrial groups with construction decreasing by 1.4%, agriculture decreasing by 0.7% and production decreasing by 0.4%, within which manufacturing decreased by 1.0%.
-
08:30
United Kingdom: GDP, q/q, Quarter III 0.5% (forecast 0.3%)
-
08:30
United Kingdom: GDP, y/y, Quarter III 2.3% (forecast 2.1%)
-
08:04
Riksbank: Low repo rate for longer, Executive Board ready to extend government bond purchases in December
-
08:04
Euro Area annual growth rate of the broad monetary aggregate M3 stood at 5.0% in September
-
The annual growth rate of the broad monetary aggregate M3 stood at 5.0% in September 2016, after 5.1% in August 2016.
-
The annual growth rate of the narrower aggregate M1, which includes currency in circulation and overnight deposits, decreased to 8.5% in September, from 8.9% in August.
-
The annual growth rate of adjusted loans to households stood at 1.8% in September, unchanged from the previous month.
-
The annual growth rate of adjusted loans to non-financial corporations stood at 1.9% in September, unchanged from the previous month.
-
-
08:01
Eurozone: Private Loans, Y/Y, September 1.8% (forecast 1.9%)
-
08:00
Eurozone: M3 money supply, adjusted y/y, September 5% (forecast 5.1%)
-
08:00
UK Q3 GDP to make or break the pound. +0.3% expected vs +0.7 previous. How hard will Brexit hit?
-
07:29
BHP Billiton: Commercial Director Dean Dalla Valle leaves the company
-
07:27
Today’s events
-
At 17:00 GMT United States will hold an auction of 7-year bonds
-
At 20:00 GMT ECB member Yves Mersch will deliver a speech
-
-
07:26
Spanish employment improves in Q3
The number of employed persons increased by 226,500 in the third quarter of 2016 compared to the previous quarter (1.24%) and stands at 18,527,500. Seasonally adjusted quarterly variation is 0.77%. Employment has grown by 478,800 people in the last 12 months. The annual rate is 2.65%. Occupancy up this quarter by 8,900 people in the public sector and 217,700 in private. In the past 12 months, employment has risen by 461,300 people in the private sector and 17,500 in the public. The total number of employees grows in the third quarter by 216,800 (455,700 on year).
-
06:28
CHF: SNB Intervention Level - Morgan Stanley
"When the SNB tells you they think the CHF is overvalued, you wouldn't think USDCHF hitting an 8 month high and approaching 1.00 would be an issue. However when the USD has been rallying this month, EURCHF has been falling to approach the 1.08 level, which we think has been a line in the sand for the SNB before.
Of course whether the SNB intervene to stop the CHF appreciating will depend on the pace of the EURCHF move but we are finding that pace is becoming increasingly related to reaching this 1.08 level. Actually the SNB doesn't hide away from the fact they have been intervening since formally removing the floor in January 2015. The SNB's VP Fritz Zurbruegg said yesterday "We don't have a fixed limit for growing the balance sheet; it's a corollary of our foreign exchange market interventions". Sight deposits, a measure of intervention, have increased by 10.8% since the start of the year.
We expect EURCHF to remain in a 1.08-1.10 range, while USD strength should push USDCHF towards 1.01 in coming weeks".
Copyright © 2016 Morgan Stanley, eFXnews
-
06:25
China's industrial profits increased less than expected
Rttnews says that China's industrial profits increased at a slower pace in September, figures from the National Bureau of Statistics showed Thursday.
Industrial profits grew only 7.7 percent year-on-year in September after expanding 19.5 percent in August. The increase in August was the fastest in three years.
During January to September, industrial profits climbed 8.4 percent, the same pace of growth as seen in January to August period.
-
06:24
UBS Consumption Indicator rose in September
The UBS Consumption Indicator rose in September. The increase from 1.53 to 1.59 points confirmed recent positive developments in private consumption. This is in sharp contrast to the picture among retailers, who recorded a 2.9 percent fall in sales year-on-year in August and thus the twentieth drop in succession. Retailers have not had any good news to report since January 2015, and the improbability of any significant improvement over the next few months is highlighted by the retail business climate index of the ETH Swiss Economic Institute (KOF). The August figure is significantly lower than the long-term average.
Despite the ailing retail sector, private consumption has shown solid development. This is primarily down to domestic tourism and the car market, with vehicle sales actually exceeding expectations recently.
-
06:23
Options levels on thursday, October 27, 2016:
EUR/USD
Resistance levels (open interest**, contracts)
$1.1110 (3202)
$1.1028 (2111)
$1.0973 (1025)
Price at time of writing this review: $1.0911
Support levels (open interest**, contracts):
$1.0858 (3087)
$1.0824 (2311)
$1.0785 (4452)
Comments:
- Overall open interest on the CALL options with the expiration date November, 4 is 43015 contracts, with the maximum number of contracts with strike price $1,1300 (3692);
- Overall open interest on the PUT options with the expiration date November, 4 is 46278 contracts, with the maximum number of contracts with strike price $1,1000 (7330);
- The ratio of PUT/CALL was 1.08 versus 1.08 from the previous trading day according to data from October, 26
GBP/USD
Resistance levels (open interest**, contracts)
$1.2502 (1360)
$1.2403 (1164)
$1.2306 (1654)
Price at time of writing this review: $1.2215
Support levels (open interest**, contracts):
$1.2192 (1260)
$1.2096 (1503)
$1.1998 (924)
Comments:
- Overall open interest on the CALL options with the expiration date November, 4 is 32396 contracts, with the maximum number of contracts with strike price $1,2800 (1973);
- Overall open interest on the PUT options with the expiration date November, 4 is 31298 contracts, with the maximum number of contracts with strike price $1,2300 (1858);
- The ratio of PUT/CALL was 0.97 versus 0.97 from the previous trading day according to data from October, 26
* - The Chicago Mercantile Exchange bulletin (CME) is used for the calculation.
** - Open interest takes into account the total number of option contracts that are open at the moment.
-
06:21
BoJ, Kuroda: Any attempt to weaken JPY would be FX intervention
-
06:20
New Zeeland trade deficit increased in September
New Zealand had a merchandise trade deficit of NZ$1.436 billion in September, Statistics New Zealand said on Thursday.
That missed forecasts for a shortfall of NZ$1.123 billion following the NZ$1.265 billion deficit in August.
Exports came in at NZ$3.47 billion, beneath forecasts for NZ$3.55 billion but up from NZ$3.38 billion in the previous month.
Imports were at NZ$4.90 billion versus expectations for NZ$4.65 billion and up from NZ$4.62 billion a month earlier.
-
06:18
Export prices in Australia advanced 3.5 percent on quarter
According to rttnews, export prices in Australia advanced 3.5 percent on quarter in the third quarter of 2016, the Australian Bureau of Statistics said on Thursday.
That beat forecasts for an increase of 2.0 percent following the 1.4 percent gain in the previous three months.
Import prices were down 1.0 percent on quarter versus expectations for a 0.8 percent decline. They were unchanged from Q2.
On a yearly basis, export prices dropped 5.4 percent and import prices fell 5.1
-
06:00
Switzerland: UBS Consumption Indicator, September 1.59
-
00:31
Australia: Import Price Index, q/q, Quarter III -1%
-
00:30
Australia: Export Price Index, q/q, Quarter III 3.5%
-