Noticias del mercado
-
20:00
U.S.: Federal budget , August -107 (forecast -108)
-
17:50
The price of oil has fallen more than 2.5 percent
Oil futures fell on updated forecasts from the International Energy Agency (IEA) and the US dollar rate growth.
The IEA reported that in the 3 rd quarter oil demand growth has slowed sharply - up to 800 thousand barrels per day vs the 3rd quarter of 2015 when demand growth was higher at 1.5 million barrels per day. In addition, the forecast for growth of world oil demand in 2016 was reduced by 100 thousand barrels to 1.3 million barrels per day. The IEA estimates that global oil demand growth rate in 2017 would be another 100 thousand barrels per day lower than in 201t and amount to 1.2 million barrels per day. The IEA added that demand growth in developed countries has practically stopped, while consumption in Asia, in countries such as China and India, has been growing much more slowly.
IEA comments followed unexpectedly pessimistic forecast of OPEC. Yesterday, OPEC reported that in 2016, production in the United States, Russia, Norway and several other countries will be approximately 190,000 barrels per day higher than expected. This factor may indicate that oil production outside OPEC was stable, despite low oil prices. As expected by the cartel in 2017 oil supply will exceed demand by about 760,000 barrels a day, which is more than three times higher than the previous forecast.
"It seems the situation is much worse in the eyes of the OPEC and the IEA, - said Commerzbank strategist Eugen Weinberg -. Given the recent forecasts, I would not be surprised if the fall in oil prices will continue for some time."
The cost of the October futures for US light crude oil WTI (Light Sweet Crude Oil) fell to 44.92 dollars per barrel on the New York Mercantile Exchange.
October futures price for North Sea petroleum mix of mark Brent fell to 47.13 dollars a barrel on the London Stock Exchange ICE Futures Europe.
-
15:50
Option expiries for today's 10:00 ET NY cut
EUR/USD: 1.1150 (EUR 265m) 1.1200 (297m) 1.1220 (721m) 1.1225 (380m) 1.1230 (1.2bln) 1.1250 (570m) 1.1270 (222m) 1.1300 (301m) 1.1350 (444m) 1.1360 (653m)
USD/JPY: 100.00-05 (315m) 101.02( 240m) 101.47-50 (560m) 102.00 (541m) 104.00-05 (1.16bln)
AUD/USD: 0.7370-75( AUD 300m)
USD/CAD 1.3100 (USD 590m) 1.3275 (400m)
NZD/USD 0.7450 (262m)
AUD/JPY 77.50 (AUD 445m) 77.95-0.7600 (619m)
-
15:28
The International Energy Agency (IEA): The growth of world oil demand is slowing faster than previously thought
- IEA lowers forecast for world oil demand in 2016 to 100,000 barrels / day, and in 2017 to 200 000 barrels / day.
- World oil supply in August -300,000 barrels / day due to lower non-OPEC production.
- OPEC crude oil in August, 20 000 barrels / day to 33.47 million barrels / day.
- Oil production in Saudi Arabia in August, 10.60 million barrels / day against 10.65 million barrels / day in July
- Oil stocks in the OECD countries increased by 32.5 million barrels to a new record level of 3.111 billion barrels.
- The global demand for oil under pressure due to the sharp slowdown in oil consumption in China and India.
- European demand for oil showed the first annual decline in six years.
- The scale of a slowdown in demand growth in the 3rd quarter is amazing.
-
14:36
Time To Sell JPY: Looking To Go Short Vs USD & EUR - Nomura
"Trading G3 currencies in the second half of this year has been treacherous so far. The euro has traded in a 1.095 to 1.137 range, which itself lies in the rough range of 1.08 to 1.15 that has been in place since early 2015. Meanwhile, USD/JPY has traded choppily in a 100 to 107 range. This has been in sharp contrast to its almost straight line decline from 120 to 100 in the first half of this year. EUR/JPY has broadly followed USD/JPY but with a smaller range.
While the recent price action of G3 FX may be off-putting, it could be signalling a change in trend - at least over the coming months. Indeed, the yen rally earlier this year was a two-standard-deviation move, which typically subsequently reverse. This could therefore be a good starting point to consider short yen trades.
Looking at the correlations among EUR/USD, USD/JPY and EUR/JPY, we find that in recent months, the yen pairs have been the most correlated suggesting that the yen is indeed the currency to focus on rather than the dollar or euro. Focusing on the yen against both the dollar and the euro also allows one not to become too dependent on to Fed hike expectations. That leaves Japanese factors to spur yen weakness. On that front the picture is promising. The Bank of Japan is likely to engage in further easing, whether a cut deeper into negative territory, the introduction of negative rates to its loan support programmes or an extension of easing guidance or some combination of this. This could happen at the 21 September meeting or the October/November meeting.
After the big disappointment of the 29 July meeting which saw little action and so resulted in rates selling off and the yen rallying, investors are much more cautious around upcoming BOJ meetings. For example, 2yr yields have essentially moved sideways in recent weeks, rather than falling at the same stage as they did ahead of the July meeting. FX positioning, meanwhile, shows leveraged funds increasing long yen positions and asset managers scaling back short yen positions into the upcoming BOJ meeting.
Finally, the behaviour of domestic Japanese investors appears to be shifting in favour of yen weakness. Japanese purchases of foreign equities, a barometer of tolerance to currency risk (and so sell yen), have increased sharply of late. The sharp widening on a cross-currency basis caused by forthcoming US money market reform and Fed hike expectations should lead to less currency hedging, which in turn implies more net selling of yen.
Therefore, we would look to sell the yen against both the dollar and the euro".
Copyright © 2016 Nomura, eFXnews™
-
14:27
European session review: the pound traded lower vs the US dollar
The following data was published:
(Time / country / index / period / previous value / forecast)
6:00 Germany Consumer Price Index m / m (final data) August 0.3% 0.0% 0.0%
6:00 Germany CPI, y / y (final data) August 0.4% 0.4% 0.4%
Switzerland 7:15 producers and import price index m / m in August -0.1% -0.3%
Switzerland 7:15 producers and import price index y / y in August -0.8% -0.4%
8:30 UK Producer Price Index (m / m) in August 0.3% 0.2% 0.1%
8:30 UK producers selling prices index, y / y in August 0.3% 0.8% 1%
8:30 UK producers purchase prices index m / m in August 3.1% Revised to 3.3% 0.5% 0.2%
8:30 UK purchasing producer prices index, y / y in August to 4.1% from 4.3 Revised% 8.1% 7.6%
8:30 UK Retail Price Index m / m in August 0.1% 0.4% 0.4%
8:30 UK Retail Price Index y / y in August 1.9% 1.8% 1.8%
8:30 UK Consumer Price Index m / m in August -0.1% 0.4% 0.3%
8:30 UK Consumer Price Index y / y in August 0.6% 0.7% 0.6%
08:30 UK Consumer Price Index, the base value, y / y August 1.3% 1.4% 1.3%
9:00 Eurozone index of sentiment in the business environment from the ZEW Institute in September 4.6 5.4
9:00 Eurozone Employment Change, q / q to 0.4% q II Revised to 0.3% 0.4%
9:00 Germany Sentiment Index in the business environment of the institute ZEW September 0.5 2.5 0.5
The pound fell after data on inflation in the UK pointed to the acceleration of price growth in August, but not as strong as expected by the market.
Inflation has remained stable, while there was a marked rise in producer prices in August, the Office for National Statistics said on Tuesday.
Consumer prices advanced 0.6 percent year on year in August, showing the same growth rate as in July. Prices were expected to rise by 0.7 percent.
Core inflation, which excludes energy, food, alcoholic beverages and tobacco, remained stable at 1.3 percent in August. Economists had forecasted core inflation at +1.4 percent in August.
On a monthly basis, consumer prices rose by 0.3 percent, slightly slower than the growth of 0.4 percent, which economists had expected.
The US dollar rose against other major currencies, as the official comments of the Fed, voiced on Monday, caused fresh uncertainty about the timing of interest rates hike.
The dollar came under pressure after Fed's Lael Brainard warned about the risks of a premature increase in interest rates.
In his speech on Monday, Brainard said that it would be wise not to rush to tight policy.
The euro briefly came under pressure after the economic sentiment in Germany remained stable in September, according to data of the Center for European Economic Research / ZEW.
The index of sentiment in the business environment was 0.5 points in September, remained unchanged from August vs +2.5 forecast.
At the same time, the current conditions index fell by 2.5 points to 55.1 in September. The reading was below the expected level of 56.
"The current uncertainty of economic impuls from Germany and abroad means that the forecasts for the next few months is difficult to do," said the president of the ZEW, Professor Achim Wambach. "German exports, especially in countries that are not EU members, as well as industrial production figures disappointed."
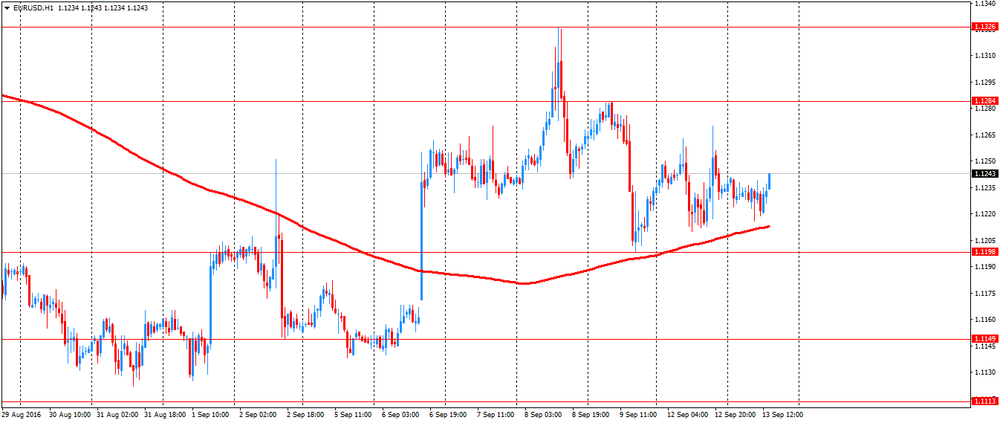
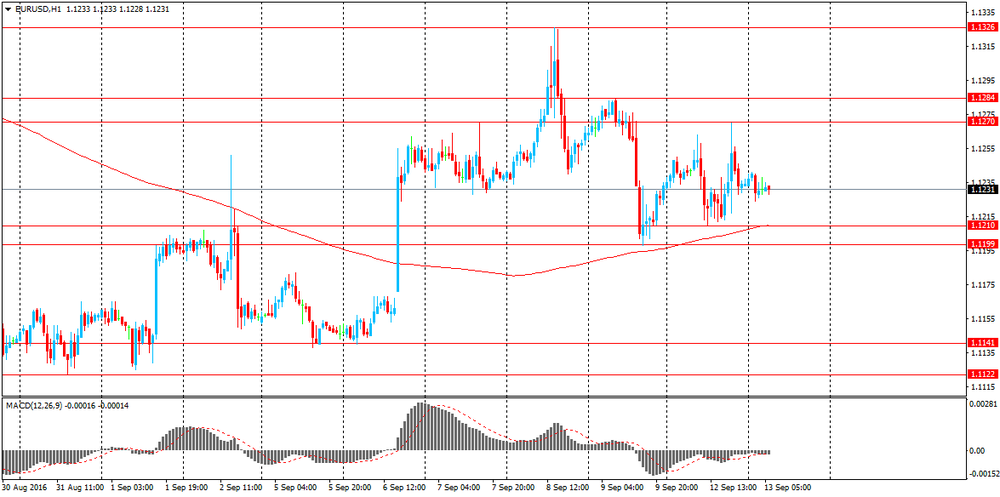
EUR / USD: during the European session, the pair fell to $ 1.1216, and then rose to $ 1.1243
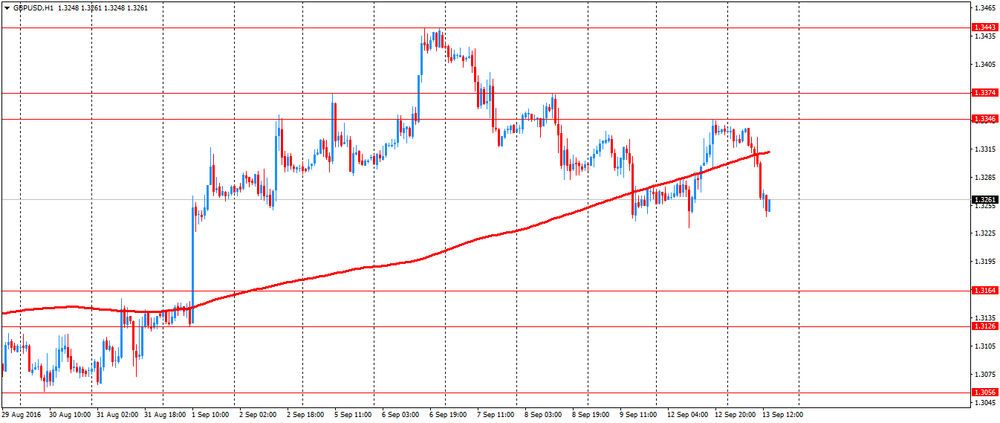
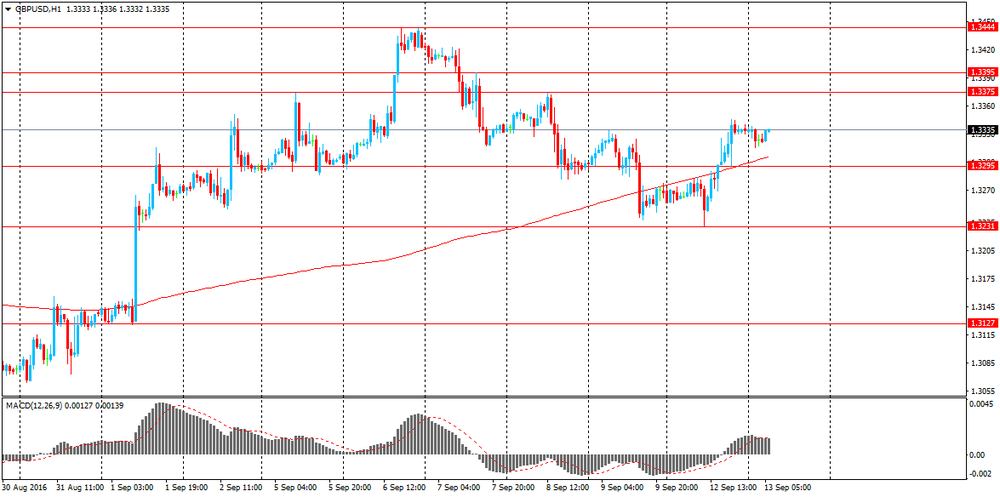
GBP / USD: during the European session, the pair fell to $ 1.3243
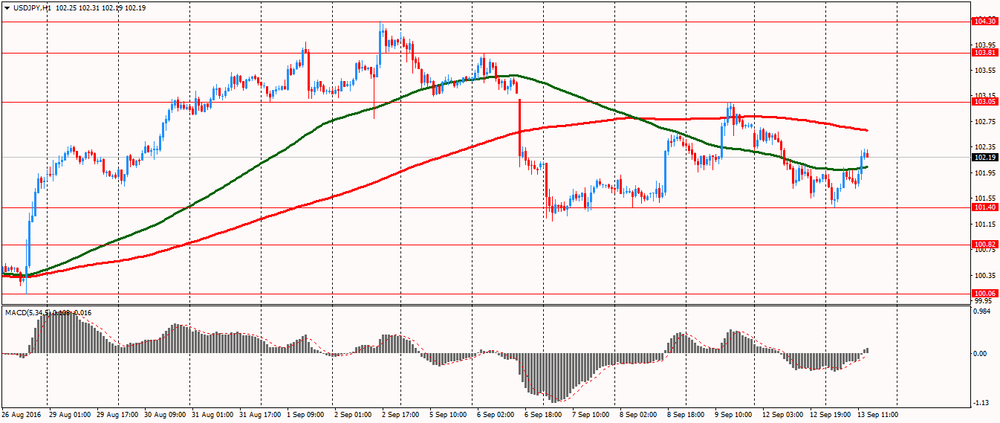
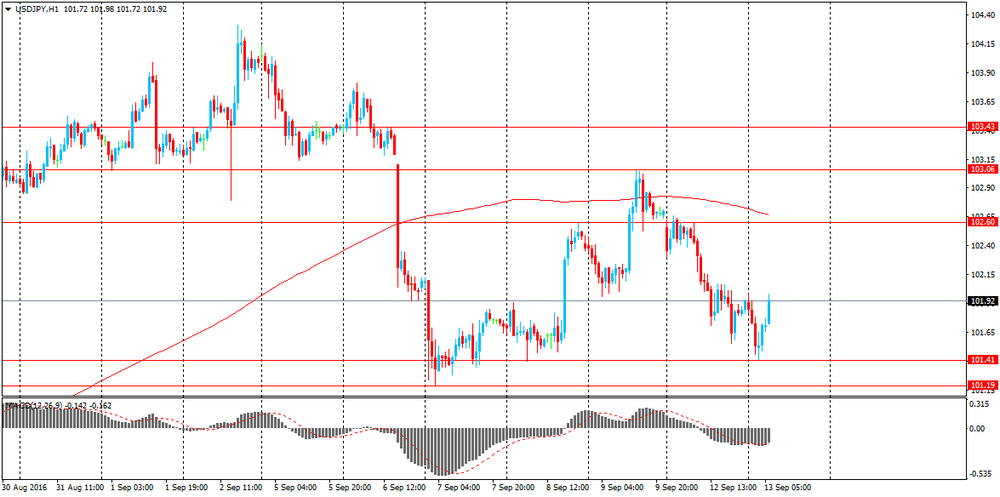
USD / JPY: during the European session, the pair rose to Y102.32
-
12:37
ECB President Draghi: EU single market must be completed to be protected
- EU discussion on tax fairness support integration.
- EU unemployment insurance fund would support union.
- EU action on migration and security/defence is essential.
*via forexlive
-
11:32
The ZEW Indicator of Economic Sentiment for Germany remains unchanged in September
The ZEW Indicator of Economic Sentiment for Germany remains unchanged in September 2016. The index stands at a level of 0.5 points (long-term average: 24.1 points). "The current ambiguity of economic impulses from Germany and abroad means that forecasts for the next few months are difficult. German exports, particularly to non-EU countries, as well as industrial production figures have disappointed. By contrast, the economic environment in the European Union is improving. Overall, the ZEW Indicator of Economic Sentiment suggests that the economic situation in Germany will remain favourable in the coming six months," comments ZEW-President Professor Achim Wambach.
-
11:06
Employment up by 0.4% in euro area and by 0.3% in EU28
Employment up by 0.4% in euro area and by 0.3% in EU28, +1.4% and +1.5% respectively compared with the second quarter of 2015.
The number of persons employed increased by 0.4% in the euro area (EA19) and by 0.3% in the EU28 in the second quarter of 2016 compared with the previous quarter, according to national accounts estimates published by
Eurostat, the statistical office of the European Union. In the first quarter of 2016, employment increased by 0.4% in both zones. These figures are seasonally adjusted.
Compared with the same quarter of the previous year, employment increased by 1.4% in the euro area and by 1.5% in the EU28 in the second quarter of 2016 (after +1.4% in both zones in the first quarter of 2016).
Eurostat estimates that, in the second quarter of 2016, 232.1 million men and women were employed in the EU28 (highest level ever recorded); of which 153.3 million were in the euro area (highest level since the fourth quarter of 2008). These figures are seasonally adjusted.
-
11:01
Germany: ZEW Survey - Economic Sentiment, September 0.5 (forecast 2.5)
-
11:01
Eurozone: Employment Change, Quarter II 0.4%
-
11:01
Eurozone: ZEW Economic Sentiment, September 5.4
-
10:37
UK house price pressures continued to grow in July
- the average price of a property in the UK was £216,750
- the annual price change for a property in the UK was 8.3%
- the monthly price change for a property in the UK was 0.4%
- the monthly index figure for the UK was 113.7 (January 2015 = 100)
According to gov.uk, house price pressures continued to grow in July, reflecting the strength of demand relative to supply in the housing market. However, there were indications that some of the heat had been taken out of the market, with several indicators pointing towards weaker housing demand and supply in recent months.
On the demand side, the volume of lending approvals for house purchases fell by 5.1% in July 2016 compared to the previous month, continuing a downward trend since the beginning of the year. As such, monthly approvals remain below the levels seen in the 10 months prior to stamp duty changes in April 2016. UK home sales fell by 0.9% in July 2016 compared to the previous month, which means that home sales on a monthly basis remain below levels seen in 2014 and 2015 and before the stamp duty changes in early 2016.). Furthermore, the Royal Institution of Chartered Surveyors (RICS) market survey for July reported a fourth consecutive month of falling new buyer enquiries, affecting all regions of the UK.
-
10:35
Option expiries for today's 10:00 ET NY cut
EUR/USD: 1.1150 (EUR 265m) 1.1200 (297m) 1.1220 (721m) 1.1225 (380m) 1.1230 (1.2bln) 1.1250 (570m) 1.1270 (222m) 1.1300 (301m) 1.1350 (444m) 1.1360 (653m)
USD/JPY: 100.00-05 (315m) 101.02( 240m) 101.47-50 (560m) 102.00 (541m) 104.00-05 (1.16bln)
AUD/USD: 0.7370-75( AUD 300m)
USD/CAD 1.3100 (USD 590m) 1.3275 (400m)
NZD/USD 0.7450 (262m)
AUD/JPY 77.50 (AUD 445m) 77.95-0.7600 (619m)
-
10:34
UK CPI up 0.6% y/y on rising food prices and air fares
The Consumer Prices Index (CPI) rose by 0.6% in the year to August 2016, unchanged from July. The rate is still relatively low in the historic context although it is above the rates experienced in 2015 and early 2016.
The main upward contributors to change in the rate were rising food prices and air fares, and a smaller fall in the price of motor fuels than a year ago. These upward pressures were offset by falls in hotel accommodation prices, in addition to smaller rises in the prices of alcohol, and clothing and footwear than a year ago.
CPIH (not a National Statistic) rose by 0.9% in the year to August 2016, unchanged from July.
-
10:31
United Kingdom: Producer Price Index - Output (MoM), August 0.1% (forecast 0.2%)
-
10:31
United Kingdom: Producer Price Index - Output (YoY) , August 0.8% (forecast 1%)
-
10:30
United Kingdom: HICP, Y/Y, August 0.6% (forecast 0.7%)
-
10:30
United Kingdom: Retail prices, Y/Y, August 1.8% (forecast 1.8%)
-
10:30
United Kingdom: HICP, m/m, August 0.3% (forecast 0.4%)
-
10:30
United Kingdom: Retail Price Index, m/m, August 0.4% (forecast 0.4%)
-
10:30
United Kingdom: HICP ex EFAT, Y/Y, August 1.3% (forecast 1.4%)
-
10:30
United Kingdom: Producer Price Index - Input (MoM), August 0.2% (forecast 0.5%)
-
10:30
United Kingdom: Producer Price Index - Input (YoY) , August 7.6% (forecast 8.1%)
-
10:25
Italian industrial production up 0.4% in July
The index measures the monthly evolution of the volume of industrial production (excluding construction). With effect from January 2013 the indices are calculated with reference to the base year 2010 using the Ateco 2007 classification (Italian edition of Nace Rev. 2).
In July 2016 the seasonally adjusted industrial production index increased by 0.4% compared with the previous month. The percentage change of the average of the last three months with respect to the previous three months was -0.5.
The calendar adjusted industrial production index decreased by 0.3% compared with July 2015 (calendar working days being 21 versus 23 days in July 2015); in the period January-July 2016 the percentage change was +0.6 compared with the same period of 2015.
The unadjusted industrial production index decreased by 6.3% compared with July 2015.
-
09:32
Swiss producer prices decline in August
The Producer and Import Price Index fell in August 2016 by 0.3% compared with the previous month, reaching 99.5 points (base December 2015 = 100). This decline is due in particular to lower prices for petroleum products and pharmaceutical products. Compared with August 2015, the price level of the whole range of domestic and imported products fell by 0.4%. These are the findings of the Federal Statistical Office (FSO).
-
09:15
Switzerland: Producer & Import Prices, y/y, August -0.4%
-
09:15
Switzerland: Producer & Import Prices, m/m, August -0.3%
-
09:00
Huge week for the pound as today’s CPI will set the tone. Employment and Bank of England up next. Volatility expected
-
08:39
Asian session review The dollar reversals on Brainard's comments
The Australian dollar fell slightly, despite the more positive-than-expected economic data from China and Australia. Today was published the monthly report on the index of business sentiment from Australian National Australia Bank. It is based on a survey of top managers of more than 500 green companies on the continent. It turned out that in August, the index fell 2 points to 7.0. However, the index of business sentiment rose to six, after a decline of one point in July. Also, increased sales and profits of companies and the employment index showed growth above the average by 4 points.
Also, today's report, published by China's National Bureau of Statistics showed that the volume of industrial production in August, year on year increased by 6.3%. Analysts had expected an increase of 6.1%. During the period from January to August of last year this indicator increased by 6.0%. Production growth was recorded in 33 of 41 industries. The highest growth rates showed the automotive and electronics industry.
Also today was reported that retail sales in China increased in August by 10.6%, after rising by 10.2% previously. Analysts had expected an increase of 10.3%. The volume of investments in fixed assets in China, with the exception of agriculture, grew by 6.1%, lower than the previous value of 8.1%, and experts forecast of 8.0% in January-August 2016.
At the end of eight months of this year the volume of investments in the Chinese mining industry grew by 21.5%. The inflow of investments in the manufacturing sector increased by 3%.
The US dollar traded in a narrow range against the major currencies, as investors continue to analyze the comments from the Fed before the meeting of the US central bank, which is scheduled for September 20-21.
Fed official Lael Brainard said yesterday that the grounds for preventive rate hikes seem less convincing, and improvement in the labor market has not had the desired impact on inflation. "Right now, the impact of external negative shocks stronger than before, focusing on downside risks than pre-emptively raise rates". According to the futures market, the likelihood of a hike in September is 12% against 24% before Brainard's speech. Meanwhile, the probability of rate increase during the December meeting of the Fed declined to 56.8% from 59.3% the previous day.
EUR / USD: during the Asian session, the pair was trading in the $ 1.1225-40 range
GBP / USD: during the Asian session, the pair was trading in the $ 1.3315-40 range
USD / JPY: during the Asian session, the pair was trading in the Y101.40-00 range
-
08:27
Options levels on tuesday, September 13, 2016:
EUR/USD
Resistance levels (open interest**, contracts)
$1.1384 (2133)
$1.1342 (2106)
$1.1302 (425)
Price at time of writing this review: $1.1229
Support levels (open interest**, contracts):
$1.1176 (3045)
$1.1144 (3580)
$1.1108 (3602)
Comments:
- Overall open interest on the CALL options with the expiration date October, 7 is 35940 contracts, with the maximum number of contracts with strike price $1,1500 (5361);
- Overall open interest on the PUT options with the expiration date October, 7 is 37891 contracts, with the maximum number of contracts with strike price $1,1100 (5582);
- The ratio of PUT/CALL was 1.05 versus 1.01 from the previous trading day according to data from September, 12
GBP/USD
Resistance levels (open interest**, contracts)
$1.3604 (1529)
$1.3507 (1421)
$1.3411 (1931)
Price at time of writing this review: $1.3320
Support levels (open interest**, contracts):
$1.3193 (1834)
$1.3096 (768)
$1.2998 (3071)
Comments:
- Overall open interest on the CALL options with the expiration date October, 7 is 20300 contracts, with the maximum number of contracts with strike price $1,3450 (2699);
- Overall open interest on the PUT options with the expiration date October, 7 is 19872 contracts, with the maximum number of contracts with strike price $1,3000 (3071);
- The ratio of PUT/CALL was 0.98 versus 1.04 from the previous trading day according to data from September, 12
* - The Chicago Mercantile Exchange bulletin (CME) is used for the calculation.
** - Open interest takes into account the total number of option contracts that are open at the moment.
-
08:27
The Wall Street Journal: New Zealand's GDP in the 2nd quarter likely rose 1.1%
According to the median estimate of economists surveyed by The Wall Street Journal, the gross domestic product of New Zealand in the second quarter probably rose by 1.1% compared with the previous quarter. Recall that in the first quarter the economy rose 0.7%. On an annualized basis, economists forecast the growth rate at 3.6%. 9 experts surveyed said that the positive dynamics of GDP set by the construction sector, manufacturing and retail. Recall, the official data will be published on Wednesday at 21.45 GMT.
-
08:21
Industrial production in China climbed 6.3 percent on year
According to rttnews, industrial production in China climbed 6.3 percent on year in August, the National Bureau of Statistics said on Tuesday - beating forecasts for a gain of 6.2 percent and up from 6.0 percent in July.
On a monthly basis, output expanded 0.5 percent.
The bureau also said that retail sales advanced an annual 10.6 percent - again exceeding expectations for 10.2 percent, which would have been unchanged from the previous month.
Fixed asset investment gained 8.1 percent on year, beating forecasts for 7/9 percent and unchanged from the July reading.
-
08:19
Food prices in New Zealand added 1.3% in August
Food prices rose 1.3 percent in August 2016, partly influenced by record high banana prices, Statistics New Zealand said today.
Banana prices spiked 22 percent from July, to $3.51 per kilo. The previous peak was $3.23, in March this year.
"Banana prices were at their highest since the series began in 1949, reflecting a supply shortage from Ecuador. Over the last three years, Ecuador has overtaken the Philippines as the main supplier of bananas to New Zealand," consumer prices manager Matt Haigh said today. "Kiwi households spend an average of $88 a year on bananas, making them the most popular fruit."
Seasonally adjusted fruit prices rose 3.2 percent, as the rise in banana prices was partly offset by lower prices for avocados (down 25 percent).
-
08:16
Consumer prices in Germany were 0.4% higher in August
Consumer prices in Germany were 0.4% higher in August 2016 than in August 2015. The consumer price index in August 2016 remained unchanged compared with July 2016. This means that the inflation rate as measured by the consumer price index persists at a low level. A slightly higher rate had last been recorded in January 2016 (+0.5%). The Federal Statistical Office (Destatis) thus confirms its provisional overall results of 30 August 2016.
As in the preceding months, the low inflation rate in August 2016 was mainly due to the decrease in energy prices (-5.9%). Compared with the previous month, the decrease of energy prices slowed down year on year; it had stood at -7.0% in July 2016. Consumers benefited especially from the prices of mineral oil products, which were down in August 2016 on a year earlier (-10.4%, of which heating oil: -15.0%, and motor fuels: -9.1%). The prices of other energy products, too, were below the level of a year earlier (for example, charges for central and district heating: -8.6%; gas: -3.1%). Only electricity prices rose compared with the previous year (+0.7%). Excluding energy prices, the inflation rate in August 2016 would have been +1.1%.
-
08:00
Germany: CPI, y/y , August 0.4% (forecast 0.4%)
-
08:00
Germany: CPI, m/m, August 0.0% (forecast 0.0%)
-
04:01
China: Retail Sales y/y, August 10.6% (forecast 10.3%)
-
04:01
China: Fixed Asset Investment, August 8.1% (forecast 8%)
-
04:01
China: Industrial Production y/y, August 6.3% (forecast 6.1%)
-
03:30
Australia: National Australia Bank's Business Confidence, August 6
-
01:51
Japan: BSI Manufacturing Index, Quarter III 2.9
-
00:29
Currencies. Daily history for Sep 12’2016:
(pare/closed(GMT +3)/change, %)
EUR/USD $1,1234 +0,01%
GBP/USD $1,3334 +0,50%
USD/CHF Chf0,9718 -0,37%
USD/JPY Y101,92 -0,77%
EUR/JPY Y114,50 -0,72%
GBP/JPY Y135,89 -0,27%
AUD/USD $0,7562 +0,33%
NZD/USD $0,7350 +0,39%
USD/CAD C$1,3039 -0,04%
-
00:00
Schedule for today,Tuesday, Sep 13’2016
(time / country / index / period / previous value / forecast)
01:30 Australia National Australia Bank's Business Confidence August 4
02:00 China Retail Sales y/y August 10.2% 10.3%
02:00 China Fixed Asset Investment August 8.1% 8%
02:00 China Industrial Production y/y August 6.0% 6.1%
06:00 Germany CPI, m/m (Finally) August 0.3% 0.0%
06:00 Germany CPI, y/y (Finally) August 0.4% 0.4%
07:15 Switzerland Producer & Import Prices, m/m August -0.1%
07:15 Switzerland Producer & Import Prices, y/y August -0.8%
08:30 United Kingdom Producer Price Index - Output (MoM) August 0.3% 0.2%
08:30 United Kingdom Producer Price Index - Output (YoY) August 0.3% 1%
08:30 United Kingdom Producer Price Index - Input (MoM) August 3.3% 0.5%
08:30 United Kingdom Producer Price Index - Input (YoY) August 4.3% 8.1%
08:30 United Kingdom Retail Price Index, m/m August 0.1% 0.4%
08:30 United Kingdom Retail prices, Y/Y August 1.9% 1.8%
08:30 United Kingdom HICP, m/m August -0.1% 0.4%
08:30 United Kingdom HICP, Y/Y August 0.6% 0.7%
08:30 United Kingdom HICP ex EFAT, Y/Y August 1.3% 1.4%
09:00 Eurozone ZEW Economic Sentiment September 4.6
09:00 Eurozone Employment Change Quarter II 0.3%
09:00 Germany ZEW Survey - Economic Sentiment September 0.5 2.5
18:00 U.S. Federal budget August -113
22:45 New Zealand Current Account Quarter II 1.31
-