Notícias do Mercado
-
23:47
GBP/JPY Price Analysis: Dip buyers emerge at the 20-hour EMA as traders eye 166.00
- GBP/JPY registers minimal losses as the Asian session begins, down 0.08%.
- The cross-currency pair needs to break above 166.00 to open the door for upward prices.
- Deterioration in traders’ mood and failures to crack 166.00 could send the GBP/JPY tumbling towards 163.00.
The GBP/JPY registers minimal losses as the Asian Pacific session begins. On Tuesday, the GBP/JPY opened below the 164.00 figure and rose towards the daily high at 165.54 before retracing some of its gains, finishing Tuesday’s trading session positive by 1%. At the time of writing, the GBP/JPY is trading at 165.24.
GBP/JPY Price Analysis: Technical outlook
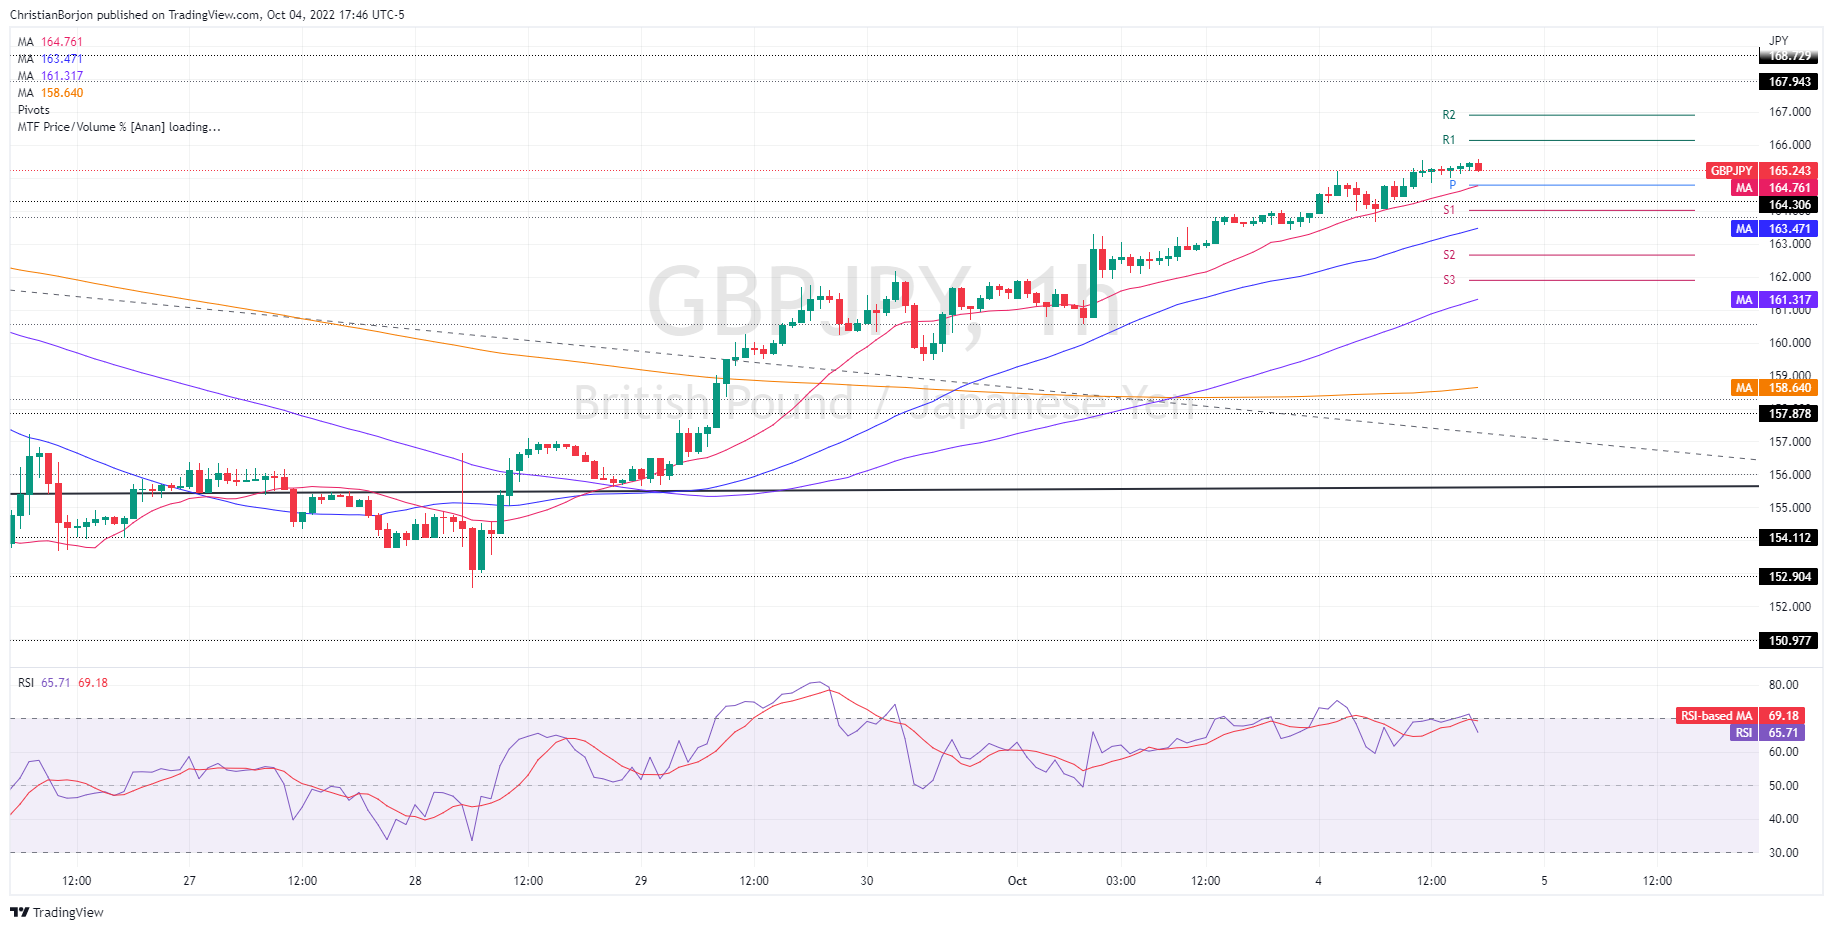
Even though the cross-currency pair printed six days of gains, the GBP/JPY needs to clear September’s high at 167.94 to cement its upward bias. GBP/JPY traders should be aware that the Relative Strength Index (RSI) shifted from aiming upwards to flat, suggesting buyers’ exhaustion. Therefore, as buyers get a respite, the GBP/JPY might correct lower to challenge the YTD high at 168.73.
Short term, the GBP/JPY one-hour chart delineates prices advancing steadily, with the 20-hour EMA, as dynamic support, previously tested four times. Still, the GBP/JPY managed to stay on the bullish side of the moving average (MA), used for dip buyers to re-enter longs.
If the GBP/JPY is going to extend its gains, the first resistance would be 166.00. Once cleared, the next resistance would be the R1 daily pivot at 166.14, followed by the R2 pivot point at 167.00.
GBP/JPY’s failure to decisively break 166.00 and deterioration in sentiment could pave the way for further losses. Therefore, the first support would be the confluence of the daily pivot point and the 20-hour EMA at 165.26. Break below will expose the S1 pivot at 164.02, followed by the 50-hour EMA at 163.47 and the 163.00 mark.
GBP/JPY Key Technical Levels
-
23:34
GBP/USD Price Analysis: Bulls cross 200-EMA above 1.1400, more gains ahead
- The cable has entered the highest auction area which was recorded in the downside journey.
- Bulls have crossed the 200-EMA for the first time in the past 11 weeks.
- The RSI (14) has established into the bullish range of 60.00-80.00 comfortably.
The GBP/USD pair is struggling to smash the psychological resistance of 1.1500 after a juggernaut rally. The asset is gathering momentum at elevated levels and is expected to continue its six-day winning streak after overstepping Tuesday’s high at 1.1490. The major witnessed a responsive buying action after forming a buying tail on September 26.
On a four-hour scale, the cable has entered into the demon’s arena where most of the trading activity took place while the downside journey of the asset. The major has poked the prior balanced area in a 1.1370-1.1770 range, which serves as the highest auction territory.
The asset has crossed the 200-period Exponential Moving Average (EMA) at 1.1400 for the first time after a period of 11 weeks. Also, a bullish crossover delivered by the 20 and 50-EMAs at 1.1051 adds to the upside filters.
Meanwhile, the Relative Strength Index (RSI) (14) has been established in the bullish range of 60.00-80.00, which indicates that bullish momentum has been activated.
A minor pullback to near September 19 low at 1.1355 will serve as a bargain buy to the market participants, which will drive the asset towards the psychological resistance at 1.1500, followed by an August 31 high at 1.1694.
On the flip side, a downside break of the September 30 low at 1.1235 will drag the cable towards September 28 high at 1.0916. A slippage below the latter will drag the asset further towards September 29 low at 1.0763.
GBP/USD four-hour chart
-638005196153946407.png)
-
23:05
Australia S&P Global Services PMI came in at 50.6, above expectations (50.4) in September
-
23:05
Australia S&P Global Composite PMI rose from previous 50.8 to 50.9 in September
-
22:57
AUD/USD shifts auction above 0.6500 amid weaker DXY, US ISM Services PMI eyed
- AUD/USD is eyeing the establishment of an auction profile above 0.6500.
- The RBA trimmed its pace of hiking interest rates to keep the growth prospects intact.
- A lower-than-expected US ISM Services PMI reading could weaken the DXY further.
The AUD/USD pair is oscillating majorly above the psychological resistance of 0.6500 in the early Tokyo session. The asset is aiming to comfortably establish above 0.6500 as the US dollar index (DXY) has extended its losses after dropping below the cushion of 111.00. The major is displaying signs of volatility contraction after the announcement of the interest rate decision by the Reserve Bank of Australia (RBA).
On Tuesday, RBA Governor Philip Lowe announced a rate hike by 25 basis points (bps). The extent of the rate hike was lower than the expectations of 50 bps as the central bank preferred to take growth prospects along with the foremost agenda of bringing price stability to the economy. This has pushed the Official Cash Rate (OCR) to 2.6%. RBA policymaker ditched the ongoing pattern of accelerating interest rates by 50 bps.
Now, the deviation between current rates at 2.6% and desired rate of 3.85% is extremely low, therefore the RBA has scaled down the pace of hiking interest rates.
Meanwhile, the DXY has slipped to near the psychological support of 110.00. The asset is expected to display a pullback move as short covering will kick-start after a sheer weakness.
In today’s session, the DXY will dance to the tunes of US ISM Services PMI data. The economic data is seen lower at 56 vs. the previous reading of 56.9. Also, the New Orders Index data will trim significantly to 58.9 against the prior release of 61.8.
-
22:38
NZD/USD traders sit tight ahead of the RBNZ
- NZD/USD traders await the RBNZ for clarity.
- Should the RBNZ outcome be dovish, then this could lead to a hefty sell-off towards 0.5650 and then 0.5600.
- On a hawkish outcome, NZD/USD could head towards a 50% mean reversion of the daily bearish impulse near 0.5800 and beyond.
The knee jerk to the RBA on Tuesday was a 50 pip sell-off before a 100 pip rally that was faded by the bears in London back to the post-RBA lows until the US dollar was sold off in New York.
It is the Reserve Bank of New Zealand's turn today and NZD/USD was unable to benefit as well as its counterparts in Europe due to the Reserve Bank of Australia's dovish tilt. The kiwi moved higher but was little changed on the day despite softer US yields and a much weaker US dollar.
NZD/USD moved up from a low of 0.56795 to score a high of 0.5783. The bird has since fallen back to the middle of the range and idles in the 0.5720 awaiting the next catalyst.
''The RBA’s surprise smaller 25bp hike yesterday has gotten FX markets wondering if the Reserve Bank of New Zealand might be the next central bank to slow the pace of tightening,'' analysts at ANZ Bank said.
''That and NZD/AUD relatives is weighing on the Kiwi this morning. Still, it won’t be long (2pm) before the RBNZ get the chance to make their views known. We expect a 50bp hike and hawkish tone, but the market is already pricing in a lot, so the bar is high.''
''While officials in Australia may be taking a more cautious approach we expect the RBNZ will lift the official cash rate by 50bps today. The Quarterly Survey of Business Opinion released by the NZIER yesterday shows inflationary pressures remain very strong.
Capacity pressures are only easing slowly and the labour market remains very tight. In this inflationary environment we see the RBNZ has little choice but to focus on dampening inflation pressures by delivering another 50bp rate hike,'' the analysts explained.
NZD/USD technical analysis
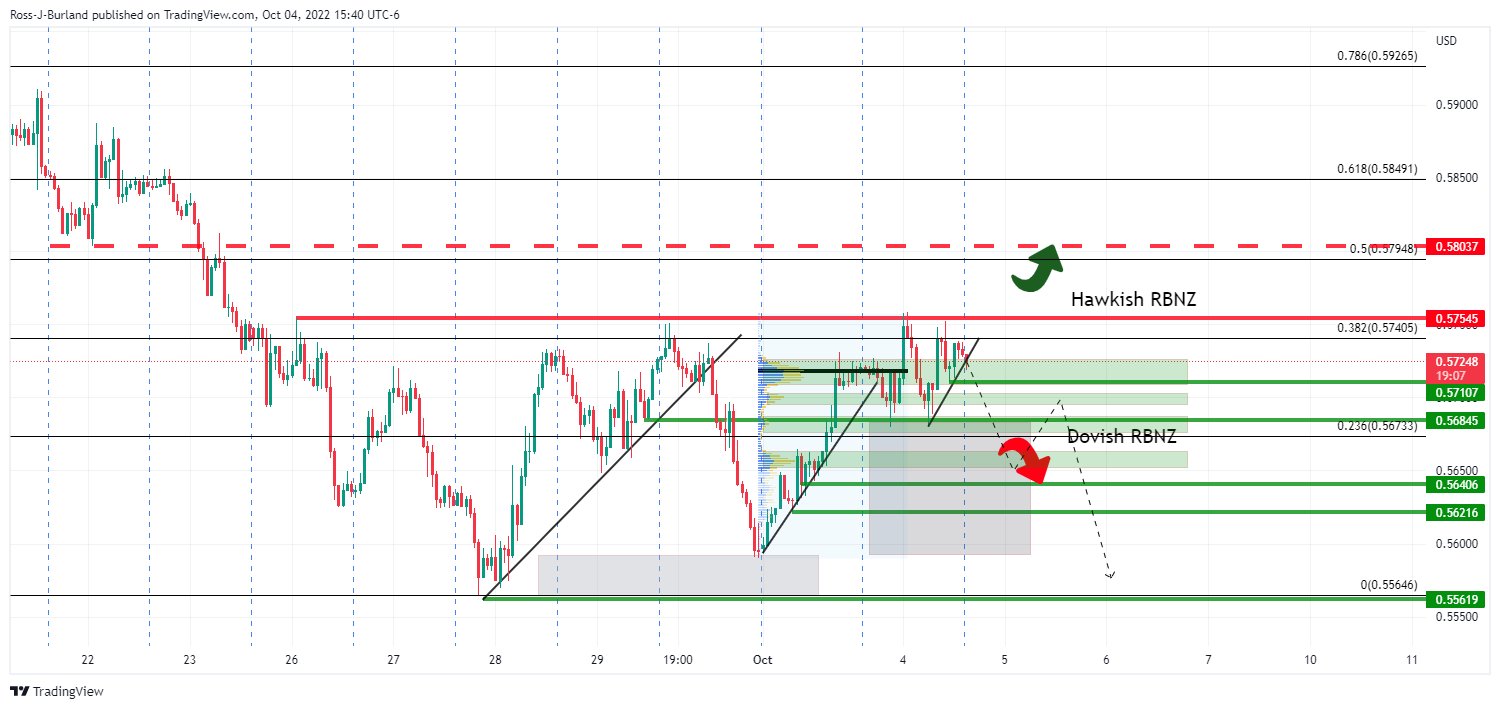
The price is leaning over the top of a 100 pip box and resisted by the 0.5750s. Should the RBNZ outcome be dovish, then this could lead to a hefty sell-off towards the middle of the 100 pip box near 0.5650 and then 0.5600.
On the other hand, the price could shoot up on a hawkish outcome towards a 50% mean reversion of the daily bearish impulse near 0.5800 and beyond.
The knee jerk to the RBA on Tuesday was a 50 pip sell-off before a 100 pip rally that was faded by the bears in London back to the post-RBA lows until the US dollar was sold off in New York.
-
22:27
EUR/USD Price Analysis: Marches firmly towards parity, though remains downward biased
- EUR/USD is closing towards the parity on speculations that the Fed could shift “dovish.”
- The EUR/USD continues its recovery, though shy of breaking the 50-day EMA above parity.
- For the EUR/USD to shift neutral, it needs to clear 1.0226; otherwise, the bias remains downwards.
The shared currency continues its recovery against the greenback, as the EUR/USD cleared the 20-day EMA at 0.9891 and climbed towards the 50-day EMA, though it fell short of reaching it, printing a daily high at 0.9997. At the time of writing, the EUR/USD is trading at 0.9984, up by 1.66%.
The EUR/USD extended its recovery due to some fundamental reasons. US Treasury bond yields edge lower as speculations of central banks tightening at a slower pace grew as reflected by a risk-on impulse. Therefore, as shown by the US Dollar Index, the greenback dropped from its YTD high at 114.77, to 110.184, at the time of typing.
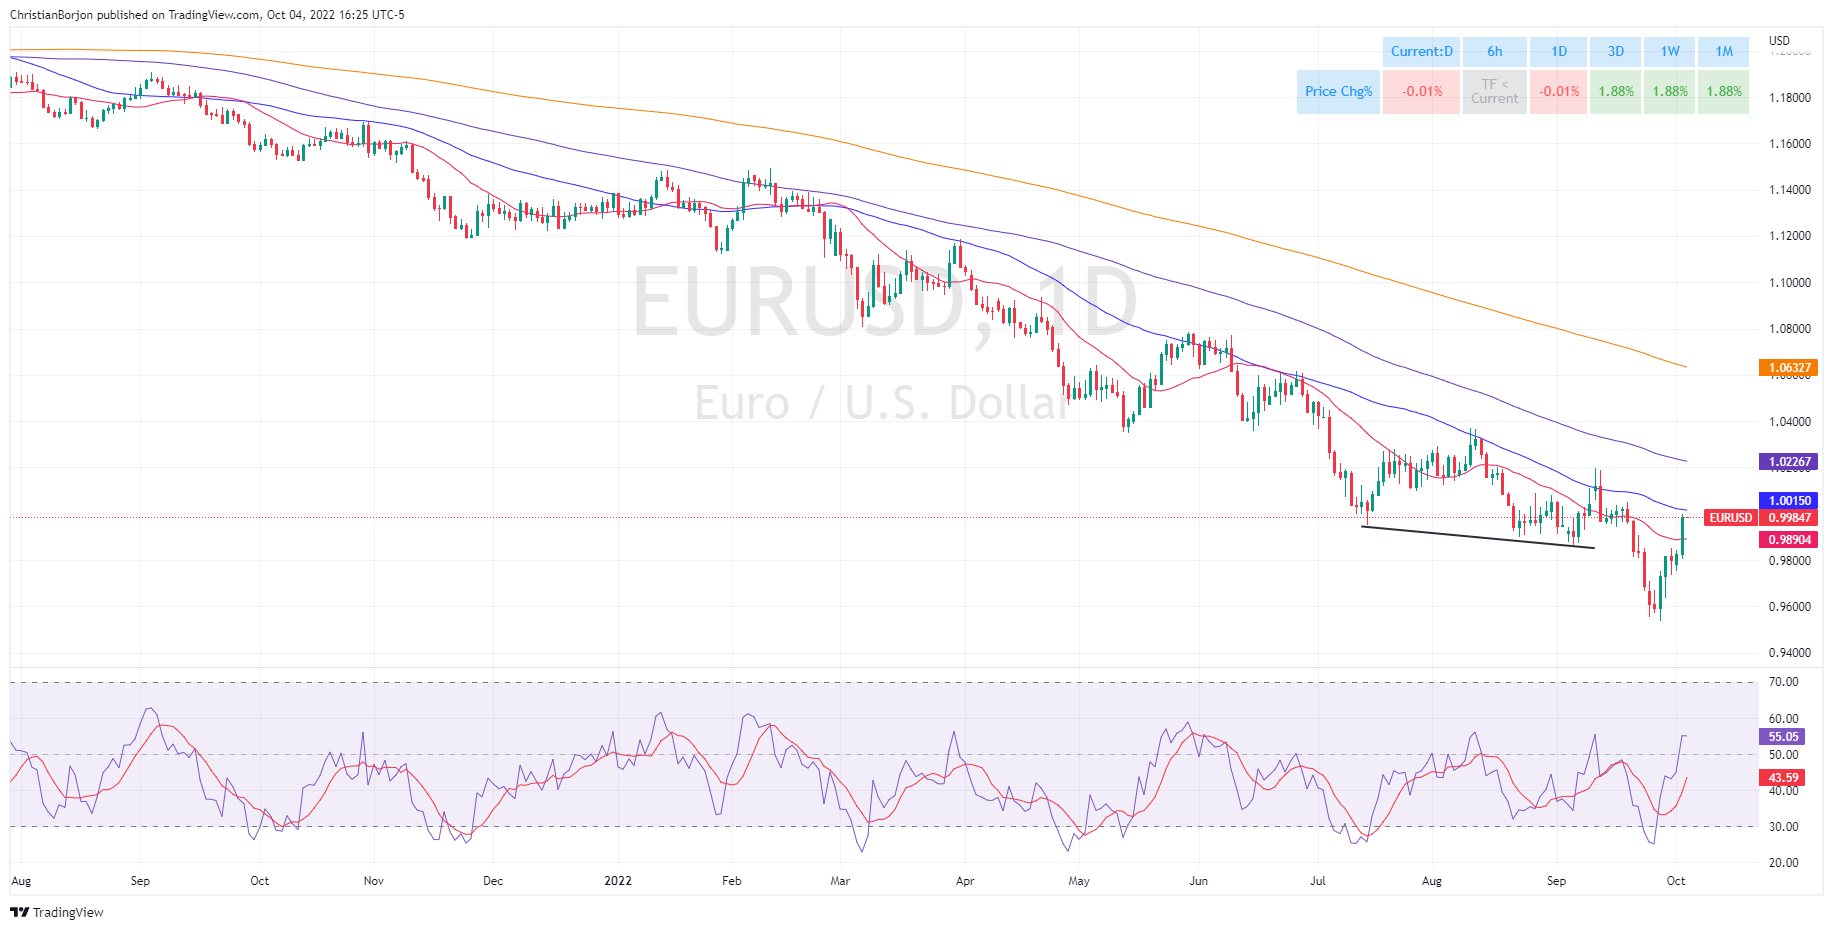
EUR/USD Price Analysis: Technical outlook
The EUR/USD daily chart delineates that the euro, even though it recovered from two-decade lows, it is still downward biased. The major could shift its bias to neutral if it clears the 100-day EMA at 1.0226 and would shift bullish if the pair is back above 1.0615, which could pave the way for a 200-day EMA test at 1.0632. That said, failure at parity or the 50-day EMA at 1.0015 would expose the EUR/USD to selling pressure.
Therefore, the EUR/USD first support would be 0.9900, closely followed by the 20-day EMA at 0.9890. A breach of the latter will expose the 0.9800 figure, followed by the YTD low at 0.9635.
EUR/USD Key Technical Levels
-
21:41
United States API Weekly Crude Oil Stock fell from previous 4.15M to -1.77M in September 30
-
21:04
Gold Price Forecast: XAU/USD bears are lurking in daily moving average cloud and confluence of resistance
- Gold has rallied towards last week's highs as the US dollar and yields drop, risk rallies.
- Gold bears focus on the downside and a 50% mean reversion near the $1,685/75 area.
The gold price rallied on Tuesday printing a fresh high for the week so far around $1,730 and traders have their sights set on September's high of $1,735. The yellow metal rallied from a low of $1,695.24 on the day as the US yields made fresh lows of 3.564% in the benchmark 10-year Treasury yield while the US dollar got smacked down on yet further data disappointments.
The DXY, which measures the greenback vs. a basket of currencies fell from a high of 111.886 for the day, or 110.870 on the following JOLTS data:
-638005016651390367.png)
US job openings fell to almost 10.1 million in August, according to the Bureau of Labor Statistics, below the consensus on Econoday for 11.15 million and down from 11.17 million reported in July. The larger-than-expected decline could be the first sign that demand for labour is falling ahead of this week's main event in the US Nonfarm Payrolls data. The weaker data has caused traders to bet the Federal Reserve may raise interest rates less than previously expected as the central bank turns more dovish as the US economy slows.
Elsewhere, also weighing on the greenback, US stocks advanced on signs that the supply-demand gap in the labour market was narrowing, a dovish factor that is supportive of risk appetite on Wall Street. The Dow Jones Industrial Average jumped 2.7% to 30,308.63, while the S&P 500 gained nearly 3% to 3,789.49. The Nasdaq Composite was over 3.5% higher at 11,609 with all sectors in the green after midday Tuesday.
All in all, risk appetite is back in vogue. Volatility is helping to elevate the price of gold, buoyed by expectations that central banks may ease the pace at which they tighten monetary policy resulting in US equity markets recording their strongest rebound since November 2020. However, views are mixed as to whether markets have now bottomed out or whether this recovery will be short-lived.
''We expect another beat on this week's nonfarm payroll data on Friday, which could present be a catalyst for a repricing lower,'' analysts at TD Securities argued. ''The pain trade is still to the downside in precious metals, and the latest positioning data highlighted that other reportables started to meaningfully liquidate their gold length, suggesting pressure towards a capitulation in gold is indeed building.''
Gold technical analysis
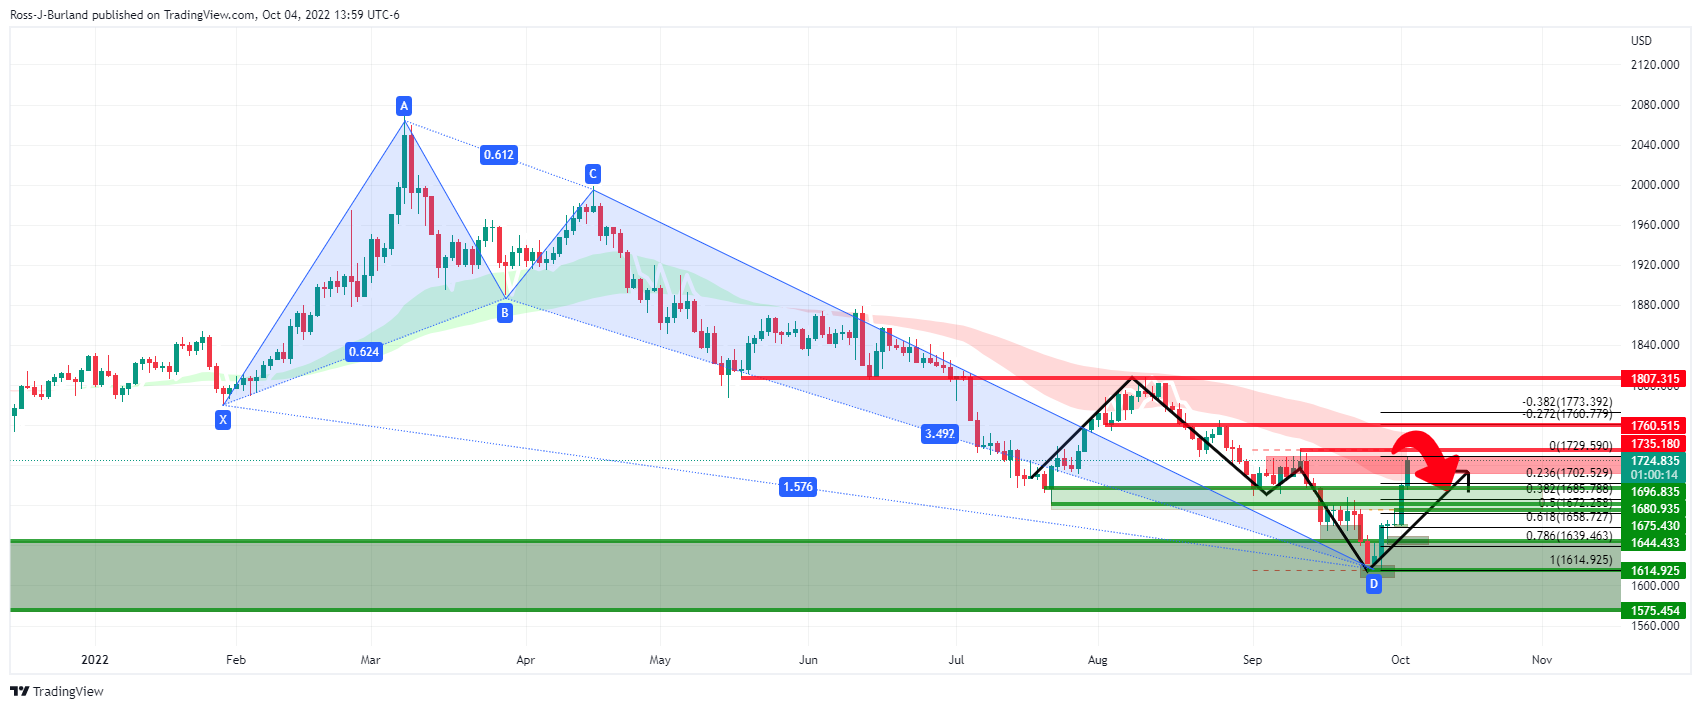
The daily chart has seen the price rejected higher as per the harmonic Crab which is a bullish pattern. The bulls are running into an area of potential resistance as per the weekly M-formation and prior week's highs as well as a 21/50 smoothed moving average cloud. For the day ahead, being the middle of the week, if this is going to be the highs of the week, then there will be a focus on the downside and that exposes a 50% mean reversion near the $1,685/75 area.
-
21:03
Forex Today: Will hopes resist recession fears?
What you need to take care of on Wednesday, October 5:
Optimism prevailed for a second consecutive day, leading to a continued dollar sell-off. The catalyst this time was the Reserve Bank of Australia, as it came out with a dovish surprise. Australian policymakers hiked the cash rate by a modest 25 bps, below the 50 bps expected, being the first to halt the ultra-aggressive quantitative tightening.
However, the global worrisome scenario remains the same. Inflation remains stubbornly high, while the risk of recessions is present among most major economies. For the record, the EU published the August Producer Price Index, which soared by 43.3% YoY, a record high.
The decision fueled hopes central banks are approaching the end of aggressive quantitative tightening. Global stocks rallied on relief, with US indexes sharply up for a second consecutive day as major indexes added over 2% each.
Government bonds kept recovering ground, keeping yields under modest pressure, which weighed on the greenback.
The EUR/USD pair trades just below parity and at its highest in over two weeks. GBP/USD is also up, currently trading in the 1.1470 price zone.
The aussie was the worst performer after RBA’s monetary policy decision, with AUD/USD now hovering at around 0.6500. The USD/CAD plunged towards 1.3500, trading nearby at the end of the American session.
The Swiss Franc edged higher against the greenback, with USD/CHF now trading at around 0.9790, while USD/JPY kept consolidating, now trading at around 144.00.
Gold benefited from the broad greenback weakness, trading at around $1,725 a troy ounce. Crude oil prices were also up, with WTI now changing hands at $86.20 a barrel.
Market players now await the Reserve Bank of New Zealand monetary policy decision. The central bank is expected to hike the main rate by 50 bps to 3.5%, and any decision different to that should spur volatility across the FX board.
Top 3 Price Prediction Bitcoin, Ethereum, Ripple: Turbulence en route to the moon
Like this article? Help us with some feedback by answering this survey:
Rate this content -
20:32
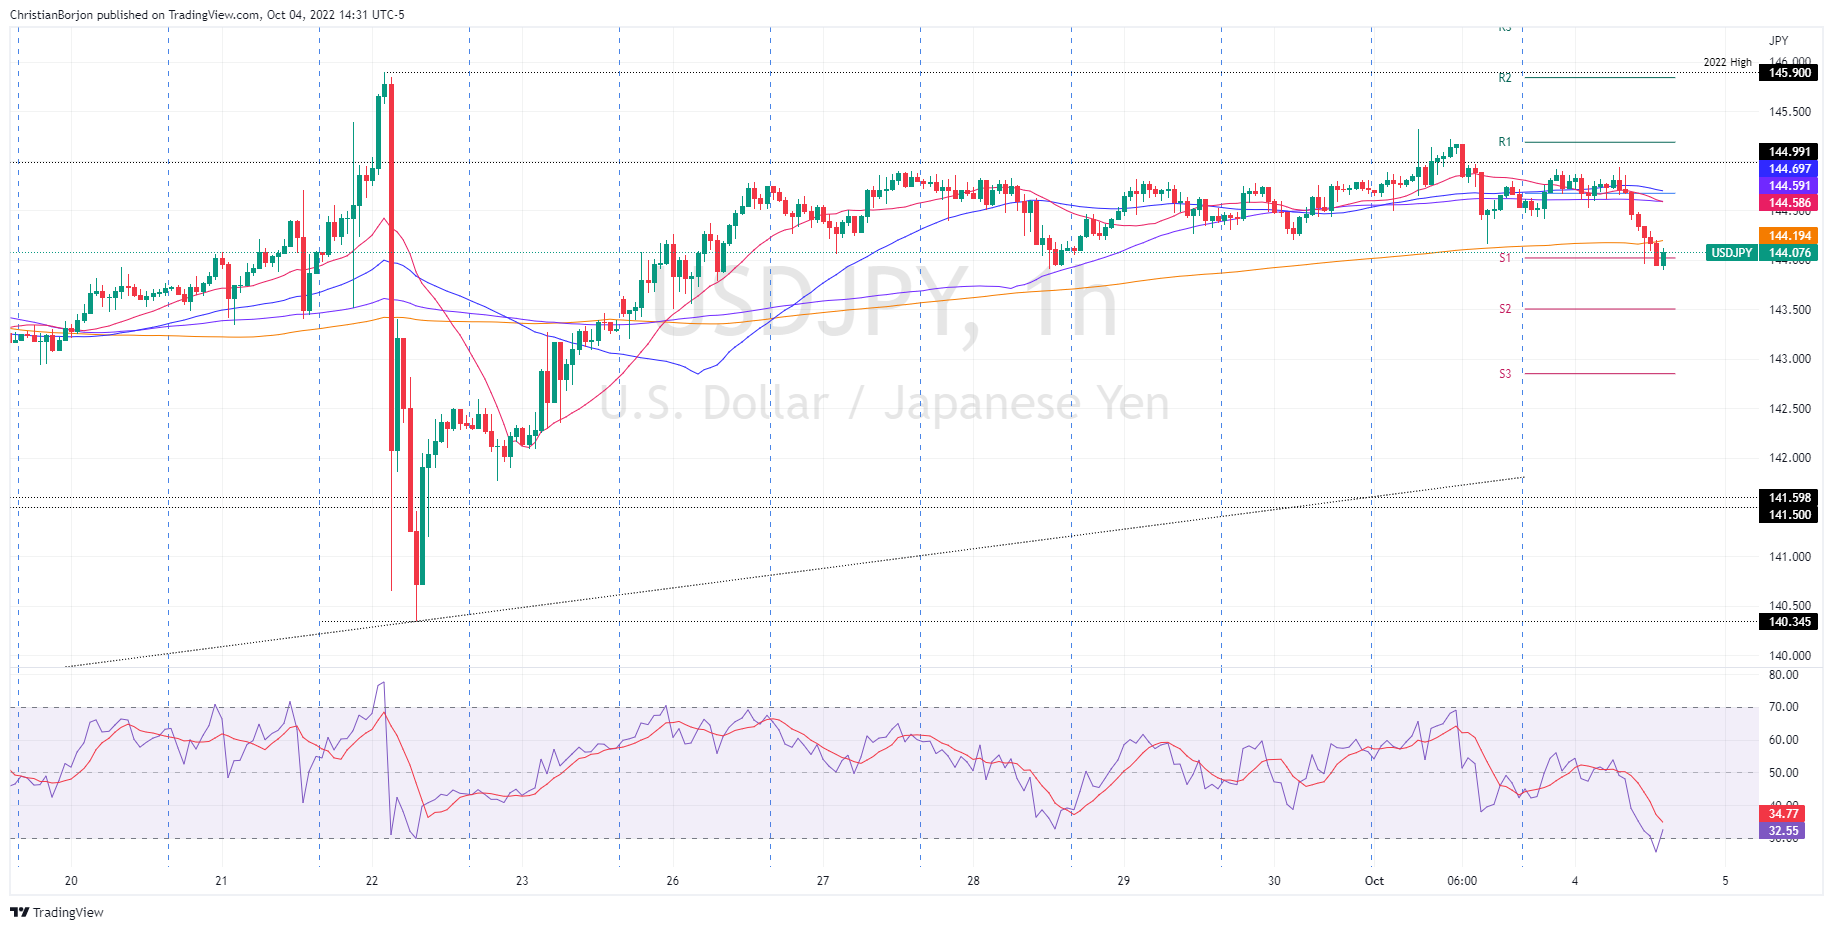
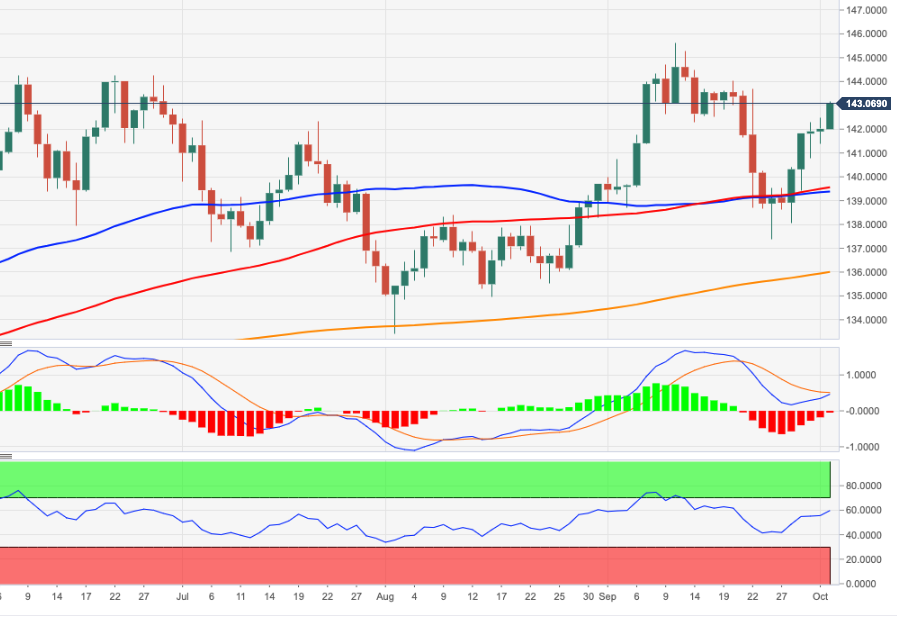
USD/JPY Price Analysis: Turns bearish, sliding below the one-hour 200-EMA, as sellers eye 143.00
- USD/JPY drops on a risk-on impulse due to equities rising amidst a falling greenback and US T-bond yields.
- If the USD/JPY clears 144.00, the pair could tumble to 143.00.
- Even though RSI is at oversold conditions, the break of the 200-EMA in the hourly chart shifted the bias downwards.
USD/JPY is subdued, falling for the second straight day as global equities extended their rally, following actions of some central banks, like the Bank of England (BoE) and the Reserve Bank of Australia (RBA), taking a “dovish” stance. Therefore, speculations that the Fed might follow suit sent US T-bond yields and the greenback diving. At the time of writing, the USD/JPY is trading at 144.07, shy of the 144.00 figure, down 0.32%.
USD/JPY Price Analysis: Technical outlook
From a technical analysis perspective, the USD/JPY is still upward biased, even though it is approaching the 20-day EMA at 143.76. Upside lies resistance at around 144.00, followed by Monday’s high at 144.93, ahead of the Bank of Japan’s (BoJ) line on the sand at 145.00.
For the major to shift neutral, the USD/JPY would need to collapse below the September 22 low of 140.34. Once cleared, the next support would be the 50-day EMA at 139.11.
The USD/JPY one-hour scale shows the majors tumbled below 144.67, Tuesday’s daily pivot, and the confluence of the 20, 50, and 100-EMAs, opening the door for further losses. Furthermore, as the USD/JPY heads south, it surpassed the 200-EMA at 144.19, shifting the short-term bias downwards. Albeit the Relative Strength Index (RSI) is at oversold conditions, a fall towards the S2 pivot point at 143.49, ahead of a test of the 143.00 figure.
USD/JPY Key Technical Levels
-
19:34
GBP/USD bulls run into a wall of critical resistance
- GBP/USD bears are lurking at a key confluence area of resistance.
- The tables could be turning in terms of the outlook for the Fed and UK politics.
- Bulls eye a significant breakout on higher time frames.
GBP/USD has been whipsawed on Tuesday in a day that ran through a vast territory for a fresh high for the week so far at 1.1489 from a low of 1.1280. The US dollar was hit hard on the back of poor JOLTS data that has accompanied weak Manufacturing data and prospects of a less hawkish Federal Reserve.
The bears are out to get the greenback and have pushed the pound towards extremes as per the longer-term charts in what has been a very strong bullish correction over the past two weeks from record lows.
The dollar slid against major currencies and along with yields, it would appear to reflect the market participants' views on the outlook for interest rates. At the same time, participants in the sterling money markets welcomed the British government's U-turn on some tax cuts. The pound dropped to a record low of $1.0327 on Sept. 26 and bond prices tumbled following the unveiling of the new government's plans to slash taxes, particularly for the rich, and ramp up borrowing.
However, it was not a popular plan and the plans to get rid of the 45% top rate of income tax has helped the pound to recover, adding to gains that were sparked by the Bank of England (BoE) last week restarting its bond-buying programme following a dramatic plunge in long-dated gilts.
Meanwhile, US yields, which move inversely to prices, were pressured at the start of the week and stayed low on Tuesday on more weak data in the JOLTS Job Openings. This is a survey done by the US Bureau of Labor Statistics to help measure job vacancies. It collects data from employers including retailers, manufacturers and different offices each month:
US job openings fell to almost 10.1 million in August, according to the Bureau of Labor Statistics, below the consensus on Econoday for 11.15 million and down from 11.17 million reported in July. The larger-than-expected decline could be the first sign that demand for labour is falling ahead of this week's main event in the US Nonfarm Payrolls data. The weaker data has caused traders to bet the Federal Reserve may raise interest rates less than previously expected.
GBP/USD technical analysis
The weekly outlook is bullish as per the strong recovery. However, the price is running into a wall of a confluence of resistances that include old lows, highs, trendline and high volumes. This would open the prospects of a meanwhile correction for the immediate future which could mean that we have seen the high of the week on Tuesday's trade.

The hourly chart's structures could come under pressure should the price now start to decelerate on the bid and chip into and consequently break the trendline support as the first bearish leading indicator in terms of price action.
-
19:21
Silver Price Forecast: XAG/USD reaches three-month highs above $21.00 on a risk-on impulse
- Silver price clears the $21.00 mark, courtesy of broad US dollar weakness amidst falling US bond yields.
- Speculations that the Fed would tighten at a slower pace spurred the equities recovery since Monday.
- US factory orders remained unchanged, while job openings, fell.
Silver price continues to extend its recovery during the week, climbing above the $21.00 figure for the first time since June 2022, spurred by a soft US dollar and falling US Treasury bond yields. At the time of writing, XAG/USD is trading at $21.02, up by 1.66%, as the North American session progresses.
US equities are trading in the green, signaling investors appetite improving. The greenback remains heavy due to speculations that the Fed might tighten at a slower pace of increases after a reading of US manufacturing activity flashed signs of tempering.
That said, the US Dollar Index, a gauge of the buck’s value vs. a basket of peers, creeps lower by 1.14%, at 110.389, undermined by US Treasury bond yields. The US 10-year benchmark note rate coupon is down two bps at 3.619%.
Data-wise, the US economic docket featured factory orders for August, reported by the US Commerce Department. Figures came at 0%, after July’s reading of -1%. Meanwhile, the US Labor Department revealed that job openings in the US dropped, though they remained at higher levels. The US JOLTs report for August showed that vacancies dropped from 11.239M in July to 10.053M in August.
In the meantime, Fed policymakers continued to grab the headlines as Fed Williams, Barkin, Jefferson, and Daly crossed wires.
New York Fed President John Williams said that the Fed’s “job is not yet done” while adding that rates are “not yet in a restrictive place for growth.” Richmond’s Fed Barkin said that a strong dollar has potential spillover effects on the global economy but stressed that the Fed is focused on the US economy.
San Francisco Fed Mary Daly said that further rates are needed, and then the Fed needs to hold restrictive policies in place until “we are truly done” on reaching the Fed’s goal. Earlier in his first remarks, Philip Jefferson said that inflation is the most serious problem facing the Fed. He added, “Restoring price stability may take some time and will likely entail a period of below-trend growth.”
What to watch
The US economic docket will feature the ADP Employment change, alongside the US International Trade and the S&P Global Services and Composite PMIs for September.
Silver (XAG/USD) Key Technical Levels
-
18:45
Fed's Daly: Pace of hiring should slow with job market vacancies falling
San Francisco Federal Reserve Bank President Mary Daly on Tuesday said inflation is causing pain in the economy for many Americans and is a corrosive disease.
Her comments follow the drop in US JOLTS today that sent the US dollar off a cliff to 110.11.
JOLTS Job Openings is a survey done by the US Bureau of Labor Statistics to help measure job vacancies. It collects data from employers including retailers, manufacturers and different offices each month:
-638005016651390367.png)
Earlier, Daly explained that the US central bank needs to push borrowing costs higher and then hold those restrictive policies in place until "we are truly done" on getting inflation back down to the Fed's 2% target.
Key comments
''Rising inflation is corrosive, weighs on disadvantaged.
Inclusive economy means jobs and price stability.
Inflation is not a risk, it is a reality.
Seeing job market vacancies fall, pace of hiring should slow.
We are working toward balancing both side of Fed mandate.
Fortunate economy was so strong ahead of pandemic.
Financial conditions have responded swiftly to changes in Fed outlook.
Always room for fed to do things better.
Did not fully appreciate how long it would take to deal with covid pandemic.
Also didnt appreciate how strong demand was going to be.
Didn't appreciate strength of demand amid pandemic period.
Fed has tools and knowledge to fight high inflation.
We have the tools to fight high inflation, we know how to do that.
Good to see relative stability of long term inflation expectations.
We can't be complacent but so far have not lost inflation anchor.''US dollar update
Meanwhile, the US dollar slid against major currencies on Tuesday as the yield on the benchmark US 10-year Treasury fell to 3.564% as a new low for the week so far. DXY dropped from a high of 111.886 for the day, or 110.870 on the JOLTS data.
-
17:58
USD/CAD drops below 1.3600 on soft US dollar and higher oil prices
- USD/CAD drops 100 pips on Tuesday, extending its weekly losses to almost 2%.
- Broad US dollar weakness and high crude oil prices undermine the USD/CAD, a tailwind for the CAD.
- The US economy is slowing as the Fed wishes, as portrayed by the JOLTs report missing estimations.
- Fed policymakers continue to emphasize the need for higher rates amidst recent US data showing the economy is slowing.
The USD/CAD extended its losses for two-consecutive trading days, courtesy of a soft US dollar and rising oil prices, which underpinned the commodity-linked Loonie amidst a risk-on impulse.
Therefore, the USD/CAD is trading at 1.3553 after hitting a daily high of 1.3664, at around the 200-hour EMA, before the major tumbled towards the 1.3530s area.
On Tuesday, investors’ sentiment improved. US economic data released by the US Department of Labor reported that vacancies edged lower from around 11.239M in July to 10.053M in August. In the meantime, the US Department of Commerce revealed that factory orders for August remained unchanged at 0%, after July’s 1% fall.
After Monday’s ISM, PMI reported that manufacturing activity slowed but remained in expansionary territory. Sub-components showed that the price index dropped while new orders began to fall.
A slew of Fed officials, led by the New York Fed John Williams, crossed newswires since Monday. Williams said that the Fed’s job is “not yet done” while adding that policy “is not yet in a restrictive place for growth,” emphasizing the need for higher rates.
Atlanta’s Fed President Raphael Bostic said that supply chains are putting upward pressure on prices, while Richmond’s Barkin said that a strong dollar has potential spillover effects on the global economy but stressed that the Fed is focused on the US economy.
Of late, the San Francisco Fed Mary Daly said that the Fed is committed to getting inflation low and echoed the NY Fed Williams comments of needing additional rate hikes.
In the meantime, one of the newest Fed board members, Philip Jefferson, said, “Restoring price stability may take some time and will likely entail a period of below-trend growth.”
Aside from this, missing Canadian economic data reported left USD/CAD traders adrift to US dollar dynamics and commodity prices. The US Dollar Index is falling off the cliff after hitting a YTD high at 114.77, though it is down 1.27% at 110.246.
Contrarily, US crude oil prices surged on speculations that OPEC+ could lower global oil production by as much as 2 million barrels per day. Hence, WTI jumped and reached a daily high at around $86.95, shy of the $87 mark, up by more than 3.60%. The cartel is scheduled to meet in October 5.
Therefore, the USD/CAD continued its downtrend, though lately bounced off the lows at around 1.3521 toward the S1 daily pivot point.
What to watch
The Canadian docket will feature Building Permits and Trader Balance on Wednesday, followed by the Bank of Canada (BoC) Tiff Macklem’s speech on Thursday. On the US front, the calendar will reveal US S&P Global PMIs, and the ADP Employment Change report, alongside Fed speaking.
USD/CAD Key Technical Levels
-
17:02
EUR/USD keeps rising amid a weaker USD, approaches parity
- EUR/USD extends gains above 0.9900, next barrier at 1.0015.
- Euro gains more than 400 pips from last week's low.
- US Dollar tumbles across the board on risk appetite and lower US yields.
The EUR/USD rose even further during the American session and climbed to 0.9977, reaching the highest level in a week. It remains near the top, up more than 150 pips for the day and 440 above last week's low.
The next critical level on the upside is the parity area and the 1.0015 resistance area. On the flip side, now 0.9900 has become the initial support followed by 0.9850/55.
Weaker dollar driving EUR/USD higher
On Tuesday, the August JOLTS (Job Openings report) showed the largest monthly decline on record from 11.17 million to 10.05, a possible sign of a slowdown in the job market. The negative report follows the larger-than-expected slide in the September ISM Manufacturing Index released on Monday. On Wednesday, the ADP report is due and on Friday the critical NPF report.
The latest round of US data below expectations contributed to the rally in EUR/USD by weakening the US dollar. The combination of lower US yields and higher equity prices are still affecting the greenback. The DXY is falling by more than 1% trading under 110.50. The US 10-year yield stands at 3.61% near weekly lows, and significantly away from levels above 4% it reached six days ago. In Wall Street, the Dow Jones is rising by 2.50% and the Nasdaq by 3.15%.
Despite the latest data, the Federal Reserve is still seen raising interest rates in order to curb inflation. The same situation applies to the European Central Bank. In a speech on Wednesday, Christine Lagarde said it is difficult to tell if inflation is at a peak. "The minimum that we have to do is to stop stimulating demand," Lagarde added.
Technical levels
-
16:59
United States 52-Week Bill Auction rose from previous 3.46% to 3.955%
-
16:39
AUD/USD: Could drop back to the 0.64 area on 1-3M – Rabobank
The Reserve Bank of Australia on Tuesday rose the key interest rate by 25 basis points, below the market consensus of 50 bps. The Australian dollar initially dropped but then rebounded. AUD/USD is hovering around 0.6500, marginally lower for the day. Analysts at Rabobank consider the AUD/USD could drop back to the 0.64 area in a one to three months period and then could rise toward 0.69 in the middle of 2023.
Key Quotes:
“Today’s decision by the RBA to surprise the market with a smaller than expected 25 bp rate hike brought relief to the Australian stock market. It may also have brought relief to other ‘smaller’ G10 central banks who have been caught up in rush of large incremental rate hikes in recent months probably designed to prevent their currencies falling too far against the mighty USD. Unsurprisingly, AUD/USD did initially drop back on the news of the RBA’s policy decision this morning, though it is now trading off its lows.”
“Various models suggest that the AUD is far less undervalued vs. the USD than the majority of other G10 currencies, while Australia’s CPI inflation rate is at the lower end of the range of G10 economies. This likely afforded the RBA with the breathing room to move away from large incremental rate hikes. That said, the trigger for a more conservative pace of policy tightening is likely rooted in the Australian property market.”
“We retain our view that AUD/USD could dip back to the 0.64 region on a 1-to-3-month view, with scope to recover to 0.69 in the middle of next year.”
“Australia’s current account surplus, strong terms of trade and positive growth outlook are supportive AUD factors. Although AUD/USD may struggle to hold its own vs. the mighty USD on a 1-to-6-month view, we see scope for a recovery into the middle of next year.”
-
16:29
EUR/DKK: Danish central bank likely to hike and widen the spread to ECB’s policy rate - Danske Bank
The Danish central bank intervened significantly in September to defend the fixed exchange regime between the Danish krone and the euro. It was the first intervention since December. Analysts at Danske Bank now expected the Danish central bank to hike 10bp less than the Europan Central Bank over the coming three months. They forecast the key policy rate at 1.80% by the end of the year and at 2.30% in February next year.
Key Quotes:
“Danmarks Nationalbank (DN) resumed FX intervention selling of DKK in September to floor EUR/DKK. DN intervened for DKK23bn - it has not intervened since December last year - and increased the FX reserve to DKK554bn. In our view, the downwards pressure on EUR/DKK is of persistent nature and warrants a widening of the spread to ECB's policy rate. We now expect DN to hike 10bp less than ECB over the coming 3M, i.e. to raise the deposit rate to 1.80% in December and further to 2.30% in February next year.”
“We think it is time for DN to make it more expensive to sell EUR/DKK and push it up towards the middle of the 7.43-7.47 trading range, which would end the need for intervening in the FX market. A 10bp widening of the policy rate spread should be enough, but DN may need to widen it an additional 10bp in our view.”
“We expect ECB to raise interest rates at the coming three meetings, i.e. in October, December and February, by a total of 175bp. We think it is most likely DN uses one of the upcoming two hikes as an opportunity to widen the spread to ECB's policy rate by raising its policy rate 10bp less, but it may also opt to cut its policy rate 10bp at any given Thursday at 17:00CET. DN may need to continue to sell DKK in FX intervention until it widens the policy rate spread.”
-
16:27
Lagarde speech: Difficult to say if inflation is at peak
European Central Bank (ECB) President Christine Lagarde said on Tuesday it was difficult to say whether or not inflation has peaked in the euro area, as reported by Reuters.
"The minimum that we have to do is to stop stimulating demand," Lagarde added.
Market reaction
These comments don't seem to be having a noticeable impact on the shared currency's performance against its major rivals. As of writing, the EUR/USD pair was trading at 0.9972, where it was up 1.5% on a daily basis.
-
16:22
Gold Price Forecast: XAU/USD climbs above $1700, as US T-bond yields plunge
- Gold price rises courtesy of falling US T-bond yields undermining the greenback.
- Sentiment improvement keeps global equities in the green.
- US manufacturing data weakening and Tuesday’s job vacancies falling depict the economy is feeling the Fed’s job.
- Fed officials repeatedly said the need to for higher rates amidst a high inflation environment.
Gold price advanced to three-week highs on Tuesday, as US T-bond yields continue to fall amidst US economic data showing that the Federal Reserve increases to the Federal funds rate (FFR) started to impact the economy as the US central bank scrambles to tame inflation. At the time of writing, XAU/USD is trading at $1723 a troy ounce, up by 1.40%.
Market sentiment swings, keep global equities on the right foot. The greenback is weakening as US treasury bond yields dropped like a stone, with the US 10-year bond yield down six bps at 3.587%. Following suit is the US 10-year Treasury Inflation-Protected Securities (TIPS) yield, a proxy for real yields, creeping lower to 1.367% after hitting a yearly high of 1.70%.
US economic data released on Monday flashed signs that manufacturing activity in the country is slowing. Sub-components of the ISM’s reports portrayed that new orders are contracting while prices are easing.
During the Tuesday session, the US docket featured factory orders for August were unchanged, following July’s drop of 1%, as the Department of Commerce reported. At the same time, job openings in the US fell, though they remained at higher levels, as reported by the Labor Department. The US JOLTs report for August showed that vacancies dropped from 11.239M in July to 10.053M in August.
Therefore, the Federal Reserve decisions are beginning to function, but Fed officials remain laser-focused on bringing inflation down.
Reflection of the aforementioned is the NY Fed President John Williams saying that even though tighter monetary policy has begun to control demand and reduce inflation, “our job is not yet done.” Williams added that policy “is not yet in a restrictive place for growth,” according to him, rates need to go higher.
Later, Atlanta’s Fed Bostic said shifts in global supply chains exert upward pressure on prices. Meanwhile, Richmond’s Fed Barkin added that a strong dollar has potential spillover effects on the global economy but stressed that the Fed is focused on the US economy.
On Tuesday, the San Francisco Fed Mary Daly said that the Fed is committed to getting inflation down and echoed the NY Fed Williams comments of needing additional rate hikes.
What to watch
The US economic docket will feature the ADP Employment change, alongside the US International Trade, and the S&P Global Services and Composite PMIs for September.
XAU/USD Key Technical Levels
-
16:18
NZD/USD rises back to test weekly highs ahead of RBNZ
- US Dollar falls across the board amid risk appetite.
- NZD/USD keeps facing strong resistance around 0.5750.
- RBNZ to decide on monetary policy on Wednesday.
The NZD/USD rose during the American session boosted by a broad-based decline of the US dollar across the board. The pair climbed to 0.5747 and it is hovering around 0.5735, up less than 20 pips for the day, with a bullish momentum.
The kiwi needs to make a clear break above 0.5750 in order to open the doors to further gains. The next barrier is seen at 0.5805. On the flip side, the immediate support might be seen at 0.5725 while the key intraday level is 0.5680, the daily low. A break under 0.5680 would leave the kiwi vulnerable.
The rally of the NZD/USD continues to be driven by a decline of the US dollar across the board. The DXY is falling again on Tuesday, about to post the fourth decline out of the last five days. It is trading at 110.48, the lowest level since September 22.
The improvement in market sentiment and lower US yields weakened the demand for the greenback during the last session. US employment reports due on Wednesday (ADP) and Friday (NFP) will be watched closely.
Next stop: RBNZ
On Tuesday the Reserve Bank of Australia surprised market participants with a rate hike of 25 basis points instead of the 50 bps expected. “Quite clearly, today's RBA decision may stoke speculation that other central banks will begin slowing the pace of hikes”, wrote analysts at TD Securities.
The Reserve Bank of New Zealand will announce its decision on Wednesday (01:00 GMT). A 50 basis points rate hike to 3.50% is expected. It would be the fifth consecutive hike in a row. Any changes to the statement could have a large impact on the kiwi.
Technical levels
-
16:02
New Zealand GDT Price Index below expectations (-0.1%): Actual (-3.5%)
-
16:00
Denmark Currency Reserves rose from previous 531.7B to 554.2B in September
-
15:57
WTI climbs to multi-week highs near $87 on OPEC headlines
Crude oil prices surged higher during the American trading hours on Tuesday and the barrel of West Texas Intermediate (WTI) reached its highest level since mid-September near $87. As of writing, WTI was trading at $86.50, where it was up 3.8% on a daily basis.
Reports suggesting that OPEC+ could lower the oil production by as much as 2 million barrels per day seem to have provided a boost to oil in the second half of the day on Tuesday. The group is scheduled to meet on Wednesday, October 5.
Later in the session, the American Petroleum Institute will release the crude oil inventory data for the week sending September 30.
-
15:49
EUR/USD: Seasonality in October poses another headwind – SocGen
A steady downtrend has led EUR/USD below parity. Economists at Société Générale note that weak seasonals suggest the pair could remain under downside pressure.
Limited upside potential
“A sustained rebound in oil prices after the OPEC+ meeting on Wednesday and strong US payrolls should limit upside for EUR/USD before the US CPI release on 13 October.”
“The bearish seasonality in October could be another headwind. The pair declined in seven of the last ten years in October and by an average of 0.6%.”
-
15:12
US: JOLTS Job Openings fall to 10.1 million in August
- US JOLTS Job Openings declined more than expected in August.
- US Dollar Index stays deep in negative territory below 111.00.
The number of job openings decreased to 10.1 million on the last business day of August, the US Bureau of Labor Statistics (BLS) reported in its Job Openings and Labor Turnover Summary (JOLTS) on Tuesday. This print came in slightly lower than the market expectation of 10.4 million.
"Hires and total separations were little changed at 6.3 million and 6.0 million, respectively," the BLS further noted in its publication. "Within separations, quits (4.2 million) and layoffs and discharges (1.5 million) were little changed."
Market reaction
The US Dollar Index extends its daily slide during the American trading hours and was last seen losing 0.88% on the day at 110.68.
-
15:07
US: Factory Orders virtually unchanged at $548.4 billion in August
- Factory Orders in the US declined modestly in August.
- The dollar continues to weaken against its major rivals.
The data published by the US Census Bureau revealed on Tuesday that new orders for manufactured goods, Factory Orders, declined by less than $0.1 billion in August and remained virtually unchanged at $548.4 billion. This print followed July's contraction of 1% and came in worse than the market expectation for an increase of 0.3%.
"New orders for manufactured durable goods in August, down two consecutive months, decreased $0.5 billion or 0.2%, to $272.7 billion, unchanged from the previously published decrease," the publication further read.
Market reaction
The dollar selloff continues after this data and the US Dollar Index was last seen losing 0.9% on the day at 110.67.
-
15:00
United States JOLTS Job Openings below expectations (10.45M) in August: Actual (10.053M)
-
15:00
United States Factory Orders (MoM) below expectations (0.3%) in August: Actual (0%)
-
15:00
GBP/USD Price Analysis: Bulls struggle to find acceptance above descending trend-line
- GBP/USD gains traction for the sixth successive day and climbs to a two-week high.
- Failure to find acceptance above a descending trend-line warrants caution for bulls.
- Positive technical indicators on the daily chart support prospects for further gains.
The GBP/USD pair prolongs its recent recovery move from an all-time low and gains traction for the sixth successive day on Tuesday. The momentum lifts spot prices to a two-week high, though falter near the 1.1430 region.
From a technical perspective, bulls seem to struggle to find acceptance above a downward-sloping trend-line resistance extending from the August monthly swing high. Technical indicators, meanwhile, have just started gaining positive traction on the daily chart and support prospects for further gains.
That said, it will still be prudent to wait for a sustained move beyond the daily high, around the 1.1430 area before positioning for an extension of the appreciating move. The GBP/USD pair might then comb to the 1.1500 psychological mark and extend the move towards the 1.1530-1.1540 supply zone.
Some follow-through buying will suggest that the GBP/USD pair has formed a near-term bottom. This, in turn, should pave the way for a move towards the 1.1600 round-figure mark en route to the 1.1670 hurdle. The latter coincides with the 50-day SMA and should act as the next key pivotal point.
On the flip side, any meaningful pullback could attract some buyers near the 1.1300 round-figure mark and find decent support around the 1.1280-1.1260 region. Failure to defend the said support will shift the bias back in favour of bears and prompt aggressive technical selling around the GBP/USD pair.
The subsequent downfall has the potential to drag spot prices below the 1.1200 round-figure mark, towards testing the next relevant support near the 1.1160-1.1155 region. The downward trajectory could further get extended towards the 1.1100-1.1085 zone, or the weekly low touched on Monday.
GBP/USD daily chart
-638004887285780050.png)
Key levels to watch
-
14:51
Silver Price Analysis: XAG/USD needs to breach $22.60 to attract additional buyers – TDS
Silver prices are surging. However, strategists at TD Securities note that XAG/USD needs to surpass the $22.60 mark to alleviate downside pressure.
Explosive silver prices are reminiscent of a #silversqueeze2.0
“Our CTA Position tracker highlights that a break above $19.32 likely sparked a CTA buying program. As a result of the break, CTAs are set to cover ~10% of their maximum historical short, exacerbating upside flows with few participants taking the other side.”
“We estimate that prices would need to breach $22.60 to catalyze additional CTA buying, suggesting that the #silversqueeze2.0 won't see much follow through.”
“We expect another beat on this week's nonfarm payroll data on Friday, which could present be a catalyst for a repricing lower.”
-
14:49
Fed's Daly: There's a lot of room to slow labor market
In an interview with CNN on Wednesday, San Francisco Fed President Mary Daly reiterated that the Federal Reserve is committed to getting inflation down, as reported by Reuters.
Additional takeaways
"Inflation hasn't gotten into Americans' psychology."
"Americans have faith Fed can bring inflation down."
"We need further rate hikes, hold policies until we are truly done with getting inflation down."
"There's a lot of room to slow labor market, I expect unemployment to rise to 4.5%."
"We have a narrow path for softer landing."
Market reaction
These comments did little to nothing to help the dollar find demand. As of writing, the US Dollar Index was down 0.6% on the day at 110.97.
-
14:44
USD/CAD set to climb towards 1.41 by end Q4 – Credit Suisse
Further CAD weakness is likely if the inflation data slowdown is confirmed – economists at Credit Suisse now see USD/CAD at 1.4100 by the end of Q4.
Markets eye an early end to Bank of Canada tightening
“Markets now anticipate the BoC to hike rates at the next two meetings and start easing as early as Q1 2023. If the BoC were to validate this shift in expectations, USD/CAD price action would likely become mainly a function of US yields. Conversely, pushback from the BoC against the early priced in end to the tightening cycle can bring local idiosyncrasies back to the fore in USD/CAD. This calls for a wide range approach: we see USD/CAD trading between 1.3250 and 1.4300 in Q4.”
“Uncertainty about BoC policy and high realized sensitivity to risk sentiment lead us away from the resilient CAD view we held in Q3: we now see USD/CAD ending Q4 around 1.4100.”
-
14:22
AUD/USD keeps the red below 0.6500 mark, weaker USD/risk-on offers some support
- AUD/USD continues to be weighed down by the RBA’s smaller than expected 25 bps rate hike.
- The prevalent USD selling bias offers some support to the major and helps limit the downside.
- Retreating US bond yields and the risk-on mood is seen weighing on the safe-haven greenback.
The AUD/USD pair struggles to capitalize on its intraday move up to over a one-week high and meets with a fresh supply near the mid-0.6500s on Tuesday. The pair maintains its offered tone through the early North American session and is currently placed around the 0.6475 area, just a few pips above the daily low.
The Australian dollar continues to be weighed down by the fact that the Reserve Bank of Australia (RBA) delivered a dovish surprise and lifted the cash rate by 25 bps. The increase was smaller than the 50 bps already priced in the markets and disappointed investors, which, in turn, is seen as a key factor weighing on the AUD/USD pair.
The downside, however, remains cushioned, at least for the time being, amid the prevalent selling bias surrounding the US dollar. The US Treasury bond yields prolong their recent pullback from a multi-year high touched last week. This, along with the risk-on impulse, undermines the safe-haven buck and benefits the risk-sensitive aussie.
Despite the supporting factor, the AUD/USD pair, so far, has been struggling to attract any meaningful buying. This, in turn, suggests that the path of least resistance for spot prices is to the downside. Hence, some follow-through weakness back below the 0.6400 mark, towards retesting the YTD low near the 0.6365 area, remains a distinct possibility.
Next on tap is the US economic docket, featuring JOLTS Job Openings and Factory Orders data. This, along with speeches by influential FOMC members and the US bond yields, will influence the USD price dynamics and provide some impetus to the AUD/USD pair. Traders will further take cues from the broader risk sentiment to grab short-term opportunities.
Technical levels to watchc
-
14:19
EUR/USD extends the upside to 2-week highs past 0.9900 ahead of Lagarde
- EUR/USD picks up extra pace and trespasses 0.9900.
- The dollar remains well under pressure, as DXY breaks 111.00.
- ECB’s Lagarde is due to speak later in the session.
While the greenback accelerates its daily decline, EUR/USD exacerbates its march north and breaks above the key 0.9900 hurdle on Tuesday.
EUR/USD now targets the parity zone
Indeed, EUR/USD now navigates the area of fresh 2-week highs past the 0.9900 hurdle, always propped up by the weaker tone surrounding the buck, which appears in turn under pressure against the backdrop of declining US yields across the curve.
However, the decline in yields is by no means exclusive to the US debt market. In fact, the German 10-year bund yields retreat to multi-session lows in the vicinity of 1.75% after climbing to levels last seen in August 2011 just few sessions ago.
Data wise in Euroland - and while market participants wait for Chairwoman Lagarde – Producer Prices in the euro zone rose more than expected 5% MoM in August and 43.3% over the last twelve months.
In the US, all the attention will be on the release of Factory Orders and speeches by FOMC’s Logan, Williams, Mester, Jefferson and Daly.
What to look for around EUR
EUR/USD keeps the strong recovery well and sound with the renewed target at the 0.9900 neighbourhood, always against the backdrop of the intense drop in the greenback.
In the meantime, price action around the European currency is expected to closely follow dollar dynamics, geopolitical concerns and the Fed-ECB divergence. The latter has been exacerbated further following the latest rate hike by the Fed and the persevering hawkish message from Powell and the rest of his rate-setters peers.
Furthermore, the increasing speculation of a potential recession in the region - which looks propped up by dwindling sentiment gauges as well as an incipient slowdown in some fundamentals – adds to the sour sentiment around the euro
Key events in the euro area this week: Eurogroup Meeting, Germany, EMU Final Manufacturing PMI (Monday) – ECB Lagarde (Tuesday) – Germany Balance of Trade, EMU, Germany Final Services PMI (Wednesday) – Germany Construction PMI, EMU Retail Sales, ECB Accounts (Thursday) – Germany Retail Sales (Friday).
Eminent issues on the back boiler: Continuation of the ECB hiking cycle. Italian post-elections developments. Fragmentation risks amidst the ECB’s normalization of its monetary conditions. Impact of the war in Ukraine and the persistent energy crunch on the region’s growth prospects and inflation outlook.
EUR/USD levels to watch
So far, the pair is gaining 0.95% at 0.9918 and the breakout of 0.9934 (weekly high October 3) would target 1.0032 (55-day SMA) en route to 1.0050 (weekly high September 20). On the other hand, the next support appears at 0.9535 (2022 low September 28) ahead of 0.9411 (weekly low June 17 2002) and finally 0.9386 (weekly low June 10 2002).
-
13:55
United States Redbook Index (YoY) climbed from previous 11% to 12.3% in September 30
-
13:39
GBP/JPY eases from multi-week high, still well bid around mid-164.00s amid risk-on
- GBP/JPY gains traction for the sixth successive day and climbs to a nearly three-week high.
- The UK government's U-turn on planned tax cut continues to underpin the British pound.
- The risk-on mood weighs on the safe-haven JPY and contributes to the appreciating move.
The GBP/JPY cross builds on last week's strong recovery from its lowest level since February 2021 and scales higher for the sixth successive day on Tuesday. Spot prices, however, trim a part of intraday gains to a nearly three-week high and retreat to mid-164.00s during the mid-European session.
Investors welcomed the UK government's U-turn on a controversial tax cut plan announced in its mini-budget last week. Furthermore, the Bank of England reaffirmed its willingness to buy up to £5 billion of long-dated gilts, which continues to act as a tailwind for the British pound and the GBP/JPY cross.
The Japanese yen, on the other hand, is undermined by the dovish adopted by the Bank of Japan, which marks a big divergence in comparison to other major central banks. This, along with the risk-on impulse, weighs on the safe-haven JPY and provides an additional lift to the GBP/JPY cross.
Japan's Finance Minister Shunichi Suzuki, meanwhile, said on Monday that the country stands ready to take decisive steps in the foreign exchange market if excessive yen moves persist. This, in turn, helps limit losses for the JPY and keeps a lid on the GBP/JPY cross, at least for the time being.
From a technical perspective, the overnight sustained strength beyond the 163.00 supply zone, which coincides with the 100-day SMA, favours bullish traders and supports prospects for additional gains. Hence, any meaningful pullback could still be seen as a buying opportunity and remain limited.
Technical levels to watch
-
13:21
AUD/USD: Tighter financial conditions to pressure aussie before recovery in 2023 – MUFG
The Australian dollar weakened sharply in September as financial conditions tightened globally. This trend is set to persist for the rest of the year, economists at MUFG Bank report.
Sharp housing market correction is a clear downside risk
“The economy in Australia remains resilient but there are signs of weakness in the housing market. While the still strong labour market is reason for optimism on the outlook for the economy, a sharp housing market correction is a clear downside risk.”
“With global equities and commodities set for further declines before year-end as major central banks continue to tighten aggressively, we see all currencies weakening further against the US dollar through to year-end. Assuming equities then bottom and central banks are allowed to pause, some reversal for AUD/USD next year seems likely.”
-
13:11
ECB' Villeroy: Will raise rates as much as necessary to bring core inflation down
European Central Bank (ECB) policymaker Francois Villeroy de Galhau reiterated on Tuesday that they will raise interest rates as much as necessary to bring core inflation down, as reported by Reuters.
Additional takeaways
"This will have a positive effect on banks’ net income, European banks are hence more solid than feared by some."
"We should go to neutral rate without hesitation, by the end of the year."
"We could start then a second part of the journey, a more flexible and possibly slower one."
"I don’t say that rate hikes will stop there but we will have to comprehensively assess inflation and economic outlook."
"We are no longer gradual, but it is important to remain orderly."
"It means that you neither excessively surprise markets, nor tighten financial conditions too abruptly."
Market reaction
EUR/USD preserves its bullish momentum after these comments and was last seen gaining 0.65% on the day at 0.9888.
-
12:56
S&P 500 Index: Next potential supports at 3500/3460 – SocGen
S&P 500 has resumed its downtrend. Analysts at Société Générale note that the technical outlook denotes prevalence in downward momentum.
Failure to reclaim 3900 can lead to continuation in decline
“Monthly RSI is now close to the lower limit of its bullish territory (near 40 levels); this band has cushioned the declines since 2010. However, signals of a trend reversal are still not visible in price action.”
“Short-term resistance is located at 3860/3900, the 38.2% retracement from August. Failure to reclaim 3900 can lead to continuation in decline.”
“Next potential supports are at projections of 3500/3460 and February 2020 levels of 3393.”
-
12:27
EUR/USD to enjoy a deeper recovery on a break above 0.9945 – BBH
EUR/USD traded as high as 0.9905 today. The pair could rally towards 1.02 on a break past 0.9945, economists at BBH report.
ECB tightening expectations have fallen in recent days
“Break above 0.9945 would set up a deeper recovery to the September 12 high near 1.02.”
“The eurozone reported August PPI. It came in a tick higher than expected at 43.3% YoY vs. a revised 38.0% (was 37.9%) in July. After some relief in May and June, PPI inflation has resumed climbing to new record highs and points to continued upward pressure to CPI. However, ECB tightening expectations have fallen in recent days.”
-
12:16
USD/TRY: Risks remain heavily tilted to the downside for the lira – MUFG
The Turkish lira has remained relatively more stable against the US dollar for most of September. Despite recent stability, the trend remains in favour of a faster sell-off resuming, in the opinion of economists at MUFG Bank.
Lira’s recent resilience unlikely to last
“We do not expect the lira’s recent resilience to last. Turkey’s weak economic fundamentals still favour further lira weakness.”
“The widening current account deficit, elevated inflation, and negative real policy rate remain a recipe for further lira weakness.”
See: USD/TRY will continue to rise gradually for now, breaking above 19 – Credit Suisse
-
11:43
EUR/USD Price Analysis: The hunt for parity
- EUR/USD pushes higher and already surpasses the 0.9900 mark.
- Extra gains now target the key barrier at the parity zone.
EUR/USD advances further and breaks above the key 0.9900 hurdle on turnaround Tuesday.
Considering the ongoing strong rebound, further upside should remain on the table and with the immediate hurdle now at the psychological parity level. Beyond the latter, there is a temporary resistance at the 55-day SMA, today at 1.0033.
In the longer run, the pair’s bearish view should remain unaltered while below the 200-day SMA at 1.0639.
EUR/USD daily chart
-
11:40
RBNZ Preview: Forecasts from eight major banks, hawkish stance warrants 50 bps
The Reserve Bank of New Zealand (RBNZ) will announce its monetary policy decision on Wednesday, October 5 at 01:00 GMT and as we get closer to the release time, here are the expectations as forecast by the economists and researchers of eight major banks.
RBNZ is expected to hike the Official Cash Rate (OCR) by 50 basis points (bps) to 3.50%. Such a hike would mean the central bank hiked policy rates by 50 bps for the fifth meeting in a row. The focus will be on RBNZ’s policy guidance.
ANZ
“We expect the RBNZ will raise the OCR 50 bps to 3.50%. On balance, local data since the August MPS has not brought any large surprises. But global central banks have become a lot more hawkish. We continue to expect OCR to reach a peak at 4.75% by mid-2023.”
Westpac
“We now expect the OCR to reach a peak of 4.5% (previously 4%). This week, the RBNZ is likely to hike by another 50 basis points to 3.5%, and signal further increases ‘at pace’.
TDS
“Employment is above sustainable levels and Q2 GDP handily beat expectations. We think the RBNZ needs to bring the OCR well above 4% to cool demand in line with supply, so as to ease inflation pressures. Markets will watch if the RBNZ retains its forward guidance of tightening ‘at pace’ for any indication of a step down to 25 bps hikes.”
Citibank
“With expectations of further global central bank tightening and New Zealand’s labor market characterized by record-high demand for labor, we expect a 50 bps hike from the RBNZ together with a hawkish statement. A move to 3.50% by the RBNZ this week is likely to be followed by a further 50 bps hike to be delivered on 23 November 2022 and a final 25 bps OCR increase on 22 February 2023 to a terminal rate of 4.25% with rate cuts expected starting Q1 2024.”
Wells Fargo
“We expect the RBNZ to hike rates by 50 bps to 3.50%. Seeing as the RBNZ now expects inflation to remain elevated for longer, we expect additional rate hikes in the months to come until we are closer to the 4% range.”
Danske Bank
“We expect another 50 bps hike to 3.50% in line with consensus.”
NAB
“We expect the MPC to lift the OCR 50 bps, to 3.50%, and sanction the likelihood of another 50 bps, to 4.00% at November’s MPS.”
UOB
“At this RBNZ meeting, we are penciling in a 50 bps hike in the OCR to 3.50%. We believe the RBNZ is on track to hike the OCR to 4.00% by the end of this year, though risks remain skewed towards more rate hikes in 1Q23, and thus an OCR higher than 4%, before the RBNZ pauses in the current tightening cycle.”
-
11:36
USD/CAD recovers early lost ground to sub-1.3600 levels, lacks follow-through
- USD/CAD stages a modest intraday bounce from over a one-week low touched earlier this Tuesday.
- Bullish crude oil prices underpin the loonie and cap the upside amid the prevalent USD selling bias.
- Retreating US bond yields and the risk-on mood continues to dent demand for the safe-haven buck.
The USD/CAD pair reverses an intraday dip to sub-1.3600 levels, or over a one-week low and inches back closer to the daily high during the mid-European session. The uptick, however, lacks follow-through and the pair remains below the mid-1.3600s amid the heavily offered tone surrounding the US dollar.
In fact, the USD Index, which measures the greenback's performance against a basket of currencies, hits a one-and-half-week low amid the ongoing downfall in the US Treasury bond yields. The Bank of England's reaffirmation to buy up to £5 billion of long-dated gilts drags the US Treasury bond yields away from a multi-year top touched last week.
This, along with the risk-on impulse, forces the safe-haven USD to prolong its recent pullback from a two-decade high. Apart from this, bullish crude oil prices, bolstered by expectations for the biggest supply cut by OPEC+ since the 2020 COVID crisis, underpin the commodity-linked loonie and act as a headwind for the USD/CAD pair.
That said, growing acceptance that the Federal Reserve will stick to its aggressive rate hiking cycle could help limit the downside for the greenback. Furthermore, concerns that a deeper global economic downturn will dent fuel demand should cap the black liquid and supports prospects for the emergence of some buying around the USD/CAD pair.
Market participants now look forward to the US economic docket, featuring the release of JOLTS Job Openings and Factory Orders data later during the early North American session. This, along with speeches by influential FOMC members, the US bond yields and the broader risk sentiment, will drive the USD and provide some impetus to the USD/CAD pair.
Technical levels to watch
-
11:32
EUR/NOK: Short-term drivers favour further krone weakness – MUFG
The krone has been one of the worst performing G10 currencies in September resulting in EUR/NOK hitting a fresh year to date high of 10.682. In the view of economists at MUFG Bank, risks are titled to downside for the Norwegian currency.
Lower oil prices undermine NOK
“The renewed sell-off for the krone has coincided with the ongoing hawkish repricing of central bank rate hike expectations. It has triggered a further sell-off in global equity markets that have hit fresh year to date lows as fears over a hard landing for the global economy have intensified.The NOK has been one of the most sensitive G10 currencies this year to the performance of global equity markets.”
“The krone has been undermined as well by the correction lower in the price of oil which has almost reversed all of the gains from the 1H of this year. The developments leave the krone vulnerable to further weakness in the near-term.”
“The Norges Bank’s decision to deliver another 50 bps hike at their latest policy meeting provides only limited support for the krone in current market conditions.”
-
11:30
USD Index Price Analysis: Further decline could revisit 109.35
- DXY exacerbates the losses amidst broad-based risk appetite.
- A deeper retracement could see the weekly low at 109.35 revisited.
DXY adds to the sour start of the week and puts the 111.00 neighbourhood to the test on Tuesday.
In the current context, the continuation of the corrective decline appears likely and with the next target at the weekly low at 109.35 (September 20). The loss of the latter could retest the interim support at the 55-day SMA at 108.61.
The prospects for extra gains in the dollar should remain unchanged as long as the index trades above the 7-month support line near 107.20.
In the longer run, DXY is expected to maintain its constructive stance while above the 200-day SMA at 102.60.
DXY daily chart
-
11:22
EUR/JPY Price Analysis: Above 144.00 comes the 2022 high
- EUR/JPY extends the sharp bounce beyond the 143.00 mark.
- The breakout of 144.04 should open the door to the YTD high.
EUR/JPY remains well bid and trades in multi-session peaks above the 143.00 yardstick on Tuesday.
The continuation of the rebound from last week’s lows remains well in place for the time being. That said, if the cross breaks above the weekly top at 144.04 (September 20), it could then challenge the 2022 peak at 145.63 (September 12).
In the meantime, while above the key 200-day SMA at 135.97, the constructive outlook for the cross should remain unchanged.
EUR/JPY daily chart
-
11:03
AUD/USD to tumble towards 0.61 on a dip under 0.6365 – SocGen
The AUD/USD pair breached July lows of 0.6680 extending the decline towards the lower limit of a steep channel at 0.6365. Analysts at Société Générale highlight the next levels that the aussie could target.
Gradual downtrend could persist while below 0.6680
“July trough of 0.6680 is expected to be a short-term resistance. Holding below this hurdle, the gradual downtrend could persist.”
“Below 0.6365, next potential supports are at projections of 0.6210 and 0.6100, the 76.4% retracement from 2020.”
See – AUD/USD: Little upside scope after dovish RBA – Commerzbank
-
10:54
USD/JPY struggles for a firm direction, remains confined in range below 145.00 mark
- USD/JPY edges higher on Tuesday, though lacks follow-through and remains below the 145.00 mark.
- The Fed-BoJ policy divergence, the risk-on mood undermines the safe-haven JPY and offers support.
- Retreating US bond yields continues to weigh on the USD and caps any meaningful gains for the pair.
The USD/JPY pair extends its consolidative price move on Tuesday and remains confined in a one-week-old trading range, below the 145.00 psychological mark through the first half of the European session.
A big divergence in the monetary policy stance adopted by the Bank of Japan and other major central banks, along with the risk-on impulse, undermines the safe-haven Japanese yen. This, in turn, acts as a tailwind for the USD/JPY pair. That said, a combination of factors is holding back bulls from placing aggressive bets and capping the upside, at least for the time being.
Japan's Finance Minister Shunichi Suzuki said on Monday that the country stands ready to take decisive steps in the foreign exchange market if excessive yen moves persist. This, along with the prevalent selling bias surrounding the US dollar and the narrowing of the US-Japan rate differential, further contributes to keeping a lid on any meaningful gains for the USD/JPY pair.
The Bank of England's reaffirmation to buy up to £5 billion of long-dated gilts drags the US Treasury bond yields away from a multi-year top touched last week. This, in turn, forces the USD to prolong its recent sharp pullback from a two-decade high. That said, expectations for a more aggressive policy tightening by the Fed support prospects for the emergence of some USD dip-buying.
The markets seem convinced that the Fed will continue to hike interest rates at a faster pace to tame inflation and have been pricing in another supersized 75 bps increase in November. The USD bulls, however, await a fresh catalyst before placing bets. Hence, the focus will remain glued to the release of the closely-watched US monthly employment details or the NFP report on Friday.
In the meantime, traders on Tuesday will take cues from the US economic docket, featuring JOLTS Job Openings and Factory Orders data later during the early North American session. This, along with speeches by influential FOMC members and the USD bond yields, will drive the USD demand. Apart from this, the broader risk sentiment should provide some impetus to the USD/JPY pair.
Technical levels to watch
-
10:21
GBP/USD: Buyers could continue to dominate in case 1.1440 resistance fails
GBP/USD advanced to a fresh two-week high above 1.1400 on Tuesday. The pair needs to clear 1.1440 to keep its bullish bias, FXStreet’s Eren Sengezer reports.
Cable needs to clear 1.1440 to extend rally
“On the upside, 1.1440 (200-period SMA) aligns as key resistance. In case buyers flip that level into support, GBP/USD could target 1.1500 (psychological level) and 1.1600 (psychological level).”
“The ascending trend line coming from September 28 aligns as key support at 1.1350 ahead of 1.1300 (psychological level, Fibonacci 61.8% retracement of the latest downtrend) and 1.1225 (100-period SMA).”
-
10:15
Gold Price Forecast: XAU/USD sits near three-week high, above $1,700 amid weaker USD
- Gold gains strong follow-through traction and rallies to a three-week high on Tuesday.
- Retreating US bond yields weighs heavily on the USD and offers support to the metal.
- Bulls shrug off the risk-on impulse, though hawkish Fed expectations could cap gains.
Gold is extending the overnight breakout momentum through the $1,680-$1,685 supply zone and building on its recovery from the lowest level since April 2020. The strong follow-through positive move lifts the XAU/USD to a three-week high, around the $1,710 region during the first half of the European session on Tuesday.
The US dollar retreats further from a two-decade top touched last week and turns out to be a key factor driving flows towards the dollar-denominated commodity. The Bank of England's willingness to buy up to £5 billion of long-dated gilts drags the US bond yields away from a multi-year top and continues to weigh on the greenback.
Apart from this, growing worries about a deeper economic downturn in the US and Europe offer additional support to the safe-haven gold. The fears were further fueled by Monday's disappointing US data, which showed that manufacturing activity grew marginally in September, at its slowest pace in nearly 2-1/2 years.
This, to a larger extent, helps offset the risk-on mood and does little to dent the prevalent bullish sentiment surrounding gold. That said, the prospects for a more aggressive policy tightening by major central banks could act as a headwind for the non-yielding yellow metal and keep a lid on any further gain, at least for now.
Market participants now look forward to the US monthly employment details, scheduled for release on Friday. The popularly known NFP report will play a key role in influencing the Fed's future rate hike path. This, in turn, should help investors to determine the next leg of a directional move for the greenback and gold.
In the meantime, Tuesday's US economic docket features JOLTS Job Openings and Factory Orders data. This, along with speeches by FOMC members and the US bond yields, will drive the USD demand and provide impetus to the XAU/USD. Traders will also take cues from the broader risk sentiment for short-term opportunities around gold.
Technical levels to watch
-
10:04
One further leg higher before any reversal of USD strength – MUFG
The US dollar continued to strengthen sharply in September. Economists at MUFG Bank expect the greenback to remain strong for the rest of the year.
Equity markets to decline further before year-end
“We expect equity markets to decline further before year-end. A full drawdown of between 30% and 35% from the record high in January is feasible if global yields continue to move higher and US dollar strength persists. These conditions worsen the outlook, resulting in earnings downgrades which fuels further asset price declines and further US dollar strength.”
“With the Fed seemingly indifferent to US dollar strength and declining asset prices, it is clear the Fed is content to see tighter financial conditions play a role in driving inflation lower. Hence, we see US dollar appreciation being sustained through Q4 and only once there is a clear sense of the Fed pausing can we expect US dollar momentum to turn. We assume Q1 2023 will see the start of that.”
-
10:02
Saudi Aramco’s CEO: Our expectation is that oil demand will pick up
Amin H. Nasser, CEO of Saudi Aramco, in his latest comments on Tuesday, touches upon the European energy crisis and global oil demand outlook.
Key quotes
The issue for Europe is gas and LNG given lack of spare capacity.
The oil market is focusing on short-term rather than long-term economics.
The oil market is not focusing on tight supply fundamentals.
Oil spare capacity is extremely low, around 1.5% of total supply.
13 mln bpd Saudi production will come in 2027.
It takes 30 days to reach saudi maximum capacity of 12 mln bpd.
Our expectation is that oil demand will pick up.
Having spare oil capacity is not just responsibility of Saudi Arabia.
Market reaction
WTI was last seen trading near daily highs of $83.85, cheering the upbeat remarks from Aramco Chief. The US oil is up 1.10% on the day.
-
10:02
New Zealand: Further tightening expected from the RBNZ – UOB
Economist at UOB Group Lee Sue Ann suggests the RBNZ could hike the OCR by 50 bps at its meeting on October 5.
Key Quotes
“We believe the RBNZ is on track to hike the OCR to 4.00% by the end of this year, though risks remain skewed towards more rate hikes in 1Q23, and thus an OCR higher than 4%, before the RBNZ pauses in the current tightening cycle.”
“At this RBNZ meeting in Oct, we are penciling in a 50bps hike in the OCR to 3.50%.”
-
10:01
European Monetary Union Producer Price Index (YoY) came in at 43.3%, above forecasts (43.2%) in August
-
10:00
European Monetary Union Producer Price Index (MoM) meets expectations (5%) in August
-
09:53
EUR/USD: Recovery looks quite fragile, high risk of a return to 0.95 – ING
EUR/USD is near to smash the critical hurdle of 0.9900. However, economists at ING note that the pair could see a substantial correction at any time.
No idiosyncratic support
“The euro has still failed to show any substantial idiosyncratic bullish push. This is hardly surprising given the still very challenging outlook for the eurozone and elevated uncertainty about the energy crisis heading into the cold months.”
“The EUR/USD recovery is looking quite fragile, which means that any slight dollar recovery could trigger a wider correction in the pair.”
“We still see a high risk of a return to 0.9500 over the coming weeks.”
-
09:45
China: Mixed readings from PMIs in September – UOB
UOB Group’s Economist Ho Woei Chen, CFA, reviews the latest PMI results in the Chinese economy.
Key Takeaways
“China’s official manufacturing PMI released by CFLP unexpectedly rebounded to expansion in Sep but the private sector Caixin manufacturing PMI which tracked smaller private companies fell deeper in contraction.”
“The CFLP non-manufacturing PMI remained in expansion but moderated by a much larger than expected 2.0 points to 50.6 in Sep (Bloomberg est: 52.4; Aug: 52.6). The strengthening in construction index to its highest since Aug 2021 (60.2 from 56.5 in Aug) likely due to the realisation of government’s infrastructure spending failed to offset a sharp decline in the services activity index (48.9 from 51.9 in Aug) which tumbled into contraction for the first time since May this year.”
“Outlook for non-manufacturing sector is likely to remain weak in Oct as well but we see potential for a slight recovery in Nov-Dec as travel restrictions are being lifted after the 20th Party Congress (16 Oct). Further upside can be expected if the borders restrictions are also eased while the rolling in of more infrastructure spendings that were announced earlier could also boost the construction sector.”
“Notwithstanding the improvement in the official manufacturing PMI in Sep, the manufacturing sector could be faced with greater downside risk in the coming months as the environment in the US, Eurozone and UK turns recessionary.”
-
09:42
Spain 12-Month Letras Auction rose from previous 1.408% to 1.962%
-
09:42
Spain 6-Month Letras Auction increased to 1.553% from previous 0.868%
-
09:41
EU economy and single market commissioners call for joint borrowing to deal with energy crisis
The Irish Times carried an editorial opinion piece, citing European Economic Commissioner Paolo Gentiloni and Internal Market Commissioner Thierry Breton, calling for a joint borrowing to deal with the energy crisis.
The EU officials said that the new joint borrowing could be modeled on the joint debt issued during the COVID-19 pandemic to subsidize jobs that would have otherwise been lost.
Market reaction
At the time of writing, EUR/USD is trading at 0.9875, up 0.52% on the day. The shared currency fails to capitalize on the above headlines, retreating from daily highs of 0.9896.
-
09:32
AUD/USD Price Analysis: Intraday recovery falters near mid-0.6500s despite weaker USD
- AUD/USD recovers RBA-inspired losses and climbs to over a one-week high on Tuesday.
- Sustained USD selling bias, the risk-on impulse offers support to the risk-sensitive aussie.
- A one-week-old trading range marks a bearish consolidation phase and warrants caution.
The AUD/USD pair reverses its intraday losses led by the Reserve Bank of Australia's less-than-expected 25 bps rate hike and climbs to over a one-week high during the early part of the European session. The intraday uptick, however, lacks follow-through buying and stalls just ahead of the mid-0.6500s.
The US dollar prolongs its recent sharp corrective pullback from a two-decade high touched last week amid a further slide in the US Treasury bond yields. Apart from this, the risk-on impulse is further weighing on the safe-haven greenback and driving flows towards the risk-sensitive aussie.
Looking at the broader picture, the AUD/USD pair has been oscillating in a narrow trading band over the past week or so. The range-bound price action constitutes the formation of a rectangle on intraday charts and points to indecision among traders over the next leg of a directional move.
Against the backdrop of a sharp fall from the August monthly swing high, the formation might still be categorized as a bearish consolidation phase. Furthermore, technical indicators on the daily chart - though have been recovering from lower levels - are still holding in the bearish territory.
This, in turn, suggests that the path of least resistance for the AUD/USD pair is to the downside and warrants caution for bullish traders. That said, some follow-through buying will negate the bearish bias and set the stage for some meaningful appreciating move in the near term.
The AUD/USD pair might then build on its recent bounce from its lowest level since April 2020 and aim to reclaim the 0.6600 round-figure mark. This is followed by the 0.6620-0.6625 resistance zone, above which a fresh bout of a short-covering move could lift spot prices to the 0.6700 mark.
On the flip side, the post-RBA low, around mid-0.6400s, now seems to protect the immediate downside ahead of the 0.6400 round figure. A convincing break below will make the AUD/USD pair vulnerable to weakening further below the YTD low, around the 0.6365-0.6360 area and test the 0.6300 mark.
AUD/USD 4-hour chart
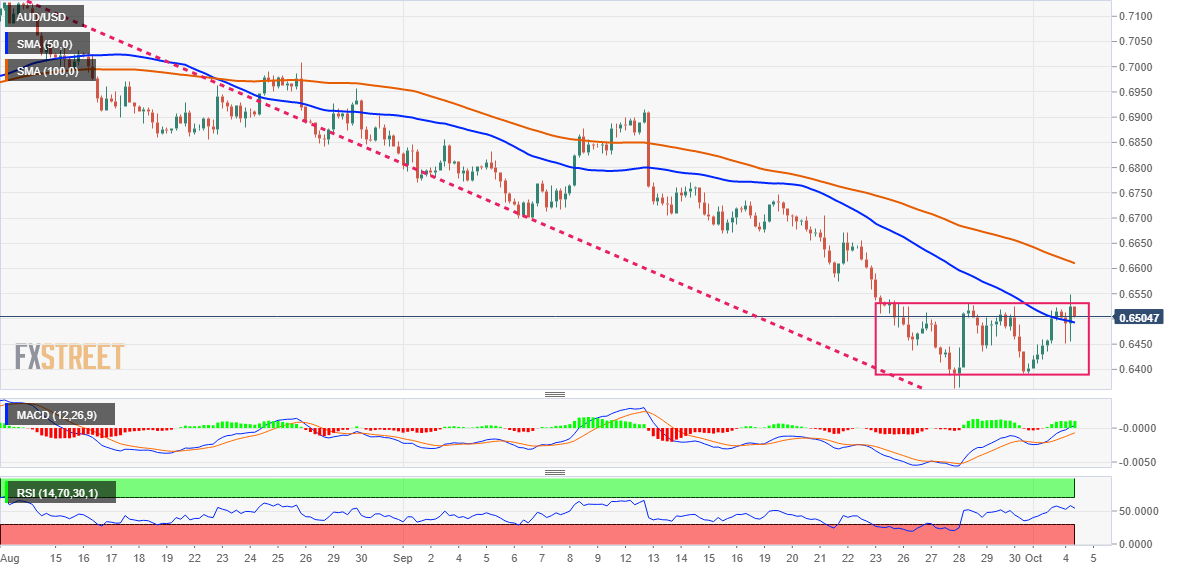
Key levels to watch
-
09:20
EUR/USD: Further weakness before modest recovery in 2023 – MUFG
The euro weakened versus the US dollar in September. Economists at MUFG Bank expect the EUR/USD pair to slump towards 0.90 before staging a recovery next year.
Risks are firmly to the downside in the near-term
“We maintain that over the near-term, the risks are firmly to the downside and we expect a period of further US dollar strength as financial market conditions worsen as asset prices correct further to the downside. This will help push inflation expectations further lower.”
“The key for any broad turn in US dollar strength must be a pause in the tightening cycle. We suspect the Fed will pause after hiking in December which should allow some EUR/USD correction from levels closer to 0.9000.”
-
09:00
Brazil Fipe's IPC Inflation remains at 0.12% in September
-
09:00
EUR/USD appears firmer and approaches 0.9900, looks to Lagarde
- EUR/USD adds to the positive start of the week near 0.9900.
- The dollar continues to shed ground amidst declining yields.
- ECB’s Lagarde participates in an event in Cyprus.
The optimism around the European currency remains well and sound and motivates EUR/USD to flirt with the boundaries of the key barrier at 0.9900 the figure on Tuesday.
EUR/USD up on risk-on mood, looks to Lagarde
EUR/USD adds to Monday’s uptick and approaches the 0.9900 region on the back of the continuation of the sell-off in the dollar and extra improvement in the risk-associated universe. The pair, therefore, enters the second consecutive week with gains after bottoming out near 0.9350 in late September.
The upbeat tone around the pair comes amidst further retracement in the German 10-year bund yields, which already tests the 1.80% region after hitting fresh multi-year peaks around 2.35% during last week.
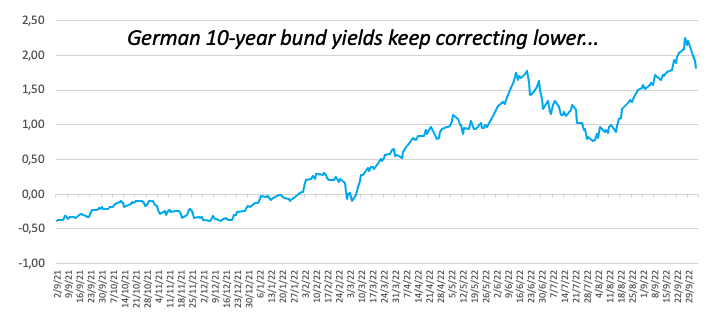
In the docket, Producer Prices in the euro area will be the only release in the domestic calendar seconded by speeches by ECB’s A.Enria, L.De Guindos and C.Lagarde.
Across the Atlantic, Factory Orders will take centre stage, while FOMC’s Logan, Williams, Mester, Jefferson and Daly are all due to speak.
What to look for around EUR
EUR/USD keeps the strong recovery well and sound with the renewed target at the 0.9900 neighbourhood, always against the backdrop of the intense drop in the greenback.
In the meantime, price action around the European currency is expected to closely follow dollar dynamics, geopolitical concerns and the Fed-ECB divergence. The latter has been exacerbated further following the latest rate hike by the Fed and the persevering hawkish message from Powell and the rest of his rate-setters peers.
Furthermore, the increasing speculation of a potential recession in the region - which looks propped up by dwindling sentiment gauges as well as an incipient slowdown in some fundamentals – adds to the sour sentiment around the euro
Key events in the euro area this week: Eurogroup Meeting, Germany, EMU Final Manufacturing PMI (Monday) – ECB Lagarde (Tuesday) – Germany Balance of Trade, EMU, Germany Final Services PMI (Wednesday) – Germany Construction PMI, EMU Retail Sales, ECB Accounts (Thursday) – Germany Retail Sales (Friday).
Eminent issues on the back boiler: Continuation of the ECB hiking cycle. Italian post-elections developments. Fragmentation risks amidst the ECB’s normalization of its monetary conditions. Impact of the war in Ukraine and the persistent energy crunch on the region’s growth prospects and inflation outlook.
EUR/USD levels to watch
So far, the pair is gaining 0.47% at 0.9870 and the breakout of 1.0032 (55-day SMA) would target 1.0050 (weekly high September 20) en route to 1.0197 (monthly high September 12). On the other hand, the next support appears at 0.9535 (2022 low September 28) ahead of 0.9411 (weekly low June 17 2002) and finally 0.9386 (weekly low June 10 2002).
-
08:58
The medium-term story remains USD-positive – ING
US Dollar Index (DXY) has dropped nearly 3.0% since last week's highs. But in the view of economists at ING, dollar correction should not have legs.
Correction not very sustainable
“The US domestic story remains rather solid, leaving the Fed tightening prospects alive even if markets have recently revised the expected terminal rate to sub 4.50% levels. We see Friday’s payrolls report as a potential trigger for a fresh hawkish re-pricing, and a positive event for the dollar.”
“There is still a long way to go for European assets to regain the market’s favour given the energy crisis and concerning geopolitical developments, so we continue to see any dollar contraction driven by a recovery in European sentiment as likely short-lived.”
“We think the DXY downtrend will soon run out of steam, and some stronger support may already emerge at the 111.00 level.”
“We struggle to see the macroeconomic justification for an extension of the drop below 110.00 at the moment.”
-
08:46
USD/CNY set to move gradually downward over coming months – MUFG
The Chinese yuan depreciated by 3% against the US dollar in September. Downward pressure on CNY is set to remain for the rest of this year but the USD/CNY is set to reverse back lower in 2023, economists at MUFG Bank report.
USD/CNY may remain volatile in the near-term
“While USD/CNY may remain volatile in the near term and supported from the Fed’s rate hiking process, we expect moderately improved sentiment to warrant a slightly stronger CNY.”
“We expect USD/CNY to reach 7.0500 in Q4 2022, 6.9500 in Q1 2023, 6.8500 in Q2 2023 and 6.7500 in Q3 2023.”
-
08:45
Forex Today: Dollar selloff picks up steam as risk flows dominate
Here is what you need to know on Tuesday, October 4:
Risk flows continue to dominate the financial markets early Tuesday and the dollar is having a difficult time finding demand with the US Dollar Index trading at its lowest level in over a week and pushing lower toward 111.00. Eurostat will release the Producer Price Index (PPI) data for August. Later in the day, August Factory Orders and JOLTS Job Openings will be featured in the US economic docket. Cleveland Fed President Loretta Mester and NY Fed President John Williams are scheduled to deliver speeches during the American trading hours.
Wall Street's main indexes opened decisively higher and registered impressive gains on Monday after the ISM Manufacturing PMI survey showed that price pressure continued to ease in the manufacturing sector and employment contracted modestly. According to the CME Group FedWatch Tool, the probability of one more 75 basis points (bps) Fed rate hike in November declined to 50% after this report. The benchmark 10-year US Treasury bond yield is down over 2% on the day after having declined 5% on Monday.
Meanwhile, reports suggesting that OPEC+ could reduce oil output by more than 1 million barrels per day provided a boost to crude oil prices and the barrel of West Texas Intermediate (WTI) gained 5% on Monday before settling above $83.
During the Asian trading hours on Tuesday, the Reserve Bank of Australia (RBA) announced that it hiked its policy rate by 25 bps to 2.6% from 2.35%, compared to market expectation for a 50 bps rate increase. In its policy statement, the RBA reiterated that the size and timing of future rate rises will be determined by the data and outlook for inflation and the labor market. Although the initial reaction caused the AUD to weaken against its rivals, AUD/USD regained its traction as the RBA's policy action allowed the market mood to remain upbeat. As of writing, the pair was up 0.3% on the day at 0.6535.
RBA: Size, timing of future rate rises will be determined by the data and outlook for inflation, labor market.
EUR/USD capitalized on the broad-based dollar weakness and climbed to its highest level since September 22 near 0.9900 early Tuesday.
GBP/USD extended its rally on Tuesday and was last seen trading above 1.1400, rising nearly 1% on the day. On Monday, the pair gained 200 pips following the UK government's decision to reverse its plan to scrap the 45% rate of income tax for the highest earners.
Gold registered impressive gains on Monday and continued to push higher after having cleared $1,700. XAU/USD was last seen rising 0.6% on the day at $1,710.
USD/JPY lost its bullish momentum after having climbed above 145.00 on Monday and ended up closing the day in negative territory. As of writing, USD/JPY was virtually unchanged on the day at 144.55.
Bitcoin benefited from the improving risk mood and rose 3% on Monday. BTC/USD holds its ground early Tuesday and continues to edge higher toward $20,000. Ethereum is already up 5% since the beginning of the week but continues to trade below $1,400.
-
08:44
USD/CNH now looks consolidative between 7.0500 and 7.2200 – UOB
Further side-lined trading is predicted in USD/CNH, likely within the 7.0500-7.2200 range in the next few weeks, comment FX Strategists at UOB Group Lee Sue Ann and Quek Ser Leang.
Key Quotes
24-hour view: “We expected USD to ‘consolidate and trade within a range of 7.1050/7.1700’ yesterday. Our view was incorrect as USD dropped sharply to 7.0901 in NY trade before rebounding. Despite the rebound, the underlying tone appears to be soft. That said, any further weakness in USD is likely limited to a test of 7.0800. Resistance is at 7.1270, followed by 7.1500.”
Next 1-3 weeks: “There is no change in our view from last Friday (30 Sep, spot at 7.1000). As highlighted, the recent USD rally has topped out for now. The current movement is likely the early stages of a consolidation phase. In view of the recent high volatility, USD could trade within a broad range of 7.0500/7.2200 for a period of time.”
-
08:42
GBP/USD climbs to two-week high, retakes 1.1400 and beyond amid sustained USD selling
- GBP/USD gains traction for the sixth straight day and climbs to a two-week high.
- The UK government’s U-turn on scraping higher tax rates continues to lift sterling.
- The USD extends its recent sharp retracement slide and offers additional support.
The GBP/USD pair attracts some dip-buying near the 1.1280 region and turns positive for the sixth successive day on Tuesday. The momentum lifts spot prices to a two-week high, back above the 1.1400 mark during the early European session and is sponsored by a combination of factors.
The UK government's U-turn to reverse a controversial tax cut plan announced in its mini-budget last week continues to underpin the British pound. The US dollar, on the other hand, extends its recent sharp pullback from a two-decade high amid the ongoing downfall in the US Treasury bond yields and offers additional support to the GBP/USD pair.
The Bank of England reaffirmed its willingness to buy up to £5 billion of long-dated gilts and dragged the US Treasury bond yields further away from a multi-year top touched last week. Apart from this, the prevalent risk-off mood - as depicted by a strong rally across the global equity markets - is seen as another factor weighing on the safe-haven buck.
With the latest leg up, the GBP/USD pair confirms a breakout through a nearly two-month-old descending trend-line resistance. This might have already set the stage for an extension of the recent recovery from an all-time low touched last Monday. In the absence of any macro data from the UK, spot prices remain at the mercy of the USD price dynamics.
Later during the early North American session, traders will take cues from the US economic docket - featuring the release of JOLTS Job Openings and Factory Orders data. This, along with speeches by FOMC members, the US bond yields and the broader risk sentiment, will drive the USD demand and provide some meaningful impetus to the GBP/USD pair.
Technical levels to watch
-
08:20
GBP/USD: Levels above 1.10 are unsustainable – ING
GBP/USD has neared the 1.14 level. Nonetheless, economists at ING believe that the currency is unsustainable.
Downside risks remain elevated
“Cable has climbed back to the levels it was trading at before the mini-Budget announcement, but we struggle to see the current rally as sustainable.”
“We think the pound continues to face very significant downside risks as the large twin deficit, low market confidence in the new government and a grim outlook for Europe heading into winter all point to the unsustainability of 1.10+ levels in GBP/USD.”
-
08:09
USD/JPY: Downward trend to start in 2023 – MUFG
USD/JPY remains top-heavy just below 145. Economists at MUFG Bank expect the pair to remain supported for now. The yen is set to star its recovery next year.
Dynamics driving yen weaker will ease in 2023
“It is hard to see a turn in USD/JPY now even after intervention by the MoF.”
“The Fed and global central banks have more tightening to do while the BoJ does nothing but ease. But we suspect the Fed should be in a position to pause after December’s hike while the terms of trade shock for Japan should subside next year and could coincide with a shift of some sort by the BoJ – all factors that will help the yen recover.”
-
08:06
Silver Price Analysis: XAG/USD seems poised to appreciate further, could aim to test 200 DMA
- Silver extends the overnight breakout momentum and climbs to the $21.00 neighbourhood.
- The set-up favours bulls and supports prospects for an extension of the appreciating move.
- Any meaningful corrective slide would be seen as a buying opportunity and remains limited.
Silver builds on the previous day's strong move up and gains traction for the third successive day on Tuesday. This also marks the fifth day of a positive move in the previous six and lifts the white metal to the $21.00 mark, or its highest level since late June during the early European session.
The overnight sustained breakout through a nearly four-month-old descending trend-line resistance and the $20.00 psychological mark, or the 100-day SMA was seen as a fresh trigger for bullish traders. Given that technical indicators on the daily chart are still far from being in the overbought zone, the set-up supports prospects for an extension of the appreciating move for the XAG/USD.
Some follow-through buying beyond the $21.00 round figure will reaffirm the positive outlook and allow bulls to challenge the very important 200-day SMA. The latter is currently pegged just ahead of the $22.00 mark, above which the XAG/USD could climb towards the next relevant resistance near the $22.40 region. The momentum could further get extended towards the $23.00 round-figure mark.
On the flip side, the $20.80-$20.75 zone now seems to protect the immediate downside. Any subsequent pullback is more likely to attract fresh buying and remain limited near the $20.00 mark, or the 100-day SMA. This is followed by the descending trend-line resistance breakout point, around the $19.55 region, which should now act as a strong base for the XAG/USD and a key pivotal point.
Silver daily chart
-638004639520498819.png)
Key levels to watch
-
08:02
Spain Unemployment Change: 17.679K (September) vs previous 40.428K
-
07:46
US Dollar Index: Defending 107.60 is crucial to avert a phase of decline – SocGen
The US Dollar Index (DXY) extends its decline to 111.00. Holding above 107.60 is critical to avoid a deeper fall, economists at Société Générale report.
Uptrend is slowly becoming overstretched
“A pullback is underway, however, 110.80/110.40, the 61.8% retracement of the last bout of up move is expected to be first layer of support.”
“Beyond 114.80, next potential hurdles are located at 117 and graphical levels of 121 consisting of 2001/2002 peaks.”
“It is worth noting that monthly RSI is at the best levels since 2015. This denotes the uptrend is slowly becoming overstretched.”
“Daily channel band at 107.60 is an important level. Defending this would be crucial to avert a phase of decline.”
-
07:33
Gold Price Forecast: XAU/USD to race higher on a weak NFP ahead of the weekend
Gold recorded its best week since mid-August. ISM PMI surveys and the September jobs report will be featured in the US economic docket. FXStreet’s Eren Segenzer analyzes how XAU/USD could react to the data.
Significant deceleration in service sector inflation likely to hurt the USD
“On Wednesday, the ISM will release the Services PMI report. Price pressures were relatively strong in the service sector in August with the Prices Paid Index arriving at 71.5. A significant deceleration in the service sector inflation is likely to hurt the dollar and vice versa.”
“On Friday, the US Bureau of Economic Analysis will publish the September jobs report. Nonfarm Payrolls are expected to rise by 250K following August’s increase of 315,000. Investors could see a weaker-than-forecast NFP growth as an excuse to sell the dollar and open the door for bullish action in XAU/USD ahead of the weekend. On the flip side, market participants could look to add to their dollar longs if the NFP increases at a stronger pace than projected.”
See – Gold Price Forecast: XAU/USD to suffer more if NFP strengthens the dollar next week – Commerzbank
-
07:31
USD/CAD slips below 1.3600 mark amid rising oil prices, modest USD weakness
- A combination of factors drags USD/CAD to over a one-week low on Tuesday.
- Bullish oil prices underpin the loonie and exert pressure amid a weaker USD.
- Retreating US bond yields, the risk-on impulse continues to weigh on the buck.
The USD/CAD pair adds to the previous day's heavy losses and remains under some selling pressure for the second successive day on Tuesday. Spot prices drop to over a one-week low during the early European session, with bears now looking to extend the downward trajectory further below the 1.3600 round-figure mark.
Crude oil prices remain supported by expectations for the biggest supply cut by OPEC+ since the 2020 COVID crisis and continue to underpin the commodity-linked loonie. This, along with the prevalent US dollar selling bias, acts as a headwind for the USD/CAD pair and supports prospects for an extension of the corrective pullback from the highest level since May 2020.
The Bank of England's reaffirmation to buy up to £5 billion of long-dated gilts drags the US Treasury bond yields away from a multi-year top touched last week. Apart from this, the risk-on impulse - as depicted by a strong follow-through rally in the US equity markets - further seems to weigh on the safe-haven buck, though hawkish Fed expectations could limit losses.
Investors seem convinced that the US central bank will stick to its aggressive rate hiking cycle to tame inflation and have been pricing in another supersized 75 bps increase in November. The bets were reaffirmed by recent hawkish remarks by several Fed officials. This, in turn, favours the USD bulls and could offer some support to the USD/USD pair, at least for now.
Furthermore, market participants remain concerned that a deeper global economic downturn will dent fuel demand. This might keep a lid on any strong gains for the black liquid and further contribute to limiting the downside for the USD/CAD pair. This makes it prudent to wait for strong follow-through selling before confirming that spot prices have formed a near-term top.
Market participants now look forward to the US economic docket, featuring the release of JOLTS Job Openings and Factory Orders data later during the early North American session. This, along with speeches by FOMC members, the US bond yields and the broader risk sentiment, will drive the USD demand and provide some impetus to the USD/CAD pair. Traders will further take cues from oil price dynamics to grab short-term opportunities around the major.
Technical levels to watch
-
07:29
AUD/USD: Little upside scope after dovish RBA – Commerzbank
The Reserve Bank of Australia (RBA) raised its key rate by 25 basis points (bps). The AUD/USD weakened following the dovish surprise. Analysts at Commerzbank expect the pair to struggle to gain some ground.
RBA does not deliver
“The RBA only hiked its key rate by 25 bps. However, the decision did not come as a complete surprise as the RBA had sounded more dovish recently thus preparing the market for the possibility of a reduction in the speed of the rate hikes.”
“AUD came under depreciation pressure, but the move was quite moderate. Moreover, the RBA has demonstrated its willingness to tighten monetary policy further. That means the end of the rate hike cycle does not yet seem to have been reached.”
“With a view to today’s RBA decision AUD is likely to struggle making ground against USD again though, in particular while the US central bank sticks to its hawkish rhetoric. As a result, we currently see little upside scope in AUD.”
-
07:24
Downside risks continue to dominate sterling – Commerzbank
The British Treasury Secretary Kwasi Kwarteng announced on Monday that the top tax rate of 45% was not going to be scrapped after all. Sterling reacted positively to the news. However, economists at Commerzbank expect the GBP to remain under pressure.
Scepticism about sterling
“One could merely deduct that the fact that Kwarteng reacted to the pressure of the financial markets was appreciated by them. Perhaps there is speculation that this is only the beginning and that he will make further concessions. However, that is probably a relatively optimistic view, as it seems that Kwarteng was mainly interested in keeping face after huge criticism for the top tax rate plans emerged even from within his own party.”
“At least Kwarteng announced that he would bring forward a detailed presentation of his fiscal plans. It is difficult to imagine though that he will be able to convince the financial markets of the sustainability of British state finances if he largely sticks to his tax cut and spending plans.”
“Against this background, we remain sceptical about sterling. In our view, the downside risks continue to dominate.”
-
07:23
AUD/USD to continue weaking in the coming months – Danske Bank
The Reserve Bank of Australia (RBA) Board has delivered a dovish surprise at its October meeting. AUD/USD moved sharply lower following the decision and economists at Danske Bank expect the pair to weaken over the coming months.
Recent tightening in financial conditions to constrain economic activity with a lag
“The RBA surprises dovish by hiking rates by only 25 bps. Consensus was looking for another 50 bps hike, while market was split between 25 and 50.”
“While Australian inflation remains clearly above target and labour market conditions are still historically tight, RBA emphasized the weakening global growth outlook as a key reason to slow the pace of hikes back to 25 bps.”
“Market's longer-term inflation expectations have moderated, and RBA sees that the recent tightening in financial conditions will continue to constrain economic activity with a lag.”
“We see risks tilted towards further AUD weakening on a 12M horizon.”
-
07:13
Gold Price Forecast: XAU/USD to extend its recovery momentum in a fantastic start to the week
Gold price is treading water near two-week highs. XAU/USD could see more gains as the critical 21-Daily Moving Average (DMA) at $1,680 is reclaimed and the Relative Strength Index (RSI) flips bullish, FXStreet’s Dhwani Mehta reports.
Has the tide turned against XAU/USD bears?
“Gold price defied the bearish odds and jumped above the descending 21 DMA at $1,680, closing Monday above that level. This has affirmed a bullish bias, especially after the 14-day RSI swung into positive territory for the first time since August 16.”
“Bulls need to clear daily highs to challenge the flattish 50 DMA at $1,724. Ahead of that, the September 14 high at $1,707 could test bearish commitments.”
“On the downside, the 21 DMA is seen as crucial support, below which the rising trendline support at $1,667 will offer some cushion to bulls. Further down, the $1,660 support area will be a tough nut to crack for bears.”
-
07:12
USD Index loses the grip and drops to 111.30 ahead of data, Fedspeak
- The index remains under pressure near the 111.30 zone.
- Improved sentiment in the risk complex weighs on the dollar.
- Factory Orders, Fedspeak next of note in the NA session.
The USD Index (DXY), which gauges the greenback vs. a basket of its main competitors, accelerates the downside and revisits the 111.35/30 band on turnaround Tuesday.
USD Index looks to data, Fed speakers
The index keeps the pessimism unchanged in the first half of the week and now flirts with multi-session lows in the 111.30 region on the back of the persistent improvement in the riskier assets.
Further weakness in the dollar is also accompanied by another daily pullback in US yields across the curve, which remain within a corrective move after hitting multi-year peaks during last week.
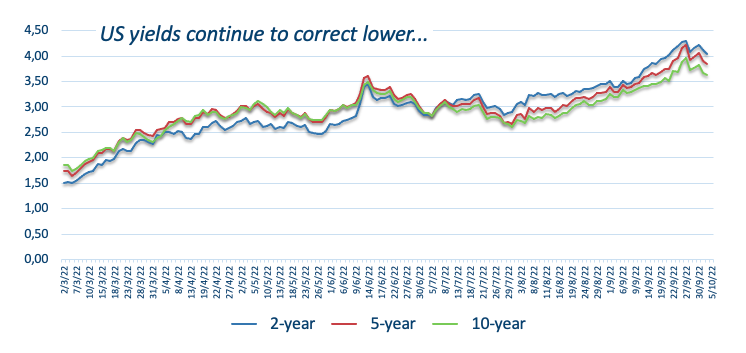
In the US data space, Factory Orders for the month of August will be the sole release of note seconded by speeches by Dallas Fed L.Logan (2023 voter, centrist), NY Fed J.Williams (permanent voter, centrist), Cleveland Fed L.Mester (voter, hawk), FOMC Governor P.Jefferson (permanent voter, centrist) and San Francisco Fed M.Daly (2024 voter, hawk).
What to look for around USD
The index keeps suffering the better tone in the risk complex and already tests the 111.50 region.
Propping up the dollar’s underlying positive stance appears the firmer conviction of the Federal Reserve to keep hiking rates until inflation looks well under control regardless of a likely slowdown in the economic activity and some loss of momentum in the labour market.
Looking at the more macro scenario, the greenback also appears bolstered by the Fed’s divergence vs. most of its G10 peers in combination with bouts of geopolitical effervescence and occasional re-emergence of risk aversion.
Key events in the US this week: Factory Orders (Tuesday) – MBA Mortgage Applications, ADP Employment Change, Balance of Trade, Final Services PMI, ISM Non-Manufacturing (Wednesday) – Initial Jobless Claims (Thursday) – Nonfarm Payrolls, Unemployment Rate, Consumer Credit Change, Wholesale Inventories (Friday).
Eminent issues on the back boiler: Hard/soft/softish? landing of the US economy. Prospects for further rate hikes by the Federal Reserve vs. speculation of a recession in the next months. Geopolitical effervescence vs. Russia and China. US-China persistent trade conflict.
USD Index relevant levels
Now, the index is down 0.23% at 111.40 and a breach of 109.35 (weekly low September 20) would open the door to 107.68 (monthly low September 13) and finally 107.58 (weekly low August 26). On the other hand, the next up barrier comes at 114.76 (2022 high September 28) seconded by 115.00 (round level) and then 115.32 (May 2002 high).
-
07:09
NZD/USD aims to test weekly highs at 0.5750 ahead of RBNZ policy
- NZD/USD is eyeing to test the weekly highs at 0.5750 as the RBNZ is expected to sound hawkish.
- A fifth consecutive 50 bps rate hike is expected by the RBNZ to continue the fight against inflation.
- The DXY is declining towards 111.00 amid lower projections for the US NFP data.
The NZD/USD pair has bounced back sharply after dropping to near 0.5682 in the Tokyo session. The asset is broadly oscillating in a 0.5680-0.5726 range and is expected to deliver an upside break of the same. A north-side explosion will drive the asset towards weekly highs at around 0.5750. Weaker performance from the US dollar index (DXY) and soaring hawkish Reserve Bank of New Zealand (RBNZ) bets are strengthening the kiwi bulls.
Wednesday’s monetary policy decision by the RBNZ is going to provide a decisive move to the antipodean. RBNZ Governor Adrian Orr is expected to announce a 50 bps rate hike consecutively for the fifth time.
The inflationary pressures in the kiwi region have not cooled down yet, therefore, scaling down the ‘hawkish’ tone won’t be a fruitful option. An announcement of the fifth 50 bps rate hike will push the Official Cash Rate (OCR) to 3.5%.
Meanwhile, the DXY has printed a fresh weekly low at 111.44 in the early European session. The DXY is eyeing more weakness towards 111.00. Investors are dumping the DXY ahead of the US Nonfarm Payrolls (NFP) data.
As expected, the US economy created 250k jobs in September, lower than the August reading of 315k. The US economy has been maintaining full employment levels, therefore, space for generating more employment is extremely less. Adding to that, the escalating Federal Reserve (Fed)’s interest rates are also restricting the corporate to continue their hiring programs with sheer pace.
-
07:07
GBP/USD: Downtrend to persist so long as holds below 1.1760/1.1840 – SocGen
GBP/USD has formed a low near 1.0350 and a bounce is taking shape. But the downtrend is set to persist while cable remains below 1.1760/1.1840, analysts at Société Générale report.
Consolidation phase is on the cards
“After recent sharp up/down swings, a phase of consolidation is not ruled out.”
“Lower limit of the range since 2016 at 1.1760/1.1840 is expected to an important resistance zone near term. Holding below this hurdle, the downtrend could persist.”
“Failure to hold recent higher trough at 1.0550 can lead to one more leg of downtrend towards 1.0350 and next projections at 1.0140/1.0000.”
-
06:52
AUD/USD sticks to RBA-inspired losses, holds above mid-0.6400s amid risk-on impulse
- AUD/USD meets with some supply after RBA hikes interest rates by 25 bps on Tuesday.
- A modest USD uptick further exerts some pressure, though the downside seems limited.
- Retreating US bond yields, the risk-on impulse seems to cap the buck and offers support.
The AUD/USD pair comes under fresh selling pressure on Tuesday and erodes a part of the previous day's strong gains. The pair maintains its offered tone through the early European session and is currently placed near the lower end of its daily trading range, just above mid-0.6400s.
The Australian dollar reacts negatively to the Reserve Bank of Australia's (RBA) decision to slow the pace of policy tightening and raise interest rates by 25 bps against expectations for a 50 bps hike. This, along with a modest US dollar uptick, exerts downward pressure on the AUD/USD pair. The downside, however, seems limited, at least for the time being, warranting some caution for bearish traders.
In the accompanying monetary policy statement, the Australian central bank said that it expects to keep raising interest rates this year as inflation is trending well above the target range. Furthermore, RBA Governor Philip Lowe noted that inflation is likely to rise in the coming months and end the year at about 7.75%. This, along with a tight labour market, gives the RBA more space to tighten further.
The USD, on the other hand, has been struggling to gain any meaningful traction amid the ongoing fall in the US Treasury bond yields. Apart from this, the risk-on impulse - as depicted by a strong follow-through rally in the US equity futures - acts as a headwind for the safe-haven greenback. This, in turn, offers some support to the risk-sensitive aussie and helps limit losses for the AUD/USD pair.
Market participants now look forward to the US economic docket - featuring JOLTS Job Openings and Factory Orders data. This, along with speeches by FOMC members and the US bond yields, will influence the USD and provide some impetus to the AUD/USD pair. Traders will further take cues from the broader market risk sentiment to grab short-term opportunities around the major.
Technical levels to watch
-
06:48
Asian Stock Market: Nikkei soars on positive market mood, DXY turns subdued, oil eyes $85.00
- Asian stocks are following the footprints of S&P500 amid soaring market mood.
- Japanese investors have shrugged off uncertainty over escalating Japan-North Korea tensions.
- Oil prices are marching towards $85.00 ahead of the OPEC+ meeting on production cuts.
Markets in the Asian domain have surged firmly following the footprints of Wall Street. S&P500 displayed a stellar performance on Monday as the US dollar index (DXY) shifted into a negative trajectory. The DXY is hovering around weekly lows at 111.47 and is expected to surrender the same sooner.
At the press time, Japan’s Nikkei225 soared 2.80%. Meanwhile, Chinese markets are closed for the entire week and Hong Kong markets are closed for today on account of the Double Ninth festival.
Japanese markets are displaying a stellar performance despite the ongoing Japan-North Korea tensions after North Korea tests ballistic missiles near the Japanese region.
In retaliation to that, Japan's Prime Minister Fumio Kishida cited the launch as ‘violent behavior’. While Japan’s defense minister Yasukazu Hamada has cleared that Tokyo would not rule out any options to strengthen its defenses including "counterattack capabilities", reported BBC news.
Outside Tokyo, the Reserve Bank of Australia (RBA) hiked its Official Cash Rate (OCR) by 25 basis points (bps). As per the estimates, RBA Governor Philip Lowe was expected to hike OCR by 50 bps consecutively for the fifth time. It seems that the RBA has preferred to keep along with the growth projects along with fighting the mounting inflation.
On the oil front, oil prices are expected to hit the critical hurdle of $85.00 as expectations for production cuts announcement by OPEC+ are soaring. In order to stabilize the oil prices, the oil cartel will trim its production cuts. The announcement is majorly expected to delight Russia as the nation is offering oil at cheaper rates to countries like India and China.
-
06:31
Australia RBA Commodity Index SDR (YoY) rose from previous 21.7% to 30.6% in September
-
06:19
USD/JPY: No changes to the range bound theme – UOB
In the opinion of FX Strategists at UOB Group Lee Sue Ann and Quek Ser Leang, USD/JPY remains poised to extend the 143.50-145.60 range for the time being.
Key Quotes
24-hour view: “We highlighted yesterday that ‘Further sideway-trading would not be surprising but in view of the slightly firmed underlying tone, USD is likely to trade within a higher range of 144.30/145.20’. USD subsequently rose briefly to 145.20 in Asian trade, dropped to 144.14 during early NY hours before rebounding to close at 144.53 (-0.15%). The overall price actions still appear to be part of sideway-trading phase and we expect USD to trade between 144.20 and 145.15 for today.”
Next 1-3 weeks: “There is not much to add to our update from yesterday (03 Oct, spot at 144.70). As highlighted, the recent build-up in momentum has faded. The current movement appears to be part of a consolidation phase and USD is likely to trade between 143.50 and 145.60.”
-
06:16
USD/JPY juggles below 145.00, Japan-North Korea tensions escalate on ballistic missiles test
- USD/JPY is oscillating below 145.00 as the focus has shifted to US ISM Services PMI data.
- More development on the Japan-North Korea tension story will display the forward outlook.
- The headline Tokyo CPI slipped to 23.8% while the core catalyst improved to 1.7%.
The USD/JPY pair is displaying a lackluster performance after picking bids to near 144.40 in the Tokyo session. For the past week, the asset is displaying back-and-forth moves in a 144.00-145.35 range amid the unavailability of a potential trigger. The investing community is aware of the fact that the US dollar index (DXY) is auctioning in a negative trajectory for the past week, however, the USD/JPY asset has remained sideways, which indicates that the yen bulls are extremely weak.
The yen bulls are expected to weaken further amid escalating Japan-North Korea tensions as North Korean leader Kim Jong-un is firing ballistic missiles over Japan. The attack was near the Japanese region, which forced the administration to make security alerts and urged households to take shelter.
In retaliation to that, Japan's Prime Minister Fumio Kishida cited the launch as ‘violent behavior’. While Japan’s defense minister Yasukazu Hamada has cleared that Tokyo would not rule out any options to strengthen its defenses including "counterattack capabilities", reported BBC news.
In early Asia, Tokyo Consumer Price Index (CPI) data didn’t make much impact on the major. The headline CPI remained lower at 2.8% than the projections of 3.0% and the prior release of 2.9%. While the core CPI that excludes food and energy escalated to 1.7% vs. the expectations of 1.5% and the prior print of 1.4%.
Meanwhile, the US dollar index (DXY) is awaiting the release of the US ISM Services PMI data. The economic data is seen lower at 56 vs. the previous reading of 56.9. Also, the New Orders Index data will trim significantly to 58.9 against the prior release of 61.8.
-
06:15
Natural Gas Futures: Scope for a deeper correction
Open interest in natural gas futures markets resumed the uptrend and rose by nearly 11K contracts at the beginning of the week according to preliminary readings from CME Group. In the same line, volume advanced for the second session in a row, this time by around 24.1K contracts.
Natural Gas now targets $6.00
Natural gas started the new month on the defensive amidst rising open interest and volume, exposing further weakness in the very near term and with a potential drop to the $6.00 mark per MMBtu now on the cards.
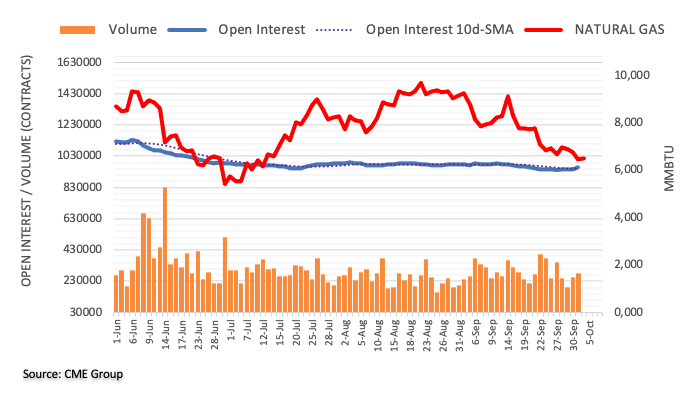
-
06:07
NZD/USD now points to some consolidation – UOB
NZD/USD is now expected to navigate within the 0.5610-0.5810 range for the time being, note FX Strategists at UOB Group Lee Sue Ann and Quek Ser Leang.
Key Quotes
24-hour view: “Our expectations for the ‘sharp drop in NZD to extend’ were incorrect as it soared to a high of 0.5730. The rapid advance appears to be running ahead of itself and while there is room for NZD to test 0.5750, a sustained rise above this level is unlikely. The major resistance at 0.5810 is not expected to come into the picture. On the downside, a breach of 0.5670 (minor support is at 0.5695) would indicate that the current upward pressure has eased.”
Next 1-3 weeks: “Following the sharp decline in NZD to 0.5592 last Friday, we highlighted in our update yesterday (03 Oct, spot at 0.5620) that ‘downward momentum has not improved by much and NZD has to break clearly below 0.5565 before further sustained decline is likely’. That said, we did not expect the robust rebound that sent NZD to a high of 0.5730. The breach of our ‘strong resistance’ level at 0.5715 indicates that the 3-week weakness in NZD has stabilized. We view the current price movements as the early stages of a consolidation phase and we expect NZD to trade between 0.5610 and 0.5810 for now.”
-
06:03
Crude Oil Futures: Extra upside could lose some traction
Considering advanced prints from CME Group for crude oil futures markets, open interest remained choppy and shrank by just 875 contracts on Monday. Volume, instead, reversed two consecutive daily drops and increased by around 147.8K contracts.
WTI: Next on the upside comes $90.00 and above
Monday’s strong uptick in prices of the WTI came in tandem with a small drop in open interest, which could remove some strength from the bullish attempt. In the meantime, the continuation of the bounce is expected to meet the next hurdle at the September high at $90.37 (September 5).
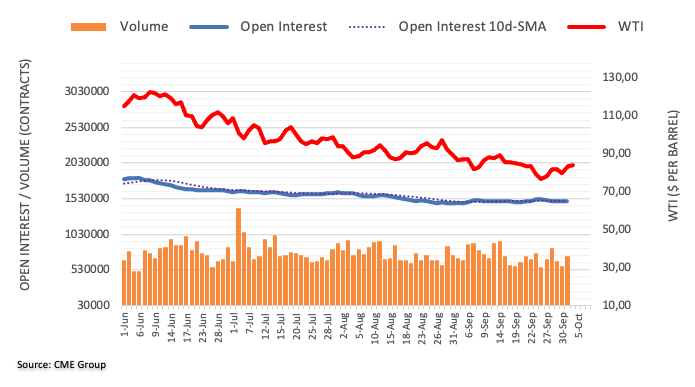
-
05:55
GBP/USD could now revisit 1.1450 – UOB
Following the sharp rebound, GBP/USD could now extend the rebound to 1.1450 in the next weeks, suggest FX Strategists at UOB Group Lee Sue Ann and Quek Ser Leang.
Key Quotes
24-hour view: “The strong surge in GBP that sent it to a high of 1.1333 came as a surprise (we were expecting GBP to trade sideways). While overbought, the advance is not showing any sign of easing just yet. In other words, GBP could continue to rise even though the chance of a break of 1.1400 is not high (next resistance is at 1.1450). Support is at 1.1260 but only a breach of 1.1215 would indicate that the current upward pressure has eased.”
Next 1-3 weeks: “Last Friday (30 Sep, spot at 1.1150), we indicated that the recent weakness in GBP has bottomed and we held the view that the strong rebound could extend but is unlikely to challenge 1.1300. However, the rebound in GBP took out 1.1300 yesterday as it rose to a high of 1.1333 before closing on a strong note at 1.1325 (+1.43%). Short-term conditions are overbought but upward momentum still appears to be firm and the rebound in GBP could extend further to 1.1450. Overall, only a breach of 1.1000 (‘strong support’ level was at 1.0800 yesterday) would indicate that GBP is unlikely to rebound further.”
-
05:50
Gold Futures: Scope for extra gains
CME Group’s flash data for gold futures markets showed traders added nearly 6K contracts to their open interest positions following two consecutive daily pullbacks on Monday. Volume followed suit and went up by around 42.2K contracts, also reversing two straight daily drops.
Gold now targets $1,735
Gold prices extended the rebound and flirted with the key $1,700 barrier at the beginning of the week. The uptick was on the back of rising open interest and volume and leaves the door open to extra gains in the very near term and with the immediate target now at the September high at $1,735 (September 12).
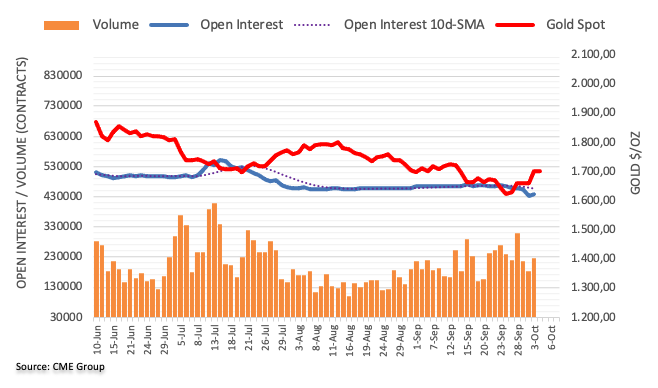
-
05:41
EUR/USD keeps its consolidation well in place – UOB
According to FX Strategists at UOB Group Lee Sue Ann and Quek Ser Leang, EUR/USD remains within a consolidative theme for the time being.
Key Quotes
24-hour view: “Yesterday, we expected EUR to ‘consolidate and trade between 0.9760 and 0.9860’. EUR subsequently traded within a narrower and slightly lower range of 0.9751/0.9844. The underlying tone for EUR has firmed somewhat, but while it could edge higher today, any advance is likely limited to a test of 0.9875. The next resistance at 0.9910 is unlikely to come under challenge. Support is at 0.9785 but only a breach of 0.9755 would indicate that the current mild upward pressure has eased.”
Next 1-3 weeks: “We continue to hold the same view as from last Friday (30 Sep, spot at 0.9825). As highlighted, the recent EUR weakness has stabilized and EUR is likely to consolidate and trade between 0.9630 and 0.9950 for now.”
-
05:40
EUR/USD prepares for an upside towards 0.9900 as DXY turns subdued, US NFP eyed
- EUR/USD is aiming to kiss the critical hurdle of 0.9900 amid weaker DXY.
- Lower consensus for the US NFP is denting the DXY’s appeal.
- Brussels expansion plans for EU nations will continue to support the trading bloc.
The EUR/USD pair is hovering around weekly highs of 0.9850 and is preparing to cross the same to smash the critical hurdle of 0.9900. The asset has turned sideways in a narrow range of 0.9735-0.9850 after a firmer rebound. Odds are favoring an upside break of the consolidation as the US dollar index (DXY) is going through a rough phase amid a slowdown in the US economy due to escalating interest rates by the Federal Reserve (Fed).
A decline in the US ISM Manufacturing PMI data has dented the DXY’s appeal. The economic data has declined firmly to 50.9 vs. the expectations of 52.2 and the prior release of 52.8. Apart from that, the economic catalyst that illustrates the forward demand has also weakened. The US ISM New Orders Index landed significantly lower to 47.1 against the projections of 49.6 and the former figure of 51.3.
This week, the show-stopper event will be the US employment data, which will release on Friday. The projections claim the US economy has added 250k jobs in the labor market vs. the former print of 315k. Projections for employment generation have scaled down sharply led by soaring interest rates, which have forced the corporate to ditch the recruitment process due to postponement of expansion plans.
Meanwhile, eurozone bulls have cheered the proposal of stretched debt reduction scheme by Brussels to execute more development programs. Financial Times on Monday reported that Brussels wants to give EU capitals extra time to curb their debts and create space for public investment as part of a major overhaul of the EU’s deficit rules.”
On the economic data front, investors are awaiting the release of the German Retail Sales data, which is expected to decline by 1.7% against a decline of 0.9% reported earlier.
-
05:19
Gold Price Forecast: XAU/USD gearing up for a fresh upswing to $1,712 – Confluence Detector
- Gold price is treading water at around $1,700 amid weaker US dollar, yields.
- The metal is biding time before the next push higher.
- XAU/USD looks to $1,712 resistance on buying resurgence.
Gold price is consolidating Monday’s staggering rally, as it broke out of the range trade and briefly recaptured the $1,700 barrier. The US dollar remains on the backfoot amid an extended risk-on rally in the global stocks, with the US S&P 500 futures sharply higher so far this Tuesday. Although the US Treasury yields are struggling to find any demand, leaving the bright metal yearning for a fresh catalyst to extend the previous northward trajectory. The greenback remains weighed down by a miss on the US ISM Manufacturing PMI and the optimism on the global market. Looking ahead, bullion traders will gauge whether the dollar correction will continue ahead of the second-tier US economic releases and the Fedspeak. The RBA’s unexpected 25 bps rate hike announcement seems to have limited relevance for gold buyers.
Also read: Gold’s rally – A whole lot of nothing
Gold Price: Key levels to watch
The Technical Confluence Detector shows that the gold price is eyeing a sustained move above the previous day’s high of $1,702 to kickstart a fresh upswing towards the pivot point one-week R2 at $1,712.
The next critical resistance is aligned at the pivot point one-day R1 at $1,715.
On the flip side, strong support is seen at $1,696, below which the Fibonacci 23.6% one-day could come to buyers’ rescue.
Sellers will then aim for the Fibonacci 61.8% one-month at $1,689, followed by the next downside cushion at $1,687. That level is the convergence of the Fibonacci 38.2% one-day, SMA5 four-hour and pivot point one-week R1.
Here is how it looks on the tool
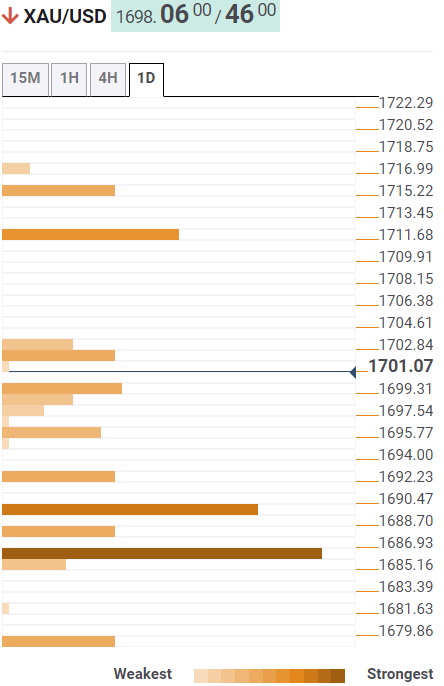
About Technical Confluences Detector
The TCD (Technical Confluences Detector) is a tool to locate and point out those price levels where there is a congestion of indicators, moving averages, Fibonacci levels, Pivot Points, etc. If you are a short-term trader, you will find entry points for counter-trend strategies and hunt a few points at a time. If you are a medium-to-long-term trader, this tool will allow you to know in advance the price levels where a medium-to-long-term trend may stop and rest, where to unwind positions, or where to increase your position size.
-
05:00
AUD/JPY reclaims 94.00, RBA hikes OCR by 25 bps lower-than-projection of 50 bps
- AUD/JPY has recovered sharply and is oscillating around 94.00.
- The RBA has elevated its OCR by 25 bps to 2.6% and has ditched the 50 bps rate hike spell.
- The continuous firing of ballistic missiles by North Korea has raised questions over international peace.
The AUD/JPY pair has after the announcement of the interest rate decision by the Reserve Bank of Australia (RBA). RBA Governor Philip Lowe has elevated the interest rates by 25 basis points (bps). The extent of the rate hike by the central bank is lower than the expectations of a 50 bps rate hike.
Market participants were expecting that the RBA will announce a fifth consecutive 50 bps rate as price pressures have not displayed any sign of exhaustion yet. The rate hike announcement of 50 bps would have pushed the Official Cash Rate (OCR) extremely closer to the target rate of 3.85%. After a rate hike of 25 bps, the OCR stands at 2.6%.
It is worth noting that the option of a rate hike by 25 bps was also into consideration by the RBA. The central bank discussed the 25 bps rate hike option in its September monetary policy meeting, as dictated in RBA minutes. It seems that the RBA wants to take the growth prospects simultaneously with the foremost agenda of bringing price stability.
On the Tokyo front, investors are worried over demolished harmony in Japan as North Korea had been reported to have fired another ballistic missile over the north of the country. In response to that, Japan administration has urged residents to take shelter.
Japanese Prime Minister Fumio Kishida cited that recent repeated ballistic missile launches are outrageous and we strongly condemn them while addressing the media on Tuesday morning.
On the economic data front, the Statistics Bureau of Japan has released the Tokyo Consumer Price Index (CPI) data. The headline CPI has remained lower at 2.8% than the projections of 3.0% and the prior release of 2.9%. While the core CPI has escalated to 1.7% vs. the expectations of 1.5% and the prior print of 1.4%.
-
04:38
AUD/USD tumbles to near 0.6460 as RBA ditches 50 bps rate hike pattern
- AUD/USD has dropped sharply to near 0.6460 on RBA’s 25 bps rate hike announcement.
- The extent of the 25 bps rate hike by the RBA is less than the projections of 50 bps.
- The DXY has surrendered the majority of its intraday gains amid lower consensus for the US NFP data.
The AUD/USD pair as the Reserve Bank of Australia (RBA) has hiked its Official Cash Rate (OCR) by 25 basis points (bps). The extent of the rate hike is less than the projections of institutional investors. This has pushed the OCR to 2.6%.
After the announcement of a rate hike of 25 bps, the RBA has inched more towards its target rate of 3.85%. No doubt, the market participants were in favor of hiking the interest rate by 50 bps but a quarter-to-a-percent rate hike was also in the preferred list. RBA Governor Philip Lowe also cited the option of 25 bps in the discussion list, as drafted in RBA monetary policy minutes.
Meanwhile, the US dollar index (DXY) is eyeing more weakness below the immediate cushion of 111.50. The vulnerable performance of the DXY banks upon the poor reading of the US ISM Manufacturing PMI for August month. The economic PMI data declined to 50.9 vs. the expectations of 52.2 and the prior release of 52.8. Also, the US ISM New Orders Index that illustrates the forward demand landed significantly lower to 47.1 against the projections of 49.6 and the former figure of 51.3.
Going forward, investors will focus on the US Nonfarm Payrolls (NFP) data, which will release on Friday. The employment generation data is seen lower at 250k vs. the last reading of 315k. As per the consensus, the job creation process in the US economy has slowed down led after various firms ditched the recruitment process for the remaining 2023. While the Unemployment Rate is seen steady at 3.7%.
-
04:36
RBA: Size, timing of future rate rises will be determined by the data and outlook for inflation, labor market
Following are the key headlines from the October RBA monetary policy statement, via Reuters, as presented by Governor Phillip Lowe.
Rate rise will help achieve more sustainable balance of demand and supply.
Board is committed to returning inflation to the 2–3 per cent range over time.
Cash rate has been increased substantially in a short period of time.
Size and timing of future rate rises will be determined by the data and outlook for inflation and the labor market.
Medium-term inflation expectations remain well anchored, and it is important that this remains the case.
Board expects to increase interest rates further over the period ahead.
Given the tight labour market and the upstream price pressures, the board will continue to pay close attention to both the evolution of labour costs and the price-setting behaviour of firms in the period ahead.
Board remains resolute in its determination to return inflation to target.
-
AUD/USD tumbles to near 0.6460 as RBA ditches 50 bps rate hike pattern
About RBA rate decision
RBA Interest Rate Decision is announced by the Reserve Bank of Australia. If the RBA is hawkish about the inflationary outlook of the economy and rises the interest rates it is positive, or bullish, for the AUD. Likewise, if the RBA has a dovish view on the Australian economy and keeps the ongoing interest rate, or cuts the interest rate it is seen as negative, or bearish.
-
-
04:31
Breaking: RBA raises OCR by 25 bps from 2.35% to 2.60% in October, AUD/USD plunges
The Reserve Bank of Australia (RBA) raised its official cash rate (OCR) by 25 basis points (bps) from 2.35% to 2.60%.
The rate hike decision came as a dovish surprise, snapping the bank's four straight half percentage point hike track.
According to the latest Reuters poll, the median forecast showed rates going up another 50 bps next quarter to peak at 3.35%.
AUD/USD reaction
In an immediate reaction to the RBA decision, the AUD/USD pair plunged about 60-pips to 0.6454 before recovering to near 0.6465. At the time of writing, the aussie is down 0.79% on the day.
About RBA rate decision
RBA Interest Rate Decision is announced by the Reserve Bank of Australia. If the RBA is hawkish about the inflationary outlook of the economy and rises the interest rates it is positive, or bullish, for the AUD. Likewise, if the RBA has a dovish view on the Australian economy and keeps the ongoing interest rate, or cuts the interest rate it is seen as negative, or bearish.
-
04:30
Australia RBA Interest Rate Decision came in at 2.6% below forecasts (2.85%)
-
04:14
RBA Preview: To mark five consecutive 50 bps rate hikes – Societe Generale
In its latest client note, analysts at Societe Generale said, “we expect the RBA to increase the cash rate target from 2.35% to 2.85%.”
Read: When is the RBA Interest Rate Decision and how could it affect AUD/USD?
Additional quotes
“Would mark five consecutive 50 bps rate hikes since the initial one back in June.”
“The policy statement will continue to say that the RBA is committed to returning inflation to the 2-3% target range over time while keeping the economy on an even keel and that the size and timing of future interest rate increases will be guided by the data and the outlook by policymakers on inflation and the labor market.”
“The statement will also continue to skip the words ‘ normalizing monetary conditions, which we think implies the intention of policymakers to adjust its policy stance to one of outright tightening.”
-
04:10
Oil: Brent price could see a $13 rise on OPEC+ 1M bbl/day output cut – Goldman Sachs
Analysts at Goldman Sachs explain why OPEC and its allies (OPEC+) are expected to announce output cuts on Wednesday while predicting the Brent crude price on a potential one million bbl/day output cut.
Key quotes
"The collapse in investor participation, driving liquidity and prices lower, is also a likely strong catalyst for such a cut, as it would increase the carry in oil and start to claw back investors who have instead turned to USD cash allocation following the aggressive Fed hikes."
"OPEC is probably more powerful than it's ever been in its 60-year history since its inception. And one of the reasons really is the fact that we have not been investing in alternative energy sources. So they're really the only game in town."
“In the case of the 1 mn bbl/day output cut:
Forecasts a circa US$13 / bbl rise in the price of Brent crude.
Over the course of 12 months, but mainly front-loaded.
Also suggest there is a possibility of a great rise in price, circa $20 /bbl when inventories fall again.”
-
04:03
WTI aims to smash $85.00 despite a drop in global PMIs, OPEC+ decision eyed
- Oil prices are marching higher to hit the immediate hurdle of $85.00.
- Globally, weak manufacturing PMI performance has failed to stop the oil bulls.
- OPEC+ production cuts announcement will weaken the black gold further.
West Texas Intermediate (WTI), futures on NYMEX, are gathering momentum before marching towards the critical hurdle of $85.00. The black gold is inching higher from the past week after hitting a low at around $76.00. On a broader note, this could be a pullback move as the oil prices have remained in a vulnerable situation.
Despite a weaker performance on the manufacturing PMIs front by various nations, the oil prices have attracted bids from market participants. Starring from the world’s largest oil importer, China, which is enjoying a full week holiday reported a decline in the Caixin Manufacturing PMI data for August month. The economic data has landed at 48.1, lower than the expectations and the prior release of 49.5.
Adding to that, the performance of the world’s largest economy for August month was also vulnerable. The US ISM Manufacturing PMI data declined to 50.9 vs. the expectations of 52.2 and the prior release of 52.8. Also, the forward guidance is not lucrative. The US ISM New Orders Index data is declined sharply to 47.1 against the projections of 49.6 and the former figure of 51.3. Weaker PMI’s performance indicates a decline in the oil demand.
Well, what is hurting the oil bears is the expectation of a bigger production cut by the OPEC+ group to bring price stability in the oil market. The OPEC+ meeting seems crucial as it is the first face-to-face meeting after the pandemic and is expected to remain more elaborated and stretched. No doubt, the announcement of production cuts by the oil cartel will benefit Russia more, which is selling its discounted oil to nations like India and China.
-
03:42
When is the RBA Interest Rate Decision and how could it affect AUD/USD?
The Reserve Bank of Australia (RBA) is set to announce the fifth straight rate hike this Tuesday at 04:30 GMT. The central bank is widely expected to raise the Official Cash Rate (OCR) by 50 bps from 2.35% to 2.85%.
According to the latest Reuters poll, over a 70% majority of economists, 21 of 29, predicted the RBA would hike its cash rate by half a point to 2.85% at its October 4 meeting. Although the median forecast showed rates going up another 50 basis points next quarter to peak at 3.35%.
RBA Governor Philip Lowe already tempered expectations of aggressive rate hikes last month, as he said that they had almost neared the 2.50% neutral rate. Since then, fears over hard-landing and softer Australian monthly inflation have revived the bets for a dovish rate hike.
Therefore, a 25 bps rate hike decision by the RBA may not come as much of a surprise, as most major central banks are turning cautious amid growing recession fears and surging energy costs. Dwindling demand from China also remains a major concern for Australia. China is the island nation’s closest trading partner.
How could the RBA decision affect AUD/USD?
At the time of writing, AUD/USD is trading on the back foot at around 0.6500, reversing Monday’s rebound to near 0.6520. Investors refrain from placing any directional bets on the aussie ahead of the critical RBA rate hike decision.
Technically, the pair has been traversing in a familiar range ever since it hit fresh 2022 lows at 0.6363. In case of a dovish surprise, bears could flex their muscles and revisit the 0.6400 before challenging the yearly lows. The 14-day Relative Strength Index (RSI) inches lower below the midline, suggesting that there is more room for the downside.
On the upside, a sustained move above the 0.6530 range highs is needed to yield a pennant breakout, opening doors for a fresh rally towards 0.6600. The bearish 21-Daily Moving Average (DMA) at 0.6639 will be the next resistance line on the upside break.
AUD/USD: Daily chart
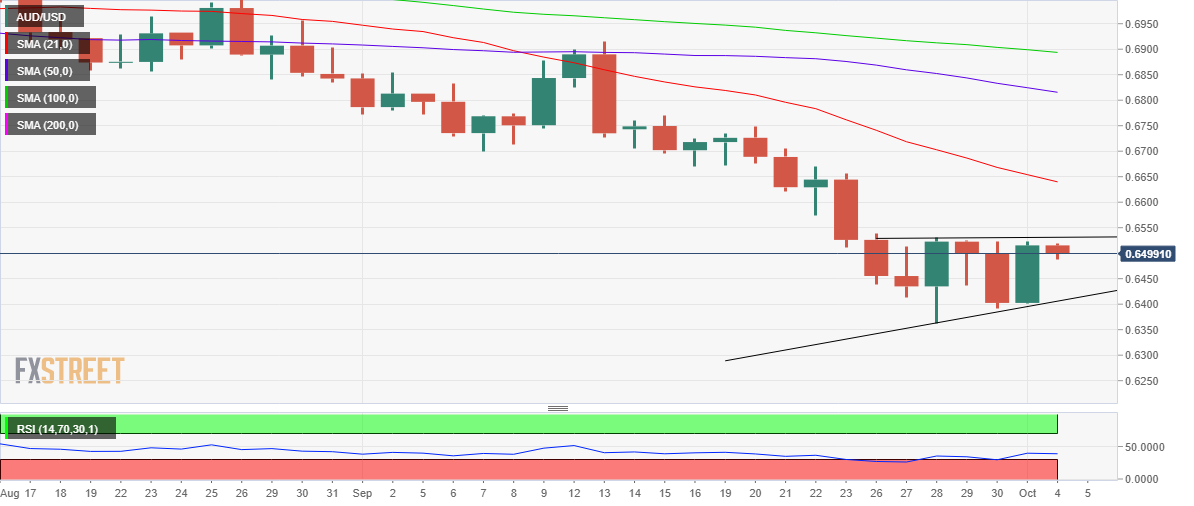
Key quotes
Reserve Bank of Australia Preview: Has the time come to flip dovish?
AUD/USD seeks cushion around 0.6500 as hawkish RBA bets soar
About the RBA interest rate decision
RBA Interest Rate Decision is announced by the Reserve Bank of Australia. If the RBA is hawkish about the inflationary outlook of the economy and rises the interest rates it is positive, or bullish, for the AUD. Likewise, if the RBA has a dovish view on the Australian economy and keeps the ongoing interest rate, or cuts the interest rate it is seen as negative, or bearish.
-
03:14
GBP/USD Price Analysis: Defending 21 DMA is critical to unleashing additional recovery
- GBP/USD is challenging 1.1300 support amid renewed weakness.
- The US dollar is consolidating its decline despite Asia's risk-on mood.
- Cable recaptured 21 DMA on a closing basis but RSI still remains bearish.
GBP/USD is retreating from fresh eight-day highs at 1.1344, as the US dollar has paused its recent decline despite the extension of the risk-on trading in Asia this Tuesday.
The dollar was sold-off heavily into the market optimism, with the downside exacerbated by a miss on the US ISM Manufacturing PMI and the Prices Paid component, which helped the pair extend its recovery momentum.
Cable received a fresh life on Monday after the UK Finance Minister Kwasi Kwarteng confirmed the government’s U-turn on its previous higher tax rate cut announcement. Kwarteng and PM Liz Truss decided that they will not go ahead with a plan to scrap the 45% income tax rate.
However, bulls seem to be losing momentum at the moment and challenge the 1.1300 level amid a relatively quiet economic calendar on both sides of the Atlantic. Although the speeches by the Fed officials Williams and Mester will be closely followed later in the NA session. Any updates on the UK political front as well as on the policy reforms will have a significant impact on the major.
As observed on a daily chart, GBP/USD extended its recovery from 37-year lows and recaptured the flattish 21-Daily Moving Average (DMA) at 1.1293 on a daily closing basis.
Although it remains to be seen if bulls manage to defend the latter going forward, as the 14-day Relative Strength Index (RSI) is still lurking below the midline.
If the pair drops once again below that level, then a move back towards 1.1250 cannot be ruled out. Further south, the 1.1200 round level could come into play.
Alternatively, bulls need acceptance above the 1.1350 psychological level to unleash the further upside but the 21 DMA barrier should hold up.
The September 22 high of 1.1364 will be next on GBP buyers’ radars.
GBP/USD: Daily chart
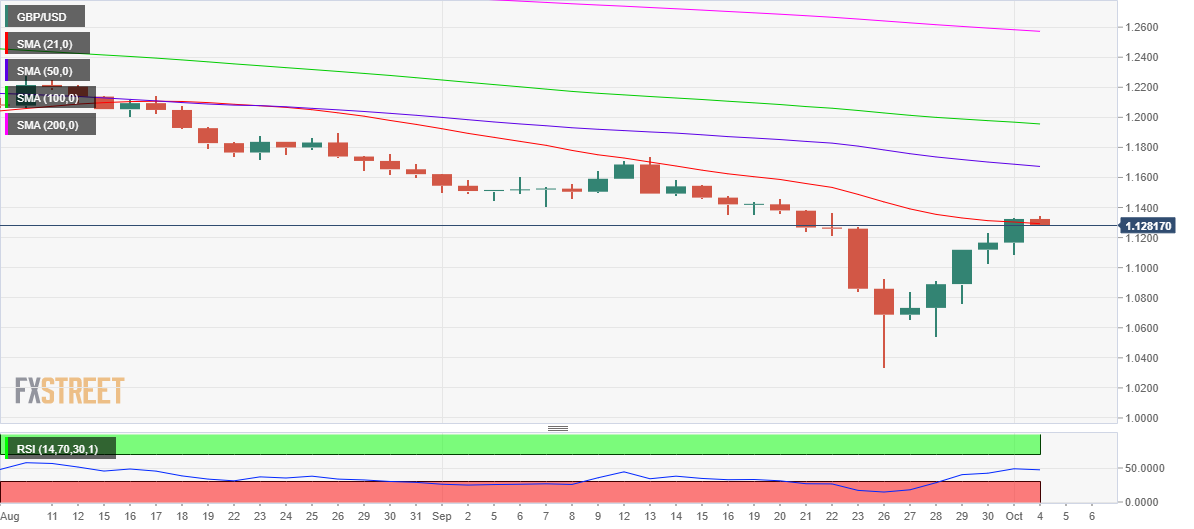
GBP/USD: Additional technical levels
-
03:07
North Korea's repeated actions are a serious challenge to international peace
In early trade today, Japan urged residents to take shelter early Tuesday morning after North Korea had been reported to have fired another one ballistic missile over the north of the country.
This escalation of Pyongyang’s missile tests has prompted immediate backlash from Tokyo and has put markets on risk-off alert.
South Korea’s Joint Chiefs of Staff (JCS) confirmed the missile passed eastward over Japan after launching from North Korea’s Mupyong-ri area in Jagang Province at around 7:23 a.m. local time.
South Korea's national security council on Tuesday condemned the test and said these constant provocations by the North cannot be tolerated.
"South Korea clearly states that North Korea's continued provocations cannot be overlooked and will come at a cost, while we will seek various measures against North Korea, including strengthened sanctions within the international community, based on close cooperation with the United States," according to a statement published after the national security council convened a meeting.
The launch has increased the tally for 2022, the most prolific year for ballistic missile tests since Kim Jong Un assumed power in North Korea in 2012, according to the Unification Ministry and a CNN tally as of this past weekend. According to CNN’s count, Tuesday’s launch marks North Korea’s 23rd missile launch this year, including both ballistic and cruise missiles.
Addressing the media Tuesday, Japanese Prime Minister Fumio Kishida condemned the launch.
“Recent repeated ballistic missile launches are outrageous and we strongly condemn it,” Kishida said during a press conference at his official residence.
Japan won't rule out any options, including counterattack capabilities, as it looks to strengthen its defences in the face of repeated missile launches from North Korea, Defence Minister Yasukazu Hamada said on Tuesday.
"In light of this situation, we will continue to examine all options, including so-called 'counterattack capabilities' and not rule out anything as we continue to work to fundamentally strengthen our defence abilities," Hamada told a briefing.
The mounting concern is a nuclear test by N.Korea that would be a game changer as this would provoke international outcry and a response from the US.
Pyongyang has carried out six nuclear tests since 2006, with the most recent, and most powerful in 2017.
Satellite images taken in recent months show signs of activity in a tunnel at the nuclear test site Punggye-RI.
In the meantime, Japan's chief cabinet secretary Matsunosaid said that North Korea's repeated actions are a serious challenge to international peace and Japan will work with allies appropriately when asked whether Japan will impose further sanctions on North Korea.
Meanwhile, the yen was slightly bid on the news early in the day but has since been moved lower by a resurgence in the greenback in tokyo, with USD/JPY now trading higher by some 0.19% to 144.82.
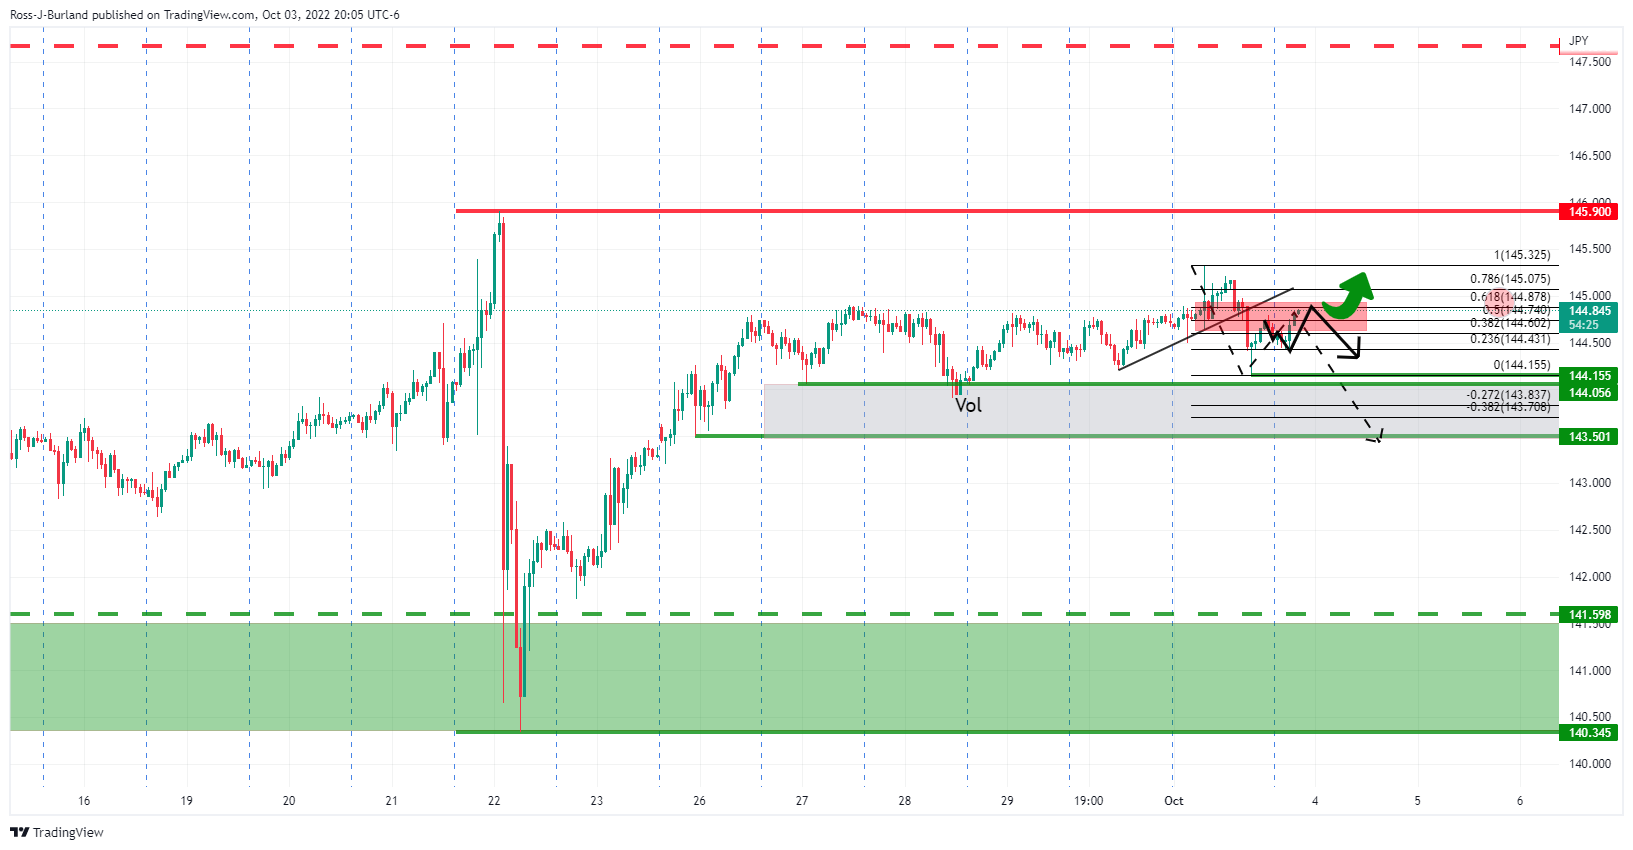
USD/JPY is moving in on a 61.8% retracment level in the 144.80s and a break here will leave a bias for the upside for the day ahead with eyes on the prior highs near 145.30. However, if resistance holds, then there will be significant risk of a move t test below 144.00.
-
02:26
Gold Price Forecast: XAU/USD sees a correction amid stiff hurdles around $1,700, US NFP buzz
- Gold price is expected to correct to near $1,690.00 as exhaustion meets the $1,700.00 resistance.
- Poor reading for the US Manufacturing PMI gamut has strengthened the gold bulls.
- US NFP is likely to drop as corporate has ditched the recruitment process.
Gold price (XAU/USD) is displaying signs of exhaustion while attempting to establish above the psychological hurdle of $1,700.00. The precious metal is expected to witness a correction as hurdles around $1,700.00 are quite strong and demands aggressive buying interest to get demolished. The yellow metal is likely to correct to near $1,690.00 but that doesn’t warrant a bearish reversal.
It is worth noting that the poor US ISM Manufacturing PMI readings for August month have strengthened the gold prices and investors are now shifting their focus toward the US Nonfarm Payrolls (NFP) data. According to the projections, the US economy created 250k jobs in September, lower than the August reading of 315k.
The US economy has been maintaining full employment levels, therefore, space for generating more employment is extremely less. Adding to that, the escalating Federal Reserve (Fed)’s interest rates are also restricting the corporate to continue their hiring programs with sheer pace. The US employment generation capacity could deteriorate further as corporate has ditched the recruitment process for a while.
Gold technical analysis
Gold prices have witnessed a juggernaut rally after an upside break of the Rising Channel chart pattern on an hourly scale. An upside break of the above-mentioned chart pattern plotted from Wednesday’s high at $1,662.80 and Thursday’s low at $1,641.59 displays the sheer confidence of bulls. Exhaustion at elevated levels is indicating a correction to near $1,690.00.
A formation of a golden cross, represented by the 50-and 200-period Exponential Moving Averages (EMAs) at $1,656.50 is indicating more upside ahead.
Also, the Relative Strength Index (RSI) (14) is oscillating in a bullish range of 60.00-80.00, which advocates the continuation of upside momentum.
Gold hourly chart
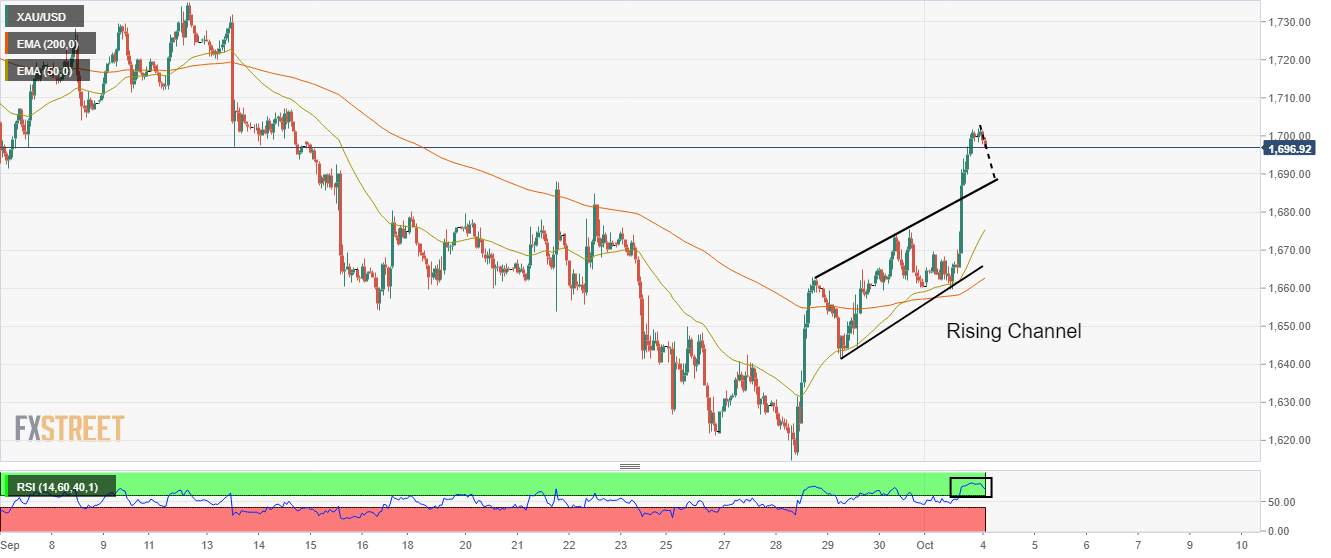
-
02:08
EUR/USD Price Analysis: 0.9780/0.9820 support to play role for run to test above prior week's highs
- EUR/USD bulls eye last week's high as an imminent target.
- The bears will be looking for a peak in this daily correction.
EUR/USD is within a broadening formation in a softer US dollar environment at the start of the week. The pair is attempting to move higher with last week's highs near 0.9850 in focus, 100 pips above this week's low so far. A break of the prior week's highs will open the risk of a move to test 0.9900 with 0.9950 resistance on the cards thereafter. On the flip side, 0.9750 guards a run to 0.9650:
EUR/USD H1 chart
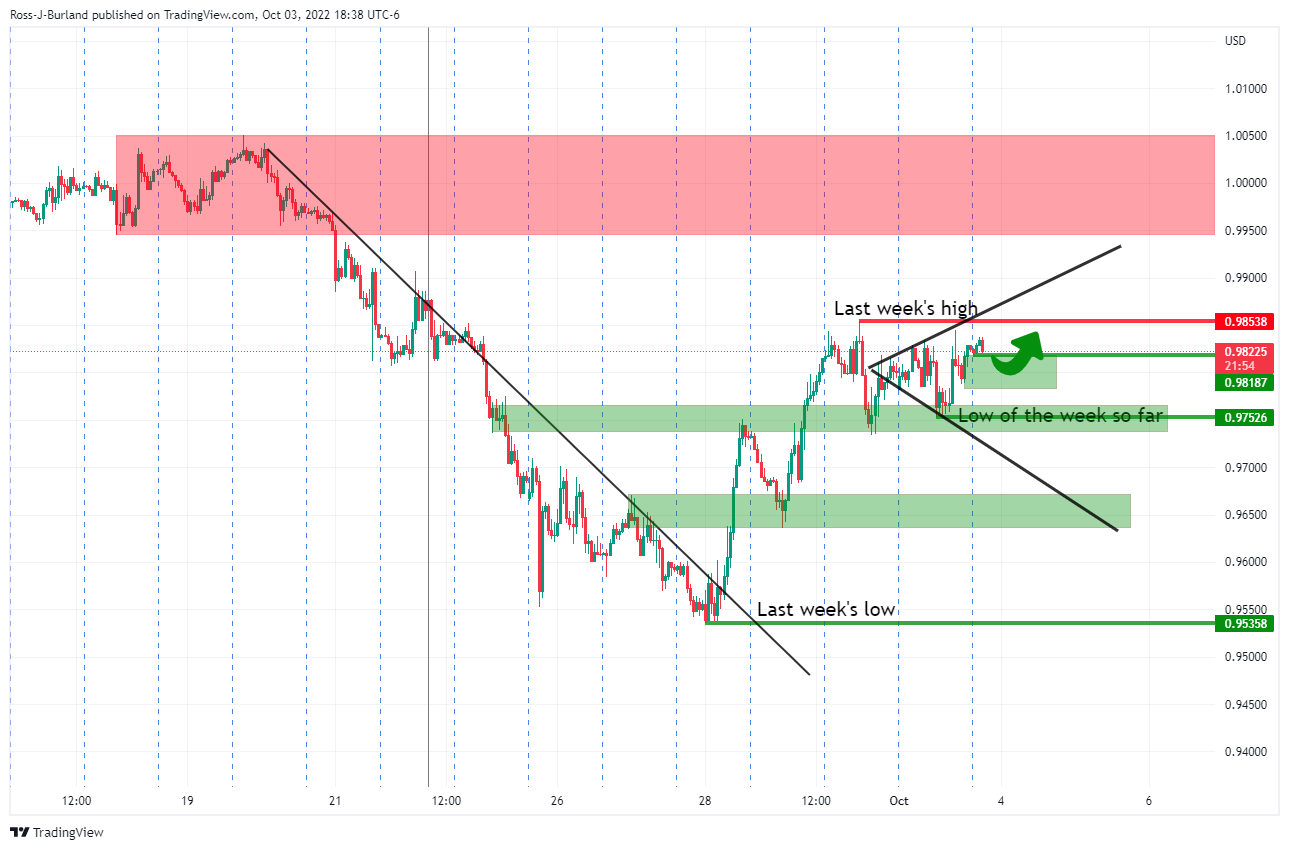
EUR/USD daily chart
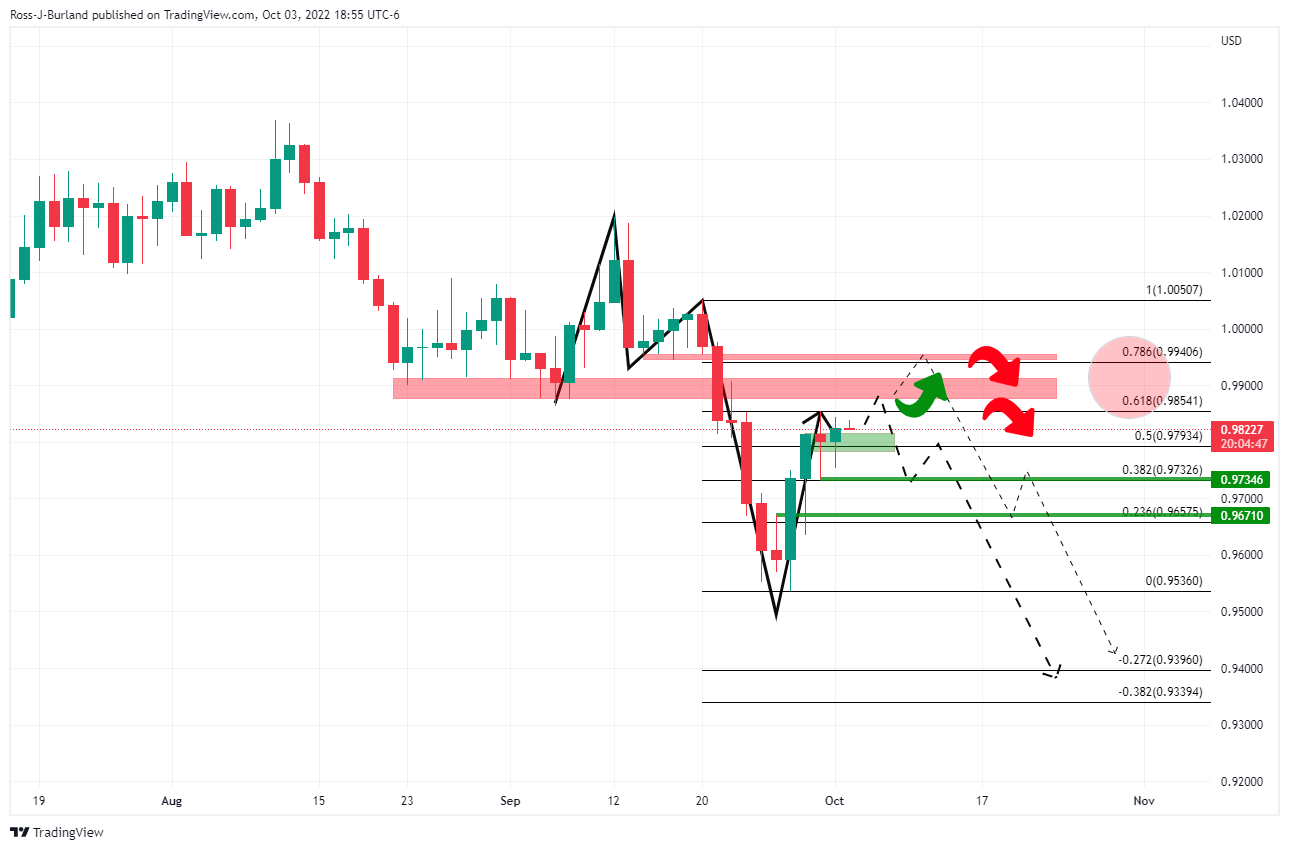
The price has corrected a significant portion of the prior bearish impulse on the daily chart and is targeting the neckline of the M-formation as illustrated above. This has a confluence with the 61.8% golden ratio near 0.9850. Resistance guards a leg higher to 0.9950 and around a 78.6% Fibo. Should the US dollar and yields eventually firm, perhaps on a blockbuster job report at the end of the week, then the volumes of orders left behind any potential grind higher could be bate for the bears as illustrated on the chart above.
DXY H1 chart
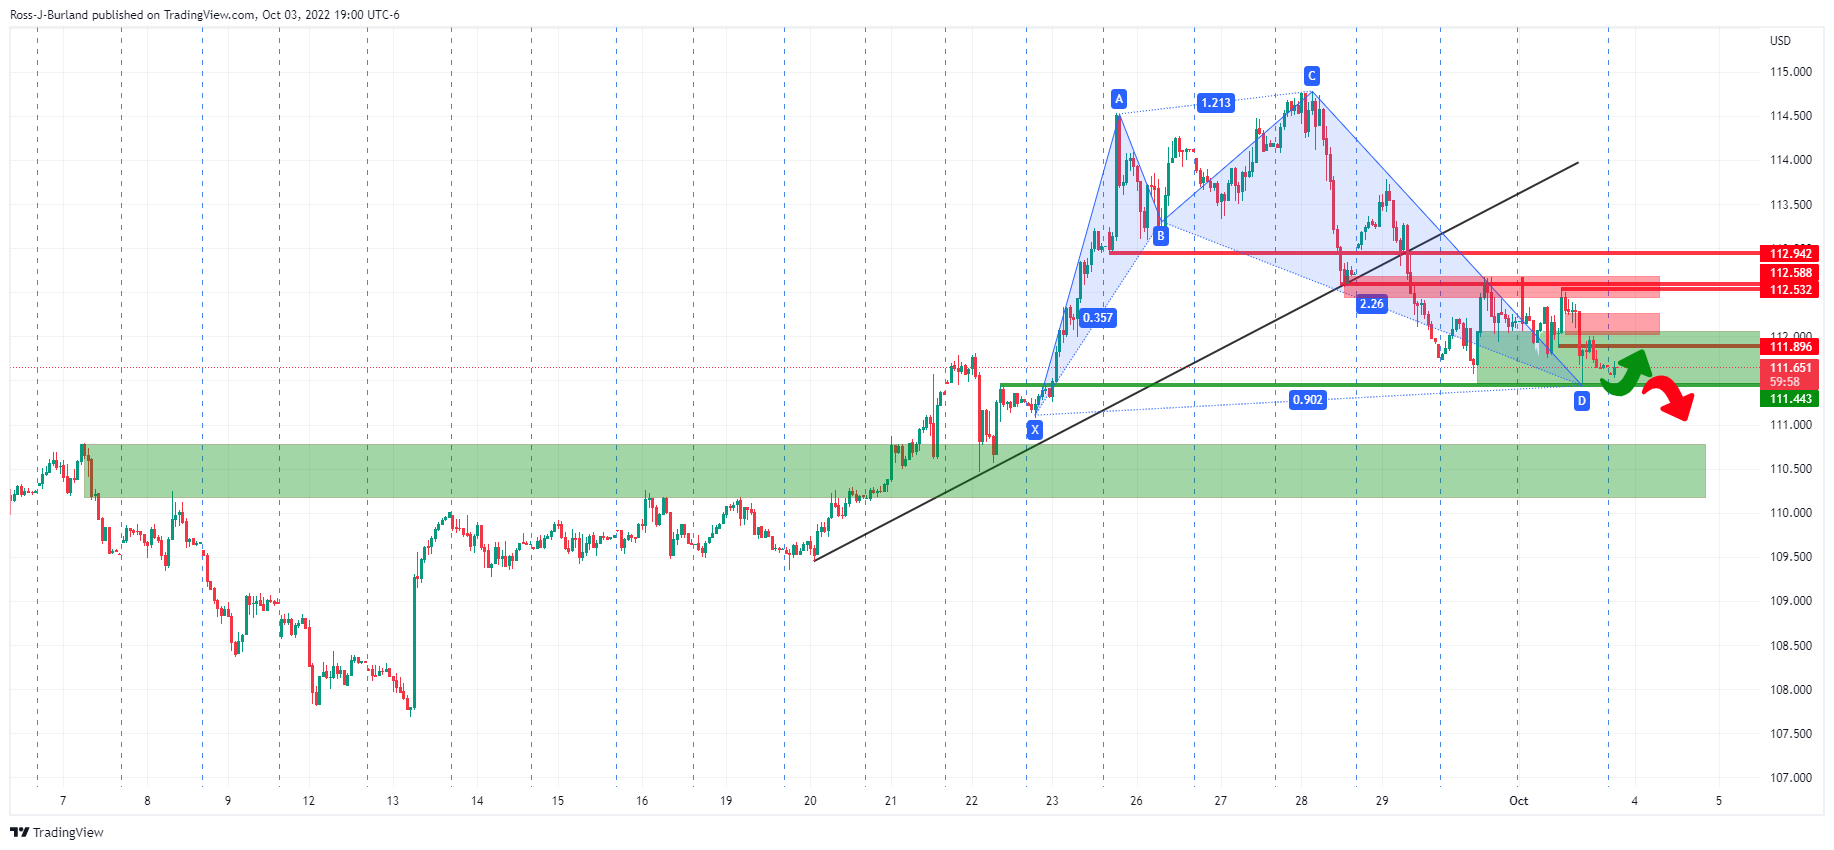
The US dollar, as measured by the DXY index vs. a basket of currencies is under pressure within a key area that otherwise guards against a full-blown sell-off below 111.50. The harmonic pattern is bullish, but the bulls must commit in the coming sessions.
US 10-yr yield
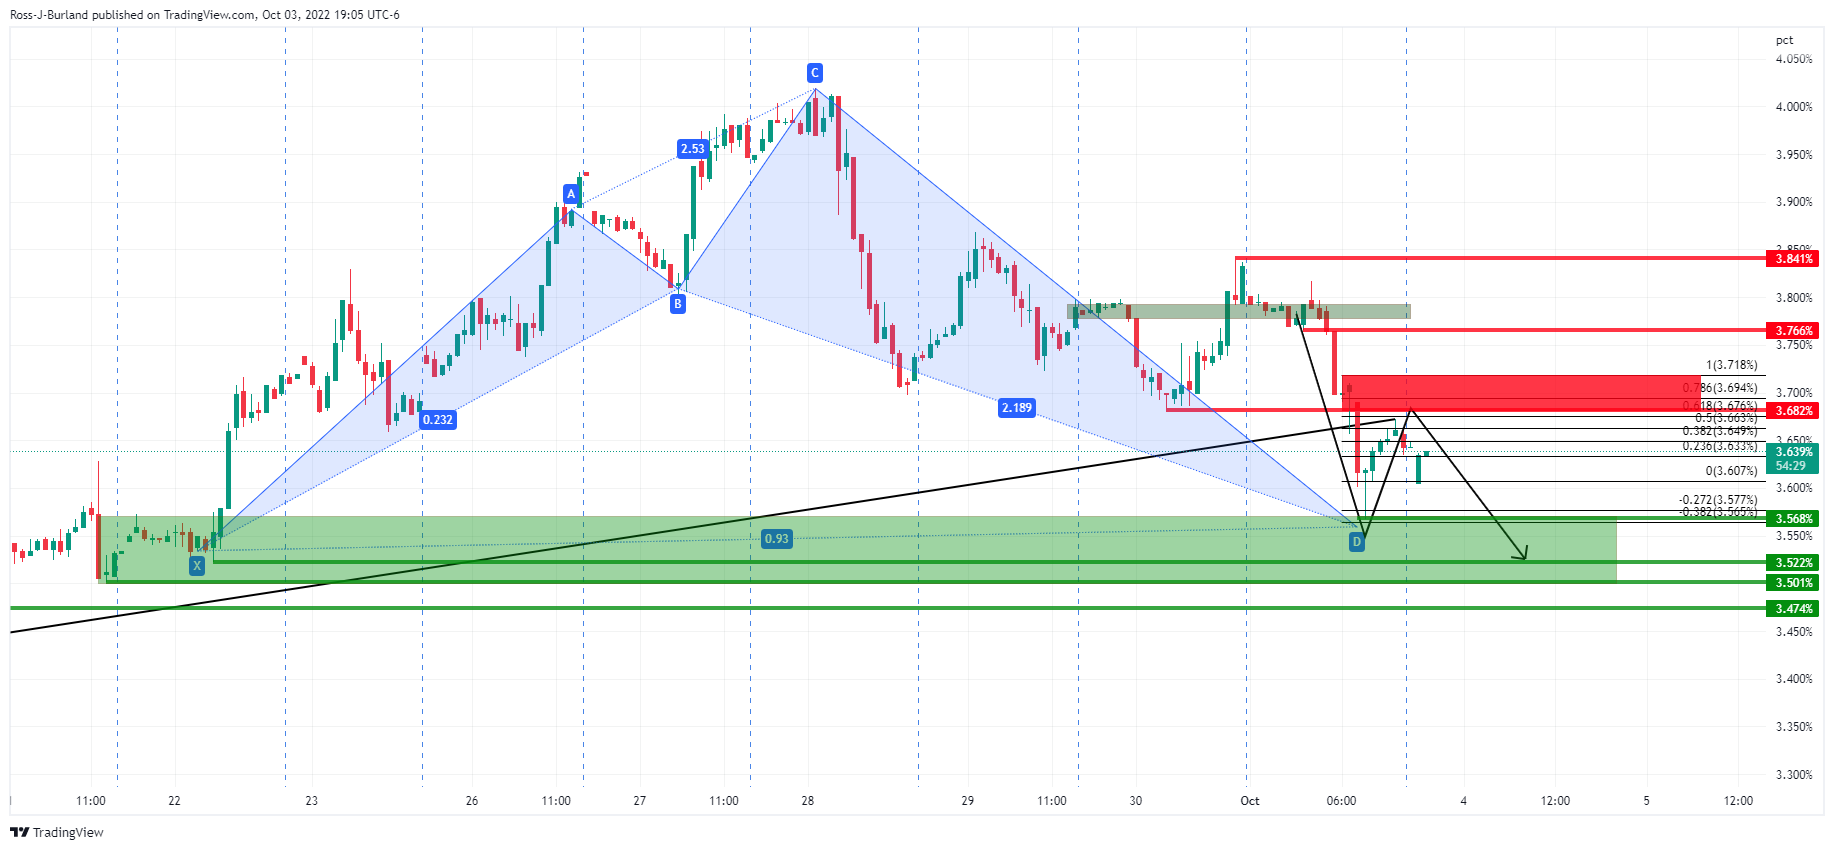
The US 10-year yield is also under pressure while below over head resistance around a 61.8% retracement area near 3.700%.
-
02:01
AUD/USD seeks cushion around 0.6500 as hawkish RBA bets soar
- AUD/USD is eyeing a cushion at around 0.6500 ahead of RBA policy.
- A fifth consecutive 50 bps rate announcement is expected by the RBA.
- The DXY is displaying a vulnerable performance after a downbeat release of the US ISM PMI data.
The AUD/USD pair is picking bids around the psychological support of 0.6500 after a mild correction from 0.6520. The major has turned sideways after a sheer upside from the critical support of 0.6400. The asset is expected to display a lackluster performance in the remaining Tokyo session as investors are awaiting the announcement of the interest rate decision by the Reserve Bank of Australia (RBA).
As per the projections, RBA Governor Philip Lowe will announce a rate hike of 50 basis points (bps) for the fifth consecutive time. An occurrence of the same will drive the Official Cash Rate (OCR) to 2.85%. If that occurs, RBA policymakers will be forced to dictate a less ‘hawkish’ guidance. The RBA sees its OCR to top around 3.85%. The current pace will meet the desired rate by the end of 2022, therefore, the central bank will trim its hawkish tone if it move ahead with half-a-percent rate hike.
Well, one could not rule out the alternative of a 25 bps rate hike by the RBA as the option was cited in the discussion list, as drafted in RBA monetary policy minutes. Therefore, investors should be expected the unexpected at the October meeting.
Meanwhile, the US dollar index (DXY) is on the tenterhooks as expectations for a decline towards the round-level support of 111.00 are accelerating. A downbeat reading of US ISM Manufacturing PMI has weakened the DXY. The economic PMI data declined to 50.9 vs. the expectations of 52.2 and the prior release of 52.8. Trimmed retail demand has slashed the extent of manufacturing activities, which is warranting a slowdown ahead.
-
01:37
US Dollar Index sees a downside to near 111.00 amid lower consensus for US NFP
- The DXY may decline towards 111.00 after surrendering the immediate support of 111.47.
- A downbeat US ISM Manufacturing PMI data is the leading downside trigger this week.
- Investors are also discounting the weaker consensus for the US NFP data.
The US dollar index (DXY) is oscillating around the critical support of 111.48 in the Tokyo session. The asset is expected to deliver a downside break and will decline further towards the cushion of 111.00. For the past two trading sessions, the DXY bulls are attempting to cross 112.50 but a failure in doing the same weakened the DXY.
Downbeat Manufacturing PMI leads the downside triggers
A downbeat reading of the US ISM Manufacturing PMI has raised concerns over the sustainability of the longer-term upside bias in the DXY. The extent of manufacturing activities is declining in the US economy as higher inflationary pressures have trimmed retail demand by the households and eventually forced the producers not to exploit their entire capacity.
The US ISM Manufacturing PMI declined to 50.9 vs. the expectations of 52.2 and the prior release of 52.8. Apart from that, weaker New Orders Index data has also plunged. The economic indicator that reflects forward demand for manufacturing activities slipped to 47.1 against the projections of 49.6 and the former figure of 51.3.
Lower consensus for the US NFP data
Subdued preliminary estimates for the US Nonfarm Payrolls (NFP) data is been discounting the market participants. As expected, the US economy created 250k jobs in September, lower than the August reading of 315k. The US economy has been maintaining full employment levels, therefore, space for generating more employment is extremely less. Adding to that, the escalating Federal Reserve (Fed)’s interest rates are also restricting the corporate to continue their hiring programs with sheer pace.
What could dampen the DXY’s appeal further is the Average Hourly Earnings data. The projections are indicating a soft landing at 5.1% vs. the prior release of 5.2%. In time, when households are facing the headwinds of mounting inflation, lower earnings would be insufficient to offset the inflated payouts.
-
01:32
Australia Investment Lending for Homes climbed from previous -11.2% to -4.8% in August
-
01:32
Australia Building Permits (YoY) up to -9.5% in August from previous -25.9%
-
01:32
Australia ANZ Job Advertisements came in at -0.5%, below expectations (0%) in September
-
01:32
Australia Home Loans came in at -2.7%, above expectations (-3.5%) in August
-
01:31
South Korea S&P Global Manufacturing PMI dipped from previous 47.6 to 47.3 in September
-
01:30
Australia Building Permits (MoM) came in at 28.1%, above forecasts (5%) in August
-
01:18
USD/JPY bears are hungry for a test of 144.00 / 143.50
- While below counter-trendline resistance, the focus is on the downside.
- USD/JPY bears have their eyes on 143.50 for the days ahead.
USD/JPY is sitting around 144.50 in Tokyo following the release of inflation data for the Tokyo area in September. At this time of writing, USD/JPY is flat and has stuck to a 144.41 and 144.62 range so far.
Headline inflation arrived at 2.8% vs. 2.8% expected, so no great shakes there as per usual, but the US data from Monday's trade has been the foundation for volatility that has weighed on the pair. ISM manufacturing index data, which provides a gauge for manufacturing activity in the US, came in lower than expected. The ISM reported a figure of 50.9 for September, lower than the forecasted 52.2. The data is another reason why some observers are moving toward a less hawkish bias from the Fed.
The greenback fell within demand while the 10-year yield slipped to test critical support levels on the downside. the US dollar was softer by 0.4% and stocks on Wall Street ended sharply higher on Monday. The Dow finished +2.7%, the S&P 500 closed +2.6% and the Nasdaq Composite ended +2.3%. The 10-year Treasury yield fell 14 basis points to 3.66% and at one point dropped by 20 basis points. The 2-year yield declined 9 basis points to 4.12%.
In other events, the yen firmed slightly in early Asia when South Korea's military said that North Korea fired a short-range ballistic missile over Japan flying more than 4,000KM according to NHK and the target appeared to be the Hokkaido area which is Japan's northernmost prefecture and second-largest island. This led to a rare warning issued by Japanese authorities for people to seek shelter.
North Korea's firing of a ballistic missile over Japan is "unfortunate," Daniel Kritenbrink, the top US diplomat for East Asia, said on Monday. Kritenbrink, who is the State Department's assistant secretary for East Asian and Pacific Affairs, made the comment at an online event hosted by the Institute for Korean-American Studies.
S.korea president Yoon warns of a 'resolute' response after n.korea's missile launch and says N.korea's reckless nuclear provocations will bring a resolute response from the international community.
North Korea has tested an unprecedented number of missiles this year as it expands its weapons program at around the same time that the nuclear-powered aircraft carrier USS Ronald Reagan arrived in South Korea for joint military exercises designed to showcase the allies’ strength and serve as a deterrent to any nuclear threat.
USD/JPY technical analysis
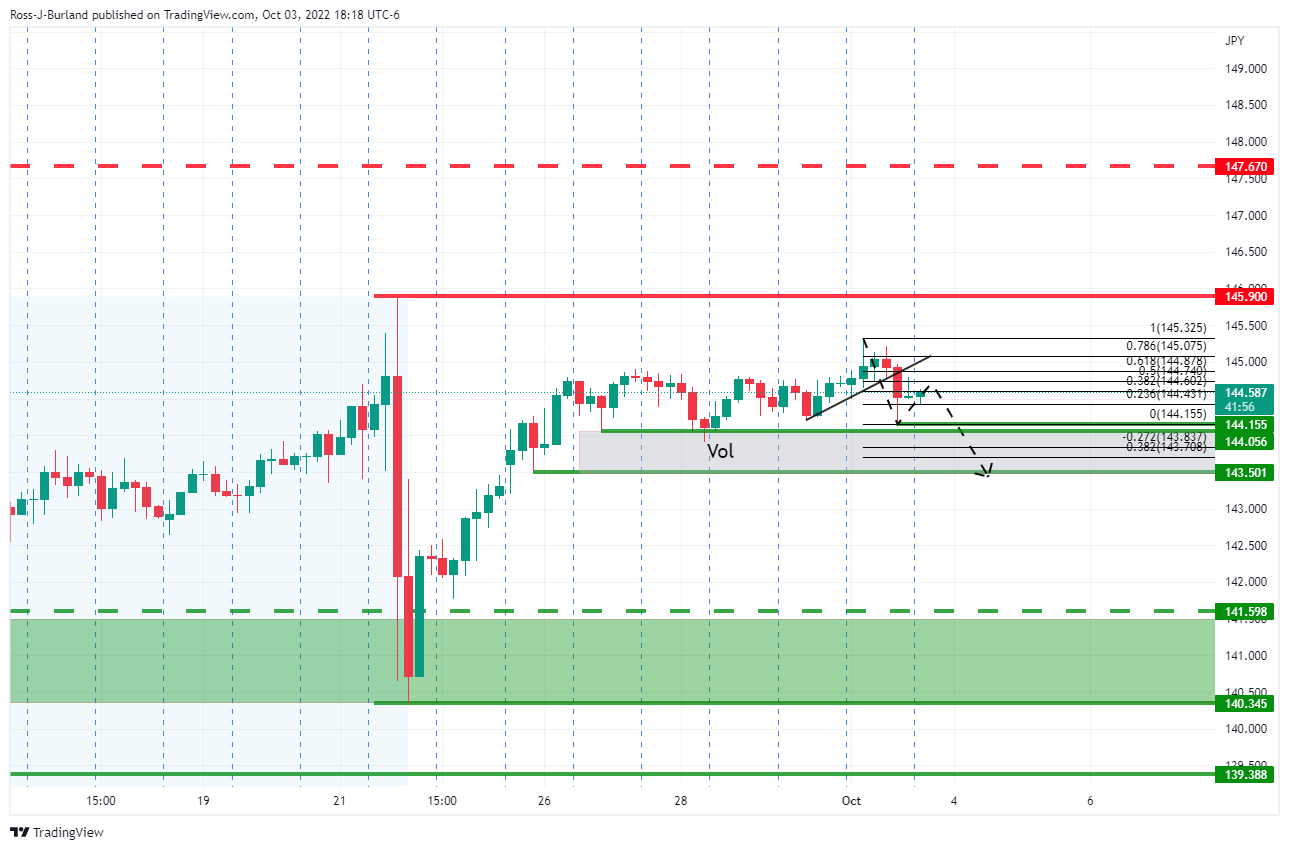
The pair is pressured below a counter-trendline that was broken at the start of the week with prospects tilted towards a further decline into an area where volumes of orders would be expected to be placed. Below 144, 143.50 guards a deeper correction of last and the prior week's rally.
-
01:15
Currencies. Daily history for Monday, October 3, 2022
Pare Closed Change, % AUDUSD 0.65115 1.76 EURJPY 142.062 0.25 EURUSD 0.98215 0.27 GBPJPY 163.6 1.13 GBPUSD 1.1316 1.19 NZDUSD 0.5719 2.13 USDCAD 1.36219 -1.39 USDCHF 0.99135 0.54 USDJPY 144.584 -0.06 -
01:10
USD/CAD Price Analysis: Bears poke 200-EMA above 1.3600, Double Top sets to activate
- The formation of a Double Top formed a base for a bearish reversal.
- USD/CAD bears are hovering around the 20-EMA while the 50-EMA has already turned downwards.
- A range shift move the RSI (14) into the bearish territory of 20.00-40.00 has strengthened loonie further.
The USD/CAD pair is expected to test its day’s low at 1.3620 and will decline towards the crucial support of 1.3600. For the past week, the asset has remained in the grip of bears after failing to sustain above the critical resistance of 1.3800.
On an hourly scale, the formation of the Double Top chart pattern has weakened the greenback bulls. A formation of the above-mentioned chart pattern indicates a bearish reversal amid lesser buying interest despite aiming to cross the prior high of 1.3833, recorded in the previous week.
At the press time, the asset is hovering around the critical support of the 200-period Exponential Moving Average (EMA) at 1.3624. The breakdown of the same will issue a downside warrant for the mighty greenback. While the 50-EMA at around 1.3700 has turned downwards, which indicates more weakness.
Adding to that, the Relative Strength Index (RSI) (14) has delivered a range shift move from 40.00-60.00 into the bearish range of 20.00-40.00. This dictates an activation of the loonie bulls.
A decisive break below the round-level support placed at 1.3600, which is Wednesday’s low will drag the asset towards the psychological support at 1.3500, followed by September 19 high at 1.3344.
On the flip side, a break above Wednesday’s high at 1.3833 will bolster the asset to hit a fresh two-year high at 1.4000. A breach of the latter will drive the major towards May 2020 high at 1.4173.
USD/CAD hourly chart
-638004389929614062.png)
-
00:51
Japan Monetary Base (YoY): -3.3% (September) vs previous 0.4%
-
00:50
EUR/JPY Price Analysis: Faces solid resistance at 142.50, as a rising wedge emerges
- EUR/JPY rises and reclaims the 142.00 area, courtesy of improving market sentiment.
- Decelerating US economic data and UK’s tax cuts U-turn tempered investors’ fears, spurring a rally in global equities.
- Near term, the EUR/JPY is downward biased, and it could aim towards 140.80 if it clears 142.00.
The EUR/JPY climbs towards the 20-day EMA as the Asian session gets underway, up by a minimal 0.02%, as appetite for riskier assets augmented, courtesy of traders’ expectations for a less aggressive Fed, following the release of US economic data, suggesting economy activity slowed. Also, UK’s tax cut budget has been put aside by the Chancellor of the Exchequer, Kwasi Kuarteng, as it triggered market turmoil. At the time of writing, the EUR/JPY is trading at 142.14.
EUR/JPY Price Analysis: Technical outlook
From a daily chart perspective, the EUR/JPY is still neutral-to-upward biased, unable to crack above the 20-day EMA, located at 142.12. Even though the pair pierced the 20-day EMA, price action needs to get higher and break the YTD high at 145.63 to pave the way for further gains and shift the bias upwards. Nevertheless, the Relative Strength Index (RSI), even though it persists in positive territory, is almost flat, suggesting that the price is consolidating.
The EUR/JPY hourly chart depicts the formation of an ascending wedge, which usually is a bearish-biased chart pattern. Nevertheless, it should be noted that the EMAs reside below the spot price, so there would be some difficult hurdles to surpass on the way south.
Therefore, the EUR/JPY first support would be the 20-EMA at 141.92, followed by the 50-EME at 141.81, ahead of the bottom trendline of the wedge, around 141.70. Once cleared, the next support would be the S1 daily pivot point at 141.45, followed by the confluence of the S2 pivot and the 100-EMA at 140.80.
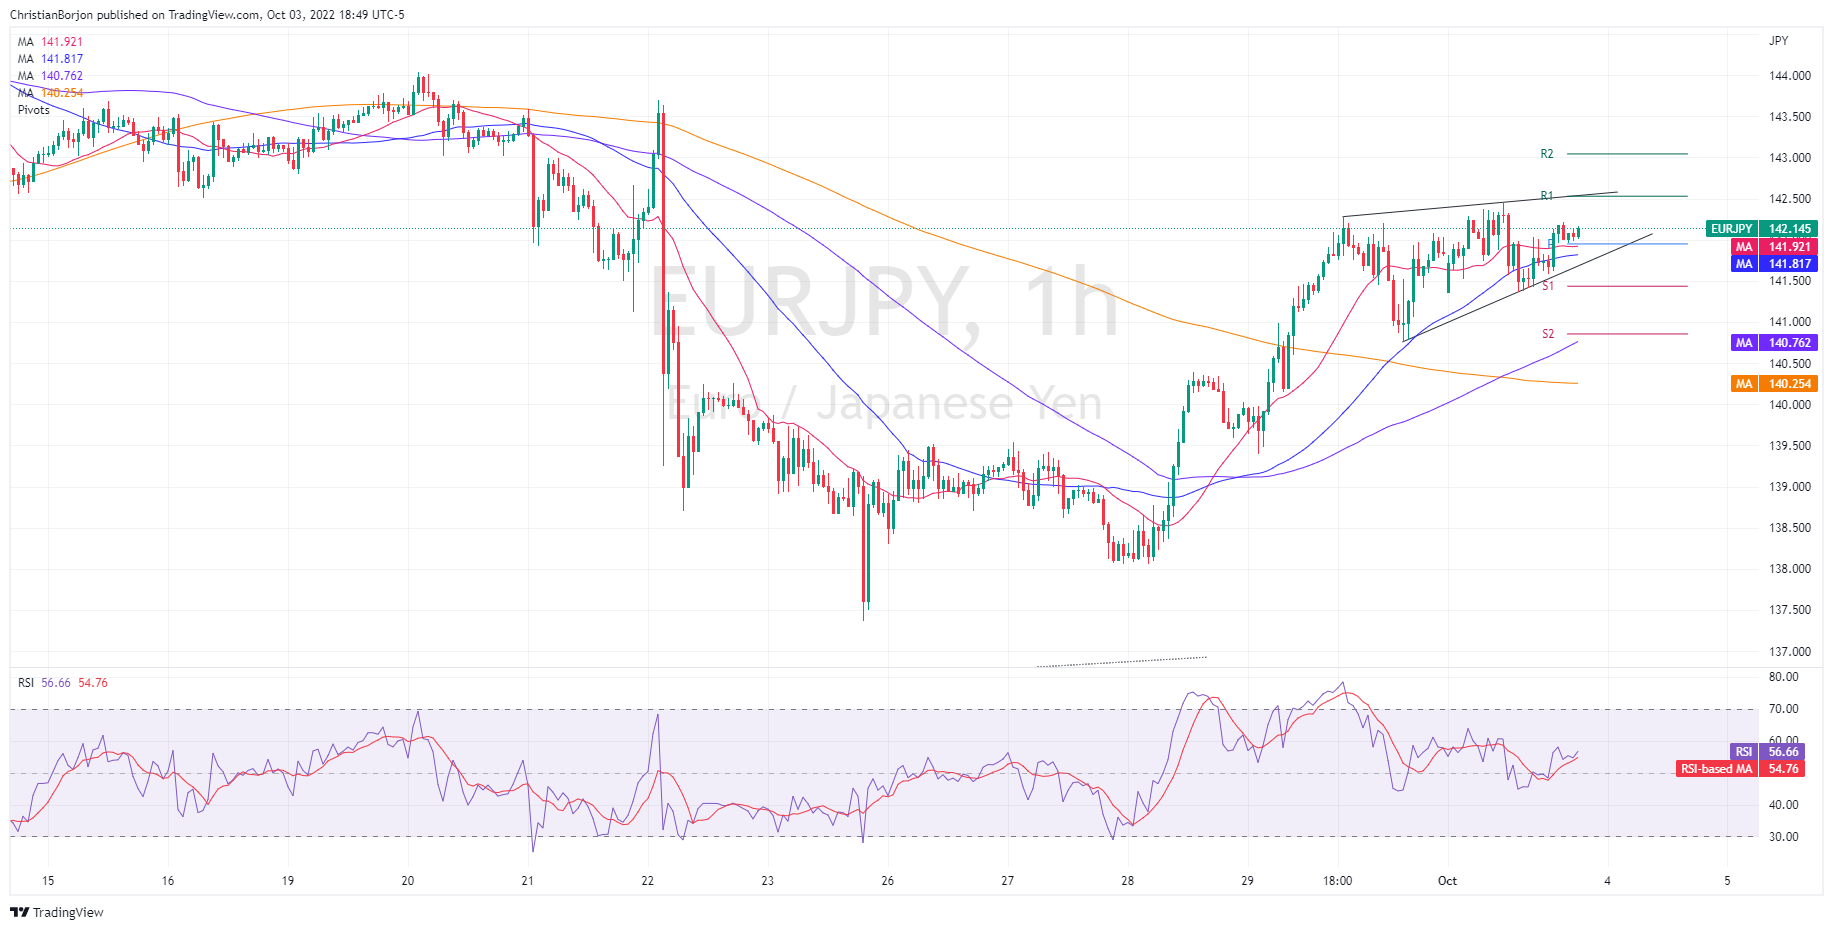
EUR/JPY Key Technical Levels
-
00:34
Japan Tokyo CPI ex Fresh Food (YoY) meets forecasts (2.8%) in September
-
00:33
Japan Tokyo Consumer Price Index (YoY) came in at 2.8%, below expectations (3%) in September
-
00:32
Japan Tokyo Consumer Price Index (YoY) came in at 0.3% below forecasts (3%) in September
-
00:31
Japan Tokyo CPI ex Food, Energy (YoY) above forecasts (1.5%) in September: Actual (1.7%)
-
00:31
Japan Tokyo CPI ex Fresh Food (YoY) above forecasts (2.8%) in September: Actual (2.9%)
-
00:31
Japan Tokyo Consumer Price Index (YoY) came in at 2.8%, below expectations (3%) in September
-
00:27
GBP/USD advances towards 1.1400 on UK’s reverse tax cut move, US NFP in focus
- GBP/USD is marching towards 1.1400 as pound bulls got strengthened on UK’s U-turn on tax cut move.
- More liquidity in the palms of individuals due to tax cuts would have offset the impact of policy tightening.
- Fed’s tight monetary policy stance has trimmed the extent of manufacturing activities.
The GBP/USD pair is gathering momentum in the early Tokyo session to cross Monday’s high at 1.1334. The cable has been strengthened after witnessing a north-side break of the consolidation formed in a 1.1029-1.1232 range. The asset is expected to hit the critical resistance of 1.1400 sooner as the UK government’s U-turn move on tax cuts has infused fresh blood into the pound bulls. Adding to that, the weaker US dollar index (DXY) is a cherry on the cake.
On Monday, the report came from British Prime Minister Liz Truss and Finance Minister Kwasi Kwarteng citing that the administration would reverse a cut to the higher rate income tax causing UK gilt yields to fall sharply. As reports from Kwarteng’s office confirmed that the government is not proceeding with the abolition of the 45p tax rate, pound bulls displayed a long-lasting ball.
The market participants were blaming the administration for progressing with monetary easing in the UK economy as the Bank of England (BOE) is already addressing the troublesome job of containing the mounting price pressures. More liquidity in the palms of individuals due to tax cuts would have offset the impact of policy tightening measures taken at the time.
Meanwhile, the US dollar index (DXY) has established confidently below 112.00 and is looking to extend correction further. US economic fundamentals are deteriorating now as soaring interest rates by the Federal Reserve (Fed) have forced the manufacturers to trim their usage of production capacities. A decline in US ISM Manufacturing PMI data to 50.9 vs. the expectations of 52.2 and the prior release of 52.8 activated seller in the counter.
This week, the US Nonfarm Payrolls (NFP) will hog the limelight. As per the consensus, the US economy created 250k jobs in September against the August reading of 315k. While the jobless rate will remain steady at 3.7%.
-