Notícias do Mercado
-
23:59
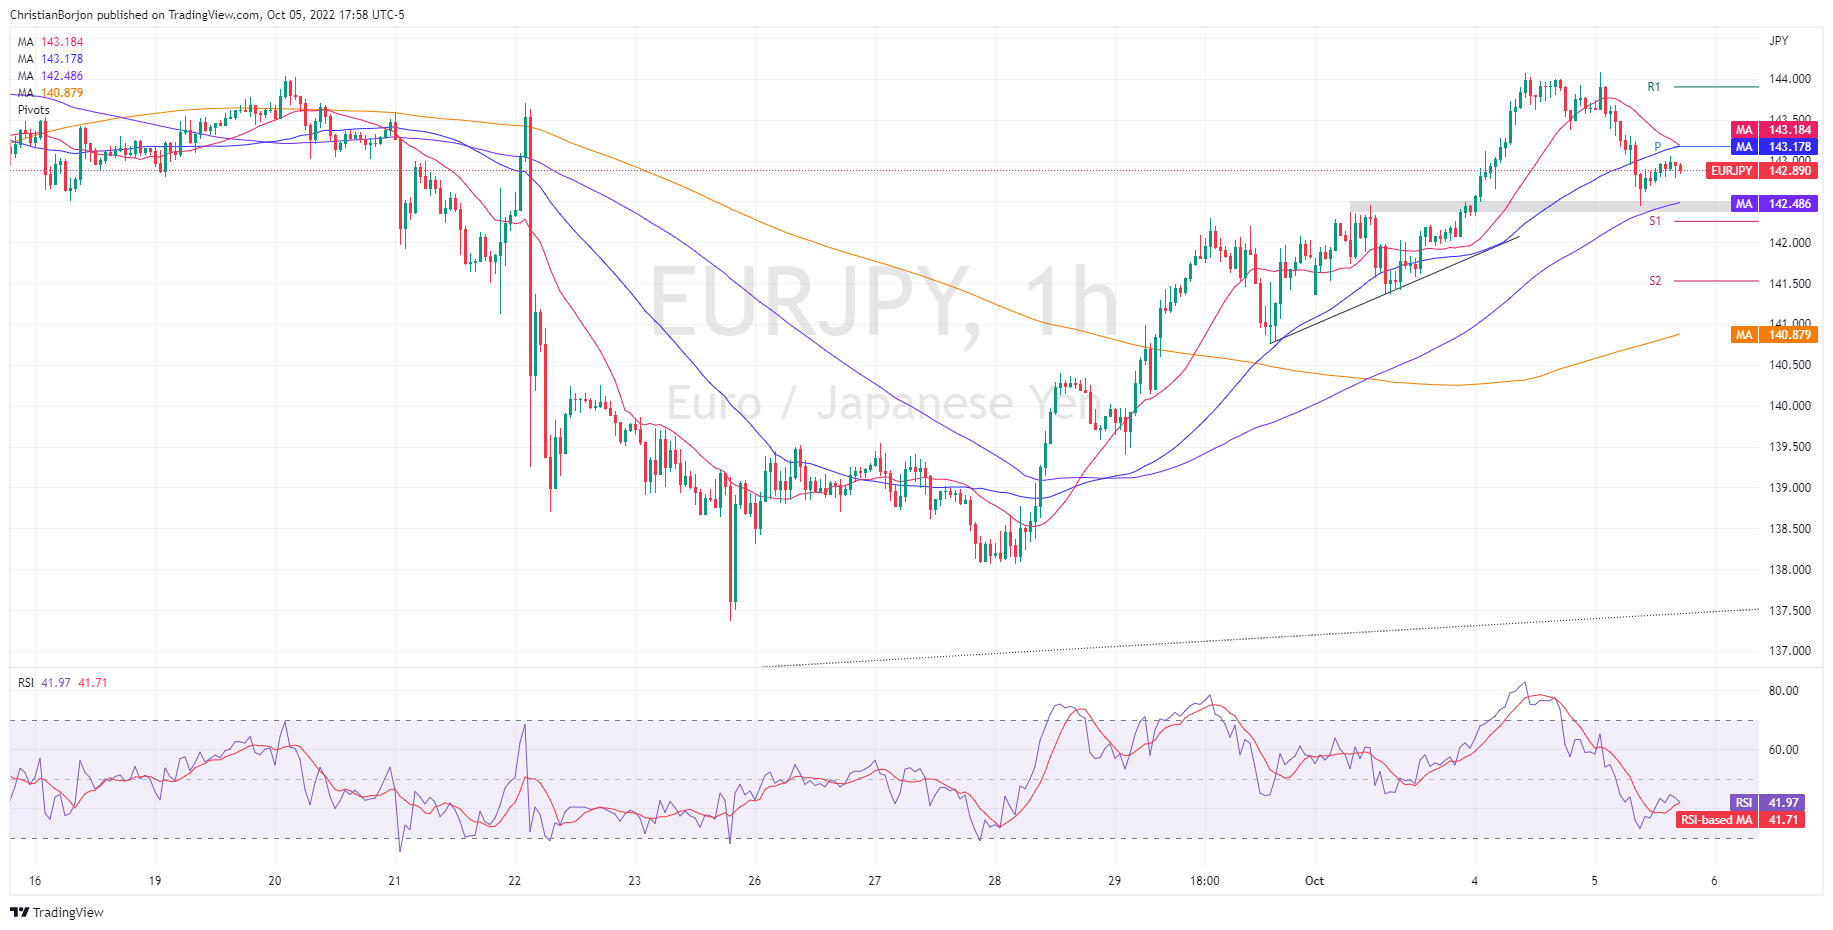
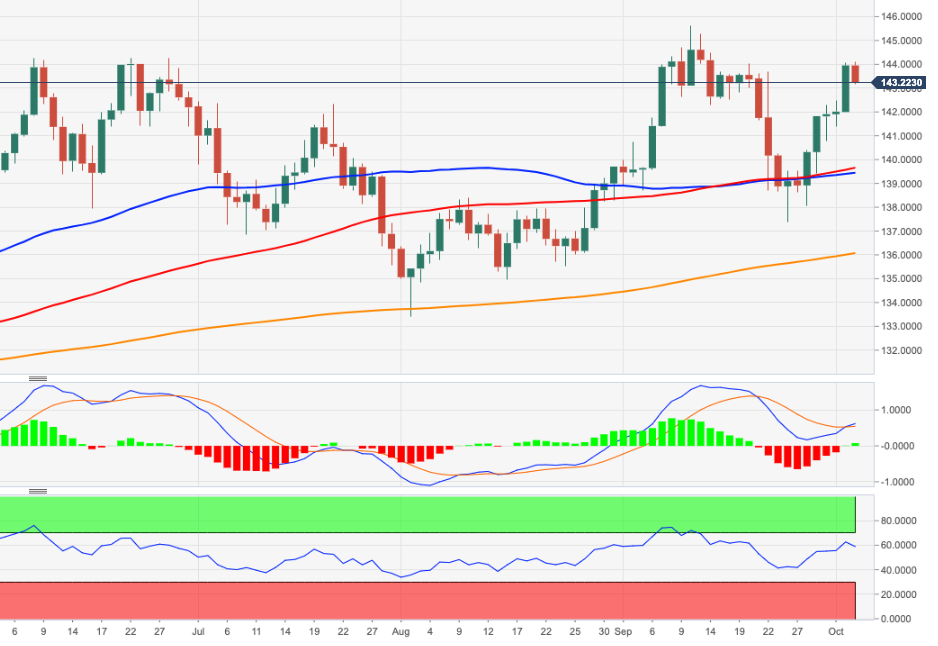
EUR/JPY Price Analysis: A bearish harami in the daily chart could pave the way towards 142.00
- EUR/JPY sellers stepped in around 144.00, sending the pair sliding below 143.00.
- A bearish harami candle pattern in the daily chart suggests the EUR/JPY might be headed to the downside.
- Short term, the EUR/JPY hourly chart portrays the 20-EMA crossing under the 50-EMA, opening the door for a resumption of the downtrend.
The EUR/JPY retreats from weekly highs, as traders dump riskier assets, as market participants assess that a Fed “dovish” pivot might not happen, as Fed policymakers reiterated that further rate hikes are coming. At the time of writing, the EUR/JPY is trading at 142.88, below its opening price as the Asian session begins.
EUR/JPY Price Analysis: Technical outlook
The EUR/JPY rally stalled around 144.00 as Wednesday’s price action opened near Tuesday’s close and hit a daily low at 142.44 before closing at 142.98. Traders should be aware that a bearish-harami candle chart pattern emerged, as shown by the EUR/JPY daily chart. Therefore, if the EUR/JPY breaks decisively, October’s 5 low of 142.44 could pave the way for further losses.
The EUR/JPY’s first support would be the 20-day EMA at 142.11, which, once cleared, will expose the 142.00 mark.
In the one-hour scale, the EUR/JPY depicted a double top chart pattern, fulfilled through Wednesday’s session, falling towards the October 3 high at 142.46 before bouncing off toward the current exchange rate. Nevertheless, the 20-EMA is about to cross under the 50-EMA around 143.18, which coupled with the RSI’s aiming lower in bearish territory, could open the door for a resumption of the downtrend.
Therefore, the EUR/JPY first support would be the confluence of October’s 3 low and the 100-EMA at 132.44/48. The break below will expose the S1 daily pivot at 142.26, followed by the S2 pivot point at 141.50, ahead of the 200-EMA at 140.88.
EUR/JPY Key Technical Levels
-
23:51
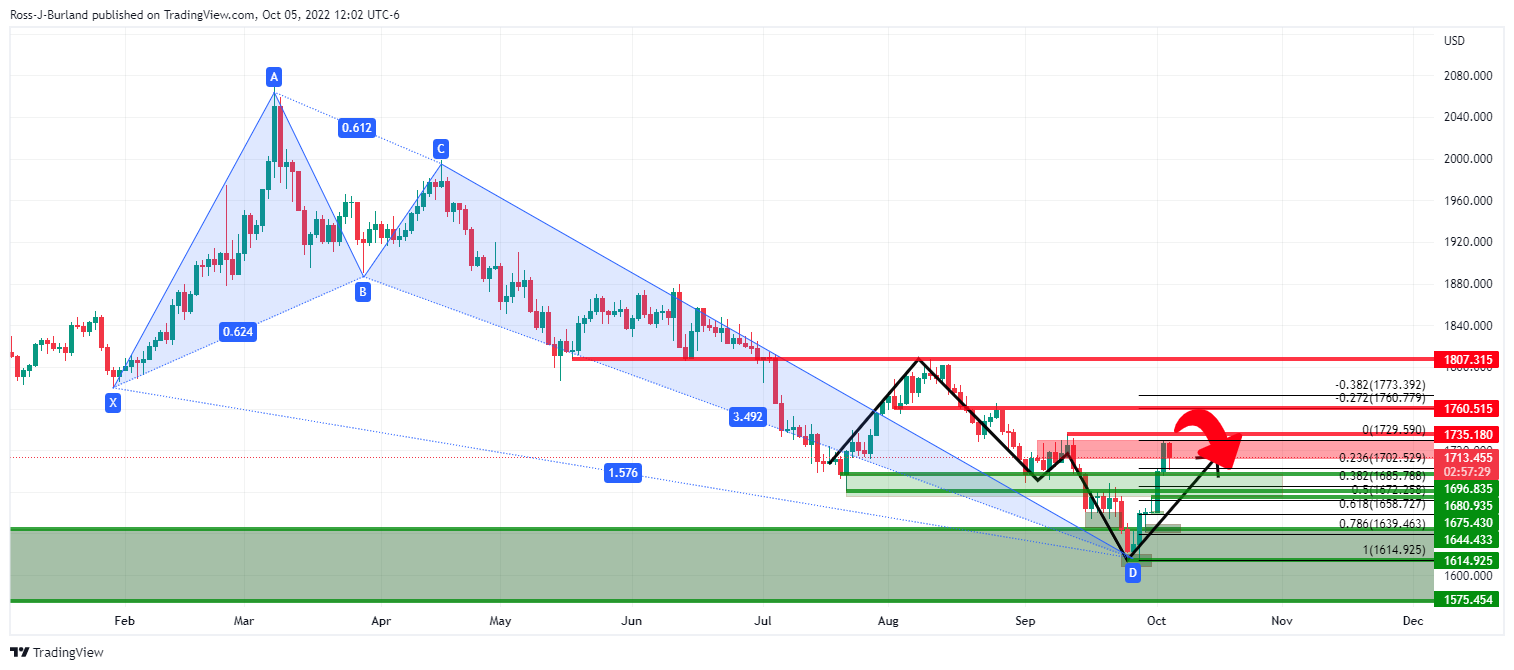
Gold Price Forecast: XAU/USD aims to extend recovery above $1,720 as focus shifts to US NFP
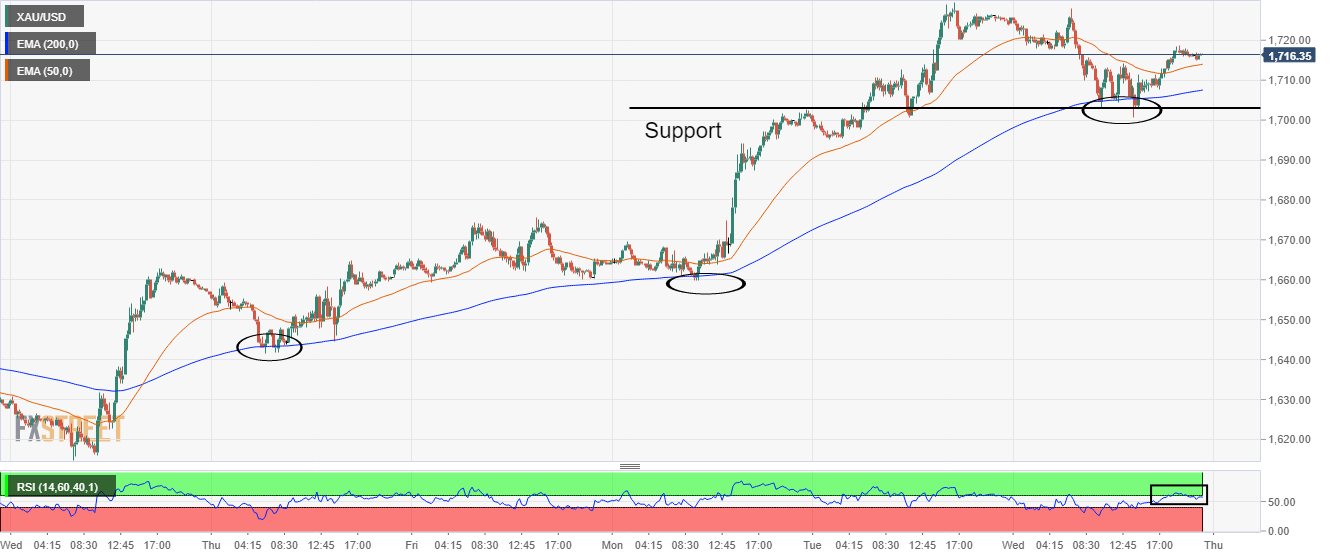
- Gold price has resumed its upside journey after a pullback to near $1,700.00.
- Escalating Japan-North Korea tensions are turning the risk-profile wheel to the negative side.
- After bumper US ADP data, upbeat NFP numbers would soar the odds of a 75 bps rate hike further.
Gold price (XAU/USD) has turned sideways after sensing demand around the critical support of $1,700.00. The precious metal is aiming to cross the $1,720.00 hurdle and will find its next barricade around $1,730.00. The yellow metal is holding its gains while the market sentiment is turning negative on escalating tensions between Japan and North Korea.
The option of announcing a third consecutive 75 bps rate hike by the Federal Reserve (Fed) is getting votes now. Earlier, the San Francisco Fed President Mary Daly said that inflation remains high, adding that more rate hikes are needed. She emphasized that the Fed is “resolute” on raising rates further to bring inflation down.
Apart from that, upbeat payroll data dictated that the pace of hiring by the corporate is not slowed down yet. The US Automatic Data Processing (ADP) data reported higher at 208k vs. the prior release of 200k. Also, a better-than-projected US ISM non-manufacturing gamut is hinting that the overall demand is still solid.
On Friday, the release of the US Nonfarm Payrolls (NFP) will display a true picture of the labor market status. As per the consensus, the economy has added 250k fresh jobs lower than the reading of 315k reported for August.
Gold technical analysis
Gold prices have bounced back sharply after sensing a significant buying interest around the horizontal support placed from October 10 high at $1,702.62. The 200-period Exponential Moving Average (EMA) has acted as major support for the counter. Also, the termination of a corrective move to near $1,700.00 has pushed the gold prices back above the 50-EMA at around $1,714.00.
Meanwhile, the Relative Strength Index (RSI) (14) is hovering around 60.00 and is looking to establish above the same.
Gold intraday chart
-
23:17
AUD/USD corrects to near 0.6500 as hawkish Fed bets soar
- AUD/USD has surrendered the 0.6500 cushion as firmer US ADP has spurted the hawkish Fed bets.
- The release of better-than-projected payroll data and ISM Services PMI data soared DXY’s appeal.
- Market mood has turned sour as North Korea launched a missile in early Tokyo.
The AUD/USD pair has dropped marginally below the psychological support of 0.6500 after facing barricades around the usual resistance of 0.6520, acting firmer for the past few trading sessions. The risk-off profile has got traction back amid escalating Japan-North Korea tensions. Kim Jong-un region is continuously firing missiles and one has been reported outside Japan’s EEZ-NHK in early Tokyo. Also, the 10-year Treasury yields are holding them at elevated levels above 3.75% while writing.
Meanwhile, the US dollar index (DXY) is expected to oscillate above 111.20 and will later resume recovery further. A firmer demand has been recorded at around 110.00, which will continue its upside momentum on higher-than-expected US ISM Services PMI data. The economic data has landed at 56.7, higher than the expectations of 56.0. Also, the New Order Index that illustrates forward demand has been reported higher at 60.6 vs. the projections of 58.9.
Apart from that, a release of better-than-projected US Automatic Data Processing (ADP) Employment data has spurted the odds of a fourth consecutive 75 basis point (bps) rate hike by the Federal Reserve (Fed). According to US ADP payroll data, the US economy has added 208k jobs than the estimates of 200k which has pushed the odds for a 75 bps rate hike to 67.8%, showed by the CME Fedwatch tool.
On the Aussie front, investors are still in a hangover from an initial extent rate hike announcement by the Reserve Bank Australia (RBA). It is worth noting that the alternative of 25 bps rate hike was in consideration of RBA policymakers as it was discussed in September monetary policy meeting but was not announced.
-
23:02
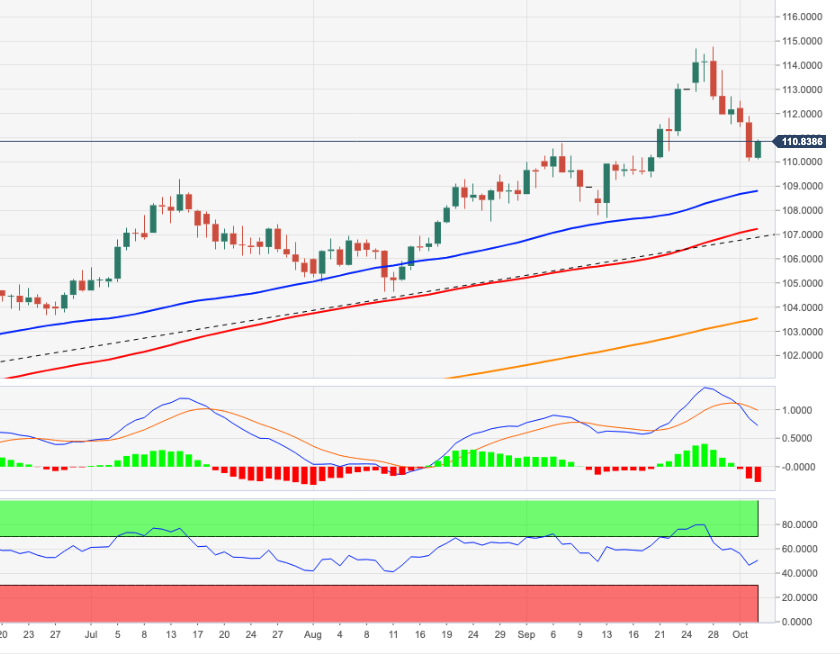
USD/CAD Price Analysis: Inverted head-and-shoulders in the hourly chart targets 1.3877
- USD/CAD found support around 1.3500, some pips above the 20-day EMA.
- In the short term, the USD/CAD one-hour chart formed an inverse head-and-shoulders, which targets the pair to hit 1.3877.
The USD/CAD cuts two days of losses and rises almost 0.80% as the New York session winds down due to some factors. Firstly, market sentiment deteriorated as traders assessed that a Fed “dovish” pivot was nowhere near to happening, so the greenback recovered against most G8 currencies. Therefore, the USD/CAD is trading at 1.3620, above its opening price.
USD/CAD Price Analysis: Technical outlook
The USD/CAD faced solid support at 1.3500, the 38.2% Fibonacci retracement, 50-pips above the 20-day EMA, after plunging from the YTD high above 1.3800. Traders should be aware that price action in the last couple of days formed a tweezers-bottom, meaning that prices would likely increase. However, after dropping from oversold levels, RSI’s flat slope suggests the pair might consolidate before determining its direction.
The USD/CAD one-hour chart portrays the pair as forming an inverted head-and-shoulders chart pattern, though to validate it, the major needs to clear the neckline at around the R1 daily pivot at 1.3707. Once broken, the next resistance would be the R2 pivot at 1.3797, followed by the inverted head-and-shoulders chart pattern target at 1.3877.
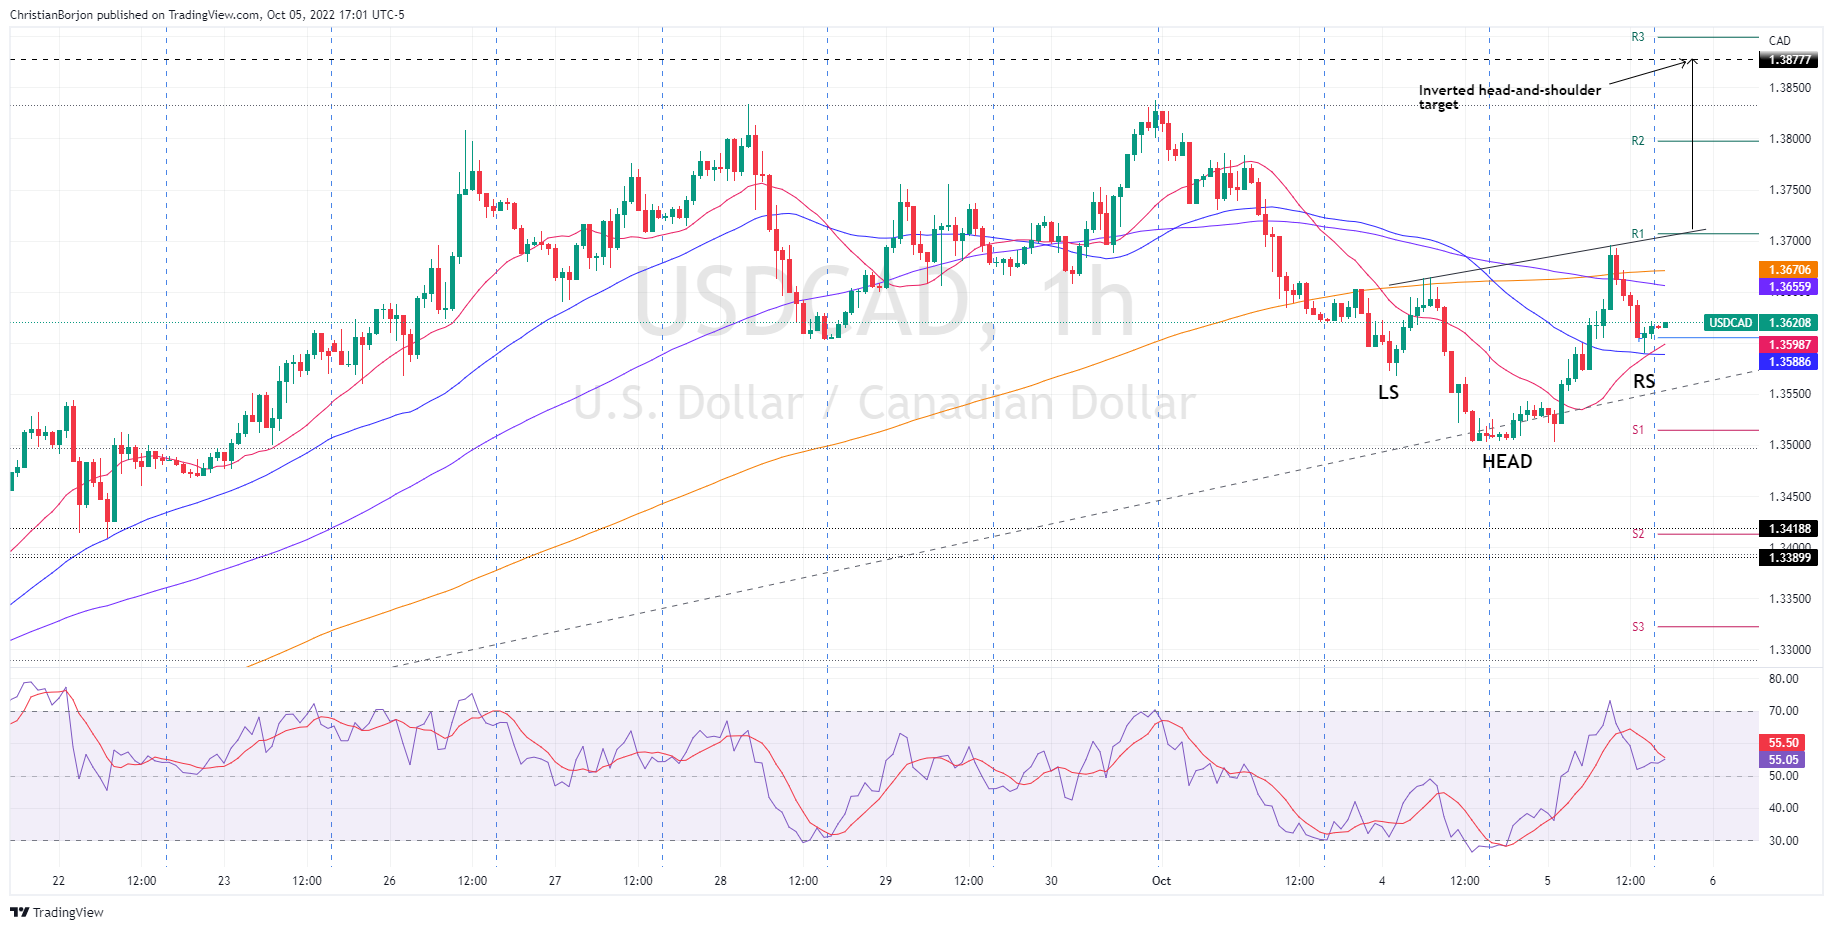
USD/CAD Key Technical Levels
-
22:40
GBP/USD Price Analysis: Bears engage at a key 61.8% ratio
- GBP/USD bears firm-up in early Asia and eye a test below 1.1300.
- There are risks of lower still while below a 61.8% ratio on the hourly chart.
GBP/USD has come under pressure to test the 1.1300 level following a resurgence in the US dollar on Wednesday. The US dollar index, DXY, was last seen up near to 1% at 111.21 but it had been as high as 111.735 overnight.
US yields rallying has helped to prop up the US dollar as the money markets price out overall optimistic speculation over a Federal Reserve pivot. The yield on the US 10-year note was up a high of 3.78%.
The following illustrates the price action across the assets resulting in the sell-off in the pound and offers scenarios for the rest of the week leading to the Nonfarm Payrolls event on Friday.
US yields
US dollar
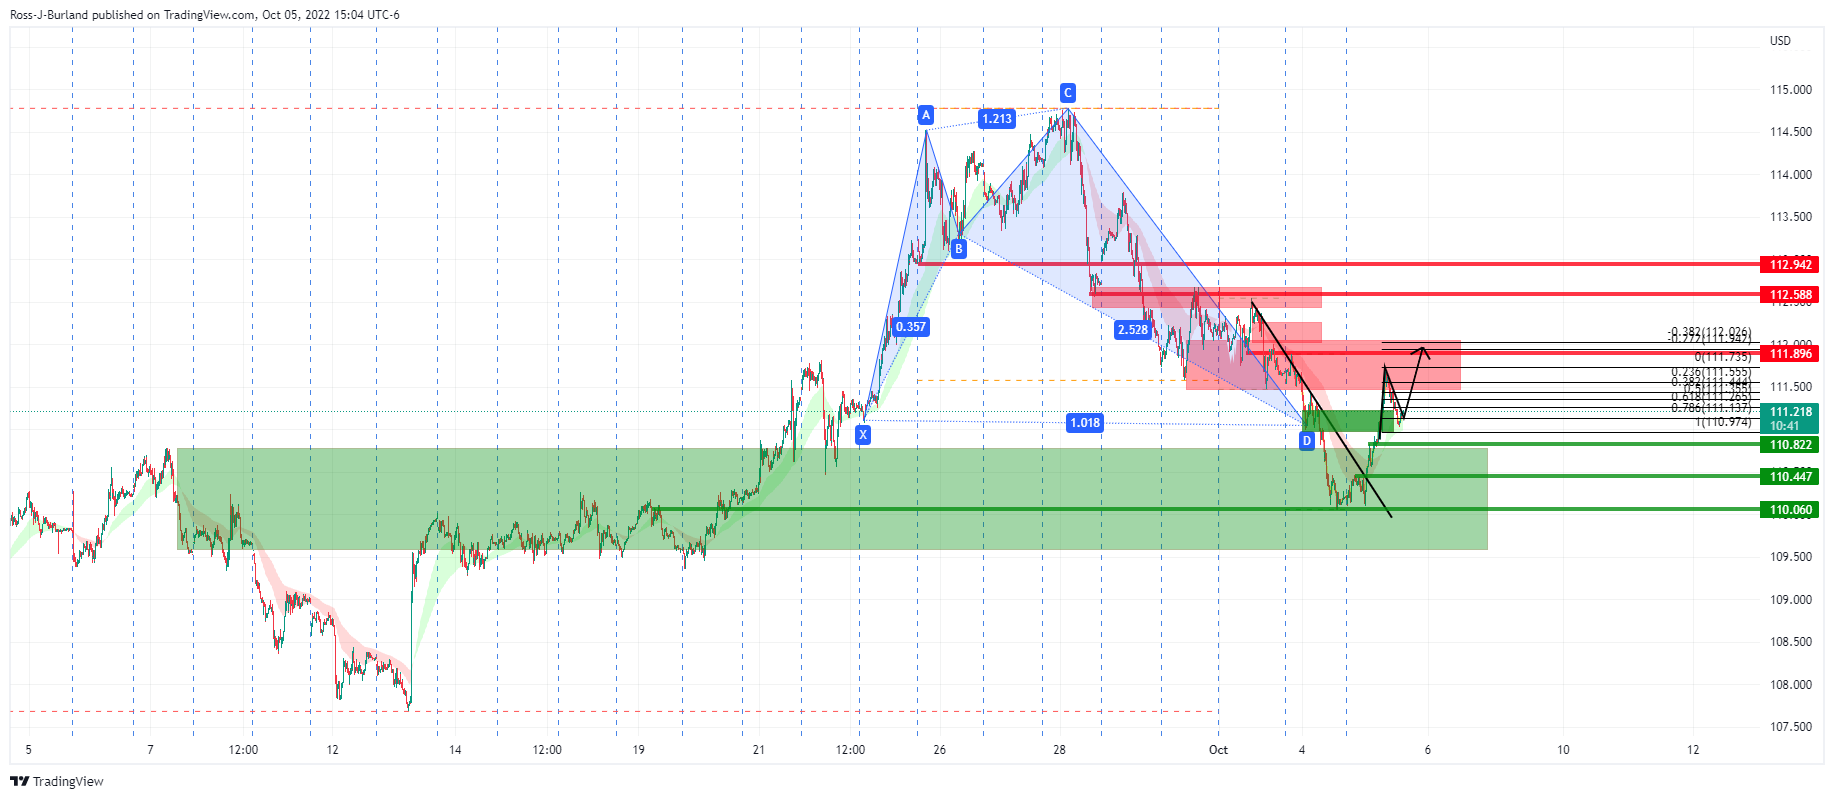
The greenback, as measured by the DXY index, has consequently rallied on the day but corrected into a support structure.
This structure would be expected to see the index extend the bullish correction and move in on the 112 area.
GBP/USD H1 chart
GBP/USD will remain bearish while below the 61.8% Fibonacci retracement level near 1.1350 and there are prospects of a downside continuation for the day ahead putting heat on committed bulls near 1.1200.
-
22:33
Australia AiG Performance of Construction Index fell from previous 47.9 to 46.5 in September
-
22:28
North Korea appears to have fired missiles again towards Japan
North Korea appears to have fired missiles again according to the Japanese coast guard.
Earlier in the week, Japan urged residents to take shelter after North Korea had been reported to have fired a ballistic missile over the north of the country.
It was the North's first missile launch over Japan since 2017.
The US, Japan and South Korea conducted their own military drills in response.
This escalation of Pyongyang’s missile tests has prompted immediate backlash from Tokyo and has put markets on risk-off alert.
-
22:21
Fitch Revises the Bank of England's Outlook to Negative; affirms at 'AA-'
Fitch Ratings has revised the Outlook on the Bank of England's (BoE) Long-Term Foreign-Currency (LTFC) Issuer Default Rating (IDR) to Negative from Stable and affirmed the IDR at 'AA-'.
Fitch reports that it has ''revised the Outlook on the UK's sovereign rating of 'AA-' to Negative from Stable. The BoE's Long-Term Foreign-Currency IDR is directly aligned with that of the UK sovereign. The BoE is the monetary arm of the UK sovereign and as such its credit profile is aligned with that of the sovereign government.
Fitch currently only rates the BoE's three-year maturity US dollar bonds. The rating does not apply to typical central bank liabilities of the BoE, such as bank notes or commercial bank reserves that are monetary liabilities rather than rateable debt.
The BoE's rating reflects the bank's central role in the UK and international financial system. The rating is underpinned by support from the UK sovereign. The near certainty of sovereign support for the BoE derives from its national strategic importance, as well as its ownership by the UK Treasury.''
GBP/USD update
Meanwhile, the price of cable is bearish while below the 61.8% Fibonacci retracement level near 1.1350 and there are prospects of a downside continuation for the day ahead:

-
22:14
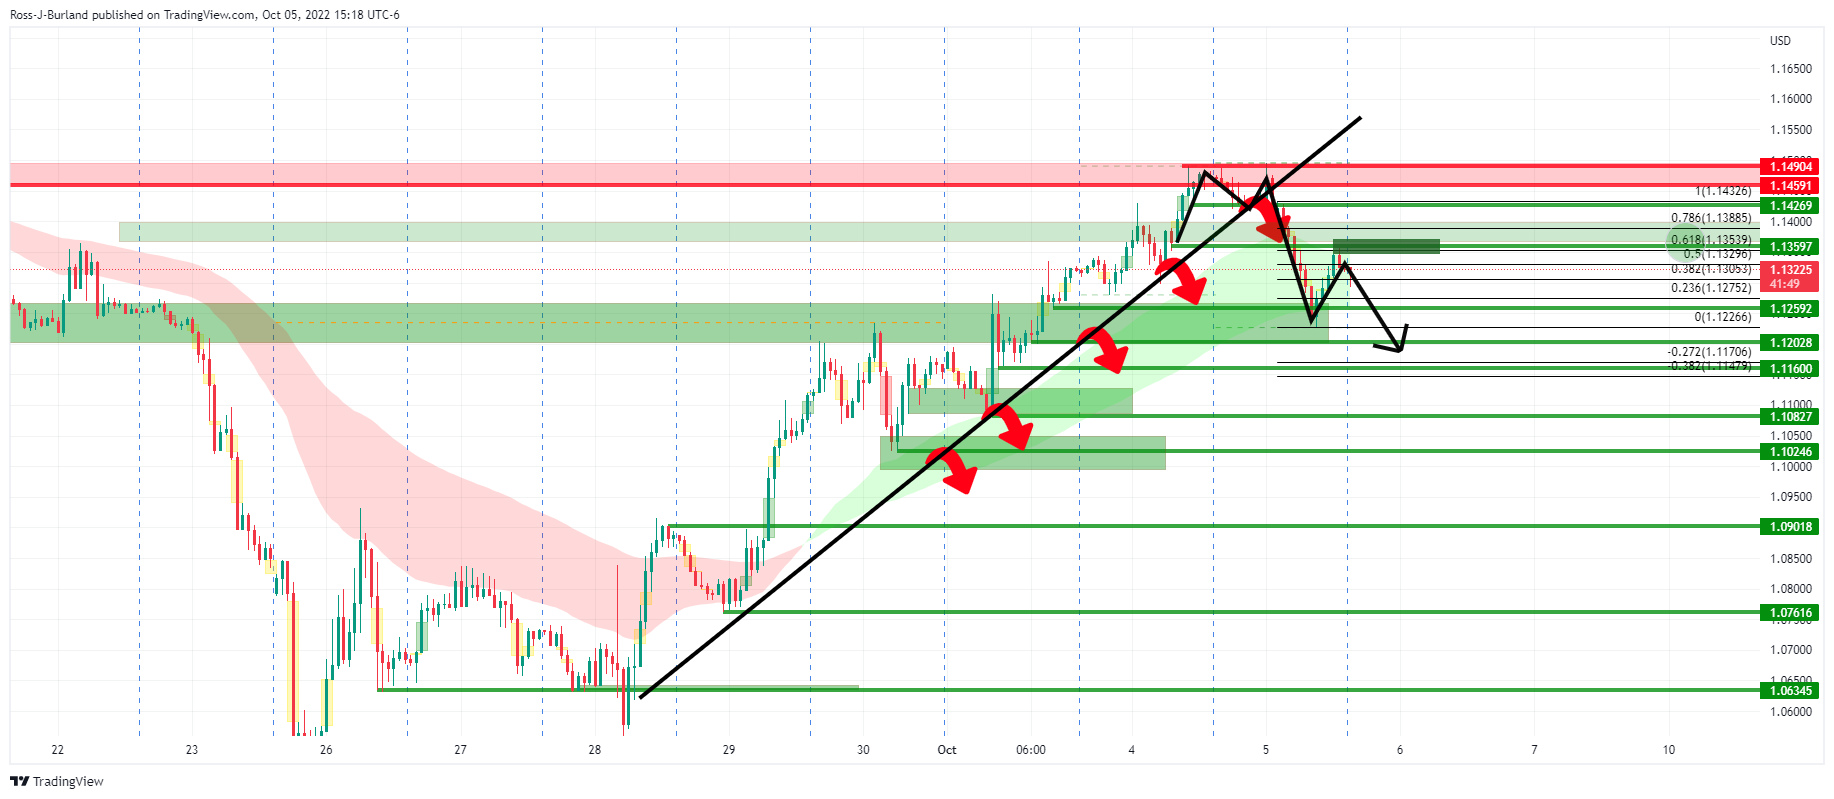
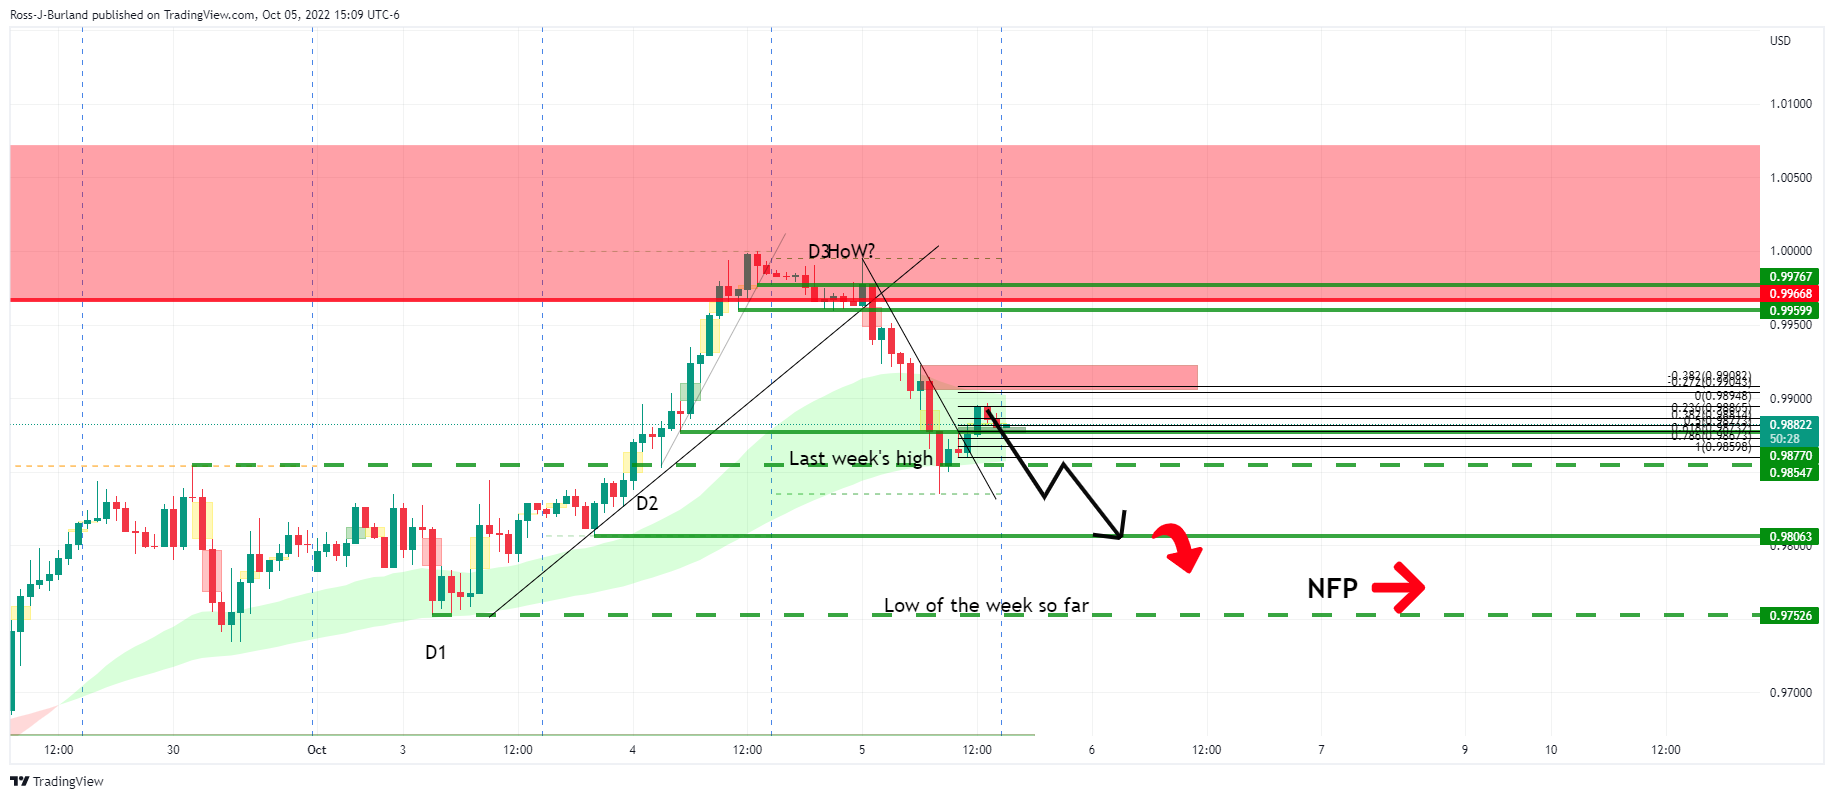
EUR/USD Price Analysis: Bears take the Day-2 bulls to the cleaners
- EUR/USD bears move in on day 3 of the weekly template and crush committed bulls.
- The day 2 trend traders were wiped out on Wednesday, but bulls are trying to reemerge.
The euro has come under pressure following a resurgence in the US dollar on Wednesday. The US dollar index, DXY, was last seen up 1% at 111.20 but it had been as high as 111.735. A tear in US yields has helped to prop up the US dollar as the money markets to price out overall optimistic speculation over a Federal Reserve pivot. The yield on the US 10-year note was up a high of 3.78%.
The following illustrates the price action across the assets resulting in the sell-off in the euro and offers scenarios for the rest of the week leading to the Nonfarm Payrolls event on Friday.
US yields
US dollar
The greenback, as measured by the DXY index, has consequently rallied on the day but corrected into a support that would be expected to see the index extend the bullish correction and move in on the 112 level.
However, should the index's support crumble, the euro will start to correct the recent sell-off significantly:
EUR/USD weekly template
The price has followed a 1,2,3 day count and has potentially put in a high for the week at resistance, as illustrated on the chart above. The price broke out of the front side of the trendline support on day 2 and crumbled on day 3 putting in a peak formation in Asia following two days of rising from the low of the week, so far.
EUR/USD H1, zoomed
We are waiting for this week's Nonfarm Payrolls, NFP, on Friday, but the price action is teeing up a move higher given the low's pin and the hourly W-formation that has formed. A restest into the neckline, or close to it, can be expected and is already underway. Thereafter, the bulls could be encouraged for a move up towards 0.9920 with the price creeping out of the front side of the trendline resistance.
If, on the other hand, the bears stay the course, on a break of 0.9800, we will be looking at a move towards the week's lows at 0.9752:
-
22:00
South Korea FX Reserves dipped from previous 436.43B to 416.77B in September
-
21:46
NZD/USD hovers around 0.5730s, almost flat amidst a risk-off impulse
- NZD/USD gains some 0.15% after hitting a daily low at 0.5660.
- The RBNZ’s hiking 50 bps on Wednesday capped the NZD/USD fall, despite US dollar strength.
- US employment data shows solid hiring continues; Services PMIs were mixed.
The NZD/USD erases some of its earlier losses as Wall Steers closes with minimal losses, as sentiment improved in the last hour of the New York session. Nevertheless, traders’ narrative for a possible pivot should be set aside as Fed officials continue their hawkish rhetoric. At the time of writing, the NZD/USD is trading at 0.5746, above its opening price by 0.28%.
NZD/USD trims earlier losses, despite a solid US dollar
Earlier, the San Francisco Fed President Mary Daly said that inflation remains high, adding that more rate hikes are needed. She emphasized that the Fed is “resolute” on raising rates further to bring inflation down.
Data-wise, the US economic docket revealed that S&P Global Services and Composite PMIs, improved but remained below the 50 expansion/contraction level. Contrarily, the ISM Non-Manufacturing PMI remained at expansionary territory, at 56.7, exceeding expectations, but below August’s 56.9.
Meanwhile, the ADP National Employment data portrayed that US companies remain hiring at a solid pace, adding 208K jobs to the labor force, exceeding estimates of 132K and a prelude to Friday’s Nonfarm Payrolls figures. Some minutes later, the US Commerce Department revealed that the US Trade deficit narrowed by 4.3% to $67.4 billion in August, the lowest since May 2021.
The NZD/USD traded as low as 0.5660 before jumping back above the 0.5700 figure, pairing the earlier drop. In the meantime, the US Dollar Index, a gauge of the buck’s value against a basket of peers, gains 0.90%, at 111.187, snapping five days of losses.
On the New Zealand side, the Reserve Bank of New Zealand (RBNZ) hiked rates as expected, 50 bps. Additionally, the RBNZ’s Governor Orr commented that further rate hikes were coming and added that the board discussed going 50 or 75 bps, contrary to what the RBA did a day before.
What to watch
The New Zealand Economic docket is empty. On the contrary, the US calendar will feature Initial Jobless Claims, alongside further Fed speaking.
NZD/USD Key Technical Levels
-
21:03
Fed's Bostic: Federal Reserve's fight against inflation is likely “still in early days”
In prepared remarks to the Northwestern University Institute for Policy Research, Atlanta Fed president Raphael Bostic said on Wednesday that the US Federal Reserve's fight against inflation is likely "still in early days."
Despite "glimmers of hope" in recent data, Bostic said "the overarching message I’m drawing...is that we are still decidedly in the inflationary woods, not out of them," with the Fed's target funds rate needing to rise to around 4.5% by the end of the year.
Bostic said he would like to cap rates at that point long enough to assess where the economy is heading. But that does not imply rate cuts would follow. The Fed's singular focus is that inflation head decisively back to the central bank's 2% target.
There is "considerable speculation already that the Fed could begin lowering rates in 2023 if economic activity slows and the rate of inflation starts to fall," Bostic said. "I would say: not so fast."
"We should not let the emergence of (economic) weakness deter our push to lower inflation," Bostic said. "We must remain vigilant because this inflation battle is likely still in early days."
The Fed meets again on Nov. 1-2 with policymakers expected to approve another three-quarter point rate hike even in the face of global market volatility.
US dollar update
Meanwhile, the US dollar resurged on Wednesday. The US dollar index, DXY, was last seen up 1% at 111.15 but it had been as high as 111.735. A tear in US yields has helped to prop up the US dollar as the money markets to price out overall optimistic speculation over a Federal Reserve pivot. The yield on the US 10-year note was up to a high of 3.78%.
Today's data went some ways in supporting the greenback as it failed to buttress recent hopes the Fed might adopt a less hawkish policy stance.
The September ISM services index showed significant resilience in the face of rapid Fed tightening since March. ''At 56.7, the index rose for the 28th consecutive month and is more or less in line with the 20-year long-run average (57.5). In sum, service sector activity is not yet sufficiently below trend to exert strong downward pressure on inflation. Indicators of price pressures are slowing. The prices component was 68.7 vs 71.5 and the supplier deliveries index eased 0.6 to 53.9. Employment rebounded to 53.0 (+2.8) and new exports rose (+3.2 to 65.1), despite the strength in the US,'' analysts at ANZ Bank explained.
-
21:03
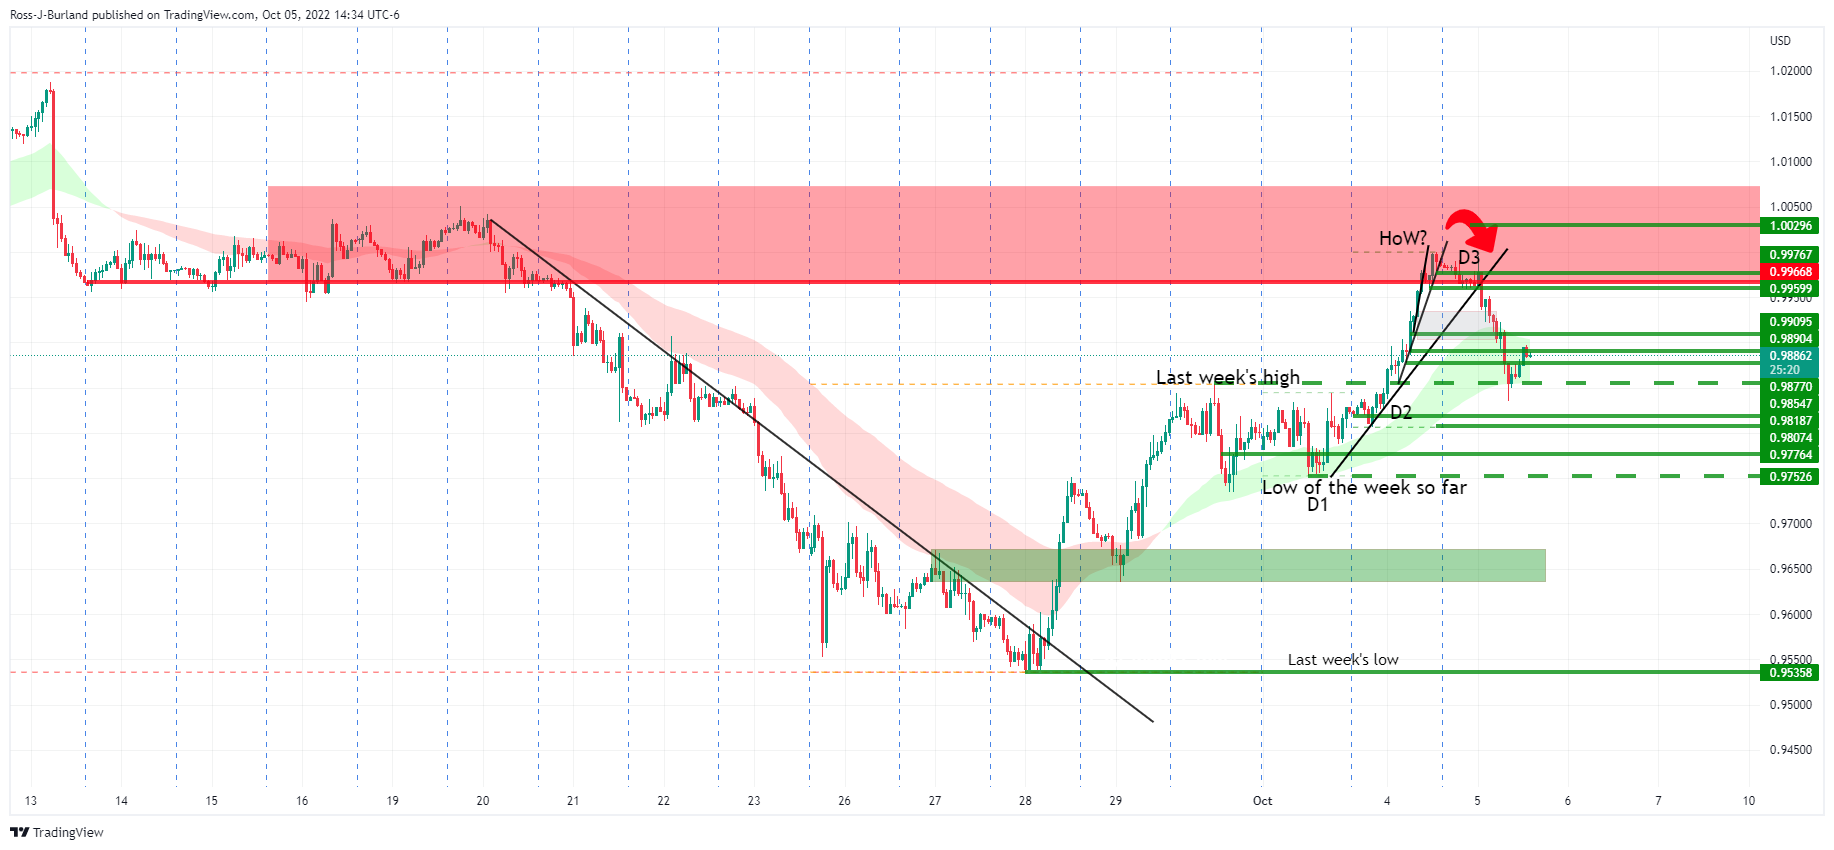
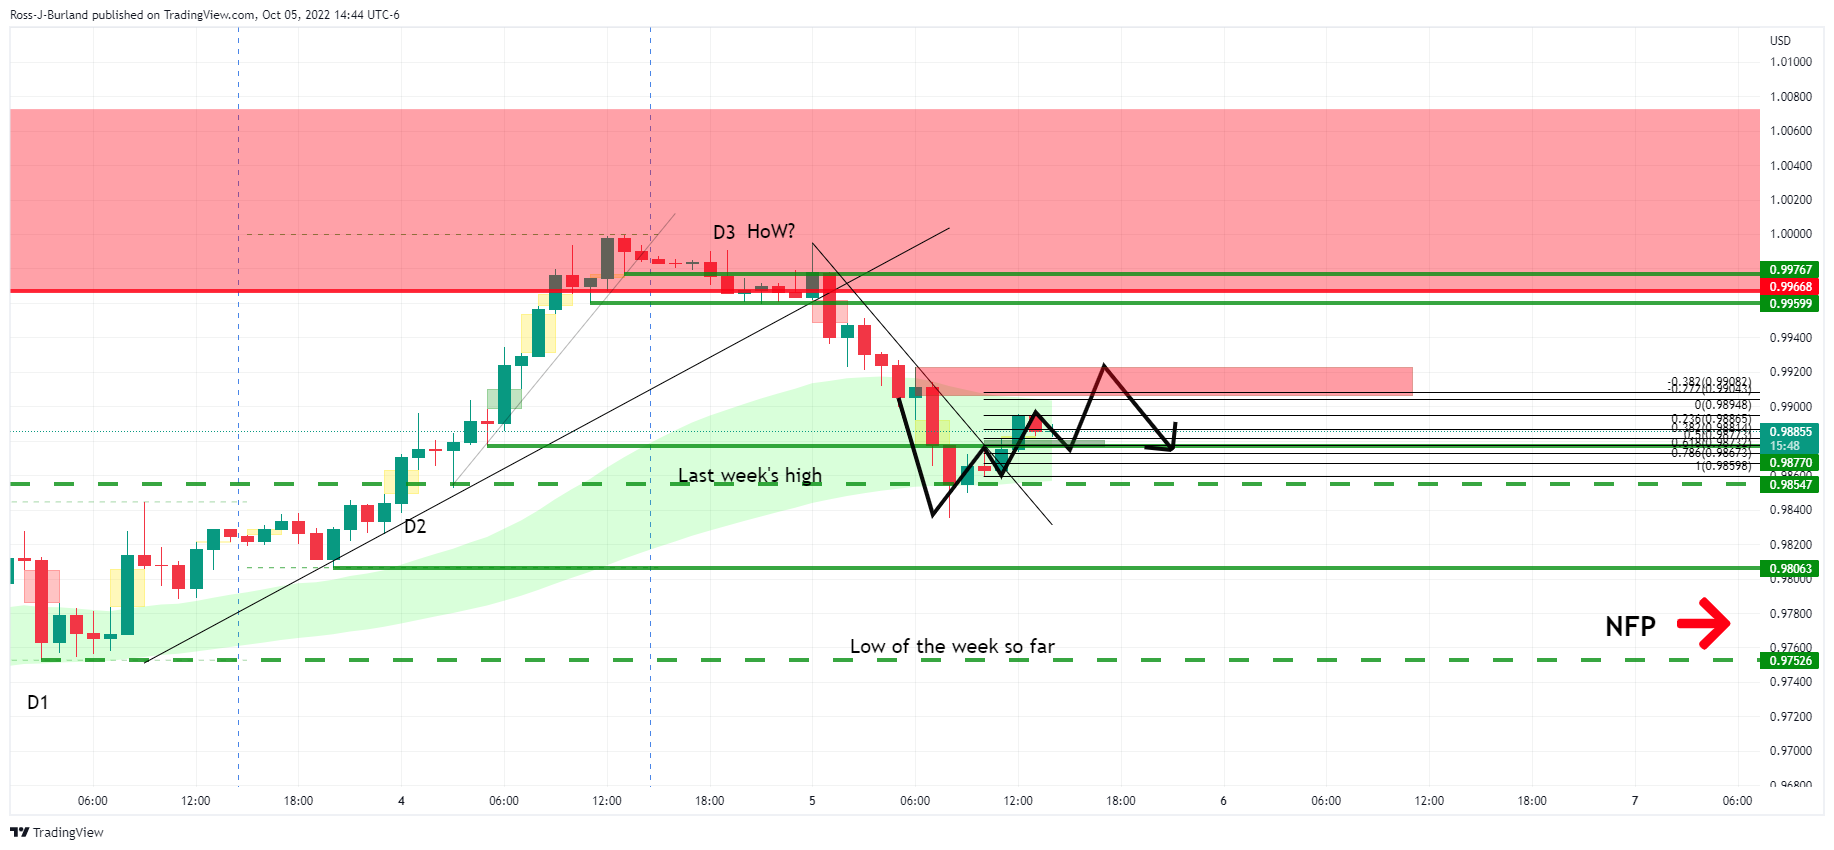
Forex Today: Optimism fade, but dollar bears remain
What you need to take care of on Thursday, October 6:
The dollar made a short-lived comeback on Wednesday, ending the day mixed across the FX board. Risk-off flows returned amid tensions between Europe and Russia, although the sentiment improved during US trading hours as the country released upbeat macroeconomic figures.
The European Union approved the eighth package of sanctions against Russia, including a price cap on Moscow’s crude oil and refined products. Russia’s Deputy PM Alexander Novak responded by saying his country would be willing to cut production to compensate for price caps, adding an oil price of $70 per barrel would be comfortable.
The United Kingdom is also planning to implement sanctions banning Russian services and limiting exports to the country.
At the same time, OPEC+, alongside key ministers from the involved nations, usually known as the Joint Ministerial Monitoring Committee, decided a cut oil production by 2 million barrels per day. They also announced they would no longer meet on a monthly basis.
Meanwhile, European Commission President Ursula von der Leyen also announced the Union is ready to discuss a temporary price cap on gas used to generate electricity, while the US White House reported the Department of Energy would release another 10 million oil barrels from the Strategic Petroleum Reserve. Finally, the Biden administration will consult with Congress on tools to reduce OPEC’s control over energy prices.
The EUR/USD pair currently trades around 0.9890, while GBP/USD trades around 1.1330. The USD/CAD finished the day with losses at around 1.3610, despite resurgent crude oil prices. WTI is now trading at around $87.90.
The AUD/USD pair, on the other hand, trimmed most of its early losses and hovers around 0.6500. USD/CHF is up to 0.9830, while USD/JPY remains pat at around 144.50.
Spot gold met buyers on a dip to $1,700, finishing the day at around $1,716.
Wall Street is mixed, with the Dow Jones Industrial Average posting modest gains, but the S&P500 and the Nasdaq Composite are currently in the red. Finally, US Treasury yields picked up, with the 10-year Treasury note currently yielding 3.75%.
Why Binance’s BUSD market cap growth is bullish for the BNB price
Like this article? Help us with some feedback by answering this survey:
Rate this content -
21:00
Argentina Tax Revenue (MoM): 2127.181B (September) vs 1731.319B
-
20:32
WTI bulls eye a break of highs to target Sep highs, back above critical $90bbls
- US oil prices rally higher on the OPEC cut and a drop in US oil inventories.
- US data improves this week, money markets price out overall optimistic speculation over a Federal Reserve pivot,
West Texas Intermediate crude is higher by some 1.58% having climbed from a low of $87.52 to a high of $88.41 breaking the prior day's highs like a knife through butter with a significant cut to production expected from OPEC+ that meets in Vienna. The cartel looks to buoy oil prices that have dropped by nearly 30% from their July highs.
Fears of slowing global demand had dragged the price of WTI down 37% from its peak in June," economist Jenny Duan at TD Economics said in a note, " and reports have said the group is considering cutting quotas by as much as two million barrels per day at the same time that Russia seeks to handicap a G7 initiative to cap the price paid for the country's oil to hamper its ability to fund its war in Ukraine.
''While the effective cut would be closer to 750k bpd, given OPEC's struggles to meet existing quota levels, an agreement of that magnitude would be bullish for the oil market nonetheless.''
''Indeed, it would translate to a production cut from current levels, while also highlighting the spare capacity concerns that elevate supply risks over a longer-term horizon,'' analysts at TDSecurities explained.
'The analysts argue that ''the bottom could be in for crude prices,'' given Dec22/Dec23 spreads have rallied substantially since fears of an 'imminent' Iran deal pushed time-spreads to their lows in August.
''Our return decomposition framework has suggested that crude markets are now dysfunctionally ignoring supply risks amid a broad-based decline in participation,'' the analysts argued further.
''While physical traders have continued to hold onto their elevated positioning in crude markets, an exodus from money managers has distorted price action. Open interest from swap dealers has also collapsed, pointing to limited client hedging flows. In turn, the group of producers may attempt to send a strong signal that prices have now reached the strike on the OPEC+ put in an attempt to encourage participation to return to futures markets.''
Meanwhile, the US dollar has resurged, making black gold more expensive for overseas buyers. The US dollar index, DXY, was last seen up 1% at 111.20 but it had been as high as 111.735. A tear in US yields has helped to prop up the US dollar as the money markets to price out overall optimistic speculation over a Federal Reserve pivot. The yield on the US 10-year note was up a high of to 3.78%.
Today's data went some ways in supporting the greenback as it failed to buttress recent hopes the Fed might adopt a less hawkish policy stance. The September ISM services index showed significant resilience in the face of rapid Fed tightening since March. ''At 56.7, the index rose for the 28th consecutive month and is more or less in line with the 20-year long-run average (57.5). In sum, service sector activity is not yet sufficiently below trend to exert strong downward pressure on inflation. Indicators of price pressures are slowing. The prices component was 68.7 vs 71.5 and the supplier deliveries index eased 0.6 to 53.9. Employment rebounded to 53.0 (+2.8) and new exports rose (+3.2 to 65.1), despite the strength in the US,'' analysts at ANZ Bank explained.
However, oil prices were also supported after the American Petroleum unexpected drop in US oil inventories of 1.77-million barrels last week, against analyst expectations for a 333,000-barrel rise. The Energy Information Administration will release official inventory figures later on Wednesday morning.
WTI technical levels
Moving down onto the hourly time frame, we can see that the price has been supported by an hourly 20/50 smoothed moving average cloud. It reacted by leaving a bullish pin-bar and a series of W-formations that have concreated in a bullish structure, the latest of which is seeing a correction that would be expected to drive in demand from the bulls that are awaiting a discount:
Zooming in, the structure in focus shows that there has already been a move by the bulls at a 38.2% Fibonacci retracement.
Zooming out, we can see the time template and last month's high as a potentially key target for the days ahead:
-
19:25
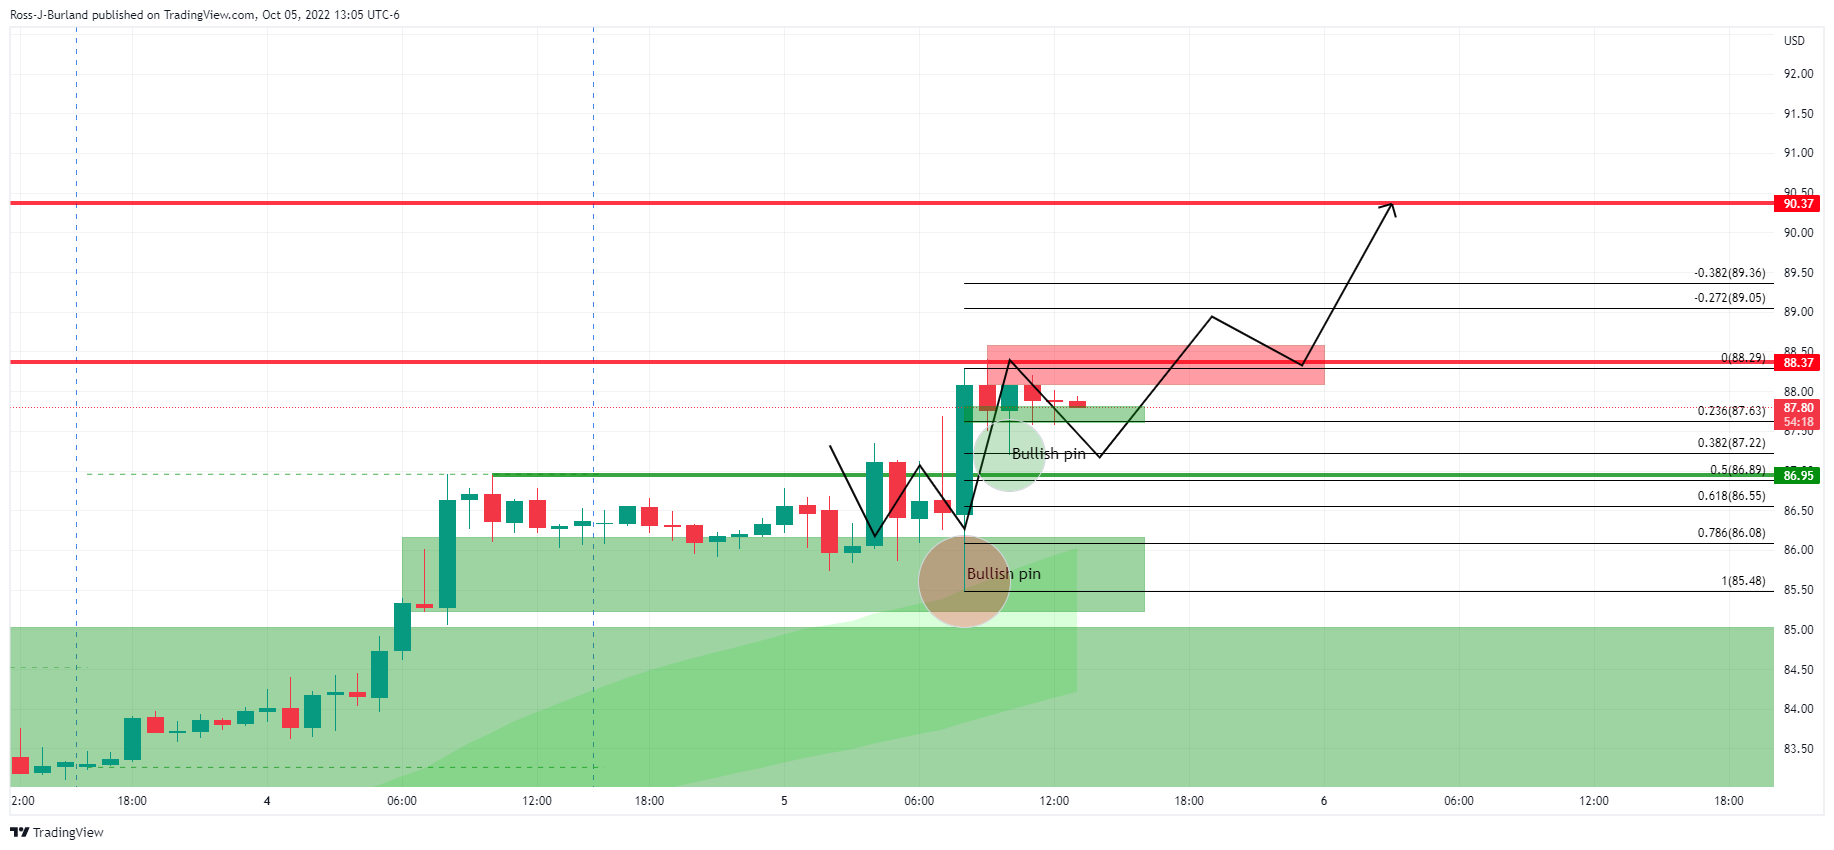
EUR/GBP Price Analysis: Faces solid resistance around 0.8770s, falls to 0.8720
- EUR/GBP drops below the 20-day as buyers’ momentum abate.
- The Relative Strength Index (RSI) pierced the 50-midline but is almost flat.
- The EUR/GBP 4-hour chart portrays a rising-wedge formed, targeting a fall towards 0.8600.
The EUR/GBP bounces off Tuesday’s close price and is edging higher, though solid resistance at around the 20-day EMA at 0.8768 put a lid on the cross-currency uptrend, retreating just below Tuesday’s high. However, the EUR/GBP remains positive, trading at 0.8726, above its opening price by 0.31%.
EUR/GBP Price Analysis: Technical outlook
During the last seven days, the pair’s volatility increased after the UK’s tax cut budget. Nevertheless, once the government backpedaled, the EUR/GBP tumbled from around 0.9277 to 0.8647 before recovering some ground. Given that the cross-currency pair dropped below the 20-day EMA and has been unable to crack it, the EUR/GBP is neutral bias. Additionally, the Relative Strength Index (RSI) entered the bearish territory but so far recovered and pierced the 50 mid-line. Nevertheless, price action’s failure to hold to gains above the 20-day EMA shows buyers might be losing momentum.
Short term, the EUR/GBP 4-hour chart depicts a rising-wedge formation, opening the door for further losses. If the EUR/GBP breaks below the bottom-trendline of the wedge, it could pave the way for further losses.
Therefore, the EUR/GBP first support would be the daily pivot at 0.8699. Once cleared, the next support would be the 200-EMA at 0.8679, followed by the S1 daily pivot at 0.8650, followed by the S2 daily pivot at 0.8600.
EUR/GBP Key Technical Levels
-
19:20
Gold Price Forecast: XAU/USD bears burst the gage as US yields tear higher
- Gold is back under pressure in a resurgence in the US dollar.
- DXY has been as high as 111.735, making gold more expensive for international buyers.
- The yield on the US 10-year note was up a high of to 3.78%, bearish for gold since it offers no interest.
The gold price was down some 0.7% by midday in New York, trading below the highs of the day of $1,727.84 and reaching as low as the psychological $1,700 level. The greenback has caught up with the robustness in US yields which is putting a barrier up against gold's recent resurgence.
The yellow metal broke the $1,700 level at the start of the week as investors started to discount the Fed premium due to poor manufacturing data that was accompanied by a massive miss in the JOLTS data ahead of this week's showdown event in Nonfarm Payrolls. ''With money manager positioning skewed short, the easing of rates and the USD, amid weaker US economic data, sparked a bout of short covering in precious metals,'' analysts at TD Securities said.
US JOLTS
-638005016651390367.png)
US job openings fell to almost 10.1 million in August, according to the Bureau of Labor Statistics, below the consensus on Econoday for 11.15 million and down from 11.17 million reported in July. The larger-than-expected decline could be the first sign that demand for labour is falling. The weaker data has caused traders to bet the Federal Reserve may raise interest rates less than previously expected as the central bank turns more dovish as the US economy slows, offering a tailwind to gold.
However, the analysts at TD Securities said that they expect another beat on this week's NFP on Friday, ''which could present a catalyst for a repricing lower.''
''The pain trade is still to the downside in precious metals, and the latest positioning data highlighted that other reportables started to meaningfully liquidate their gold length, suggesting pressure towards a capitulation in gold is indeed building''
Meanwhile, as illustrated in the following technical analysis, the US dollar index, DXY, was last seen up 1% at 111.20 but it had been as high as 111.735, making gold more expensive for international buyers, while the yield on the US 10-year note was up a high of to 3.78%, bearish for gold since it offers no interest.
Gold technical analysis
In yesterday's analysis, it was explained that the daily chart had seen the price rejected higher as per the harmonic Crab which is a bullish pattern.
However, the potential resistance as per the weekly M-formation and prior month's highs as well as a 21/50 smoothed moving average cloud were flagged.
It was explained that if this is going to be the highs of the week, then there would be a focus on the downside and that exposes a 50% mean reversion near the $1,685/75 area.
Gold update:
The price has started to correct in what could be the start of the run towards the 50% mean reversion near the $1,685/75 area.
Looking to the 10-year yield, it had been finding support throughout the start of the week and might have been considered a leading indicator of the US dollar's advance:
Consequently, the US dollar index, below, is breaking higher and back into line of the harmonic bullish pattern:

-
18:39
AUD/USD stumbles towards 0.6480s on dovish RBA, risk-off impulse
- AUD/USD is falling due to risk-aversion and heightened US T-bond yields underpinning the greenback.
- Fed’s Daly commented that she would like to see core prices down and foresees inflation would likely drop to 3% by 2023.
- US Services PMIs indices were mixed, though the ISM showed the resilience of the US economy.
- The RBA’s dovish 25 bps rate hike keeps the Australian dollar heavy.
The AUD/USD drops for the second consecutive day as the greenback snaps five days of losses, as risk aversion takes center stage. The speculation that central banks would pivot following the Reserve Bank of Australia’s dovish hike of 25 bps faded as Fed policymakers emphasized the need to tame inflation. The AUD/USD is trading at 0.6482 after hitting a daily high of 0.6526 at the time of typing.
AUD/USD falls on broad US dollar strength, dovish RBA
On Wednesday, Fed officials led by San Francisco’s Fed President Mary Daly crossed newswires. She said she would like to see core prices “stay flat or come down” and added that inflation would likely end in the next year at around 3% rather than 2%. Regarding the labor market, she said that “if Friday’s data shows hiring is slowing, that would be a welcome piece of news.”
Macroeconomic-wise, the US docket revealed the ISM Services PMI, which continued at expansionary territory, came at 56.7, above the street’s forecast but below the previous month’s reading. In the meantime, albeit improving, S&P Global PMIs for Services and Composite indices stayed below the 50-expansion/contraction line, at 49.3 and 49.5, respectively.
Earlier, the September US ADP National Employment data depicted that the economy added 208K private jobs to the economy, which could be a prelude for the US Nonfarm Payrolls report on Friday.
At the same time, the US Department of Commerce reported that the US Trade deficit narrowed by 4.3% to $67.4 billion in August, the lowest since May 2021.
On the Australian dollar side, the RBA’s decision to hike 25 bps caught traders by surprise, as they expected a 50 bps increase. AUD/USD traders reacted to the decision, sending the major sliding towards 0.6465.
RBA’s Governor Philip Lowe said, “The cash rate has been increased substantially in a short period of time,” and added that the board expects further tightening over the period ahead.
Elsewhere the US Dollar Index, a measurement of the buck’s value vs. a basket of peers, rallies more than 1%, reclaiming the 111.00 figure at 111.480, reflecting higher US Treasury bond yields. The US 10-year benchmark note rate edged up by almost 15 bps, at 3.779%, as market participants began to price in a 75 bps rate hike at Fed’s November meeting.
What to watch
The Australia economic docket will feature the AIG Construction Index and the Trade Balance, later in Thursday’s Asian session.
The US economic calendar will feature Initial Jobless Claims on Thursday, alongside Fed speaking, led by Chicago’s President Charles Evans, Cleveland’s Loretta Mester, and Board Members Lisa Cook and Christopher Waller.
AUD/USD Key Technical Levels
-
17:32
USD/JPY rises toward 145.00 as US yields climb further
- US Dollar losses impulse,holds onto important daily gains.
- US economic data surpasses expectations, the focus turns to NFP.
- USD/JPY rises more than a hundred pips from weekly lows.
The USD/JPY rose further during the American session and following US economic data. The pair peaked at 144.84, hitting a fresh daily high, 136 pips above the Asian session low.
The rebound in USD/JPY took place amid a stronger US dollar across the board. After an initial impulse to 144.55, the pair consolidated until the US ISM report, that surpassed expectations. The dollar jumped finding resistance around the 144.85 area and pulled back.
The 144.90 zone continues to be a critical resistance area and a break higher should open the way for 145.00 and more. On the flip side, a slide below 144.50 should weaken the dollar in the very short term. Then emerges the 143.70 zone, a critical support.
Better-than-expected economic data from the US on Wednesday helped the greenback. Private jobs rose by 208K in September according to ADP, above market expectations of 200K. ISM Services PMI came in at 56.7, above the expected 56 with the Employment Index rising unexpectedly from 50.2 to 53. On Friday, the US official employment report is due; market consensus is for an increase in payroll by 250K.
Higher US yields supported the move to the upside in USD/JPY. The US 10-year rose from 3.62% to 3.78% while the 2-year hit 4.20%. More recently, an improvement in risk sentiment added support to the pair. US stocks move off lows, trimming losses.
Technical levels
-
17:17
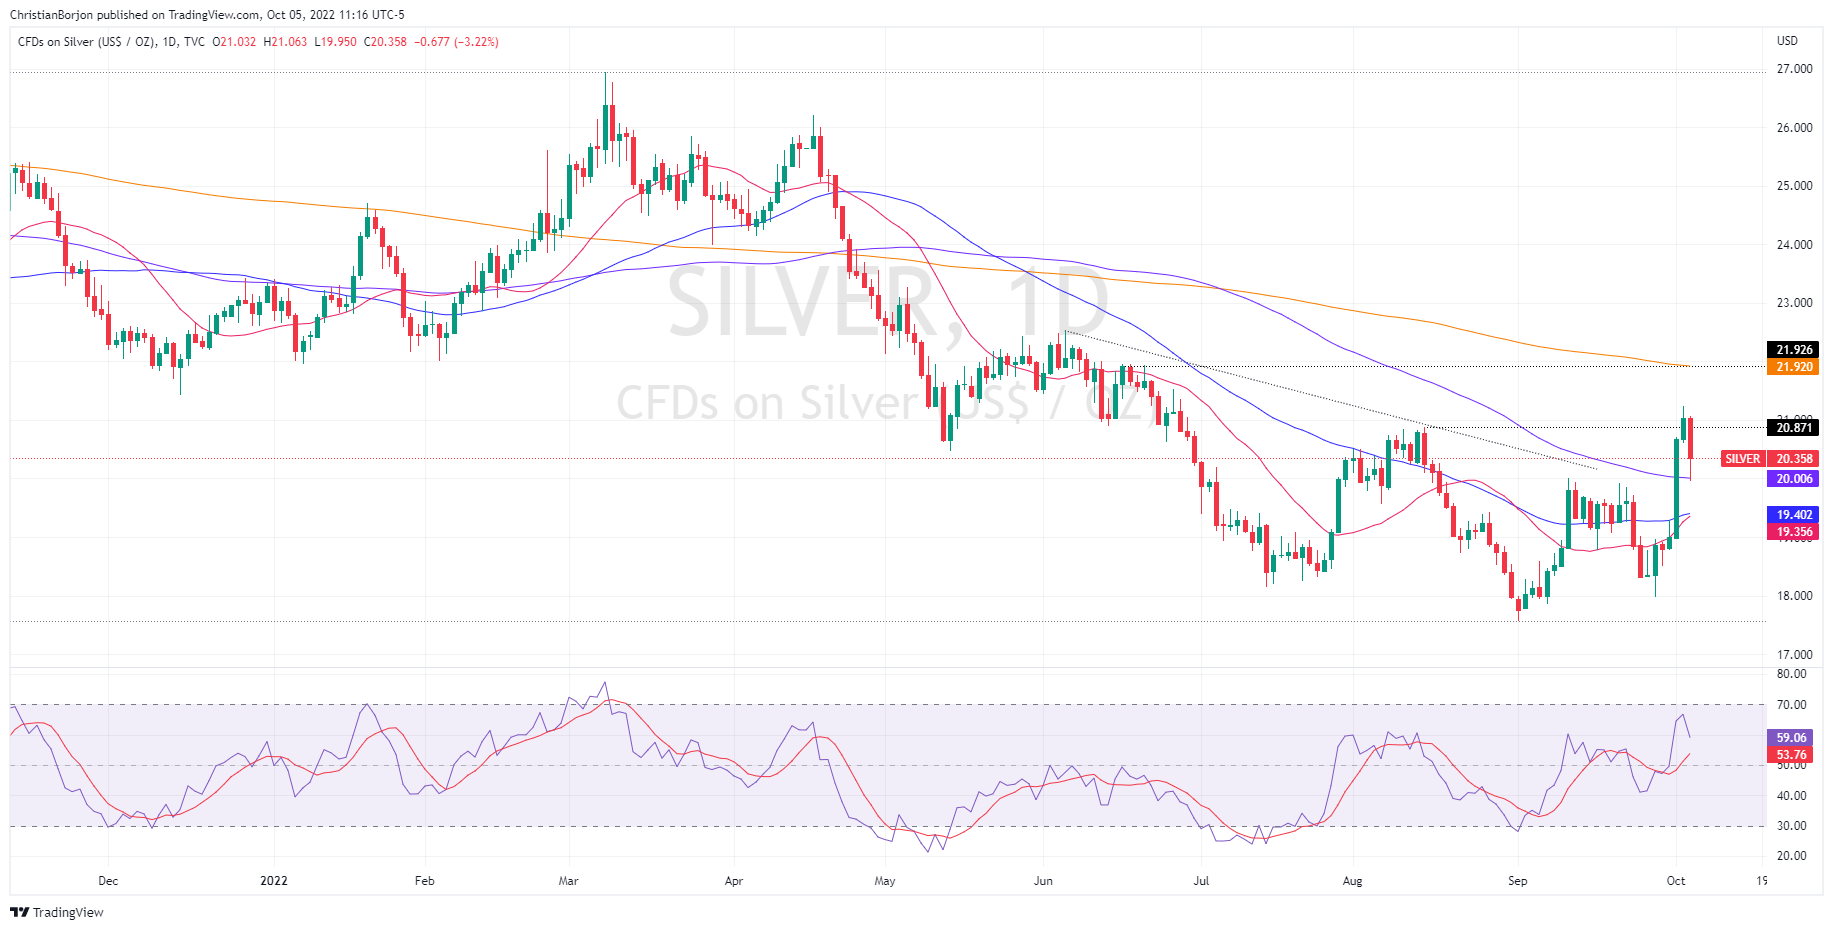
Silver Price Forecast: XAG/USD trips down below $20.50 on high US bond yields
- Silver price retraces from two-month highs while the US dollar recovers.
- Fed’s Daly: The US central bank is “resolute” on raising rates to tame inflation.
- US Services activity decelerates yet remains to expand despite US Federal Reserve tightening cycle.
- XAG/USD is neutral-biased and faced support at the 100-day EMA at $20.00.
Silver price retreat from two-month highs reached on Tuesday at $21.23 a troy ounce, as investors’ expectations of a Fed pivot fade, as US equities are tumbling, while the greenback gains traction after five days of losses. At the time of writing, XAG/USD is trading at $20.35, below its opening price by 3.15%.
XAG/USD falls due to elevated US T-bond yields
Investors’ mood shifted sour as US equities dropped. Of late, Fed officials crossing wires, led by the San Francisco Fed President Mary Daly, said that the Fed might step in if there’s an event of market dislocation while emphasizing that markets are right, and the Fed is “resolute” on raising rates further to bring inflation down.
“We definitely don’t raise rates until something breaks; we actually are forward-looking,” Daly said in a Bloomberg TV interview.
In the meantime, US economic data revealed that service sector activity showed some resilience, with the ISM Non-Manufacturing PMI rising to 56.7, less than August’s reading but above expectations. Contrarily, the S&P Global Services and Composite indices remained in contractionary territory, each at 49.3 and 49.5.
Earlier, the September US ADP National Employment data depicted that the economy added 208K private jobs to the economy, which could be a prelude for the US Nonfarm Payrolls report on Friday.
At the same time, the US Department of Commerce reported that the US Trade deficit narrowed by 4.3% to $67.4 billion in August, the lowest since May 2021.
Elsewhere the US Dollar Index, a measurement of the buck’s value vs. a basket of peers, rallies more than 1%, reclaiming the 111.00 figure at 111.480, reflecting higher US Treasury bond yields. The US 10-year benchmark note rate edged up by almost 15 bps, at 3.779%, as market participants began to price in a 75 bps rate hike at Fed’s November meeting.
What to watch
The US economic calendar will feature Initial Jobless Claims on Thursday, alongside Fed speaking, led by Chicago’s President Charles Evans, Cleveland’s Loretta Mester, and Board Members Lisa Cook and Christopher Waller.
Silver (XA/USD) Technical Analysis
XAG/USD prices had rallied more than $2 in the last three days, except for today’s price action. On its way north, XAG/USD cleared the 20, 50, and 100-day EMAs and tested the 100-day at $20.00 but jumped towards current spot prices. It should be noted that the 20-day EMA is closing its distance from the 50-day EMA, and once it crosses over, it will keep silver buyers hopeful for higher prices. Therefore, XAG/USD is neutral-biased unless it breaks above the 200-day EMA at $21.92.
-
16:43
US ISM: Service sector activity remained solid in September – Wells Fargo
Data released on Wednesday showed the ISM Services Index dropped in September to 56.7, a reading above the 56 expected. Analysts at Wells Fargo point out the report is still consistent with expansion in the sector. They argue most of the details indicate continued growth with some modest giveback in the pace of activity.
Key Quotes:
“Service sector activity remained solid in September. The headline reading on the ISM Services Index declined, signaling a slower pace of activity last month, but at 56.7 it was higher than the consensus expectation and still signals expansion.”
“Most major components of the index declined last month, with the employment index being one of the lone bright spots. The employment component rose 2.8 points to 53.0, marking the highest reading in six months. Squaring this with the pullback in the manufacturing employment counterpart indicates another solid but slightly slower gain in hiring last month compared to August.”
“Continued upward pressure on wages is perhaps partly behind the more modest decline in the prices paid component for services industries compared to manufacturing. The prices paid component slid 2.8 points to 68.7, whereas the counterpart in the manufacturing ISM currently sits at 51.7.”
-
16:40
White House: US Pres. Biden disappointed by shortsighted decision by OPEC+
US President Joe Biden is disappointed by the OPEC+ group's 'shortsighted decision', the White House said on Wednesday, as reported by Reuters.
Following its 33rd Ministerial Meeting, OPEC+ announced that they will adjust downward the overall production by 2 million barrels per day starting November from the August-2022 required production levels.
Additional takeaways
"OPEC+ decision will have most negative impact on lower- and middle-income countries."
"Biden is directing Energy Secretary to explore additional responsible actions to increase domestic production."
"Biden is calling on US Energy companies to bring gasoline pump prices down."
"Biden administration will consult with Congress on additional tools and authorities to reduce OPEC’s control over energy prices."
Market reaction
Crude oil prices continue to push higher and the barrel of West Texas Intermediate was last seen rising 2.25% on the day at $88.30.
-
16:33
GBP/USD tumbles toward 1.1200 as pound weakens and DXY soars
- US Dollar comes back into play, DXY up by 1.25%.
- UK PM Truss sticks to her plan, pound resumes slide.
- GBP/USD drops by more than 200 pips on Wednesday.
The GBP/USD is trading at the lowest level in two days around 1.1230, after falling more than 270 pips from the intraday high. Earlier the pair peaked at 1.1496, the highest level since September 15.
The combination of the dollar being back into play and the pound's weakness sent cable sharply on Wednesday. It has erased more than half of the week's gains and is approaching the 1.1200/05 support area.
The pound was already trading with some weakness that started around UK PM Liz Truss's speech. She spoke at the Conservative Party conference defending his plan. She said that cutting taxes was the "right thing to do "morally and economically". Truss mentioned that it is correct that the Bank of England sets interest rates independently. His words did not bring support for the pound.
GBP/USD started to decline from above 1.14000 and then accelerated amid a stronger US dollar. The DXY is rising by 1.25%, as US yields move sharply to the upside. The US 10-year year is at 3.77%, far from the 3.56% seen on Tuesday.
Economic data from the US came in better-than-expected on Wednesday helping the US Dollar rise across the board. Private sector employment rose by 208K in September according to ADP, above the market expectation of 200K. ISM Services PMI came in at 56.7, above the expected 56; the Employment Index rose unexpectedly to 53 from 50.2. On Friday, the US official employment report is due.
Technical levels
-
16:11
EUR/USD plunges from around parity to 0.9850 amid a strong US dollar
- EUR/USD plummets as speculation of a Fed pivot abated.
- US Services PMIs were mixed, though the ISM remained at expansionary territory.
- EU’s services activity weakened, except for France, growing at a mild pace.
The EUR/USD is erasing some of Tuesday’s gains as speculations of a Fed pivot towards a dovish stance faded, as shown by US T-bond yields rising again, while US Services PMI data, even though slowed, remains at expansionary territory. At the time of writing, the EUR/USD is trading at 0.9852 after hitting a daily high close to parity.
EUR/USD dropped on a strong US dollar
Sentiment deteriorated, as previously mentioned, as a possible Fed pivot faded. US economic data revealed during the day showed that private payrolls increased by 208K, as depicted by the ADP National Employment for September. Later in the day, economic activity in the Services sector showed mixed readings, though the ISM flashed that the economy is still expanding at a slower pace.
The S&P Global Services and Composite PMIs came at 49.3 and 49.5, respectively. Nevertheless, the ISM Non-Manufacturing PMI dived to 56.7, less than August’s 56.9 but exceeded estimations of 56.0. Given the backdrop, the US economy stayed resilient amidst an aggressive tightening cycle by the US Federal Reserve, therefore bolstering the greenback.
Hence, the EUR/USD dipped 130 pips on the day towards current exchange rates. In the meantime, the US 10-year Treasury bond yield is rising 16 bps, up at 3.781%, a headwind for the EUR/USD.
At the same time, the US Department of Commerce reported that the US Trade deficit narrowed by 4.3% to $67.4 billion in August, the lowest since May 2021.
Aside from this, the Eurozone reported that business activity slowed, as shown by the S&P Global PMI survey, further cementing the case of the EU’s getting into a recession as a stagflation scenario looms. Services activity weakened in Germany, Italy, and Spain, except for France, though it grew weaker than estimated.
EUR/USD Key Technical Levels
-
15:58
USD/CAD ignores rising oil prices, closes in on 1.3700
- USD/CAD extended its daily rally in the American session.
- WTI turned positive on the day above $87 on OPEC+ decision.
- DXY is up more than 1% on a daily basis after US data.
USD/CAD preserved its bullish momentum in the second half of the day and touched a daily high of 1.3696 before edging slightly lower. As of writing, the pair was up 1.2% on the day at 1.3670.
Crude oil prices rebound
Crude oil prices gained traction during the American trading hours and the barrel of West Texas Intermediate (WTI), which spent a large portion of the day in negative territory, climbed above $87. News confirming OPEC+ decision to lower the group's output by 2 million barrels per day provided a boost to WTI. Additionally, the EIA reported a larger-than-expected decline in the US' crude oil stocks in the week ending September 30.
The dollar strength, however, dominated USD/CAD's action after the upbeat US data. The US Dollar Index was last seen rising 1.2% on the day at 111.55.
The ADP announced that private sector employment increased by 208,000 in September, higher than analysts' estimate of 200,000. Additionally, the Employment component of the ISM's Services PMI survey rose to 53 from 50.2, revealing that employment in the service sector expanded at a stronger pace in September than it did in August.
Following these data, the probability of a 75 basis points rate hike in November climbed above 70%, suggesting that hawkish Fed bets are driving the market action.
On Friday, September jobs reports from the US and Canada will be watched closely by market participants.
Nonfarm Payrolls Preview: Five scenarios for trading King Dollar as markets plead for pain.
Technical levels to watch for
-
15:47
Gold Price Forecast: XAU/USD path downgraded to $1,700 by year-end, $1,800 end-2023 – Commerzbank
Gold price is set to remain under pressure due to the strongly appreciating US dollar. Therefore, strategists at Commerzbank downgrade their XAU/USD forecasts.
USD to remain strong for quite some time yet
“We expect the Fed Funds Rate to climb to 5% by the spring of 2023, i.e. by another 175 basis points from its current level. The US dollar is therefore likely to remain strong for quite some time yet. The headwind facing gold will thus persist for some considerable time.”
“We are downwardly revising our gold price forecast for the end of this year to $1,700 per troy ounce (previously $1,800).”
“The lower starting level, noticeably higher interest rate forecast and lower prediction for the EUR/USD exchange rate also translate into a lower path for the gold price next year. We expect gold to climb to $1,800 per troy ounce by the end of 2023 (previously $1,900).”
-
15:30
United States EIA Crude Oil Stocks Change below forecasts (0.097M) in September 30: Actual (-1.356M)
-
15:29
Fed's Daly: I see more rate increases as necessary
San Francisco Fed President Mary Daly reiterated on Wednesday that the Fed is resolute at raising rates to restrictive territory, as reported by Reuters.
Additional takeaways
"We are committed to bringing inflation down, staying course until we are well and truly done."
"I don't see a hump shape in rates, I see us raising rates, holding them there until we get inflation close to 2%."
"More policy adjustments are required to get it restrictive."
"I see more rate increases as necessary."
"Expect inflation to end next year closer to 3% than 2%."
"Have to be prepared for inflation to be more persistent than we expect."
"Still seeing about 50% of inflation coming from demand."
"Markets are finding their footing."
"For us, the path is clear: we are going to raise rates to restrictive territory, then hold them there for a while."
"We don't raise rates until something breaks."
"We are constantly calibrating to risks."
"If market dislocation comes about, we would be prepared to address it."
Market reaction
The dollar rally continues following these comments and the US Dollar Index was last seen rising 1.3% on the day at 111.65.
-
15:25
Gold extends slide toward $1,700 after US data
- Gold is down more than 1% on a daily basis on Wednesday.
- 10-year US Treasury bond yield surges higher in the American session.
- Hawkish Fed bets provide a boost to the greenback after latest data releases.
Gold came under renewed bearish pressure and dropped toward $1,700 during the American trading hours on Wednesday. As of writing, XAU/USD was down 1.25% on the day at $1,705.
USD rises alongside US yields
The impressive rebound witnessed in US Treasury bond yields amid hawkish Fed bets weighs heavily on the precious metal mid-week. Following the sharp decline seen earlier in the week, the benchmark 10-year US Treasury bond yield is up more than 4% on a daily basis at 3.78%. According to the CME Group FedWatch Tool, markets are pricing in a 68% probability of a 75 basis points rate hike in November.
The data from the US showed on Wednesday that private sector employment rose by 208,000 in September, higher than the market expectation of 200,000.
Additionally, the ISM Services PMI came in at 56.7, showing that the business activity in the service sector continued to expand at a healthy pace in September. More importantly, the Employment Index of the PMI survey recovered to 53 from 50.2, reviving expectations for another strong Nonfarm Payrolls report on Friday. The US Dollar Index is up 1.33% on the day, reflecting the positive impact of Wednesday's data on the dollar's valuation.
There won't be any other high-tier macroeconomic data releases later in the day and the US yields' movements are likely to continue to impact the inversely-correlated XAU/USD's action.
Technical levels to watch for
-
15:04
S&P 500 Index: Scope for a deeper but still corrective rally to 3867 – Credit Suisse
S&P 500 has successfully held key support at 3595. With bullish RSI momentum divergences into the low, analysts at Credit Suisse look for a deeper but still corrective rally to emerge. Big picture though, they maintain a core negative outlook.
Strength seen as temporary and corrective
“With bullish daily and weekly RSI momentum divergences into the low and with sentiment and breadth measures pointing to a highly oversold condition we see scope for a deeper corrective rally to emerge, or at least a more protracted consolidation.”
“Big picture, our bias remains to view strength as temporary and corrective and we maintain our 3-6 month negative outlook.”
“Resistance is seen initially at 3790/92, above which should clear the way for further strength to resistance next at 3828, then the 38.2% retracement of the August/September fall at 3867. With the 23.6% retracement of the entire 2022 fall just above at 3875 and with the late September high at 3907 we will look for a cap in this 3867/3907 zone.”
“Support is seen at the price gap from yesterday, starting at 3726 and stretching down to 3678. Below this latter level is needed to ease thoughts of a corrective recovery for a retest of the 200-week average at 3595.”
-
15:02
US: ISM Services PMI declines to 56.7 in September vs. 56 expected
- Business activity in the US service sector continued to expand in September.
- US Dollar Index continues to push higher in the American session.
The business activity in the US service sector expanded at a slightly softer pace in September than it did in August with the ISM Services PMI declining to 56.7 from 56.9. This reading, however, came in better than the market expectation of 56.
Further details of the publication revealed that the Employment Index improved to 53 from 50.2 and the Prices Paid Index declined to 68.7 from 71.5. Finally, the New Orders Index edged lower to 60.6 from 61.8.
Commenting on the data, "the services sector had a slight pullback in growth for the month of September due to decreases in business activity and new orders," said Anthony Nieves, Chair of the ISM Services Business Survey Committee.
"Employment improved and supplier deliveries slowed at a slightly slower rate," Nieves added. "Based on comments from Business Survey Committee respondents, there have been improvements regarding supply chain efficiency, operating capacity and materials availability; however, performance remains less than ideal."
Market reaction
The US Dollar Index extended its rally after this report and was last seen rising 1.3% on the day at 111.62.
-
15:00
United States ISM Services PMI came in at 56.7, above expectations (56) in September
-
15:00
United States ISM Services New Orders Index above forecasts (58.9) in September: Actual (60.6)
-
15:00
United States ISM Services Prices Paid came in at 68.7, below expectations (69.8) in September
-
15:00
United States ISM Services Employment Index came in at 53, above expectations (49.6) in September
-
14:51
US: S&P Global Services PMI rises to 49.3 (final) in September from 43.7
- S&P Services PMI rose in September but stayed below 50.
- US Dollar Index clings to strong daily gains above 111.00.
The S&P Global Services PMI for the US recovered to 49.3 (final) in September from 43.7 in August. This reading came in slightly better than the flash estimate and the market expectation of 49.2.
Additionally, the Composite PMI rose to 49.5 (final) from 44.6 in August, compared to the previous estimate of 49.3.
Commenting on the data, "with service sector activity declining for a third straight month in September, businesses have faced a tough third quarter," said Chris Williamson, Chief Business Economist at S&P Global Market Intelligence. "Economic growth has come under pressure from falling output in both the manufacturing and service sectors, though in both cases September has seen some encouraging signals that business conditions may be starting to improve."
Market reaction
The US Dollar Index preserves its bullish momentum and was last seen rising 1.05% on the day at 111.35.
-
14:48
United States S&P Global Services PMI came in at 49.3, above expectations (49.2) in September
-
14:48
United States S&P Global Composite PMI came in at 49.5, above expectations (49.3) in September
-
14:25
USD/JPY rises above 144.50 as US yields stretch higher
- USD/JPY trades in positive territory above 144.50 on Wednesday.
- 10-year US Treasury bond yield is up more than 2% on the day.
- Focus shifts to ISM's Services PMI survey for September.
USD/JPY continued to edge higher in the early American session on Wednesday and was last seen rising 0.35% on the day at 144.55.
10-year US yield is back above 3.7%
Although the risk-averse market environment allows the JPY to stay resilient against its rivals, rising US Treasury bond yields help USD/JPY preserve its bullish bias.
Following the sharp decline witnessed on Monday, the benchmark 10-year US Treasury bond yield is up more than 2% on the day slightly above 3.7%. The data from the US showed that the ADP Employment Change arrived at +208,000 in September, surpassing the market expectation of 200,000, providing a boost to the greenback and US yields.
According to the CME Group FedWatch Tool, markets are currently pricing in a 66.5% probability of one more 75 basis points Fed rate hike in November, compared to 50% on Tuesday.
Later in the session, the ISM will release the Services PMI report for September. Market participants will pay close attention to the Prices Paid and Employment components of the survey.
Meanwhile, major equity indexes in the US look to open significantly lower after having registered impressive gains on Monday and Tuesday. Escalating geopolitical tensions force investors to stay away from risk-sensitive assets mid-week.
Technical levels to watch for
-
14:23
USD/TRY adds to recent gains and approaches 18.60… again
- USD/TRY extends the weekly upside to the vicinity of 18.60.
- The upbeat tone in the greenback lends extra legs to the pair.
- US ADP report came on the strong side in September.
The resumption of the buying interest around the greenback pushes USD/TRY to the 18.58 region on Wednesday, just a tad below Tuesday’s all-time peaks.
USD/TRY keeps targeting 19.00
USD/TRY trades with gains for the second session in a row and remains close to the 18.60 region on the back of the recovery in the dollar following a negative start of the new trading week.
On the domestic front, the depreciation around the lira appears unabated, particularly after inflation figures released on Monday showed the CPI rose at a new 24-year high past 83% in the year to September.
In the US calendar, the ADP report showed the US private sector added 208K jobs in September, surpassing expectations and adding to August’s 132K gain. Later in the session, all the attention is expected to be on the publication of the ISM Non-Manufacturing.
What to look for around TRY
USD/TRY keeps navigating the area of all-time tops near 18.60 amidst the combination of omnipresent lira weakness and the renewed bid bias in the dollar.
So far, price action around the Turkish lira is expected to keep gyrating around the performance of energy and commodity prices - which are directly correlated to developments from the war in Ukraine - the broad risk appetite trends and the Fed’s rate path in the next months.
Extra risks facing the Turkish currency also come from the domestic backyard, as inflation gives no signs of abating (despite rising less than forecast in July and August), real interest rates remain entrenched well in negative territory and the political pressure to keep the CBRT biased towards low interest rates remains omnipresent.
In addition, the lira is poised to keep suffering against the backdrop of Ankara’s plans to prioritize growth (via higher exports and tourism revenue) and the improvement in the current account.
Key events in Türkiye this week: CPI, Producer Prices, Manufacturing PMI (Monday).
Eminent issues on the back boiler: FX intervention by the CBRT. Progress of the government’s scheme oriented to support the lira via protected time deposits. Constant government pressure on the CBRT vs. bank’s credibility/independence. Bouts of geopolitical concerns. Structural reforms. Presidential/Parliamentary elections in June 23.
USD/TRY key levels
So far, the pair is gaining 0.10% at 18.5772 and faces the next hurdle at 18.5908 (all-time high October 4) followed by 19.00 (round level). On the downside, a break below 18.1142 (55-day SMA) would expose 17.8590 (weekly low August 17) and finally 17.7586 (monthly low).
-
14:07
OPEC+ JMMC agrees oil output cuts of 2 million bpd – Reuters
Joint Ministerial Monitoring Committee (JMMC) of the Organization of the Petroleum Exporting Countries and allies including Russia, known collectively as OPEC+, has agreed to lower oil output by 2 million barrels per day, Reuters reports, citing sources.
No additional details on the group's output strategy has been shared yet.
Market reaction
Crude oil prices edged higher on this headline and the barrel of West Texas Intermediate (WTI) was last seen trading near $87, where it was up 1% on a daily basis.
-
14:04
AUD/USD drops to fresh daily low below 0.6450 after US data
- AUD/USD extended its daily slide in the American session.
- ADP reported a bigger than expected increase in private sector employment in September.
- Wall Street's main indexes remain on track to open deep in negative territory.
AUD/USD came under renewed bearish pressure and dropped to a fresh daily low below 0.6440 before recovering modestly in the early trading hours of the American session on Wednesday. As of writing, the pair was down 0.75% on the day at 0.6452.
Dollar capitalizes on upbeat ADP data
The data published by Automatic Data Processing (ADP) revealed that private sector employment in the US rose by 208,000 in September, compared to the market expectation of 200,000. Additionally, August's print got revised higher to 185,000 from 132,000. On the back of upbeat employment data, the US Dollar Index extended its rally and was last seen rising 0.75% on the day at 111.05.
Meanwhile, safe-haven flows continue to dominate the financial markets and put additional weight on AUD/USD's shoulders in the second half of the day.
Wall Street's main indexes remain on track to open deep in negative territory with US stock index futures losing between 0.95 and 1.1% on the day, suggesting that safe-haven flows are likely to continue to dominate the market action.
Later in the session, the ISM will release the Services PMI survey for September. Atlanta Fed President Raphael Bostic is scheduled to speak at a virtual conference titled "Staying Resolute in the Battle Against Inflation."
Technical levels to watch for
-
13:58
EUR/CHF: Key 0.9867/84 zone to hold to avoid strength towards 0.9950/parity – Credit Suisse
EUR/CHF has broken the 55-day moving average (DMA) at 0.9686. Economists at Credit Suisse see scope for a recovery to 0.9867/84, though with this ideally holding to avoid a move back to 0.9950/parity.
Move below 0.9644/41 needed to ease the current upside pressure
“We think that further near-term upside to 0.9867 is now a likely scenario.”
“Support is seen at 0.9742/40 initially, though a move below 0.9644/41 is needed to ease the current upside pressure and put the market back on track towards a retest of the YTD low at 0.9409.”
“Resistance now moves to 0.9831 and then above at the key 0.9867/84 zone, which ideally now curbs any further rise to avoid a potential move to 0.9950/parity.”
-
13:48
US: Goods and services deficit narrow to $67.4 billion in August vs. $68 billion expected
- US Goods and Services Trade Balance rose to -$67.4 billion in August.
- US Dollar Index clings to strong daily gains above 111.00.
The data published by the US Census Bureau showed on Wednesday that the US' goods and services deficit narrowed by $3.1 billion to $67.4 billion in August from $70.5 billion in July. This reading came in lower than the market expectation for a deficit of $68 billion.
"August exports were $258.9 billion, $0.7 billion less than July exports," the publication further read. "August imports were $326.3 billion, $3.7 billion less than July imports."
Market reaction
This report doesn't seem to be having a noticeable impact on the dollar's performance against its rivals. As of writing, the US Dollar Index was up 0.85% on the day at 111.13.
-
13:32
United States Goods Trade Balance increased to $-87.28B in August from previous $-87.3B
-
13:32
United States Goods Trade Balance climbed from previous $-87.3B to $-87.2B in August
-
13:30
United States Goods and Services Trade Balance registered at $-67.4B above expectations ($-68B) in August
-
13:30
Canada International Merchandise Trade came in at $1.52B, below expectations ($3.5B) in August
-
13:30
Canada Imports declined to $63.86B in August from previous $64.2B
-
13:30
Canada Exports down to $65.38B in August from previous $68.25B
-
13:30
Canada Building Permits (MoM) above forecasts (-0.8%) in August: Actual (11.9%)
-
13:19
US: Private sector employment rises by 208,000 in September vs 200,000 expected
- US private sector employment rose at a slightly stronger pace than expected in September.
- US Dollar Index clings to strong daily gains at around 112.00.
The data published by Automatic Data Processing (ADP) showed on Wednesday that private sector employment in the US rose by 208,000 in September. This reading followed August's increase of 185,000 (revised from 132,000) and came in slightly better than the market expectation of 200,000.
Commenting on the data, "we are continuing to see steady job gains," said Nela Richardson, chief economist, ADP. "While job stayers saw a pay increase, annual pay growth for job changers in September is down from August.”
Wage inflation
"Job changers, who have been notching double-digit, year-over-year gains since the summer of 2021, lost momentum in September," the ADP noted in its publication. "Their annual pay rose 15.7%, down from a revised 16.2% gain in August. It's the biggest deceleration in the three-year history of our data. For job stayers, annual pay rose 7.8% in September from a year ago, up from a revised 7.7% in August."
Market reaction
The US Dollar Index preserves its bullish momentum after this report and was last seen rising 0.7% on the day at 110.95.
-
13:16
Gold Price Forecast: XAU/USD to avert downtrend on heroic recovery north of $2,000 – TDS
Gold has rallied above the $1,700 level. Nonetheless, strategists at TD securities remain confident that the downtrend will prevail with a high margin of safety against a trend reversal.
Ignore the siren song
“The margin of safety against a sustained change in trend in gold is extremely elevated.”
“Unless the yellow metal stages a heroic recovery north of $2,000 before year-end, we remain confident that the downtrend in prices will prevail.”
“Gold prices have yet to price in the final stages of the hiking cycle, in which restrictive rates contribute to a significant underperformance relative to the earlier stages of the hiking cycle.”
-
13:15
United States ADP Employment Change came in at 208K, above expectations (200K) in September
-
13:00
Brazil Industrial Output (YoY) above expectations (-0.5%) in August: Actual (2.8%)
-
13:00
Brazil Industrial Output (MoM) registered at -0.6%, below expectations (-0.1%) in August
-
12:35
EUR/USD could challenge 0.90 before settling around 0.93-0.94 – Standard Chartered
EUR/USD is set to move downward in the near-term but economists at Standard Chartered expect the pair to turn back higher over a 12-month period.
Downward pressure on the euro in the near-term
“EUR/USD is likely to weaken over next 1-3 months, potentially testing support around 0.90, before settling around 0.93-0.94.”
“While European gas inventories have reached nearly 85% of capacity, energy security and rationing concerns along with relatively slower pace of rate hikes from ECB are likely to exert downward pressure on the euro in the near-term.”
“Over a 12-month horizon, we expect a reduction in interest rate differentials between US and Europe and a reversal of its current undervaluation to push the EUR higher.”
-
12:26
Colombia Consumer Price Index (YoY) climbed from previous 10.84% to 11.44% in September
-
12:26
Colombia Consumer Price Index (MoM) fell from previous 1.02% to 0.93% in September
-
12:20
EUR/USD Price Analysis: Upside capped by the parity zone so far
- EUR/USD’s strong upside meets resistance around parity.
- Sustained gains are likely once the parity level is cleared.
EUR/USD has so far met quite a solid hurdle in the proximity of the parity level on Wednesday.
Considering the recent strong rebound, further upside seems likely once the pair leaves behind the parity region on a sustainable fashion. Further up comes the interim hurdle at the 55-day SMA, today at 1.0030.
In the longer run, the pair’s bearish view should remain unaltered while below the 200-day SMA at 1.0632.
EUR/USD daily chart
-
12:02
Mexico Consumer Confidence s.a registered at 41, below expectations (41.1) in September
-
12:02
Mexico Consumer Confidence rose from previous 40.3 to 40.8 in September
-
12:00
USD Index Price Analysis: Solid contention appears around 110.00... for now
- DXY manages to gather some upside traction after testing 110.00.
- The loss of 110.00 exposes a potential decline to 109.35.
DXY reverses two consecutive daily retracements and bounces off fresh lows in the proximity of the 110.00 support on Wednesday.
Despite the ongoing rebound, further weakness should not be ruled out just yet. That said, the breach of the 110.00 yardstick should open the door to a probable visit to the weekly low at 109.35 (September 20).
The prospects for extra gains in the dollar should remain unchanged as long as the index trades above the 7-month support line near 107.40.
In the longer run, DXY is expected to maintain its constructive stance while above the 200-day SMA at 102.67.
DXY daily chart
-
12:00
United States MBA Mortgage Applications fell from previous -3.7% to -14.2% in September 30
-
11:49
S&P 500 Index: Bounce could extend above 4000 on a break past 3900 – SocGen
S&P 500 rebounded 2.6% on Monday after falling to a year-to-date low at the end of last week. Periodic rebounds are to be expected but the 3900 level is set to prove a tough barrier, analysts at Société Générale report.
Holding 3636 is crucial for persistence in up move
“S&P 500 briefly violated the lows of June at 3636 but has quickly clawed back above denoting a false break. It is worth noting that similar price action occurred in June when the index failed to establish below the trough of May and experienced a phase of rebound.”
“Gap-up on daily chart points towards possibility of a bounce.”
“Recent pivot high at 3900 is first layer of resistance. If this is crossed, the bounce could extend towards recent bearish gap near 4040 and 4120.”
“Defending 3636 would be crucial for persistence in up move.”
-
11:43
EUR/JPY Price Analysis: Further upside could revisit the 2022 high
- EUR/JPY corrects lower after briefly surpassing the 144.00 mark.
- Extra gains are expected to challenge the YTD top past 145.00.
EUR/JPY comes under pressure following five consecutive daily advances on Wednesday, including a test of the key resistance zone around 144.00.
The continuation of the rebound from last week’s lows remains well in place for the time being. That said, if the cross extends the breakout of the weekly top at 144.04 (September 20), it could then dispute the 2022 high at 145.63 (September 12).
In the meantime, while above the key 200-day SMA at 136.04, the constructive outlook for the cross should remain unchanged.
EUR/JPY daily chart
-
11:14
US Dollar Index to rise towards 116.50-117.00 in the next few months – Standard Chartered
Over the past month, the US dollar has surged sharply higher. Economists at Standard Chartered expect the US Dollar Index (DXY) to reach the 116.50-117.00 area but see the greenback peaking over a 6-12 month horizon.
USD to peak over a 6-12 month horizon
“On a three-month horizon, DXY is likely to rise towards 116.50-117.00.”
“Near-term USD strength is likely to be driven by (i) the likelihood of Fed hiking rates at a faster pace relative to the other major centralbanks, which can continue to push interest rate differentials in favour of the USD, (ii) greater global growth concerns that are likely to fuel safe-haven USD demand, and (iii) elevated geopolitical concerns, especially in Europe and the Middle East.”
“Over a 6-12 month horizon, we expect the USD to peak. In our assessment, (i) we expect US inflation to gradually turn lower over 2023, which should give the Fed the leeway to slow or even pause rate hikes, (ii) rate hikes from other major central banks through 2023 should narrow the interest rate differentials with the US, (iii) capital flows are likely to turn away from the US on slower US growth and robust growth in Asia, and (iv) easing of geopolitical uncertainty around Europe and improving Chinese growth could potentially reduce the safe-haven demand.”
-
10:53
IEA’s Birol: Europe will have 25-30% gas left if there are no surprises
International Energy Agency (IEA) Chief Fatih Birol said on Wednesday that “Europe will have 25-30% gas left if there are no surprises and if the winter is normal.”
Additional quotes
This winter will be difficult, but the next winter will be very difficult.
We need solidarity among European countries.
If we fail this energy test, the negative implications may go beyond energy and weaken the EU’s political weight.
We're seeing a significant decline in energy use in Europe.
Market reaction
The shared currency is failing to find any positive boost from the above comments, as EUR/USD is trading at near-daily lows of 0.9921, down 0.60% on the day.
-
10:46
NZD/USD: Failure to overcome 0.6010/0.6060 can lead to continuation in downtrend – SocGen
NZD/USD has failed to sustain the upside above 0.5800. While below 0.6010/0.6060, the downtrend is set to persist, economists at Société Générale report.
50-day moving average near 0.6010/0.6060 to be an important hurdle near-term
“NZD/USD recently formed an interim low near the lower limit of a multi-month down sloping channel at 0.5565 which is also a trend line drawn since 2009.”
“An initial bounce is taking shape; the 50 DMA near 0.6010/0.6060 which is also the low of July is expected to be an important hurdle near-term. Failure to overcome this resistance can lead to continuation in downtrend towards last month trough of 0.5565 and 2020 levels of 0.5495/0.5470.”
-
10:45
Singapore: Unexpected drop in the Manufacturing PMI – UOB
Senior Economist at UOB Group Alvin Liew assesses the recently published Manufacturing PMI in Singapore.
Key Takeaways
“Singapore’s manufacturing Purchasing Managers’ Index (PMI) edged slightly below 50.0, at 49.9 in Sep, marking the first contraction in overall activity for the manufacturing sector after 26 straight months of expansion in overall activity since Jun 2020 (48.0 in Jun 2020).”
“More importantly, the electronics sector PMI slipped further into contraction territory, by another 0.2 point to 49.4, the second contraction in a row after two years of continuous expansion, and the lowest reading since Jul 2020 (at 49.2). The dismal electronics reading was due to a faster rate of contraction in many of the key metrics including the sub-indexes of new orders, new exports, output, finished goods and imports. In comparison to the overall employment index (which rose further to 50.3 from 50.2), the electronics employment index slipped below 50 (to 49.8) for the first time since Oct 2020.”
“Manufacturing Outlook – The latest headline and electronics PMI number painted a consistent picture from what we saw in the latest non-oil domestic exports (NODX) and industrial production (IP) data. We are cautiously positive on the outlook for transport engineering, general manufacturing, and precision engineering, to drive overall manufacturing growth (which will provide some support to overall PMI) but we see a weaker electronics performance and slowing demand from North Asian economies that could increasingly weigh on NODX momentum and manufacturing activity. We maintain our Singapore manufacturing growth forecast at 4.5% in 2022 (from 13.2% in 2021) but we expect the sector to contract by 3.7% in 2023 due to the faltering outlook for electronics and weaker external demand. In the same vein, our full year 2022 GDP growth forecasts are unchanged at 3.5% but growth will likely slow significantly to 0.7% for 2023, as we now project the US and European economies (which are key end demand markets for Singapore) to enter into a recession in the next 6-12 months amidst aggressive monetary policy tightening stance among these advanced economies, while the electronics manufacturing outlook looks precarious as we head toward end2022/early 2023.”
-
10:44
Gold Price Forecast: XAU/USD drops to $1,710 as US dollar rises with yields ahead of data
- Gold Price holds lower ground after US dollar recovers ground after Tuesday’s steep sell-off.
- Risk tone remains tepid amid geopolitical issues while Treasury yields recover.
- XAU/USD corrects from three-week highs after rejection at the 50 DMA barrier.
Gold Price is in the red for the first time so far this week, as the US dollar is seeing a sweeping demand amid a risk-off market profile. The greenback is unwinding the 1.3% overnight sell-off, which marked its biggest drop since March 2020 ahead of the critical US ADP employment report and ISM Services PMI.
Hopes for aggressive Fed rate hikes are back on the table after the hawkish RBNZ 50 bps rate increase, fuelling a fresh upswing in the US Treasury yields across the curve. The non-yielding gold feels the heat from the upsurge in the dollar alongside the yields.
Escalating geopolitical tensions between Russia and the West are doing little to offer any respite to XAU bulls, as risk-off flows and the dollar demand dominate across the financial market. Investors await the top-tier US economic releases and Fedspeak for fresh hints on the size of the next Fed rate hike.
Also read: Gold Price Forecast: 50 DMA appears a tough nut to crack for XAU/USD bulls ahead of US data
Technically, the bearish 50-Daily Moving Average (DMA) at $1,724 has tempered the gold price rally. A sustained break above the 50 DMA is needed to challenge the September highs at $1,735, above which the $1,750 psychological level will come into play.
On the downside, the previous critical resistance now support at $1,700 could offer temporary reprieve to buyers, below which the previous day’s low of $1,695 could be revisited.
Gold Price: Daily chart
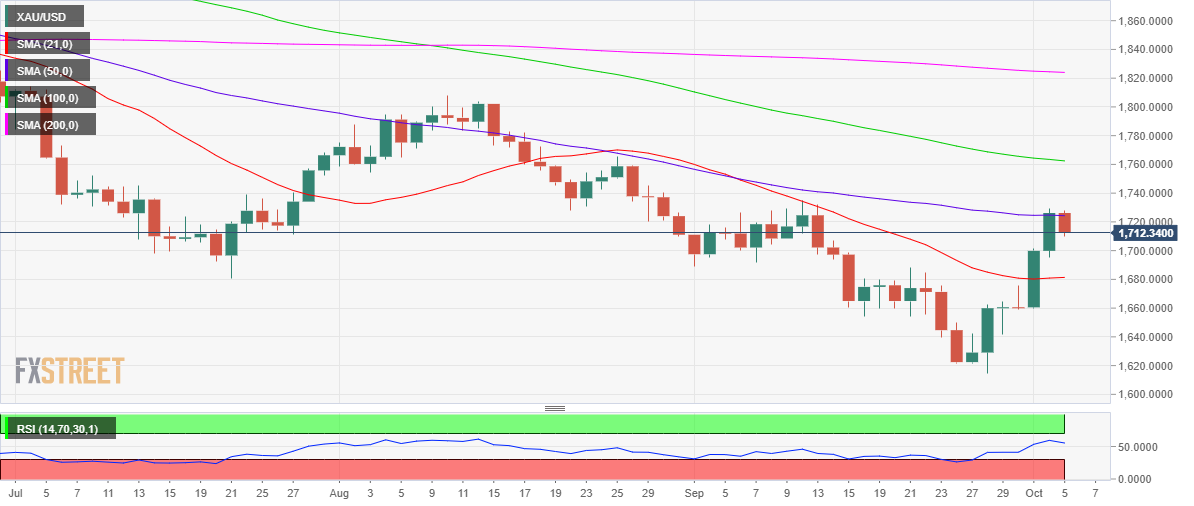
Gold Price: Additional levels to consider
-
10:31
United Kingdom 10-y Bond Auction increased to 4.123% from previous 3.088%
-
10:29
USD/CAD rises toward 1.3600 as oil prices retreat
- USD/CAD gathered bullish momentum early Wednesday following two-day slide.
- WTI trades in negative territory as markets wait for OPEC+ to unveil output strategy.
- The dollar benefits from safe-haven flows amid escalating geopolitical tensions.
After having lost nearly 300 pips in a two-day slide, USD/CAD reversed its direction and climbed toward 1.3600 on Wednesday. As of writing, the pair was trading at 1.3570, where it was up 0.45% on a daily basis.
WTI turns south ahead of OPEC+ decision
The sharp upsurge witnessed in crude oil prices helped the commodity-sensitive loonie outperform its rivals earlier in the week. On reports claiming that OPEC+ could reduce crude oil production by as much as 2 million barrels per day, the barrel of West Texas Intermediate (WTI) gained more than 3% and climbed to its highest level since mid-September at $87 on Tuesday.
The negative shift witnessed in the risk mood, however, seems to be causing oil prices to edge lower mid-week and doesn't allow the CAD to preserve its strength. OPEC+ is set to unveil its output strategy later in the day and the European Union is expected to introduce a new sanctions package against Russia that will most likely include a cap on oil prices.
Meanwhile, US stock index futures are down sharply as geopolitical tensions continue to escalate. Russian President Vladimir Putin is reportedly planning to address the nation and announce a change in the status of the "special operation." Russia's ambassador warned earlier in the day that the US' decision to send more military aid to Ukraine would raise the danger of a direct clash between Russia and the west.
In the second half of the day, the US economic docket will feature the ADP's private sector employment data and the ISM's Services PMI survey.
ADP Jobs Preview: How the data creates a dollar selling opportunity ahead of the ISM Services PMI
Key levels to watch for
-
10:03
Indonesia: Inflation picked up pace in September – UOB
Economist at UOB Group Enrico Tanuwidjaja reviews the latest release of inflation figures in Indonesia.
Key Takeaways
“Sep’s headline inflation rose sharply, but not unexpected, by 1.2% m/m or 6% y/y (4.7% in Aug) while core inflation rose to 3.2% y/y (prior 3%).”
“Inflation in Sep was mainly driven by the effects of fuel price hike on transport prices and on higher food prices.”
“As we have alluded to in our latest quarterly publication, we keep our 2022 inflation forecast (average) at 4.9%. We also maintain our view for BI to hike rates to reach 5% by year-end.”
-
10:02
EUR/USD to head lower towards 0.95 over coming months – Rabobank
EUR/USD has turned south and declined below 0.9950. Economists at Rabobank expect the pair to move downward to 0.95 this quarter.
Trendline resistance is just above parity
“We remain USD bulls and retain our EUR/USD 0.95 target on a one-to-three month view.”
“The single currency lacks the safe haven credentials of the USD which means the EUR is more susceptible to concerns about slowing growth.”
“Although it is clear that the Eurozone is facing a difficult winter, in our view the EUR is not yet fully priced for the energy price crunch facing the region given the risk that it could extend for several years. This could potentially make production from some industry groups untenable for Europe on a one-to-five year horizon. Disruption of this kind is suggestive of persistent drag on the EUR.
“Trendline resistance is just above parity close to the 50-day SMA at 1.0015.”
-
09:59
GBP/USD: Rejection at 1.1500 recalls sellers ahead of Truss, US data
- GBP/USD is off the lows but remains vulnerable near 1.1400.
- The US dollar recovery strengthens amid broad risk aversion.
- Cable bears eye 21 DMA once again after rejection at 1.1500.
GBP/USD is correcting from three-week highs of 1.1495, snapping a six-day uptrend, as the US dollar jumps back on the bids amid broad risk aversion.
Escalating geopolitical tensions between Russia and Europe over the Ukraine war keep investors on the edge. The European Union (EU) backs sanctions against Russia, including the oil price cap. The flight to safety team persists, underpinning the dollar’s safe-haven appeal.
Investors refrain from placing any directional bets on the pound ahead of UK PM Liz Truss’ address to the Tory party. In the meantime, cable finds some comfort from the upward revision to the UK final S&P Global Services PMI, which came in at 50.0 in September.
Attention now turns towards the US ADP employment and ISM Services PMI due later in the NA session for fresh trading opportunities.
As observed on a daily chart, GBP/USD eyes the horizontal 21-Daily Moving Average (DMA) at 1.1297 on its retreat from higher levels.
The next downside target is seen at 1.1250 the psychological level.
The 14-day Relative Strength Index (RSI), however, is holding above the midline while keeping the bullish bias intact.
Alternatively, the descending trendline resistance at 1.1662 remains on buyers’ radars once the 1.1500 level gets cleared.
GBP/USD: Daily chart
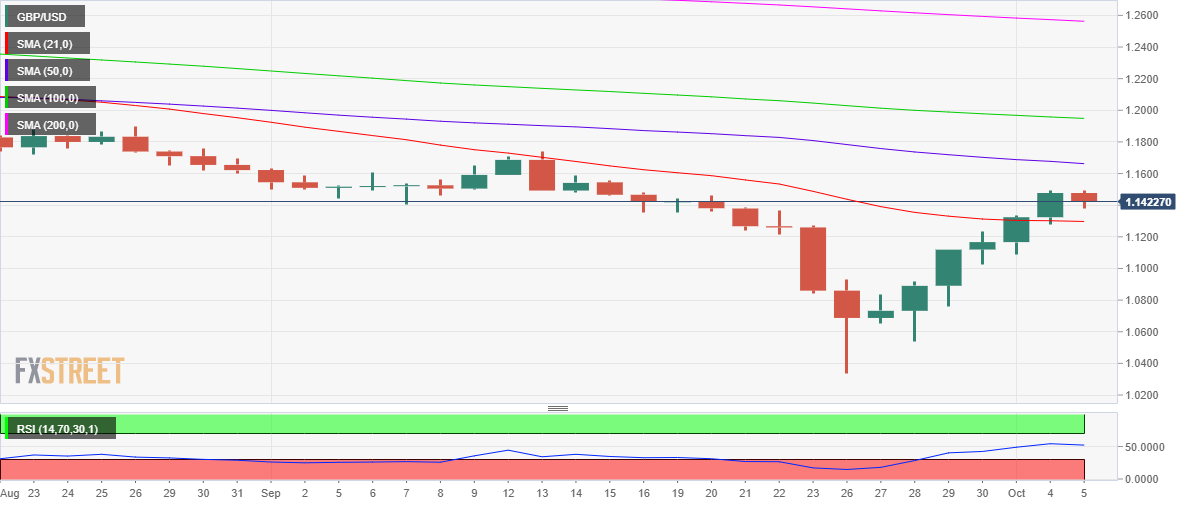
GBP/USD: Additional technical levels
-
09:50
GBP/USD could easily reverse to the 1.1200 area – ING
GBP/USD is now back to levels before the UK government’s fiscal event on 23 September. In the view of analysts at ING, cable could retrace to the 1.12 zone.
Government’s fiscal reputation has been tarnished
“The government’s fiscal reputation has been tarnished and news that the chancellor may not after all bring forward his medium-term fiscal statement leaves sterling vulnerable.”
“We suspect that the sterling rebound and the dollar correction may have come far enough and could easily see cable reversing to the 1.1200 area.”
-
09:31
United Kingdom S&P Global/CIPS Services PMI registered at 50 above expectations (49.2) in September
-
09:30
United Kingdom S&P Global/CIPS Composite PMI registered at 49.1 above expectations (48.4) in September
-
09:25
Gold Price Forecast: XAU/USD needs clearance of the 50 DMA for a move towards $1,750
Gold price is fading its bullish momentum this Wednesday. As FXStreet’s Dhwani Mehta notes, 50 DMA appears a tough nut to crack for XAU/USD bulls.
The pullback in the bullion appears temporary
“A sustained break above the bearish 50-Daily Moving Average (DMA) at $1,724 is needed to challenge the September highs at $1,735, above which the $1,750 psychological level will come into play.”
“On the downside, the previous critical resistance now support at $1,700 could offer temporary reprieve to buyers, below which the previous day’s low of $1,695 could be revisited. Powerful support at $1,680 will be the last line of defense for gold bulls. That level is the confluence of the mildly bullish 21 DMA and the falling trendline resistance-turned-support.”
See – Gold Price Forecast: XAU/USD to drift lower again towards $1,580 – TDS
-
09:04
EUR/USD: Bulls face a tough hurdle at the parity zone
- EUR/USD falters once again near the parity level.
- Germany’s trade surplus surprised to the downside in August.
- Germany final Services PMI came at 45.0 in September.
Investors seem to be cashing up part of the recent strong advance and drag EUR/USD back to the mid-0.9900s so far in the European morning.
EUR/USD remains capped by the parity region
After two consecutive daily advances, EUR/USD now comes under some moderate selling pressure on the back of the marked bounce in the demand for the greenback.
Indeed, the USD Index (DXY) manages to regain some upside traction after bottoming out near the 110.00 mark – or 2-week lows – amidst the modest recovery in US and German yields.
Data wise in the Euroland, Germany’s trade surplus shrank to €1.2B in August and Industrial Production in France expanded more than expected 2.4% MoM also in the same period. In addition, final results saw the Services PMI in Germany ease to 45.0 and 48.8 when it comes to the broader euro bloc.
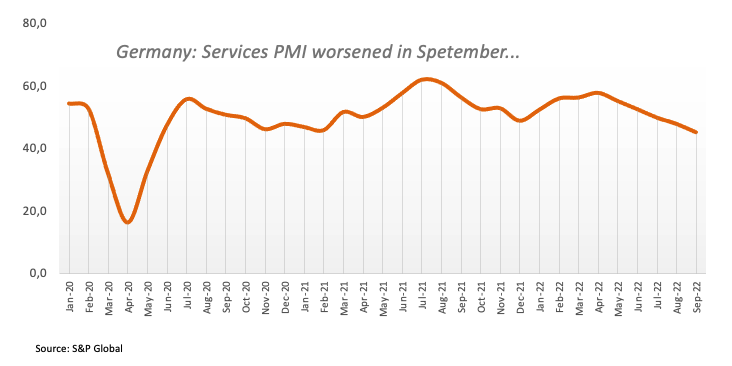
Across the ocean, MBA Mortgage Applications, the ADP Employment Change Report, Balance of Trade, final S&P Global Services PMI and the ISM Non-Manufacturing are all due later in the NA session. On the Fed’s side, Atlanta Fed R.Bostic is also due to speak.
What to look for around EUR
EUR/USD’s acute rebound has so far met quite a firm resistance near the key parity zone.
In the meantime, price action around the European currency is expected to closely follow dollar dynamics, geopolitical concerns and the Fed-ECB divergence. The latter has been exacerbated further following the latest rate hike by the Fed and the persevering hawkish message from Powell and the rest of his rate-setters peers.
Furthermore, the increasing speculation of a potential recession in the region - which looks propped up by dwindling sentiment gauges as well as an incipient slowdown in some fundamentals – adds to the sour sentiment around the euro
Key events in the euro area this week: Germany Balance of Trade, EMU, Germany Final Services PMI (Wednesday) – Germany Construction PMI, EMU Retail Sales, ECB Accounts (Thursday) – Germany Retail Sales (Friday).
Eminent issues on the back boiler: Continuation of the ECB hiking cycle. Italian post-elections developments. Fragmentation risks amidst the ECB’s normalization of its monetary conditions. Impact of the war in Ukraine and the persistent energy crunch on the region’s growth prospects and inflation outlook.
EUR/USD levels to watch
So far, the pair is retreating 0.45% at 0.9939 and faces the immediate contention at 0.9535 (2022 low September 28) ahead of 0.9411 (weekly low June 17 2002) and finally 0.9386 (weekly low June 10 2002). On the other hand, the breakout of 0.9999 (weekly high October 4) would target 1.0030 (55-day SMA) en route to 1.0050 (weekly high September 20).
-
09:01
European Monetary Union S&P Global Composite PMI registered at 48.1, below expectations (48.2) in September
-
09:01
European Monetary Union S&P Global Services PMI below forecasts (50.2) in September: Actual (48.8)
-
09:00
Italy Public Deficit/GDP came in at 3.1%, below expectations (4.9%) in 2Q
-
08:55
Germany S&P Global/BME Services PMI below forecasts (45.4) in September: Actual (45)
-
08:55
Germany S&P Global/BME Composite PMI came in at 45.7 below forecasts (45.9) in September
-
08:51
EUR/USD: Bullish push above is unsustainable – ING
EUR/USD is now pressing the 1.000 resistance. But in the view of economists at ING, a return to above-parity levels looks unsustainable.
EUR/USD to suffer a drop to the low 0.90 area into year-end
“We struggle to see much more behind the pair’s rally other than a position-squaring event and a broad dollar correction. Despite European assets rebounding quite sharply, it’s hard to point to any material change in the eurozone’s outlook that would warrant a significant return of market appetite for the euro just yet.”
“There is not enough bullish push to keep EUR/USD above parity on a sustainable basis, and we still forecast a drop to the low 0.90 area into year-end.”
-
08:51
France S&P Global Composite PMI in line with expectations (51.2) in September
-
08:51
France S&P Global Services PMI below expectations (53) in September: Actual (52.9)
-
08:45
Italy S&P Global Services PMI came in at 48.8, below expectations (49.2) in September
-
08:45
USD/CNH still faces downside risks – UOB
Further downside in USD/CNH looks likely, although there is a solid support around 7.0000, comment Economist Lee Sue Ann and Markets Strategist Quek Ser Leang at UOB Group’s Global Economics & Markets Research.
Key Quotes
24-hour view: “Yesterday, we noted that ‘the underlying tone in USD is soft’ and we held the view that ‘any further weakness in USD is likely limited to a test of 7.0800’. We did not expect the rapid downward acceleration as USD plunged to 7.0332 before closing on a weak note (7.0387, -0.92%). Not surprisingly, the sharp and swift decline is oversold but with no sign of stabilization just yet, USD could continue to weaken. However, the major support at 7.0000 is unlikely to come into view today (there is another support at 7.0200). Resistance wise, a breach of 7.0750 (minor resistance is at 7.0620) would indicate the weakness in USD has stabilized.”
Next 1-3 weeks: “Last Friday (30 Sep, spot at 7.1000), we highlighted that the recent USD rally has topped out and we expected USD to consolidate within a broad range of 7.0500/7.2200. Yesterday, USD took out 7.0500 and plummeted to a low of 7.0332. The break of the 7.0500 support combined with the rapid build-up in downward momentum suggests that USD could drop further. That said, it remains to be seen if USD can break the major and significant support at 7.0000. Overall, only a breach of 7.1170 (‘strong resistance’ level) would indicate the downside risk in USD has subsided.”
-
08:40
USD Index rebounds from recent lows and retests 110.50 ahead of data
- The index reverses the recent pullback and advances to 110.50.
- US yields attempt a mild recovery across the curve.
- ADP Report, ISM Non-Manufacturing take centre stage in the docket.
The greenback regains the smile following the recent sharp decline and retakes the 110.50 region when gauged by the USD Index (DXY) on Wednesday.
USD Index now looks to data
The index picks up some pace and partially reverses two consecutive daily drops amidst some loss of momentum in the risk complex in light of the recent needle-like rebound, particularly in the euro and the British pound.
The recovery in the buck so far comes in tandem with a tepid bullish attempt in US yields across after two consecutive sessions closing with gains, especially in the short end and the belly of the curve.
Interesting calendar in the US later on Wednesday will see the usual weekly MBA Mortgage Applications due in the first turn seconded by the ADP Employment Change Report for the month of September, Balance of Trade results, final S&P Global Services PMI and the ISM Non-Manufacturing.
In addition, Atlanta Fed R.Bostic (2024 voter, hawk) is also due to speak.
What to look for around USD
A hint of a recovery seems to have emerged around the dollar midweek after some decent support appears to have turned up near the 110.00 neighbourhood.
While the near-term outlook for the dollar looks somewhat dented, the firmer conviction of the Federal Reserve to keep hiking rates until inflation looks well under control regardless of a likely slowdown in the economic activity and some loss of momentum in the labour market continues to prop up the underlying positive tone in the index.
Looking at the more macro scenario, the greenback also appears bolstered by the Fed’s divergence vs. most of its G10 peers in combination with bouts of geopolitical effervescence and occasional re-emergence of risk aversion.
Key events in the US this week: MBA Mortgage Applications, ADP Employment Change, Balance of Trade, Final Services PMI, ISM Non-Manufacturing (Wednesday) – Initial Jobless Claims (Thursday) – Nonfarm Payrolls, Unemployment Rate, Consumer Credit Change, Wholesale Inventories (Friday).
Eminent issues on the back boiler: Hard/soft/softish? landing of the US economy. Prospects for further rate hikes by the Federal Reserve vs. speculation of a recession in the next months. Geopolitical effervescence vs. Russia and China. US-China persistent trade conflict.
USD Index relevant levels
Now, the index is gaining 0.28% at 110.51 and faces the next up barrier at 114.76 (2022 high September 28) seconded by 115.00 (round level) and then 115.32 (May 2002 high). On the other hand, a breach of 110.05 (weekly low October 4) would open the door to 109.35 (weekly low September 20) and finally 107.68 (monthly low September 13).
-
08:21
USD/IDR to hit 15,500 before stabilising in 2023 – MUFG
In September, the Indonesian rupiah weakened against the US dollar rates from 14,840 to 15,224. Economists at MUFG Bank expect the USD/IDR pair to reach 15,500 before easing back lower next year.
IDR may see some support from a hawkish BI and current account trends
“We now expect BI to hike by another 75 bps in Q4-2022 and another 75 bps in 2023.”
“IDR may be supported by resilient current account dynamics. We forecast a current account surplus of 0.4% of GDP in 2022 and 0.5% deficit in 2023.”
“We forecast USD/IDR at 15,500 in Q4 and before stabilising in 2023.”
“We forecast USD/IDR at 15,300 in Q1-2023, 15,100 in Q2-2023 and 14,900 in Q3-2023.”
-
08:16
Spain S&P Global Services PMI below forecasts (49.9) in September: Actual (48.5)
-
08:11
EU’s Borell: Council to reach agreement on proposals on new sanctions against Russia today
European Union (EU) Foreign Policy Chief Josep Borrell said that the Council is expected to reach an agreement on proposals on new sanctions against Russia on Wednesday.
Borell noted, “you can trust the Council will reach sanctions deal today.”
European Commission President Ursula von der Leyen came out on the wires, citing that “Russia pipeline gas supplies to EU is at 7.5% from 40%.”
“Gas storage in eu now at 90% vs. 75% last year,” von der Leyen added.
-
08:01
Forex Today: Markets turn cautious ahead of key US data
Here is what you need to know on Wednesday, October 5:
Following a two-day risk rally, markets seem to have turned cautious mid-week. The US Dollar Index, which is already down more than 1.5% so far this week, stays relatively quiet above 110.00 early Wednesday and the 10-year US Treasury bond yield holds steady at around 3.6%. The US economic docket will feature the ADP's private sector employment report and the ISM's PMI survey for the service sector for September alongside Goods Trade Balance data for August. The European Union is scheduled to release the details of the new sanctions against Russia that include the oil price cap.
ADP Jobs Preview: How the data creates a dollar selling opportunity ahead of the ISM Services PMI.
Market participants will keep a close eye on headlines coming out of the OPEC+ meeting as well. Reports suggesting that the group could lower production by as much as 2 million barrels per day caused oil prices to rise late Wednesday. The barrel of West Texas Intermediate (WTI) rose nearly 4% on Tuesday following Monday's 5% gain and was last seen trading within a touching distance of $87.
Reflecting the souring market mood, US stock index futures are down between 0.4% and 0.5% early Wednesday. Rising geopolitical tensions seem to be weighing on risk sentiment. In response to Washington's decision to send more military aid to Ukraine, Russia's ambassador to the US said earlier in the day that the danger of a direct clash between Russia and the west had escalated.
During the Asian trading hours, the Reserve Bank of New Zealand announced that it hiked its policy rate by 50 basis points (bps) to 3.5% as expected. The bank noted that the committee considered whether to raise the rate by 50 or 75 bps before deciding to opt for a 50 bps that was appropriate to maintain price stability and contribute to maximum sustainable employment. With the initial reaction, NZD/USD climbed above 0.5800 for the first time since September 23 but retreated toward 0.5750 amid risk aversion.
EUR/USD registered impressive gains on Tuesday and tested parity before going into a consolidation phase. As of writing, the pair was moving sideways near 0.9980.
GBP/USD closed the sixth straight day in positive territory on Tuesday and touched its highest level in nearly three weeks at 1.1490. The pair is fluctuating in a narrow range above 1.1450 early Wednesday.
After having gained over 2% on Monday, gold preserved its bullish momentum amid slumping global bond yields and pierced through $1,700 on Tuesday. XAU/USD is already up 4% this week and trading above $1,720.
USD/JPY edged lower on the relentless dollar selloff on Tuesday but found support near 144.00. The pair holds in positive territory near 144.20 early Wednesday. Japanese Prime Minister Fumio Kishida said on Wednesday, that it is important to link the weak yen to economic recovery by reopening inbound tourism and corporate reshoring.
Bitcoin rose nearly 4% on Tuesday and reclaimed $20,000 before going into a consolidation phase slightly above that level on Wednesday. Ethereum is up more than 6% this week and trades at around $1,350 in the European morning.
-
07:58
GBP/USD: Limited potential for longer run gains – Scotiabank
GBP/USD has staged a powerful rebound from the all-time low reached in late September at 1.0350. Have we seen the low? Economists at Scotiabank note that headwinds for the pound remain strong.
GBP/USD may regain 1.17/1.18 in the near-term
“The rebound in the pound may extend in the short run but potential for longer run gains may be limited until political, economic and fiscal risks are clearer.”
“Cable may regain 1.17/1.18 in the near term but gains beyond that will likely hinge on the broader USD trend.”
-
07:47
Gazprom: We have resumed gas supplies to Italy via Austria
Russian state-owned energy giant, Gazprom, said in a statement on Wednesday, “we have resumed gas supplies to Italy via Austria.”
“We have found a solution to resume gas supplies to Italy,” Gazprom said.
Meanwhile, Russian media outlets report that President Vladimir Putin has formally signed the law annexing four Ukrainian regions.
Market reaction
The euro caught a fresh bid wave on gas supplies optimism, driving EUR/USD back towards parity. The spot is currently trading at 0.9985, modestly flat on the day.
-
07:45
France Industrial Output (MoM) came in at 2.4%, above expectations (-0.3%) in August
-
07:42
Tensions between US and China to remain high in the years to come – Danske Bank
Biden’s administration has taken an even more hawkish stance on China compared to what most expected. While economists at Danske Bank do not expect any disruptive measures to be taken by either side in the near-term, the gradual decoupling and Cold War sentiment is set to continue.
Tensions to continue but no near-term disruptive measures
“In the US the negative view of China is bi-partisan and shared by the population. And to some extent, Democrats and Republicans compete on who is the toughest on China.”
“On the Chinese side, it is unlikely that it will give in to US demands for changes. China believes its’ system is more effective in solving problems and meeting challenges and it comes from a collectivist origin that goes thousands of years back, which China is increasingly proud of.”
“While we don’t expect the Biden administration to take any disruptive measures, such as a new trade war, the path of gradual decoupling measures such as rising tech restrictions on China and self-sufficiency measures in new sectors (such as biotech) is set to continue. Human rights-related sanctions may also increase.”
“China will work on decoupling by seeking more self-reliance and investing heavily in tech and increasing energy and food security.”
“Tensions are also likely to stay elevated around Taiwan where a new status quo with a very high level of tension is the new normal.”
-
07:35
RBA: Slower pace of rate hikes points to tightening cycle extending into 2023 – ANZ
Economists at ANZ Bank had expected the Reserve Bank of Australia (RBA) to tighten by 50 bps in October. They now have the RBA cash rate target peaking at 3.6% in May 2023, up 25 bps from previous peak of 3.35%.
Peak in the RBA’s tightening cycle lifted
“We see the RBA’s decision to slow the pace of rate hikes as extending the duration of the cycle. The slower pace of rate hikes increases the risk that rates need to go higher than previously expected, as demand remains too strong and sentiment is initially boosted by the RBA’s moderation.”
“Our revised rate path has the RBA tightening by 25 bps in November, then pausing until successive 25 bps increases in February and March. From there we think evidence of further acceleration in wages growth will push the RBA to tighten by a final 25 bps in May to 3.6%.”
-
07:34
FX option expiries for Oct 5 NY cut
FX option expiries for Oct 5 NY cut at 10:00 Eastern Time, via DTCC, can be found below.
- EUR/USD: EUR amounts
- 0.9800 1.89b
- 0.9825-30 330m
- 0.9930-35 1.28b
- 0.9950-60 715m
- 0.9965-70 357m
- USD/JPY: USD amounts
- 143.85 220m
- 144.00-05 693m
- 144.20-25 255m
- 146.00 430m
- AUD/USD: AUD amounts
- 0.6400 252m
- 0.6450 302m
- EUR/JPY: EUR amounts
- 142.20 809m
- EUR/CHF: EUR amounts
- 0.9700 330m
-
07:23
Gold Price Forecast: XAU/USD to drift lower again towards $1,580 – TDS
Gold extended gains smartly past $1,700. Nevertheless, strategists at TD Securities expect XAU/USD to reverse recent rally towards $1,580.
Firm resistance aligns at $1,763-73
“The yellow metal is trading at the 50-day moving average, which we judge should serve as the first level of resistance. If there is sufficient momentum to settle materially above that level, the 100-day moving average/Fib ($1,763-73) points should be an even firmer resistance zone.”
“We see gold losing steam and again drifting toward our target of $1,580 over the coming months, as the Fed continues to stick to its hawkish plan to move the Fed Funds above the 4.5% mark and keep rates in restrictive mode until inflation is licked. Or at least until such time, there is a high probability that inflation can move close to target. This will take well into 2023 or beyond.”
-
07:18
GBP/USD: Sterling to rally if BoE ends emergency programme of gilt purchases – Commerzbank
Sterling has been able to retrace its losses recorded following the budget debacle. Bank of England’s (BoE) decision on the end of the emergency programme of gilt purchases is key to the future of the currency, economists at Commerzbank report.
BoE not made any gilt purchases, a positive sign for sterling
“Yesterday, the BoE even announced that it had not made any purchases as part of its emergency programme initiated as a result of the sell-off last week. By doing so it seems to want to signal that it wants to intervene as little as possible to calm the gilt market. This, for now, is a positive sign for sterling.”
“What is going to be even more interesting is whether the central bankers really will end the programme on 14th October as announced. If the BoE will end the purchases as planned sterling might benefit significantly, as the bank would hereby signal that it is sticking to its restrictive path. If, on the other hand, it was to continue the programme for fear of a renewed rise in long-term market rates sterling exchange rates are likely to go south again.”
-
07:17
USD/JPY risks a probable test of 143.00 – UOB
In the opinion of Economist Lee Sue Ann and Markets Strategist Quek Ser Leang at UOB Group’s Global Economics & Markets Research, USD/JPY could now slip back to the 143.00 region in the next few weeks.
Key Quotes
24-hour view: “Our view for USD to ‘trade sideways between 144.20 and 145.15’ yesterday was incorrect. USD dropped to a low of 143.88 before extending its decline in early Asian trade. Downward momentum is building rapidly and the risk is for USD to break 143.50. However, USD is unlikely to challenge the next major support at 143.00. On the upside, 144.55 is likely strong enough to cap any intraday rebound (minor resistance is at 144.20).”
Next 1-3 weeks: “Two days ago (03 Oct, spot at 144.70), we highlighted that the recent build-up in upward momentum has fizzled out and we expected USD to trade between 143.50 and 145.60. Yesterday, USD dropped to a low of 143.88 before extending its decline today. Short-term downward momentum is building and we expect USD to trade with a downward bias towards 143.00 in the coming days. Our view will be invalidated if USD breaks above the ‘strong resistance’ level, currently at 144.90.”
-
07:14
Gold Price Forecast: XAU/USD juggles around $1,720 as DXY turns subdued, US ADP job data buzz
- Gold price is playing in a limited territory around $1,720.00 ahead of US ADP Employment data.
- The risk sentiment is displaying a mixed response as yields have turned sideways.
- The event of the US NFP will display the true status of the US labor market.
Gold price (XAU/USD) oscillating around $1,720.00 after dropping from $1,726.50 as investors are awaiting the US Automatic Data Processing (ADP) employment data release for fresh cues. Fresh demand recorded in the US dollar index (DXY) from 110.20 is fading now as the fragile rebound move is met with significant offers of around 110.50.
Risk-profile is displaying mixed response as yields have turned sideways. The 10-year benchmark US Treasury yields are hovering below their day’s high of 3.64%.
FX domain needs fresh impetus for a decisive move and investors have shifted their focus toward the US ADP data. As per the projections, the US labor market has witnessed a fresh addition of 200k jobs in September vs. the former addition of 132k. The status of lower job additions could compel the Federal Reserve (Fed) to slow down the pace of hiking interest rates as economic projects are needed to be cared for while combating the inflationary pressures.
Later this week, the US Nonfarm Payrolls (NFP) data will provide the true picture of employment status in the US. Considering the US NFP data, the US economy has created 250k jobs in September, lower than the August reading of 315k.
Gold technical analysis
Signs of exhaustion in the uptrend are clearly visible in the gold prices after failing to continue the bumper rally towards the 61.8% Fibonacci retracement (placed from August 10 high at $1,807.93 to September low at $1,614.85) at $1,734.58. Consideration of a bearish reversal could be a little early as corrective moves are generally observed after a juggernaut rally.
The gold prices are comfortably established above the 200-period Exponential Moving Average (EMA) at $1,696.00.
The Relative Strength Index (RSI) (14) is showing a bullish bias as it is oscillating in a bullish range of 60.00-80.00. However, a correction towards 60.00 cannot be ruled out.
Gold four-hour chart
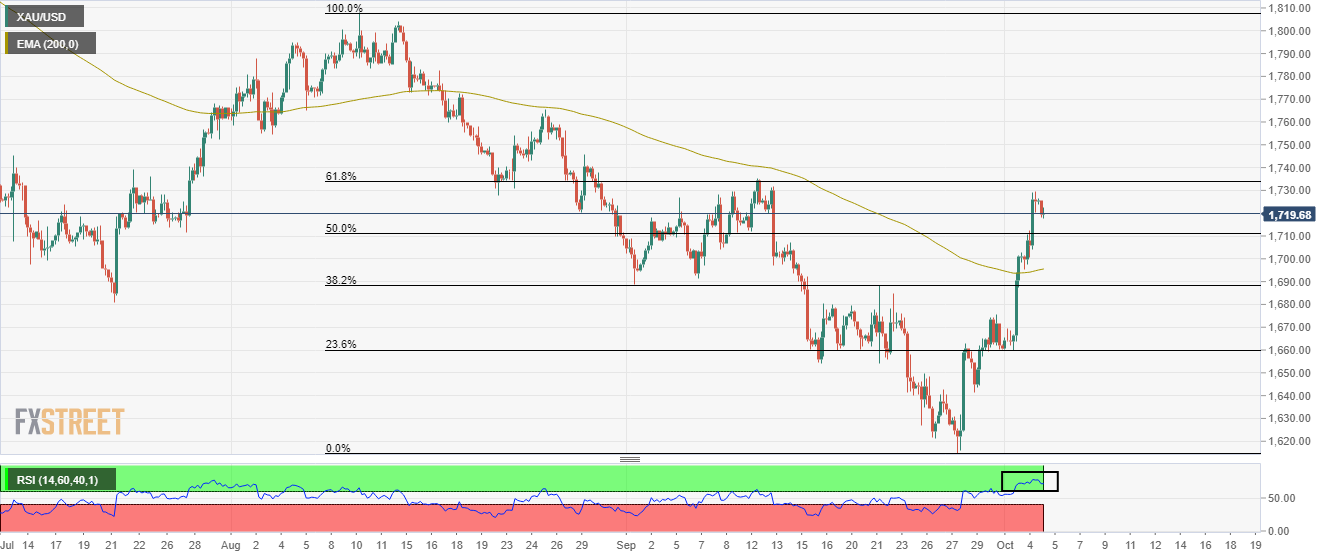
-
07:11
RBNZ throws cold water to an imminent pivot – TDS
The Reserve Bank of New Zealand (RBNZ) hiked the Official Cash Rate (OCR) by 50 bps to 3.50%. Today's Statement makes clear the RBNZ job is far from done. Thus, economists at TD Securities expect the terminal rate to hit 4.50% in April 2023.
Still some heavy lifting to do
“The RBNZ hiked the OCR by 50 bps as expected to 3.50%. The Bank reiterated continuing to hike ‘at pace’ given the demand for goods continues to exceed supply, core inflation is too high and the labour market is very tight.”
“Although the Bank considered hiking 75 bps today, we still expect a 50 bps hike next month.”
“The RBNZ Governor's comments that the hike cycle is very mature and the possibility the Board pays more attention to offshore risks opens a downshift to 25 bps hikes in Feb and Apr'23 taking terminal to 4.50%. Unless there is a destabilising risk event, the risks to our OCR forecast are to the upside.”
-
07:05
EUR/USD: Energy crisis justify increased risk premium on euro for the time being – Commerzbank
EUR/USD made significant gains on Tuesday and only just missed parity. How sustainable is the euro strength? Economists at Commerzbank believe that the shared currency should remain under pressure as energy crisis is far from over.
Market may underestimate the economic pain energy crisis will cause
“The recovery is likely to be attributable to a weaker US dollar, which weakened after the disappointing US purchasing managers' index for the manufacturing sector and the significant decline in job openings in August.”
“A strengthening of the euro may also have helped. It seems to me that the market is somewhat more optimistic that the eurozone will weather the energy crisis this winter more smoothly than previously feared.”
“It remains highly uncertain to what extent the current energy crisis will continue to weigh on Europe's economy in the longer term, which in my view justifies an increased risk premium on euro exchange rates for quite some time to come.”
-
07:01
Russia S&P Global Services PMI: 51.1 (September) vs 49.9
-
07:00
Germany Imports (MoM) above forecasts (0.7%) in August: Actual (3.4%)
-
07:00
Germany Exports (MoM) above forecasts (1%) in August: Actual (1.6%)
-
07:00
Germany Trade Balance s.a. below expectations (€4B) in August: Actual (€1.2B)
-
06:44
Natural Gas Futures: The continuation of the rebound seems probable
Considering advanced figures from CME Group for natural gas futures markets, open interest increased for the second session in a row, this time by nearly 10K contracts. In the same line, volume rose for the third straight session, now by around 16.1K contracts.
Natural Gas remains supported near $6.50
Tuesday’s decent bounce in prices of natural gas was on the back of rising open interest and volume, allowing for further upside in the very near term. In the meantime, the 200-day SMA near $6.50 continues to hold the downside for the time being.
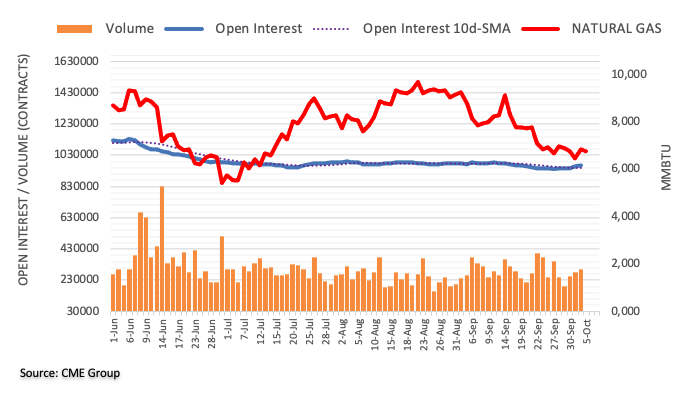
-
06:41
AUD/USD defends the 0.6480 support as focus shifts to US ISM Services PMI
- AUD/USD has picked bids around 0.6480 as risk-on rebounds after yields dropped to near 3.62%.
- Investors are awaiting the release of the US ISM Services PMI and ADP job data for making informed decisions.
- The aussie bulls remained lackluster despite better-than-former S&P PMI data.
The AUD/USD pair has sensed buying interest around 0.6480 as the pullback move in the US dollar index (DXY) seems terminating now. Traction is returning towards the risk-on market profile as yields have dropped from day’s high. The 10-year US Treasury yields have eased sharply after recording the day’s high at 3.64% and have slipped to 3.62% while writing.
It could be concluded that the DXY is sensing pressure ahead of the release of the US ISM Services PMI data. As per the consensus, the US ISM Services PMI will decline to 56.0 vs. the prior release of 56.9. It seems that the continuation of the policy tightening stance by the Federal Reserve (Fed) has started displaying its consequences. Retail demand is curtailing now and eventually, the service industry is taking a hit.
Adding to that, the US ISM Services New Order Index data is seen significantly lower at 58.9 against the prior release of 61.8. A decline in the forward-looking indicator is expected to bring sheer volatility to the DXY.
Apart from the Services PMI data, US Automatic Data Processing (ADP) Employment Change data will remain in focus. The consensus for economic data indicates that the US economy has added 200k jobs in the labor market in September vs. the former release of 132k.
Meanwhile, returning optimism in markets is supporting the aussie. In early Asia, IHS Markit reported the S&P PMI data. The Composite PMI released higher at 50.9 against the prior figure of 50.8 while the Services PMI gained to 50.6 against the projections of 50.4.
-
06:36
AUD/USD now moved to a consolidative phase – UOB
AUD/USD is now expected to trade within the 0.6400-0.6630 range in the next few weeks, comment Economist Lee Sue Ann and Markets Strategist Quek Ser Leang at UOB Group’s Global Economics & Markets Research.
Key Quotes
24-hour view: “Yesterday, we held the view that ‘the rapid rise in AUD could extend to 0.6550 but in view of the overbought conditions, a sustained rise above this level is unlikely’. Our view was not wrong as AUD popped to a high of 0.6547 in Asian trade before trading choppily for the rest of the sessions. The price movement is viewed as part of a consolidation and we expect AUD to trade between 0.6450 and 0.6540 for today.”
Next 1-3 weeks: “There is not much to add to our update from yesterday (04 Oct, spot at 0.6515). As highlighted, the recent 3-week weakness in AUD has stabilized and AUD is likely to consolidate and trade between 0.6400 and 0.6630 for the time being.”
-
06:32
Crude Oil Futures: Green light to further gains
CME Group’s flash data for crude oil futures markets saw traders add around 1.2K contracts to their open interest positions on Tuesday, extending the choppy activity seen in past sessions. Volume followed suit and rose for the second consecutive session, this time by around 44.8K contracts.
WTI now looks to a test of $90.00 and above
Prices of the WTI went up for the second straight session on Tuesday on the back of increasing open interest and volume. That said, the continuation of the ongoing rebound appears likely in the very near term and with the immediate resistance at the $90.00 mark per barrel and beyond.
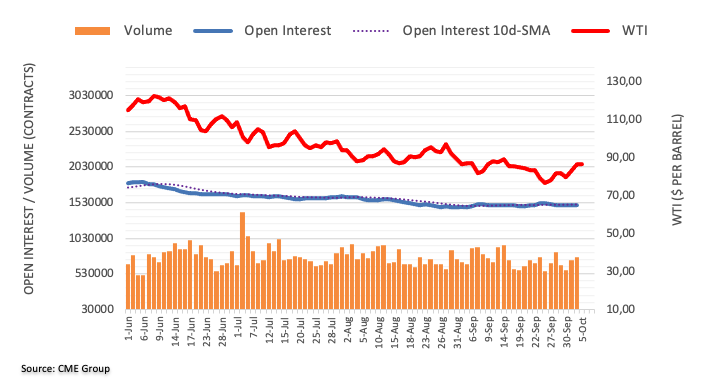
-
06:11
GBP/USD faces strong resistance at 1.1600 – UOB
The upside momentum in GBP/USD now faces a tough barrier at the 1.1600 region, note Economist Lee Sue Ann and Markets Strategist Quek Ser Leang at UOB Group’s Global Economics & Markets Research.
Key Quotes
24-hour view: “We highlighted yesterday that GBP ‘could continue to rise even though the chance of a break of 1.1400 is not high’. The anticipated GBP strength exceeded our expectations by a large margin as GBP surged to a high of 1.1490. The rally appears to be severely overextended but with no signs of easing just yet, GBP could rise further to 1.1530 before a more sustained pullback is likely. For today, GBP is unlikely to challenge the major resistance at 1.1600. On the downside, a breach of 1.1330 (minor support is at 1.1380) would indicate that the strong rally over the past few days is ready to take a breather.”
Next 1-3 weeks: “We called for a bottom in GBP last Friday (30 Sep, spot at 1.1150) and our view was correct. Yesterday (04 Oct, spot at 1.1325) we held the view that GBP could rebound further to 1.1450. However, GBP rose more than expected as it surged to a high of 1.1490 in late NY trade. Not surprisingly, upward momentum is strong and GBP could advance further. However, GBP is unlikely to be able to maintain the frenetic pace of advance. Overall, as long as 1.1230 (‘strong support’ level was at 1.1000 yesterday) is not breached, there is room for GBP to advance further but it remains to be seen if it can break the next resistance at 1.1600.”
-
06:07
Gold Futures: Upside could take a breather
Open interest in gold futures markets shrank by just 29 contracts on Tuesday, partially offsetting the previous daily build according to preliminary readings from CME Group. In the same line, volume resumed the downside and went down by around 10.8K contracts.
Gold looks capped by $1,735
Gold prices rose for the sixth consecutive session on Tuesday and surpassed the key $1,700 mark at the same time. The strong uptick, however, came on the back of declining open interest, which hints at the likelihood that the acute rebound could take a breather in the very near term. In the meantime, the next hurdle comes at the September high at $1,735 per ounce troy (September 12).
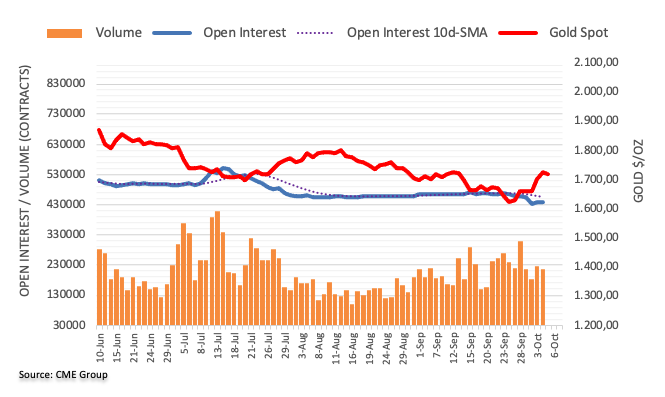
-
06:07
Japan PM Kishida: Important to link weak yen to economic recovery
Japanese Prime Minister Fumio Kishida said on Wednesday, “important to link weak yen to economic recovery by reopening inbound tourism, corporate reshoring.”
Additional quotes
Ready to speak with North Korea's Kim without any preconditions.
Japan's economic sanctions against North Korea having some impact.
Specific monetary policy tools are up to BOJ to decide, including the exit of easing.
No comment on FX rates.
No decision has been made on japan-china leaders' meeting at the moment.
Related reads
- USD/JPY Price Analysis: Volatility contraction continues as bulls defend 143.50
- BOJ offers to purchase JGBs on Wednesday
-
06:02
USD/JPY Price Analysis: Volatility contraction continues as bulls defend 143.50
- A responsive buying action around 143.50 has underpinned the greenback bulls.
- The fakeout action call for a sheer movement at the opposite.
- The momentum oscillator (RSI) (14) bounced firmly after dragging to near 40.00.
The USD/JPY pair has turned sideways around 144.20 after witnessing a responsive buying action from 143.60 as the US dollar index (DXY) has rebounded. The DXY has picked bids around 110.20 and is aiming to extend recovery above 110.47. S&P500 futures have dropped more than 0.5% as the risk profile has soured a bit after remaining extremely positive.
On a four-hour scale, the asset is oscillating in a 143.90-145.35 range for the past two weeks. It is worth noting that the greenback bulls have defended the downside break of the consolidation. This could be considered a fake break which results in a sheer performance at the opposite.
The asset is oscillating minutely below the 20-and 50-period Exponential Moving Averages (EMAs) at 144.43 and 144.28, which doesn’t indicate a bearish reversal for now.
Meanwhile, the Relative Strength Index (RSI) (14) is oscillating in a 40.00-60.00 range, which supports the sideways movement. One thing is worth mentioning is that the momentum oscillator has sensed demand at 40.00, which indicates the availability of significant bids on lower levels.
The greenback bulls could drive the asset higher after overstepping September 22 high at 145.90, which will drive the asset towards August 1998 high at 147.67. A breach of the latter will send the major towards the psychological resistance of 150.00.
For a decisive bearish reversal, the asset is required to drop below September 22 low at 140.35. An occurrence of the same will drag the asset towards the August 30 low at 138.05 followed by the August 23 low at 135.81.
USD/JPY four-hour chart
-638005429177631237.png)
-
06:02
NZD/USD Price Analysis: Bearish RSI kills bulls’ apetite above 0.5800
- NZD/USD reverses entire RBNZ-led gains, as USD recovers.
- RBNZ delivers a hawkish 50 bps rate hike at its October meeting.
- The kiwi fails to sustain the upside above 0.5800.
NZD/USD has turned neutral on the day at around 0.5735, reversing the entire RBNZ rate hike outcome-induced rally above 0.5800.
The rebound in the US dollar across the board amid mixed market sentiment and pre-American jobs data anxiety, limiting the upside in the spot.
Further, markets assess the RBNZ hawkish rate hike announcement, especially after the central bank said that they had a debate over a 50 bps or a 75 bps rate hike. The kiwi central bank hiked the policy rates by 50 bps, as widely expected. In an immediate reaction to the RBNZ verdict, NZD/USD rallied nearly 80 pips from 0.5730 to 0.5807 highs.
Attention now turns towards the US ADP jobs report and the ISM Services PMI for fresh trading impetus in the pair.
From a short-term technical perspective, the bearish 100-Simple Moving Average (SMA) capped the NZD/USD upswing near 0.5815.
Although bulls remain hopeful so long as the solid support at 0.5690 is defended. Note that the 21 SMA crossed the 50 SMA for the upside, validating a bull cross on the said timeframe.
The Relative Strength Index (RSI) is holding above the midline, suggesting that any pullback in the price could be seen as a good dip buying opportunity.
Acceptance above the 100 SMA will call for a test of the next horizontal trendline resistance at around 0.5885.
On the downside, sellers will target the 0.5650 round level should the abovementioned powerful support of 0.5690 yield in.
NZD/USD: Four-hour chart

NZD/USD: Additional levels to consider
-
06:01
Singapore Retail Sales (YoY) came in at 13% below forecasts (14.4%) in August
-
06:00
Singapore Retail Sales (MoM) came in at -1.3%, below expectations (0.1%) in August
-
05:53
EUR/USD: Sustained upside expected above 1.0050 – UOB
Economist Lee Sue Ann and Markets Strategist Quek Ser Leang at UOB Group’s Global Economics & Markets Research suggest EUR/USD faces sustained gains once 1.0050 is cleared.
Key Quotes
24-hour view: “We highlighted last Friday (30 Sep, spot at 0.9825) that ‘the weakness in EUR has stabilized’ and we expected EUR to ‘consolidate and trade between 0.9630 and 0.9950’. Yesterday (04 Oct), EUR rocketed and gained a whopping 1.62% (NY close of 0.9983), its largest 1day advance since 2016. The breach of the 0.9950 resistance combined with the impulsive upward momentum has shifted the risk for EUR to the upside. That said, there is a significant and solid resistance at 1.0050 and EUR has to clear this hurdle before further sustained advance is likely. Overall, only a breach of the ‘strong support’ level, currently at 0.9835, would indicate that the upside risk for EUR has dissipated. “
Next 1-3 weeks: “Yesterday, we noted that ‘the underlying tone has firmed somewhat’ and while we expected EUR to edge higher, we held the view that ‘any advance is likely limited to a test of 0.9875’. In other words, we did not expect the outsized surge in EUR as it rocketed to a high of 0.9999. The sharp rally is deeply overbought but with no signs of easing just yet, further EUR strength is not ruled out. However, 1.0050 is a significant and solid resistance, and whether EUR can break through this level remains to be seen. Support is 0.9945 but only a breach of 0.9915 would indicate that the current strong upward pressure has subsided.”
-
05:25
WTI oscillates around $85.50 as investors await the OPEC meeting
- Oil prices have turned sideways at around $85.50 ahead of the OPEC meeting outcome.
- The US economy believes that current economic fundamentals don’t support production cuts.
- A build-up of oil stockpiles is expected to be disclosed by the EIA.
West Texas Intermediate (WTI), futures on NYMEX, are juggling around $85.50 as investors are awaiting the outcome of the OPEC meeting for making informed decisions. The risk-perceived assets are displaying some corrective moves as the risk-on market profile has eased a bit. Also, the US dollar index (DXY) has found interest near 110.20, which has resulted in a minor sell-off in the oil prices from a high above $86.00.
Wednesday’s OPEC meeting carries significant importance as it is the first face-to-face meeting of OPEC+ members after the emergence of the Covid-19 pandemic. Reports from RTRS dictate that OPEC will consider production cuts by two million barrels per day (bpd). The agenda of announcing production cuts is to support the oil prices.
Meanwhile, US officials are criticizing the move of further cuts in oil production as the current economic fundamentals don’t support the idea of tightening the oil market.
It is worth noting that the higher oil prices will delight Russia, which is providing oil at discounted rates to imported oil-dependent nations.
Apart from that, oil inventory data by the US Energy Information Administration (EIA) will be of utmost importance. The oil stockpiles are expected to build up by 0.097 million barrels for the past week ending September 30. In the US economy, the demand for oil is continuously declining, which could be concluded from weaker US ISM Manufacturing PMI data released on Monday.
-
05:17
Russia's ambassador to US: Danger risen of a direct clash between Russia and West
Russia's ambassador to the US said on Wednesday, “Moscow perceives Washington's decision to send more military aid to Ukraine as "immediate threat" to Russia's strategic interests.
The ambassador added that “the decision increases the danger of a direct military clash between Russia and Western Allied countries.”
It’s worth noting that the European Union (EU) agreed to new sanctions on Russia, including the oil price cap, details of which will be released on Wednesday.
Market reaction
The Russian headlines have little to no impact on the market sentiment, with the US S&P 500 futures continuing its drop of around 0.50% so far this Wednesday. Meanwhile, the US dollar index is advancing 0.27% on the day to trade at 110.35.
-
05:12
EUR/USD turns south below 1.0000 as dollar rebounds ahead of US data
- EUR/USD slips after running into resistance just below parity.
- The US dollar rebounds with yields as hawkish RBNZ move revives aggressive Fed rate hike bets.
- Falling wedge breakout meets resistance at 50-DMA, as focus shifts to critical US data.
EUR/USD is turning south towards 0.9950 after meeting fresh supply just below the parity mark. The broad US dollar rebound is aiding the renewed downside in the main currency pair.
The dollar is finding fresh buyers, staging a decent recovery, as odds of aggressive Fed tightening are back in play after the Reserve Bank of New Zealand (RBNZ) hawkish 50 bps rate hike. The RBNZ move poured cold water over hopes for a pause or slowdown in the Fed’s intentions for aggressive hikes. This narrative has also helped the US Treasury yields rebound across the time curve.
Meanwhile, risk tone has turned slightly cautious, as investors now look forward to the US ADP jobs and ISM Services PMI data for fresh hints on the size of the Fed rate hike in November. On Tuesday, a sharp drop in the US job openings smashed the dollar across the board, as the data tempered super-sized Fed rate hike expectations.
On the EUR side of the equation, investors remain edgy amid the looming European energy crisis even though the EU energy chief said late Tuesday, “we have enough storage to get through winter without Russian gas in event of mild weather.” Meanwhile, the EU agreed to new sanctions on Russia, including the oil price cap, details of which will be released on Wednesday.
EUR/USD: Technical outlook
Looking at EUR/USD’s daily chart, the extension of a falling wedge breakout yielded on Monday failed just below the slightly bearish 50-Daily Moving Average (DMA) at 1.0016.
Sellers, therefore, look at the horizontal 21 DMA at 0.9896 should the retreat extend. Ahead of that, the 0.9950 psychological level could come to buyers’ rescue.
EUR/USD: Daily chart
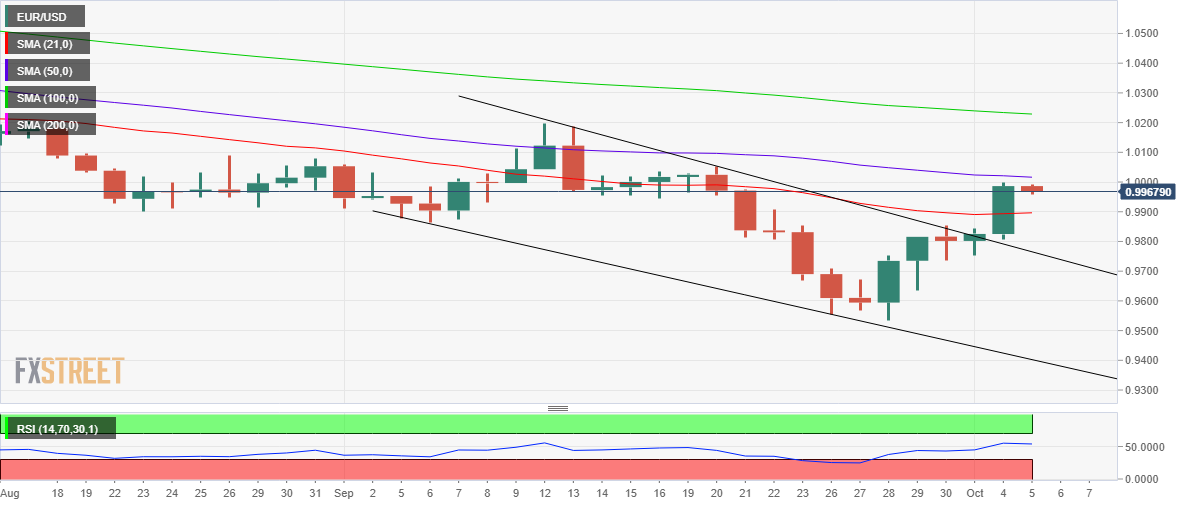
The 14-day Relative Strength Index (RSI) has turned flat but holds above the 50.00 level, keeping bulls hopeful.
Daily closing above the 50 DMA barrier is needed to extend the uptrend towards the September 20 high of 1.0050.
Further up, bulls will challenge the 1.1100 round level on the continuation of the bullish momentum.
EUR/USD: Additional levels to consider
-
04:12
Gold Price Forecast: XAU/USD faces a wall of resistance ahead of key US events – Confluence Detector
- Gold price is retreating from three-week highs, as the US dollar finds demand.
- The metal awaits critical US economic data for clarity on the Fed’s policy.
- $1,730-$1,735 supply zone appears a tough nut to crack for XAU/USD bulls.
Gold price is pulling back from three-week highs of $1,730, as the US dollar is finding fresh demand so far this Wednesday. The bright metal is snapping its two-day rally, as markets are turning cautious heading into the critical US economic data in the second half of this week. After weak US ISM Manufacturing and Job Openings data, investors started betting that the Fed will slow down its tightening pace, as the economy appears to be cooling. The dollar sell-off alongside the Treasury yields on Tuesday, therefore, helped the USD-priced bullion extend its recovery momentum above the $1700 threshold. Gold’s fate now hinges on the upcoming US employment data, which will provide more clarity on the size of the November Fed rate hike. According to the CME Group’s FedWatch Tool, markets are pricing a 62% chance of a 75 bps lift-off by the Fed next month, up from roughly 50% seen a day ago.
Also read: Chart of the day: Gold
Gold Price: Key levels to watch
The Technical Confluence Detector shows that the gold price is closing in on the Fibonacci 38.2% one-day support at $1,717, below which a fresh drop towards the pivot point one-week R2 at $1,711 will be in the offing.
The next stop for sellers is seen at the Fibonacci 61.8% one-day at $1,709 while the confluence of the SMA10 four-hour and pivot point one-day S1 at $1,705 will offer a strong cushion to buyers.
On the flip side, the immediate resistance is aligned at $1,721, the Fibonacci 23.6% one-day, above which the next powerful barrier around $1,726 will get retested. That level is the confluence of the pivot point one-month R1 and SMA50 one-day.
The previous day’s high of $1,730 will be on the buyers’ radars if the upswing gathers steam. The previous month’s high of $1,735 will be irresistible for gold optimists.
Here is how it looks on the tool
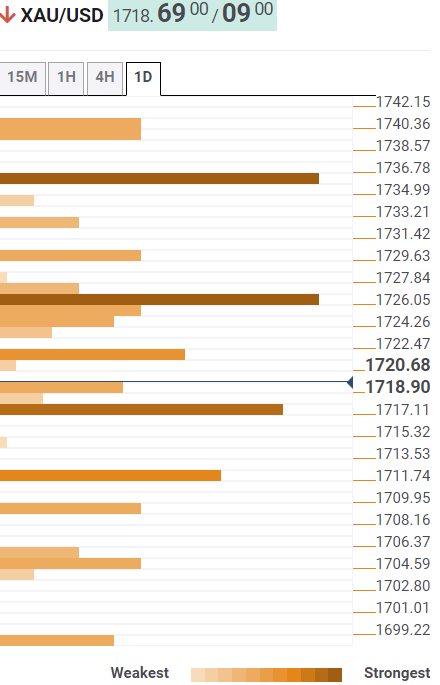
About Technical Confluences Detector
The TCD (Technical Confluences Detector) is a tool to locate and point out those price levels where there is a congestion of indicators, moving averages, Fibonacci levels, Pivot Points, etc. If you are a short-term trader, you will find entry points for counter-trend strategies and hunt a few points at a time. If you are a medium-to-long-term trader, this tool will allow you to know in advance the price levels where a medium-to-long-term trend may stop and rest, where to unwind positions, or where to increase your position size.
-
04:11
GBP/USD declines towards 1.1400 on consolidation breakdown, US ISM Services PMI in focus
- GBP/USD is eyeing weakness to near 1.1400 as a corrective move, however, the upside remains favored.
- Pound bulls have been strengthened after the UK govt. rollback the tax reduction memorandum.
- A lower-than-expected reading of the US ISM Services PMI gamut will weaken DXY further.
The GBP/USD pair has delivered a downside break of the consolidation formed in a range of 1.1420-1.1490 in the Tokyo session. The asset is expected to drop further to near the round-level support of 1.1400 as a correction was highly expected after a juggernaut rally. However, the corrective move is expected to be mild and won’t impact the upside bias on higher timeframe.
Broadly, the pound bulls are performing on an extremely bullish note after the UK administration rollback the memorandum of tax cuts to support households against the bumper paychecks. The move of reducing taxation received criticism from think tanks in the market as it was expected to spurt the inflationary pressures firmly.
Also, the move of tax reduction was resulting in a clash of interest as on one side the Bank of England (BOE) is continuously hiking interest rates to tame the mounting inflation. The decision of rollback has highlighted that the UK economy still needs time to get politically stable after Liz Truss becomes the UK Prime Minister.
Meanwhile, the US dollar index (DXY) is witnessing a rebound move after defending the critical support of 110.00. The rebound move seems less reliable due to the unavailability of strength and will terminate sooner ahead. Going forward, the US ISM Services PMI data will hog the limelight. As individuals have postponed their demand for durable goods, the economic data is expected to display a vulnerable performance.
The Services PMI data is expected to decline to 56.0 against the former print of 56.9. Also, the New Orders Index data that indicates forward demand for services will slip to 58.9 vs. the prior release of 61.8.
-
03:18
BOJ offers to purchase JGBs on Wednesday
The Bank of Japan (BOJ) announced on Wednesday that it offers to purchase Japanese Government Bonds (JGB) across various maturities.
Key details
BOJ offers to purchase 150bln yen of 1 year JGBs.
BOJ offers to purchase 475bln yen of 1-3 year JGBs.
BOJ offers to purchase 475bln yen of 3-5 year JGBs.
Market reaction
USD/JPY was last seen trading at 144.20, up 0.07% on the day, littie changed by the above BOJ’s operation.
-
03:05
AUD/USD Price Analysis: Sellers keep lurking above 0.6530 amid bearish RSI
- AUD/USD is treading water around 0.6500 after the hawkish RBNZ rate hike.
- USD attempts a tepid recovery, as S&P 500 futures drop 0.50%.
- The aussie’s rejection at the ascending triangle resistance keeps sellers hopeful.
AUD/USD is trading modestly flat around the 0.6500 level, having failed to find acceptance above the 0.6530 barrier once again.
The retreat in the pair could be linked to the AUD/NZD driven sell-off after NZD/USD rallied hard on the Reserve Bank of New Zealand (RBNZ) 50 bps rate hike and hawkish guidance. The RBNZ announcement underscores its monetary policy divergence with the RBA, capping the upside in the aussie pair. The RBA slowed its tightening pace on Tuesday by delivering a smaller-than-expected 25 bps rate increase.
Further, resurgent haven demand for the US dollar amid a mixed market mood also cautions AUD bulls. Despite the risk rally in the Asian stocks, the US S&P 500 futures have turned in the red, dropping 0.52%, as of writing. Markets could be feeling nervous ahead of Wednesday’s US ISM Services PMI and employment data due later this week. Note that the greenback tumbled sharply on Tuesday, in the face of a remarkable decline in the American JOLT job openings data.
From a short-term technical perspective, the pair is unable to cross the horizontal trendline resistance placed around 0.6535 on a daily closing basis, leaving sellers in control.
That said, the 14-day Relative Strength Index (RSI) continues to lurk below the midline, supporting the case for a drop towards the 0.6450 psychological level.
The next downside target is seen at the rising trendline support at 0.6424.
AUD/USD: Daily chart
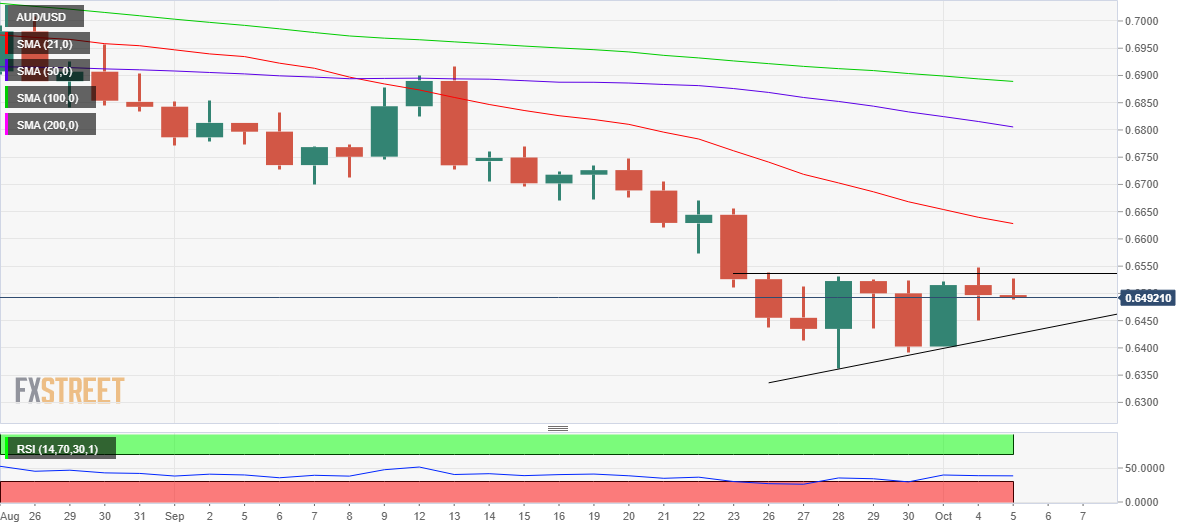
On the flip side, a firm break above the aforesaid critical resistance at around 0.6535 will validate an ascending triangle breakout.
Bulls will then aim for the downward-sloping 21-Daily Moving Average (DMA) at 0.6628. Ahead of that level, 0.6600 will challenge bearish commitments.
AUD/USD: Additional levels to consider
-
03:01
NZD/JPY Price Analysis: Bears are moving in as bird losing flight
- NZD/USD is under pressure and taking the cross along for the ride despite the hawkish RBNZ.
- The fact that the central bank only raised by 50bps is pressuring the bird away from the knee-jerk highs.
The Reserve Bank of New Zealand has hiked 50 bps as expected and the market is now digesting the statement, and the committee considered whether to increase by 50 or 75bps at this meeting, concluding that it is appropriate to continue hiking at the current pace.
The OCR is now at a seven-year high of 3.5% while the central bank flagged more to come as it struggles to contain stubbornly high inflation.
The board decided not to hike by 75bps, so while there was scope for the upside to 0.5800, the price may struggle to gain traction at this stage of the runnings as it crumbles away, especially on a resurgence in the greenback that is trying to base at the lows of the week so far:
NZD/USD M15
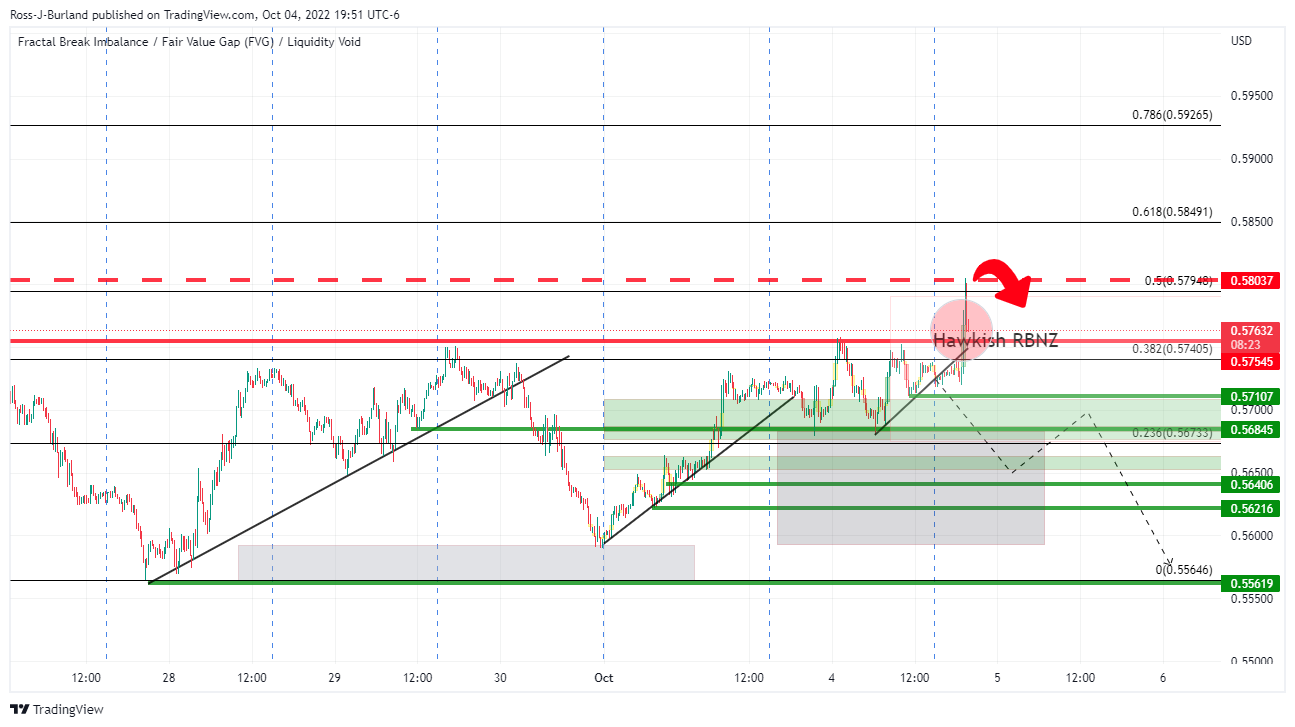
NZD/JPY M15
The price could be expected on NZD/JPY to crash into support near 82.30 and in doing so, it will be leaving last week's highs for dust and put a significant risk of a move lower for the rest of the week. Bears can eye a test of 81 the figure.
-
02:39
AUD/NZD plunges to near 1.1250 as RBNZ hikes OCR for the fifth time by 50 bps
- AUD/NZD has dropped significantly to 1.1250 on RBNZ hikes interest rates by 50 bps.
- This is the fifth consecutive 50 bps rate hike which has pushed the OCR to 3.5%.
- Earlier, RBA surprised the FX domain by announcing a 25 bps rate, lesser than projections.
The AUD/NZD pair has witnessed a perpendicular fall after the Reserve Bank of New Zealand (RBNZ) hiked its Official Cash Rate (OCR) by 50 basis points (bps) consecutively for the fifth time. The extent of the rate hike is in line with the projections and has pushed the OCR to 3.5%. The cross has dropped firmly to near 1.1250.
It is worth noting that RBNZ Governor Adrian Orr has preferred to continue focusing on bringing price stability and has ditched focus on growth prospects for now. Mounting inflationary pressures are required to tame sooner as they will continue to hurt the wallets of households. For the second quarter of CY2022, the inflation rate was recorded at 7.3%.
On the Australian front, the aussie bulls are still in the hangover of a lower-than-projected rate hike by the Reserve Bank of Australia (RBA). In its October monetary policy meeting on Tuesday, RBA Governor hiked the OCR by 25 bps, lower than the expectations of 50 bps. RBA’s surprise move of ditching the 50 bps rate hike pattern at the fifth time restricted aussie at the lower side.
The current RBA’s OCR stood at 2.6% and the RBA is seeing the interest rate top around 3.85%. The novel approach of keeping the growth prospects along with the priority of cooling down price pressures by the RBA will reach the desired interest rates in 2023.
-
02:08
NZD/USD jumps above 0.5760 as RBNZ hikes OCR by 50 bps to 3.5%
- NZD/USD has hit 0.5770 as RBNZ hiked its OCR for firth time consecutively by 50 bps.
- RBNZ’s interest rates have jumped to 3.5% and the central bank is sticking to its path of bringing price stability.
- The DXY is expected to surrender the immediate cushion of 110.00 on weaker NFP projections.
The NZD/USD pair has picked significant bids and has touched an intraday high of 0.5769 as the Reserve Bank of New Zealand (RBNZ) has hiked its Official Cash Rate (OCR) by 50 basis points (bps) consecutively for the fifth time. The extent of the rate hike is in line with the projections of institutional investors. This has pushed the OCR to 3.5%.
Price pressures in the NZ economy have been recorded at 7.3% for the second quarter of CY2022. Therefore, a continuation of a hawkish policy was highly required. But at the same time, the RBNZ has ditched the growth prospects and has chosen price stability as its foremost priority.
Meanwhile, the US dollar index (DXY) is juggling around the 110.00 ground and is expected to surrender the same sooner amid weaker consensus for US Nonfarm Payrolls (NFP) data. Subdued preliminary estimates for the US Nonfarm Payrolls (NFP) data have been discounted by the market participants. As expected, the US economy created 250k jobs in September, lower than the August reading of 315k. The US economy has been maintaining full employment levels, therefore, space for generating more employment is extremely less. Adding to that, the escalating Federal Reserve (Fed)’s interest rates are also restricting the corporate to continue their hiring programs with sheer pace.
What could dampen the DXY’s appeal further is the Average Hourly Earnings data. The projections are indicating a soft landing at 5.1% vs. the prior release of 5.2%. In time, when households are facing the headwinds of mounting inflation, lower earnings would be insufficient to offset the inflated payouts.
-
02:03
Breaking: RBNZ hikes as expected 50bps
The Reserve Bank of New Zealand has hiked 50 bps as expected and the market is now digesting the statement, and the committee considered whether to increase by 50 or 75bps at this meeting, concluding that it is appropriate to continue hiking at the current pace.
The OCR is now at a seven-year high of 3.5% while the central bank flagged more to come as it struggles to contain stubbornly high inflation.
"The Committee agreed it remains appropriate to continue to tighten monetary conditions at pace to maintain price stability and contribute to maximum sustainable employment," the RBNZ said in a statement.
Ahead of the event, analysts at ANZ Bank argued that capacity pressures ''are only easing slowly and the labour market remains very tight. In this inflationary environment, we see the RBNZ has little choice but to focus on dampening inflation pressures by delivering another 50bp rate hike.''
- The committee agreed appropriate to continue to tighten policy.
- The committee members agreed monetary conditions needed to continue to tighten until inflation back in target range.
- The core consumer price inflation is too high and labour resources are scarce.
- The level of domestic spending has remained resilient to date.
- Household balance sheets remain resilient despite the fall in house prices.
- New Zealand's productive capacity still being constrained by labour shortages and wage pressures are heightened.
NZD/USD update
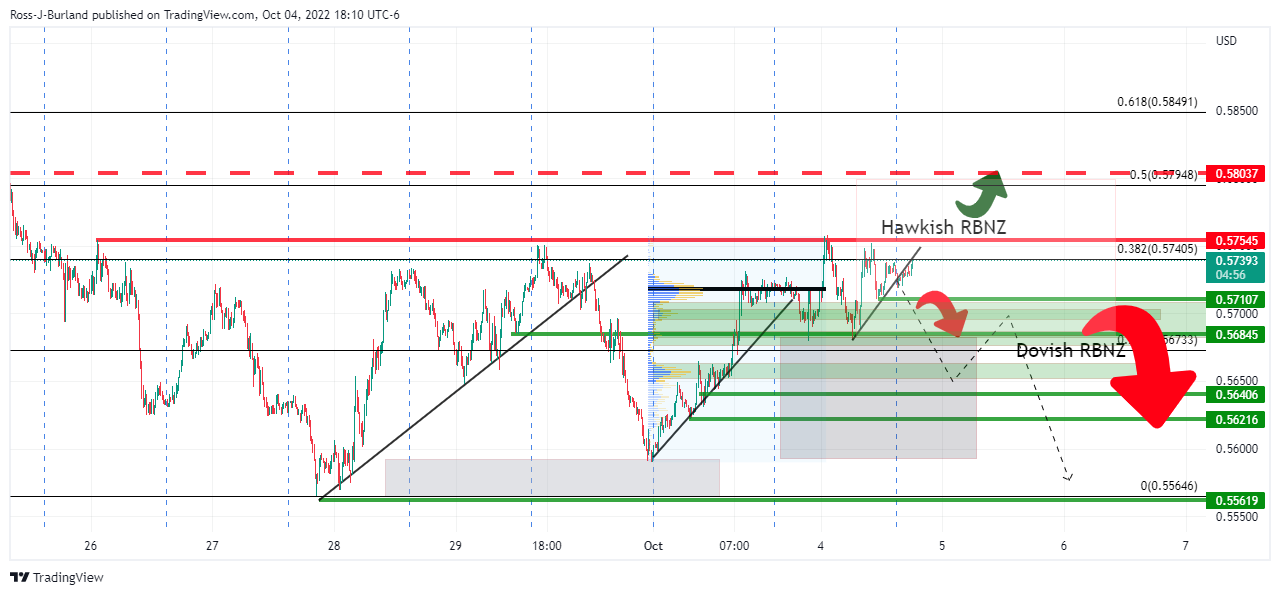
As per the preview, When is the RBNZ and how might it affect NZD/USD?, the price was leaning over the top of a 100 pip box and resisted by the 0.5750s but is now bid on the release of the decision and statement.
It was stated that ''the price could shoot up on a hawkish outcome towards a 50% mean reversion of the daily bearish impulse near 0.5800 and beyond.''
Also worth noting, the knee jerk to the RBA on Tuesday was a 50 pip sell-off before a 100 pip rally that was faded by the bears in London back to the post-RBA lows until the US dollar was sold off in New York.
The kiwi is now testing the upside as follows:
It is now evident that the price can continue much higher, however, as the board decide not to hike by 75bps. While there is cope for the upside, the price may struggle to gain traction at this stage of the runnibgs, especially on a resurgence in the greenback that is trying to base at the lows of the week so far.
About the RBNZ
RBNZ Interest Rate Decision is announced by the Reserve Bank of New Zealand. If the RBNZ is hawkish about the inflationary outlook of the economy and rises the interest rates it is positive, or bullish, for the NZD.
-
02:00
New Zealand RBNZ Interest Rate Decision meets forecasts (3.5%)
-
01:50
USD/JPY Bears move in and take out key structure
- USD/JPY bears eye a deeper correction below critical support.
- The US dollar remains under pressure while below 110.50, DXY.
USD/JPY is under pressure with the price trading 0.15% lower and extending on the overnight move in the US dollar to a low of 143.52 so far. The US yields made fresh lows as the 10-year yield fell 1.4 basis points to 3.6% while the two-year rate slipped by less than one basis point to 4.1%. while the US dollar was sold off on yet further data disappointments.
The DXY, which measures the greenback vs. a basket of currencies fell from a high of 111.886 for the day, or 110.870 on the JOLTS data that showed US job openings fell to almost 10.1 million in August, according to the Bureau of Labor Statistics.
This was below the consensus on Econoday for 11.15 million and down from 11.17 million reported in July.
The larger-than-expected decline could be the first sign that demand for labour is falling ahead of this week's main event in the US Nonfarm Payrolls data.
The weaker data has caused traders to bet the Federal Reserve may raise interest rates less than previously expected as the central bank turns more dovish as the US economy slows.
In other data for the day, new orders for factory goods were flat in August, below expectations for a 0.2% increase in a survey compiled by Bloomberg and following a 1% decrease in July.
Redbook reported that US same-store retail sales were up 12.3% year-over-year in the week ended Oct. 1, larger than an 11% gain in the prior week due to an increase in fall apparel sales at the end of the week as temperatures turned cooler.
all combined, along with the prior days' poor manufacturing data, consequently, US stocks advanced on signs that the supply-demand gap in the labour market was narrowing. This is a dovish factor that is supportive of risk appetite on Wall Street and weighing on USD/JPY. The Dow Jones Industrial Average leapt 2.8% to 30,316.32, the S&P 500 surged 3.1% to 3,790.93 and the Nasdaq Composite was 3.3% higher at 11,176.41.
USD/JPY M15 chart
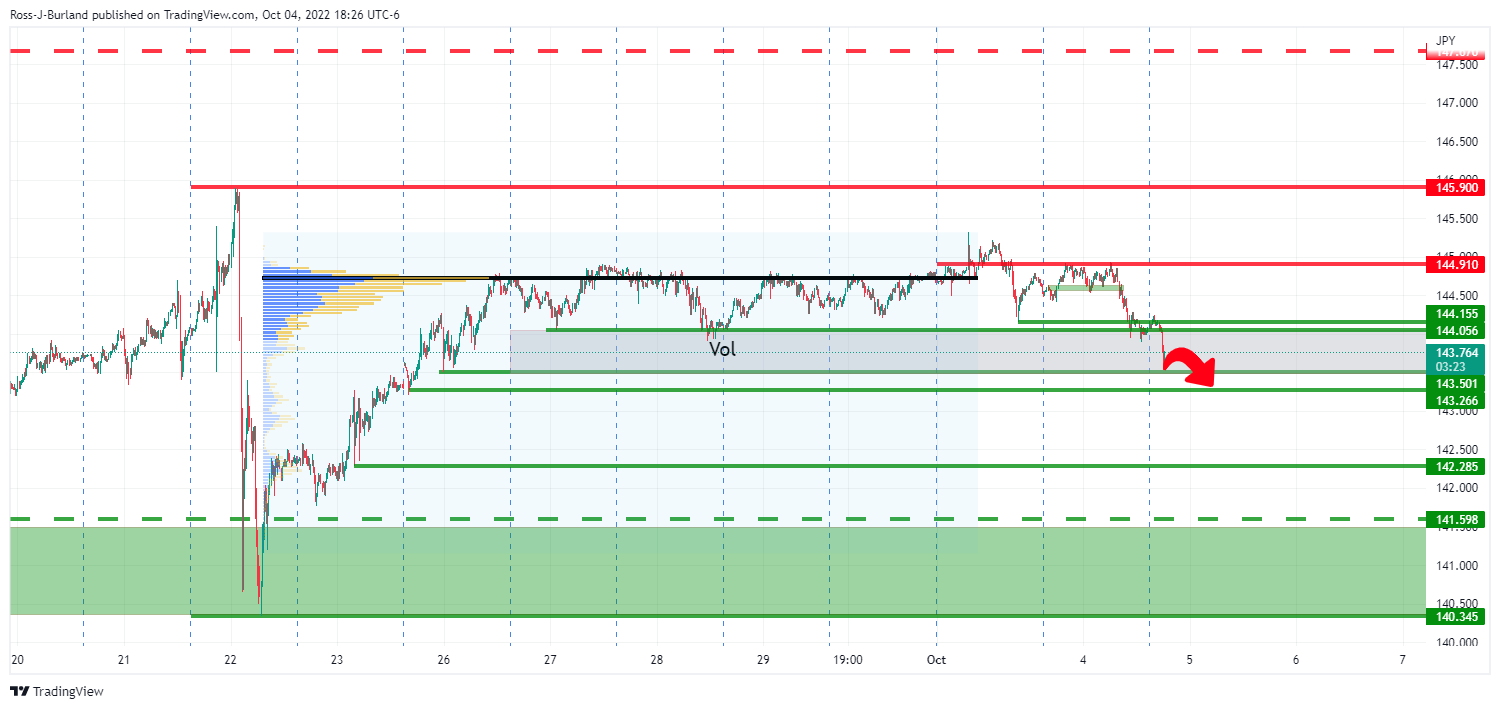
As for the technical, the price is breaking below the key structure and could be on the verge of a deeper move to correct the prior rally. The DXY is trying to base at support:
-
01:46
US Dollar Index drops to near 110.00 on cheerful market mood, US NFP the next trigger
- The DXY is expected to surrender the immediate support of 110.00.
- Poor demand by the households is responsible for weak ISM Service PMI projections.
- This week, the US NFP data will keep the DXY on the tenterhooks.
The US dollar index (DXY) is displaying a lackluster performance after declining to near the psychological support of 110.00. The asset is oscillating in a narrow range of 110.05-110.28 in the Asian session and is expected to deliver more weakness ahead of the US Nonfarm Payrolls (NFP) data. But before that, investors will execute positions on US ISM Services PMI data. As investors have shrugged off the uncertainty of a global slowdown, risk-sensitive currencies are sky-rocketing.
Poor demand is responsible for weak ISM Service PMI projections
As per the projections, the US ISM Services PMI data is seen lower at 56 vs. the previous reading of 56.9. Mounting price pressures in the US economy have titled the overall demand to the downside. The households are having less liquidity in their palms due to inflation-adjusted payouts, which has forced them to stick with demand for necessities only. Also, the New Orders Index data, which illustrates forward demand is expected to trim significantly to 58.9 against the prior release of 61.8.
US NFP, the critical trigger
This week, the release of the US NFP data will keep the DXY on the tenterhooks. The US NFP is seen lower at 250k vs. the prior release of 315k. While the Unemployment Rate is seen stabilizing at 3.7%.
Apart from that, investors will keenly focus on the Average Hourly Earnings data. As price pressures have not shifted significantly to the lower side, the earnings data holds meaningful importance. The labor cost index is seen lower by 10 basis points (bps) to 5.1% on an annual basis. Due to higher inflation, households are forced to make higher payouts for the usual quantity purchased and lower earnings won’t help them to offset the extra inflation-led spending.
-
01:31
Japan Jibun Bank Services PMI registered at 52.2 above expectations (51.9) in September
-
01:18
EUR/USD prepares to cross 1.0000 amid weaker DXY, US NFP eyed
- EUR/USD is aiming to cross the parity amid lower consensus for US employment data.
- ECB Lagarde has failed to provide a true picture of the inflation situation.
- Retail Sales data in the trading bloc is expected to decline by 1.7% against a decline of 0.9% recorded earlier.
The EUR/USD pair is hovering around the psychological resistance of 1.0000 after a perpendicular rally post a break above the 0.9732-0.9850 consolidation. The major is preparing to demolish the parity as the US dollar index (DXY) is witnessing an intense sell-off by market participants. The DXY is expected to display a sheer downside move after surrendering the crucial support of 110.00.
The DXY’s appeal has been weakened ahead of the US employment data. Federal Reserve (Fed)’s extremely hawkish campaign to achieve price stability has resulted in weaker projections for the US Nonfarm Payrolls (NFP) data. The corporate has postponed the capacity expansion plans and fresh investment opportunities to dodge higher interest obligations. This has slowed down the recruitment process and henceforth the job opportunities.
As per the estimates, the US economy added a fresh 250k jobs in the labor market in August, which is extremely lower than the prior release of 315k. A lower-than-expected reading would weaken the DXY further as the Fed will be compelled to trim its hawkish tone to safeguard the economy from a recession situation.
On the Eurozone front, the comments from European Central Bank (ECB) Christine Lagarde on Tuesday cleared that the inflation rate is still in unchartered territory. ECB Lagarde cited that it was difficult to say whether or not inflation has peaked in the euro area, as reported by Reuters. She further added that "The minimum that we have to do is to stop stimulating demand,"
Going forward, the Eurozone Retail Sales data will be of utmost importance. The economic data is seen lower at -1.7% vs. the prior release of -0.9% on an annual basis. In times, when price pressures are soaring, a decline in retail sales will weaken the shared currency bulls.
-
01:15
Currencies. Daily history for Tuesday, October 4, 2022
Pare Closed Change, % AUDUSD 0.65011 -0.17 EURJPY 143.963 1.34 EURUSD 0.99831 1.65 GBPJPY 165.435 1.12 GBPUSD 1.14723 1.4 NZDUSD 0.57201 0.03 USDCAD 1.35053 -0.85 USDCHF 0.97861 -1.42 USDJPY 144.205 -0.26 -
01:14
When is the RBNZ and how might it affect NZD/USD?
The Reserve Bank of New Zealand is seen raising OCR by 50 bps to 3.5% in October today when it meets and announces the decision at 0100 GMT.
''The RBA’s surprise smaller 25bp hike yesterday has gotten FX markets wondering if the Reserve Bank of New Zealand might be the next central bank to slow the pace of tightening,'' analysts at ANZ Bank said.
However, as they note, inflation risks are a more pressing matter for New Zealand. However, a surprise 75 bps rate hike now seems off the table after the RBA hiked by only 25 bps.
''We expect a 50bp hike and hawkish tone, but the market is already pricing in a lot, so the bar is high.''
''While officials in Australia may be taking a more cautious approach we expect the RBNZ will lift the official cash rate by 50bps today. The Quarterly Survey of Business Opinion released by the NZIER yesterday shows inflationary pressures remain very strong.
Capacity pressures are only easing slowly and the labour market remains very tight. In this inflationary environment we see the RBNZ has little choice but to focus on dampening inflation pressures by delivering another 50bp rate hike,'' the analysts explained.
Overall, the focus will be on RBNZ’s policy guidance.''
How might the RBNZ affect the NZD/USD price NZD/USD?
The price is leaning over the top of a 100 pip box and resisted by the 0.5750s. Should the RBNZ outcome be dovish, then this could lead to a hefty sell-off towards the middle of the 100 pip box near 0.5650 and then 0.5600.
On the other hand, the price could shoot up on a hawkish outcome towards a 50% mean reversion of the daily bearish impulse near 0.5800 and beyond.
The knee jerk to the RBA on Tuesday was a 50 pip sell-off before a 100 pip rally that was faded by the bears in London back to the post-RBA lows until the US dollar was sold off in New York.
About the RBNZ
RBNZ Interest Rate Decision is announced by the Reserve Bank of New Zealand. If the RBNZ is hawkish about the inflationary outlook of the economy and rises the interest rates it is positive, or bullish, for the NZD.
-
01:03
Ireland Purchasing Manager Index Services: 54.1 (September) vs previous 54.7
-
00:46
USD/CAD sees a downside below 1.3500 ahead of US/Canada employment data
- USD/CAD is eyeing more weakness below 1.3500 as the focus has shifted to employment data.
- The DXY may surrender the 110.00 cushion amid weaker US NFP projections.
- An upbeat consensus for Canada’s labor market data amid hawkish BOC will strengthen loonie.
The USD/CAD pair has turned sideways in early Asia after dropping to near the psychological cushion of 1.3500. The major is expected to surrender the 1.3500 cushion and will deliver more weakness ahead. On a broader note, the asset shifted into a negative trajectory after dropping below the crucial support of 1.3600.
The pair is displaying a vulnerable performance as the US dollar index (DXY) is going through a rough time ahead of the US employment data. Policy tightening measures by the Federal Reserve (Fed) have started displaying their consequences and the job creation process is a major victim now. Investors are dumping the DXY on lower consensus for the Nonfarm Payrolls (NFP) data. Weaker-than-expected US employment data will force the Fed to slow down the pace of hiking interest rates.
The US NFP is seen lower at 250k vs. the prior release of 315k. While the Unemployment Rate is seen stabilizing at 3.7%.
On the loonie front, investors are similarly looking for the Canadian employment data, which is due on Friday. Net Change in Employment is seen extremely higher at 20k vs. the prior release of -39.7k. While the jobless rate is seen steady at 5.4%. In times, when the Bank of Canada (BOC) is continuously escalating the interest rate, upbeat employment data will delight the central bank.
Meanwhile, oil prices have comfortably established above the $85.00 hurdle ahead of the OPEC+ meeting. Oil prices have remained in negative territory for the past few months, which will force the oil cartel to announce production cuts. The majority of the OPEC members have not been able to produce promised output. Therefore, the production cuts are not expected to be huge and a pullback in the black gold will conclude.
-
00:10
Gold Price Forecast: XAU/USD eyes a break above $1,730 amid weaker consensus for US NFP
- Gold prices are aiming to smash the 61.8% Fibo retracement at $1,734.58.
- Fed’s soaring interest rates have trimmed employment generation opportunities.
- The Average Hourly Earnings data is expected to decline by 10 bps to 5.1% on an annual basis.
Gold price (XAU/USD) has witnessed a juggernaut rally after demolishing the psychological hurdle of $1,700.00. The precious metal is oscillating around Tuesday’s high at $1,729.00 and is expected to break the same with sheer confidence. The yellow metal has shifted into positive territory and is expected to continue its six-day winning streak after crossing the immediate hurdle of $1,730.00.
Weaker estimates for the US employment data are strengthening the gold prices. Escalating interest rates by the Federal Reserve (Fed) to combat the mounting inflation has trimmed employment opportunities. The corporate has left with no other option than to postpone the capacity expansion and investment plans to avoid higher interest obligations. This is resulting in a slowdown in the job creation process.
As per the expectations, the US Nonfarm Payrolls (NFP) data will decline to 250k vs. the prior release of 315k. The jobless rate is seen as stable at 3.7%. Apart from that, the Average Hourly Earnings data will remain in focus, which is expected to trim by 10 basis points (bps) to 5.1% on an annual basis.
Meanwhile, the US dollar index (DXY) has slipped to near the psychological support of 110.00. The DXY will continue to remain on the tenterhooks amid a decline in the employment generation process.
Gold technical analysis
On a four-hour scale, gold prices are near to hitting the 61.8% Fibonacci retracement (placed from August 10 high at $1,807.93 to September low at $1,614.85) at $1,734.58. The upside momentum is extremely strong as the asset has crossed the 50-and 200-period Exponential Moving Averages (EMAs) at $1,674.30 and $1,695.80 respectively while the 50-EMA is still lower than the longer one.
The Relative Strength Index (RSI) (14) has been established in the bullish range of 60.00-80.00, which indicates that bullish momentum has been activated.
Gold four-hour chart
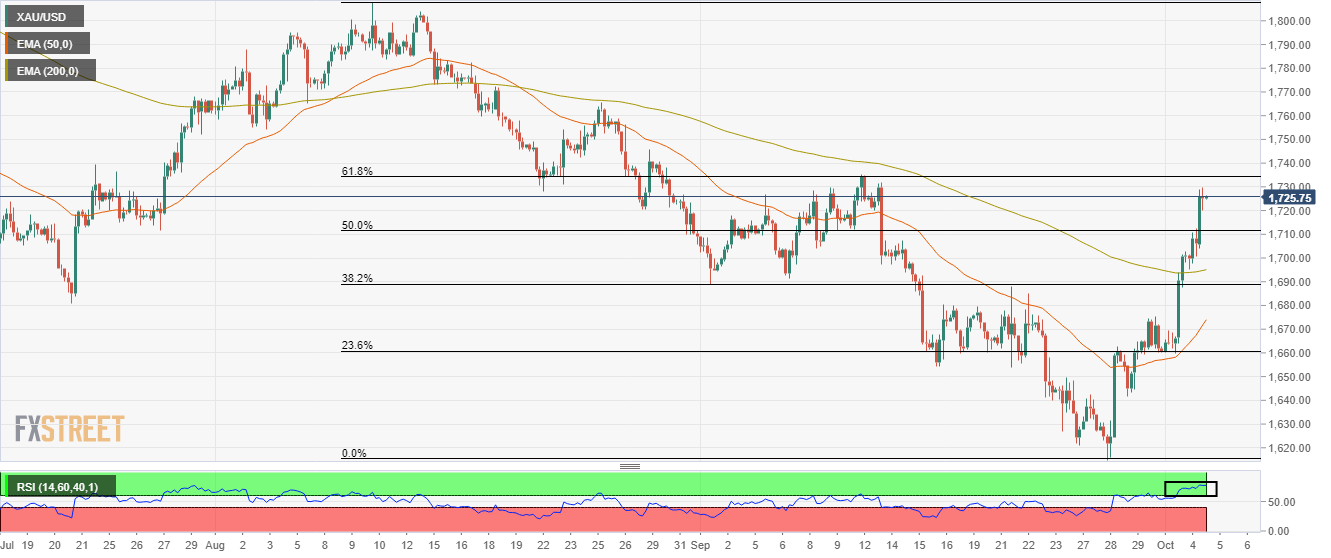
-
00:00
South Korea Consumer Price Index Growth (MoM) came in at 0.3% below forecasts (0.4%) in September
-
00:00
South Korea Consumer Price Index Growth (YoY) came in at 5.6%, below expectations (5.7%) in September
-