Notícias do Mercado
-
23:59
GBP/JPY Price Analysis: Retraces after testing the 200-EMA in the 4-hour chart
- GBP/JPY registers decent gains of almost 0.20% as the Asian session begins.
- The GBP/JPY daily chart depicts the pair as neutral-biased, unable to challenge the 160.00-162.80 area.
- Short term, the pair tested the 200-EMA at the H4 chart, in which sellers leaned on, sending the GBP/JPY sliding towards the 162.20s area.
GBP/JPY is advancing as the Asian session begins, though it remains trading sideways for the twelve-consecutive trading day, inside the 160.00-162.80 range, at the time of writing. The GBP/JPY exchanges hand at 162.18, above its opening price..
GBP/JPY Price Analysis: Technical outlook
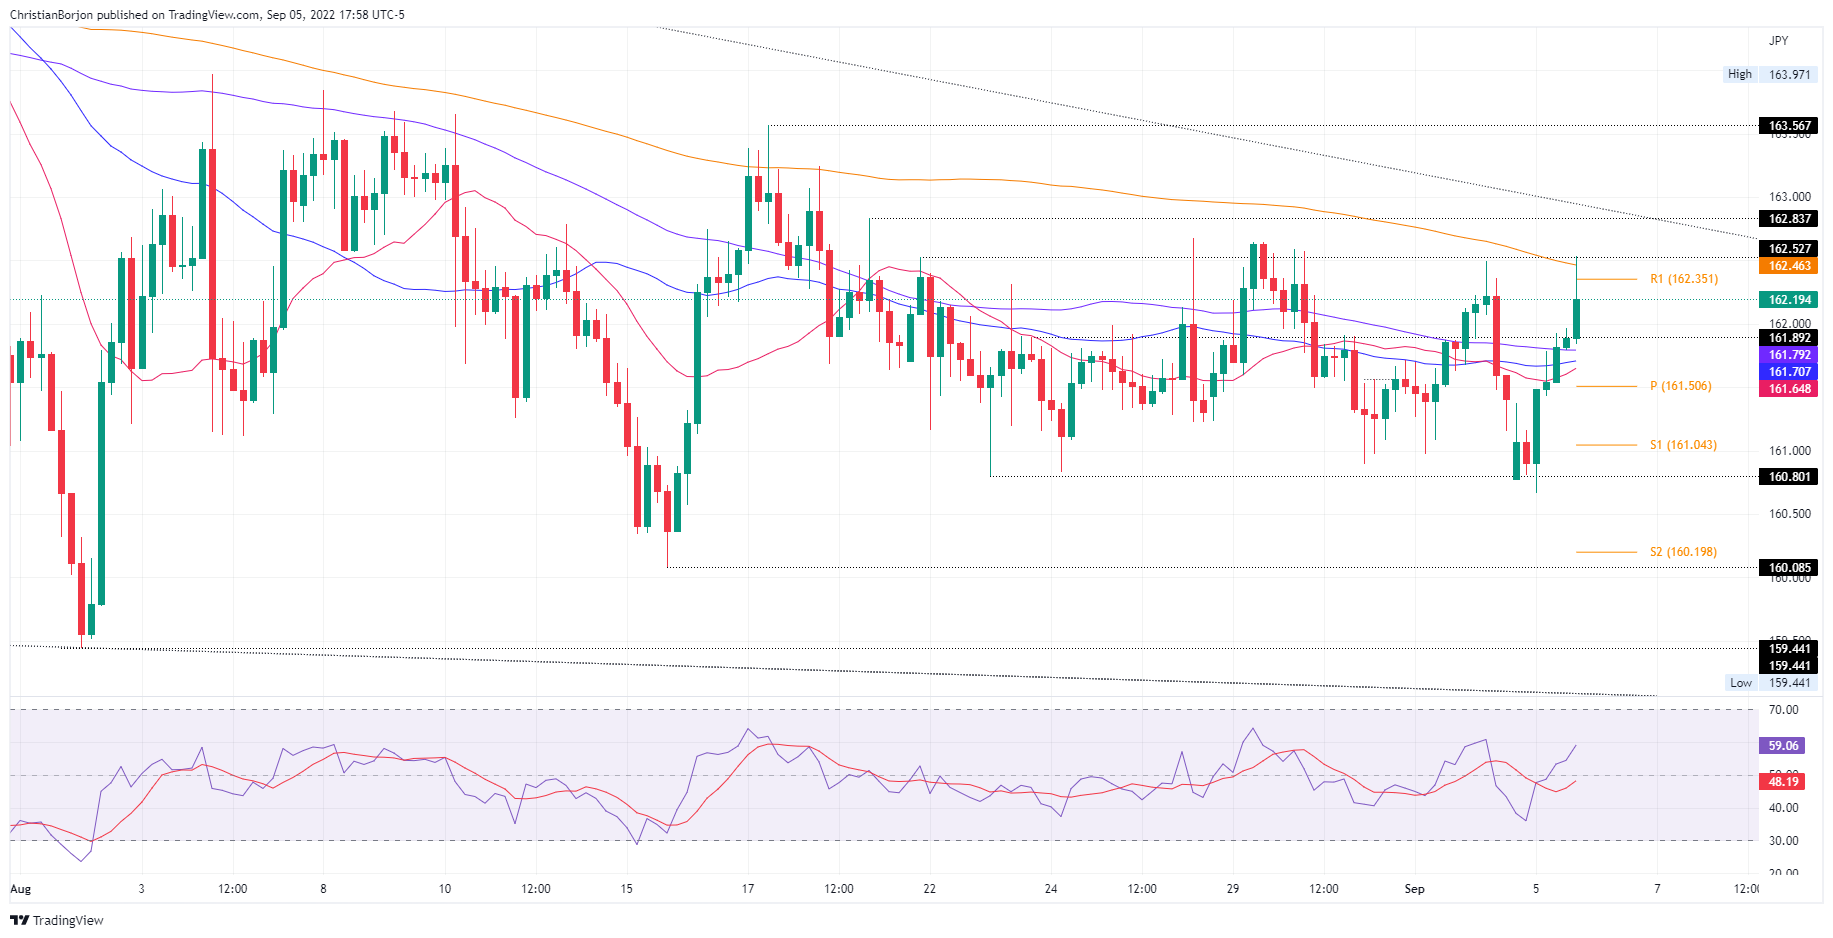
The GBP/JPY remains neutral biased. For the last twelve days, the GBP/JPY has been trading within the 160.00-162.80 area, unable to break above/below the range extremes. It’s worth pointing out that the Relative Strength Index (RSI) is below the 50-midline, almost flat, while the 20-day EMA, at 161.84, is the first support level at the time of writing. On the upside, the GBP/JPY first resistance is the confluence of the 50, 100-EMAs, and a downslope trendline around the 162.80-163.00 area, which the pair had been unable to reach since August 17. On the downside, the GBP/JPY’s first support would be the September 5 daily low at 160.66.
Near term, the GBP/JPY four-hour chart illustrates the cross-currency hitting September’s 2 daily high at 162.52 before retracing some pips below the R1 daily pivot at 162.35. GBP/JPY traders should be aware of the 200-day EMA at around 162.46, a difficult resistance level to overcome for GBP/JPY buyers. Once they clear the latter, that would pave the way towards 163.00, opening the door for further gains.
On the other hand, the GBP/JPY first support would be the confluence of the 20, 50, and 100-EMAs at around 161.65-161,80. Once cleared, the GBP/JPY following support would be the daily pivot at 161.50, followed by the S1 daily pivot at 161.04.
GBP/JPY Key Technical Levels
-
23:54
GBP/USD advances towards 1.1600 on novel UK Leadership, US ISM Services PMI eyed
- GBP/USD is marching towards 1.1600 as Liz Truss's win warrants UK’s political stability.
- British energy supplier, Centrica is securing credit to offset collateral demand for volatile energy prices.
- Fed’s extreme hawkish stance is responsible for lower consensus for US ISM Services PMI.
The GBP/USD pair has given an upside break of the consolidation formed in a narrow range of 1.1512-1.1520 in the early Tokyo session. The asset has displayed a sheer upside as a volatility expansion has kicked in after a range breakout. Earlier, the cable witnessed a firmer rebound after hitting a low of 1.1450. Broadly, the asset was declining for the past few weeks amid political instability in the UK economy. Now, the announcement of a leadership change has strengthened the pound bulls.
After fighting for the leadership of the Conservative Party for more than two months, Liz Truss has finally won the elections and has been elected as the next UK Prime Minister. As announced by Liz Truss while presenting her capabilities for contender of UK leadership that she will scale down energy bills for households, pound bulls have started playing the road. Also, a situation of political stability in the UK economy will strengthen sterling.
Meanwhile, the impact of volatile energy prices has spread to energy suppliers. News from Financial Times cited that, Britain's largest energy supplier Centrica Plc is in talks with banks to secure billions of pounds in extra credit to meet soaring collateral demands as the energy market remains volatile.
On the dollar front, the US dollar index (DXY) has surrendered the psychological support of 110.00. The DXY is facing the heat of lower consensus for the US ISM Services PMI data. The economic data will decline to 55.5 from the prior release of 56.7. It seems that the consequences of the extremely hawkish Federal Reserve (Fed) are visible now and the US economic activities are declining. The unavailability of cheap money has forced the corporate to postpone the funds' channelization into afresh investment opportunities and expansion plans.
-
23:48
EUR/USD rebound eyes parity as DXY retreats ahead of US data
- EUR/USD portrays corrective bounce from the lowest levels since December 2002.
- Hopes over Germany’s stimulus, mixed US/EU data allowed bears to take a breather.
- US ISM Services PMI, Sino-American tension and energy crisis will be important for fresh impulse.
EUR/USD consolidates the week-start losses as traders brace for full markets, as well as the key US activity data, during early Tuesday in Asia. In doing so, the major currency pair takes a U-turn from the lowest levels since late 2002 while posting mild gains around 0.9950 by the press time.
Moody’s confidence in Germany’s stimulus and capacity to defend the region from slipping into a chronic economic slowdown appeared to have recently favored the EUR/USD buyers. Germany's third fiscal relief plan will assist economic growth, per the rating giant’s latest statement reported by Reuters.
On the same line could be the CME’s FedWatch Tool which suggests a nearly 61% chance of the Fed’s 0.75% rate hike in September, versus more than 70% expected the last week. The reason could be linked to the downbeat US Nonfarm Payrolls (NFP).
The quote’s previous weakness could be linked to the impending recession woes in the bloc, as well as the firmer odds of the US Federal Reserve’s (Fed) faster rate hikes despite the recently mixed data. It should, however, be noted that the US holidays limited the EUR/USD weakness the previous day even as downbeat EU statistics and fears of more pain due to the energy crisis were noted.
Russia’s halting of energy supplies to European worsened the situation for the old continent after it joined the other Group of Seven (G7) leaders to announce a price cap on Moscow’s oil. Also adding to the European energy crisis were dimming hopes of the US-Iran oil deal and the output cut from the Organization of the Petroleum Exporting Countries and allies including Russia, known collectively as OPEC+.
Also, the US-China tussles over the trade deal and Taiwan escalated on Monday as the Biden Administration announced its intention to continue with the Trump-era tariffs for now. These tariffs were examined for removal and signaled the likely improvement in the relations previously. Further, the US readiness to sell arms to Taiwan and Taipei’s no-visa entry for some of its friendly country residents, including the US, teased Beijing to utter harsh words for the US-Taiwan ties and increases the tussles.
It should be observed that Eurozone Sentix Investor Confidence Index came in at -31.8 in September from -25.2 in August vs. -27.5 expected. However, the expectations index dropped to the lowest since December 2008 to -37.0 while the current conditions index fell to -26.5. Also, the recently softer PMIs hint at the faster pace of the bloc’s rush towards recession.
Given the latest recession fears and Friday’s softer US data, the ISM Services PMI for August, expected 55.5 versus 56.7 prior, will be eyed closely to gauge the EUR/USD moves.
Also read: ISM Services PMI Preview: High bar to help dollar bears pass through and take over
Technical analysis
A three-week-old descending resistance line, around the 1.000 psychological magnet, restricts the short-term EUR/USD recovery even if the oversold RSI puts a floor under the prices near the 0.9900 threshold.
-
23:18
AUD/USD Price Analysis: Downside looks likely to near 0.6700 ahead of RBA policy
- A downside bias is looming all-around ahead of the interest rate decision by the RBA.
- The asset may find a cushion around 0.6700 ahead as the downside looks imminent.
- A break into the 20.00-40.00 range by the RSI (14) is highly required to activate the declining mode.
The AUD/USD pair is experiencing modest selling pressure after facing barricades around 0.6800 in the late New York session. The major displayed a subdued performance on Monday after a gap down opening as investors shifted to the sidelines ahead of the interest rate decision by the Reserve Bank of Australia (RBA).
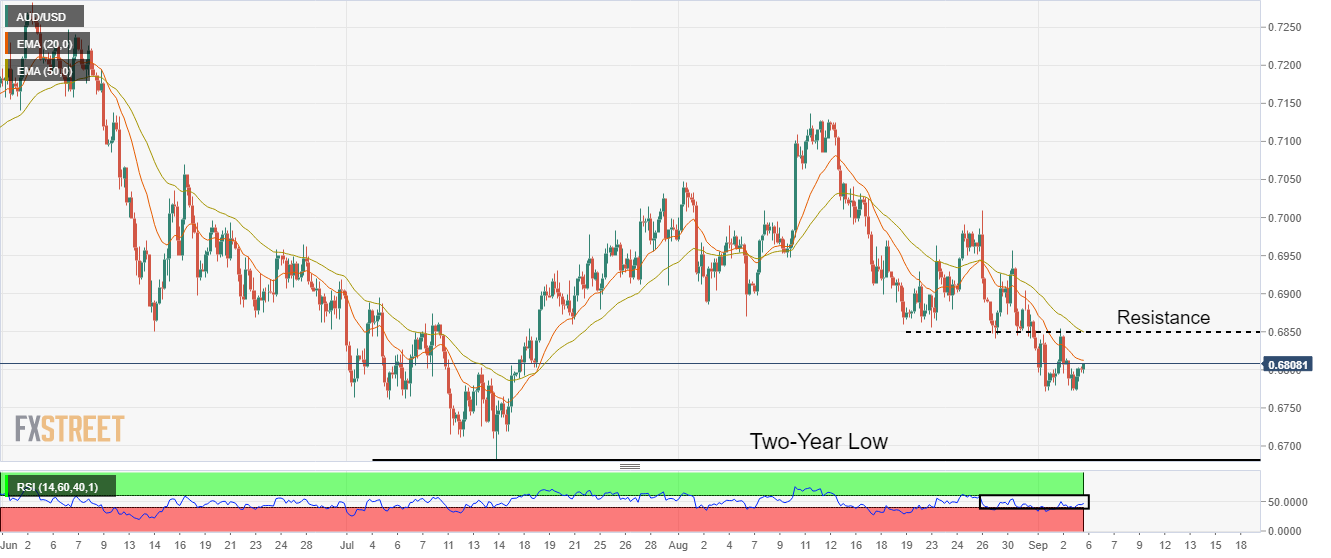
On a four-hour scale, the asset is declining towards the two-year low at 0.6682, recorded on July 14. A downside bias has been strengthened as the asset has faced barricades around the critical resistance placed from the August 30 low at 0.6846.
The 20-and 50-period Exponential Moving Averages (EMAs) at 0.6811 and 0.6846 respectively are declining, which adds to the downside filters.
However, the Relative Strength Index (RSI) (14) is oscillating in a 40.00-60.00 range, which indicates a consolidation ahead. For downside momentum, the RSI (14) is required to drop into the bearish range of 20.00-40.00.
Should the asset drop below Thursday’s low at 0.6770, the greenback bulls will get activated and may drag the aussie bulls towards the round-level support at 0.6700, followed by the 6 March 2020 high at 0.6657.
Alternatively, the aussie bulls could regain strength and may send the asset towards Wednesday’s high at 0.6904 and August 23 high at 0.6964, if the asset oversteps Friday’s high at 0.6855 decisively.
AUD/USD four-hour chart
-
23:16
Gold Price Forecast: XAU/USD stays defensive above $1,700, US ISM Services PMI, full markets eyed
- Gold price treads water after beginning the key week on softer footing.
- European energy crisis, US-China tussles weigh on sentiment but US holiday restricts market moves.
- Fears of recession, hawkish Fed bets underpin DXY strength.
- US ISM Services PMI for August, US traders’ reaction to latest developments awaited.
Gold price (XAU/USD) remains sidelined around $1,710, defensive after a softer start to the week, as traders await the key US data, as well as the return of the full markets on Tuesday. That said, the yellow metal’s losses could be linked to the escalating recession fears in Europe and the increasing tension between the US and China, not to forget fears of aggressive rates hikes by the US Federal Reserve (Fed).
Russia’s halting of energy supplies to European worsened the situation for the old continent after it joined the other Group of Seven (G7) leaders to announce a price cap of Moscow’s oil. Also adding to the European energy crisis were dimming hopes of the US-Iran oil deal and the output cut from the Organization of the Petroleum Exporting Countries and allies including Russia, known collectively as OPEC+.
Elsewhere, the US-China tussles over the trade deal and Taiwan escalated on Monday as the Biden Administration announced intention to continue with the Trump-era tariffs for now. These tariffs were examined for removal and signalled the likely improvement in the relations previously.
Further, the US readiness to sell arms to Taiwan and Taipei’s no-visa entry for some of its friendly country residents, including the US, teased Beijing to utter harsh words for the US-Taiwan ties and increases the tussles.
Alternatively, Friday’s mixed US jobs report and People's Bank of China’s (PBOC) signals for a cut in the foreign exchange reserve requirement ratio (RRR) by 200 basis points (bps) to 6% from 8% beginning September 15, per Reuters, limited the bearish move.
Amid these plays, European equities were lower and the bond yields were firmer while the US Dollar Index (DXY) refreshed its 20-year high.
Looking forward, the full markets’ reactions to the latest recession fears and Friday’s softer US data will be crucial to watch for the XAU/USD traders. Also important will be ISM Services PMI for August, expected 55.5 versus 56.7 prior. Given the looming recession fears and the escalating geopolitical tension, any increase in the data could renew the hawkish Fed bets and favor the gold buyers.
Also read: ISM Services PMI Preview: High bar to help dollar bears pass through and take over
Technical analysis
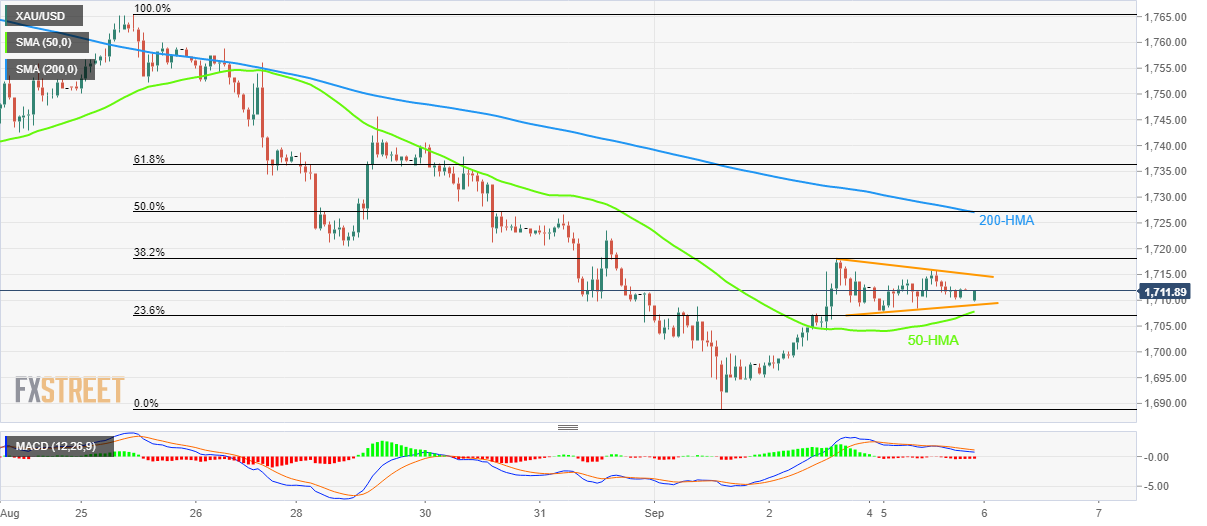
Gold price seesaws inside a two-day-old symmetrical triangle as traders await the return of the full markets.
In addition to the triangle area between $1,709 and $1,715, the 50-HMA and the 200-HMA also restrict short-term XAU/USD moves around $1,707 and $1,727 in that order.
It’s worth noting, however, that the bearish MACD signals and the commodity’s pullback from the 38.2% Fibonacci retracement of August 25 to September 01 downturn, around $1,718, also keep sellers hopeful.
That said, a downside break of the $1,707 support comprising the 50-HMA won’t hesitate to drag the quote towards the monthly low near $1,688 before highlighting the yearly bottom marked in July, near $1,680.
Meanwhile, recovery remains elusive until crossing the 200-HMA hurdle near $1,727, a break of which could propel the XAU/USD buyers towards the August-end swing high near $1,745.
Overall, gold bears are in control but the room towards the south is limited.
Gold: Hourly chart
Trend: Further weakness expected
-
23:00
EUR/JPY Price Analysis: Subdued around the 138.50-139.50 area
- EUR/JPY edges slightly up as the Asian Pacific session begins on positive sentiment.
- The cross-currency daily chart portrays the pair as neutral.
- In the near term, the EUR/JPY could reach 140.82 if it reclaims 139.87; otherwise, a fall towards 138.30s is on the cards.
The EUR/JPY is almost flat as the Asian Pacific session begins after registering minimal gains of 0.01% on Monday, hitting a daily high at 139.64. As the Asian Pacific session begins, the EUR/JPY is trading at 139.62, above its opening price, amidst a positive market mood.
EUR/JPY Price Analysis: Technical outlook
From a daily chart perspective, the EUR/JPY is neutral-biased, as the pair failed to break above/below the 133.39-142.32 range. Even though it’s a wide range, the daily moving averages (DMAs)begin to intersect in the 134.59-139.55 area, with a horizontal slope. Therefore, the cross-currency pair is sideways.
Short term, the EUR/JPY rising wedge, seen in the one-hour scale, broke below the bottom trendline, opening the door for Monday’s low at 138.68, before recovering some ground above the 139.00 mark. It is worth noting that the Relative Strength Index, although in bullish territory, is almost horizontal, meaning consolidation lies ahead.
In the scenario for the EUR/JPY breaking upwards, the first resistance would be the R1 daily pivot at 139.87. Once cleared, the next supply zones would be the confluence of the R2 pivot and the bottom-trendline of the rising wedge around 140.23 before reaching the R3 daily pivot point at 140.82.
On the flip side, the EUR/JPY first support would be the daily pivot at 139.27. a breach of the latter will expose the S1 pivot at 138.91, followed by the S2 pivot at 138.32.

EUR/JPY Key Technical Levels
-
22:50
USD/JPY oscillates around 141.80 ahead of US ISM Services PMI
- USD/JPY is juggling around 141.60 as the focus shifts to US ISM Services PMI data.
- The asset is displaying a loss in upside momentum amid lower consensus for Services PMI.
- An increment in Japan’s Overall Households Spending data may step up the inflation rate ahead.
The USD/JPY pair is displaying a lackluster performance in the early Tokyo session as investors are awaiting the release of the US ISM services PMI data. The asset is displaying back-and-forth moves in a narrow range of 140.53-140.60. On Monday, the asset printed a fresh 24-year high at 140.80. However, a follow-up momentum loss structure is indicating that investors are discounting lower consensus for the US ISM Services PMI data.
As per the preliminary estimates, the Services PMI will decline to 55.5 against the prior release of 56.7. Also, the forward-looking Services New Orders Index will remain subdued at 59.5 vs. 59.9. The consequences of adopting sheer pace in hiking interest rates by the Federal Reserve (Fed) are visible in the service sector. Also, the big tech boys have already halted their recruitment process ahead of a decline in economic activities.
Apart from that, the speech from Fed chair Jerome Powell scheduled on Thursday will be of utmost importance. Fed’s Powell may dictate the likely monetary policy action in September so the market participants could gear up for the unexpected.
On the Tokyo front, investors are awaiting the release of the Overall Household Spending data. The economic data is seen higher at 4.2% against the former print of 3.5%. An acceleration in households’ payouts may support the inflation rate, and the Bank of Japan (BOJ) will move apparently towards the path of a ‘neutral’ stance on monetary policy.
-
22:21
NZD/USD Price Analysis: Bulls are holding the fort at key support
- NZD/USD bulls are lining up at a key support area on the lower time frames.
- The trendline resistance is holding things up, but a breakout could be immanant.
NZD/USD is trapped below a trendline resistance but there is a bullish structure that is forming on the 4 and 1-hour charts as the following analysis illustrates. However, there is still a lot of work that needs to be done before a breakout to the upside can fully unfold. The Reserve Bank of Australia could be the catalyst to move the needle in the antipodeans for the day ahead.
NZD/USD H4 charts
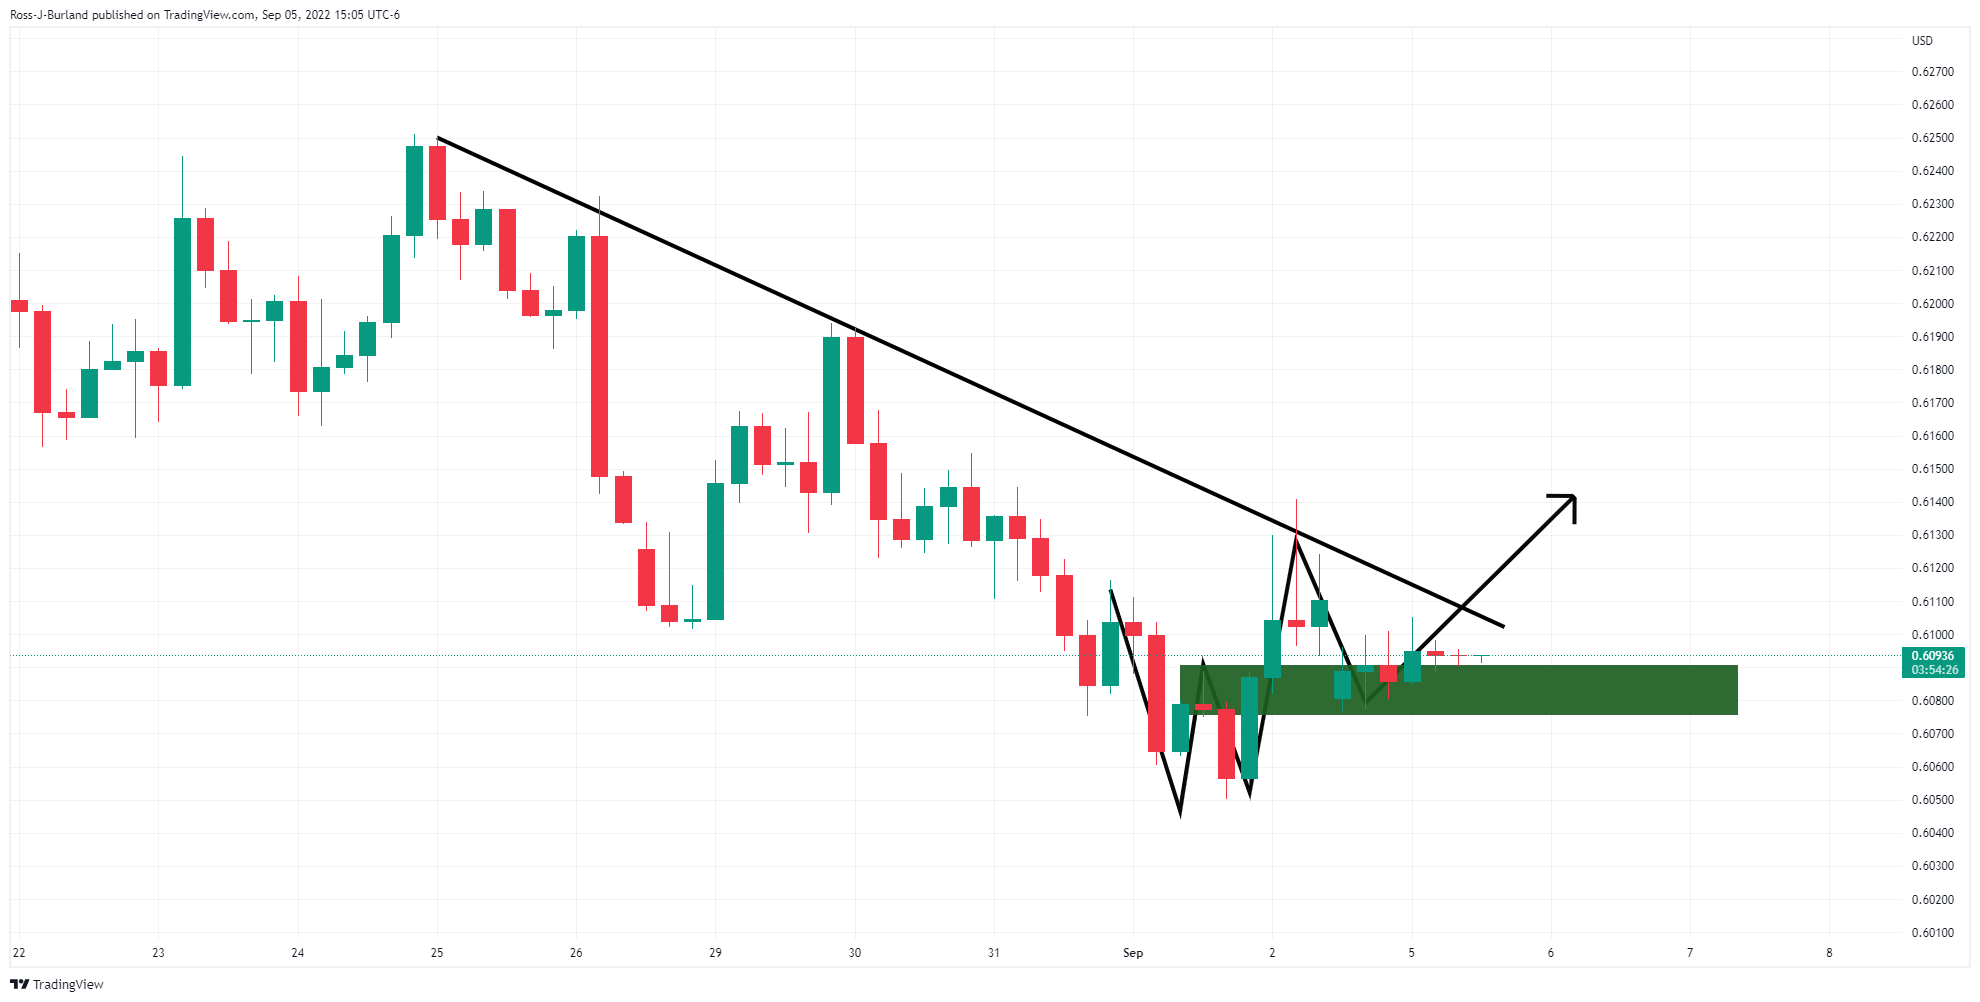
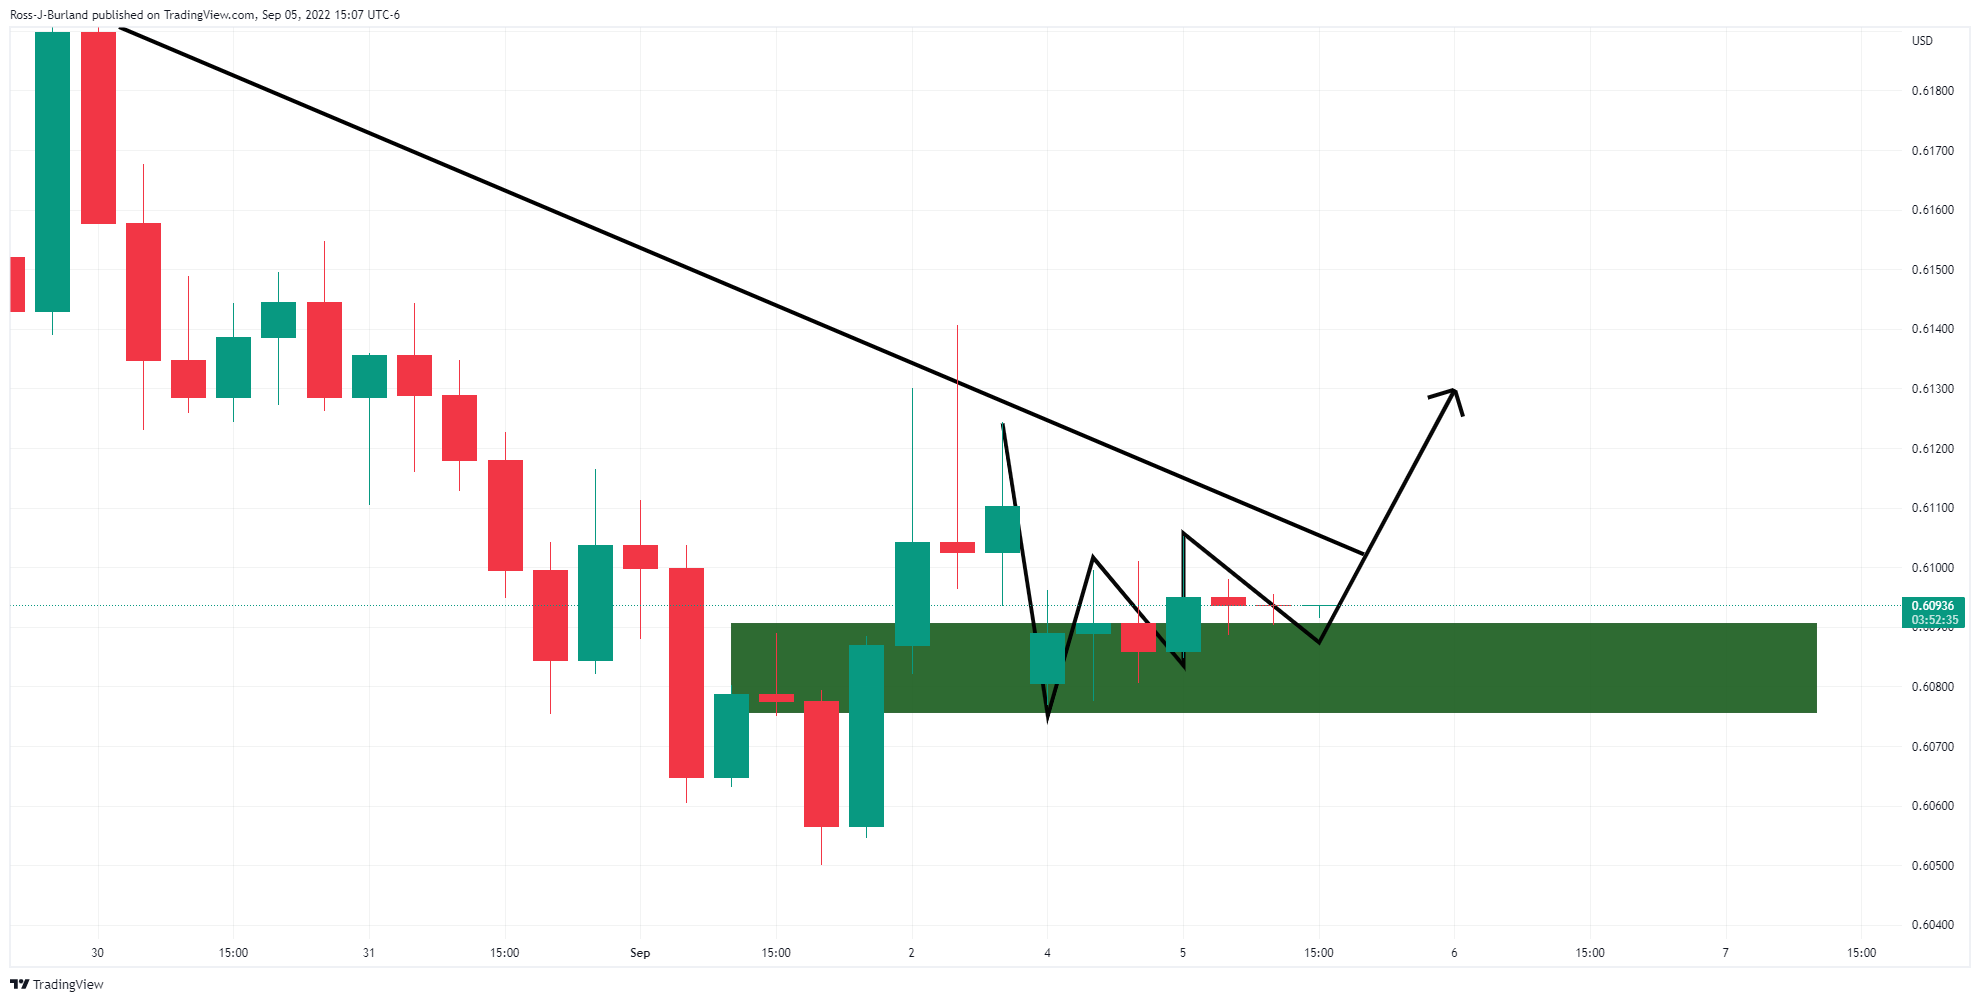
We have a series of bullish W-formations on the table. This signifies a breakout to the upside could be imminent. Encouraging, we also have two inside bars and a break of the prior candle's highs, near 0.6105 will likely solidify the bullish case.
NZD/USD H1 chart
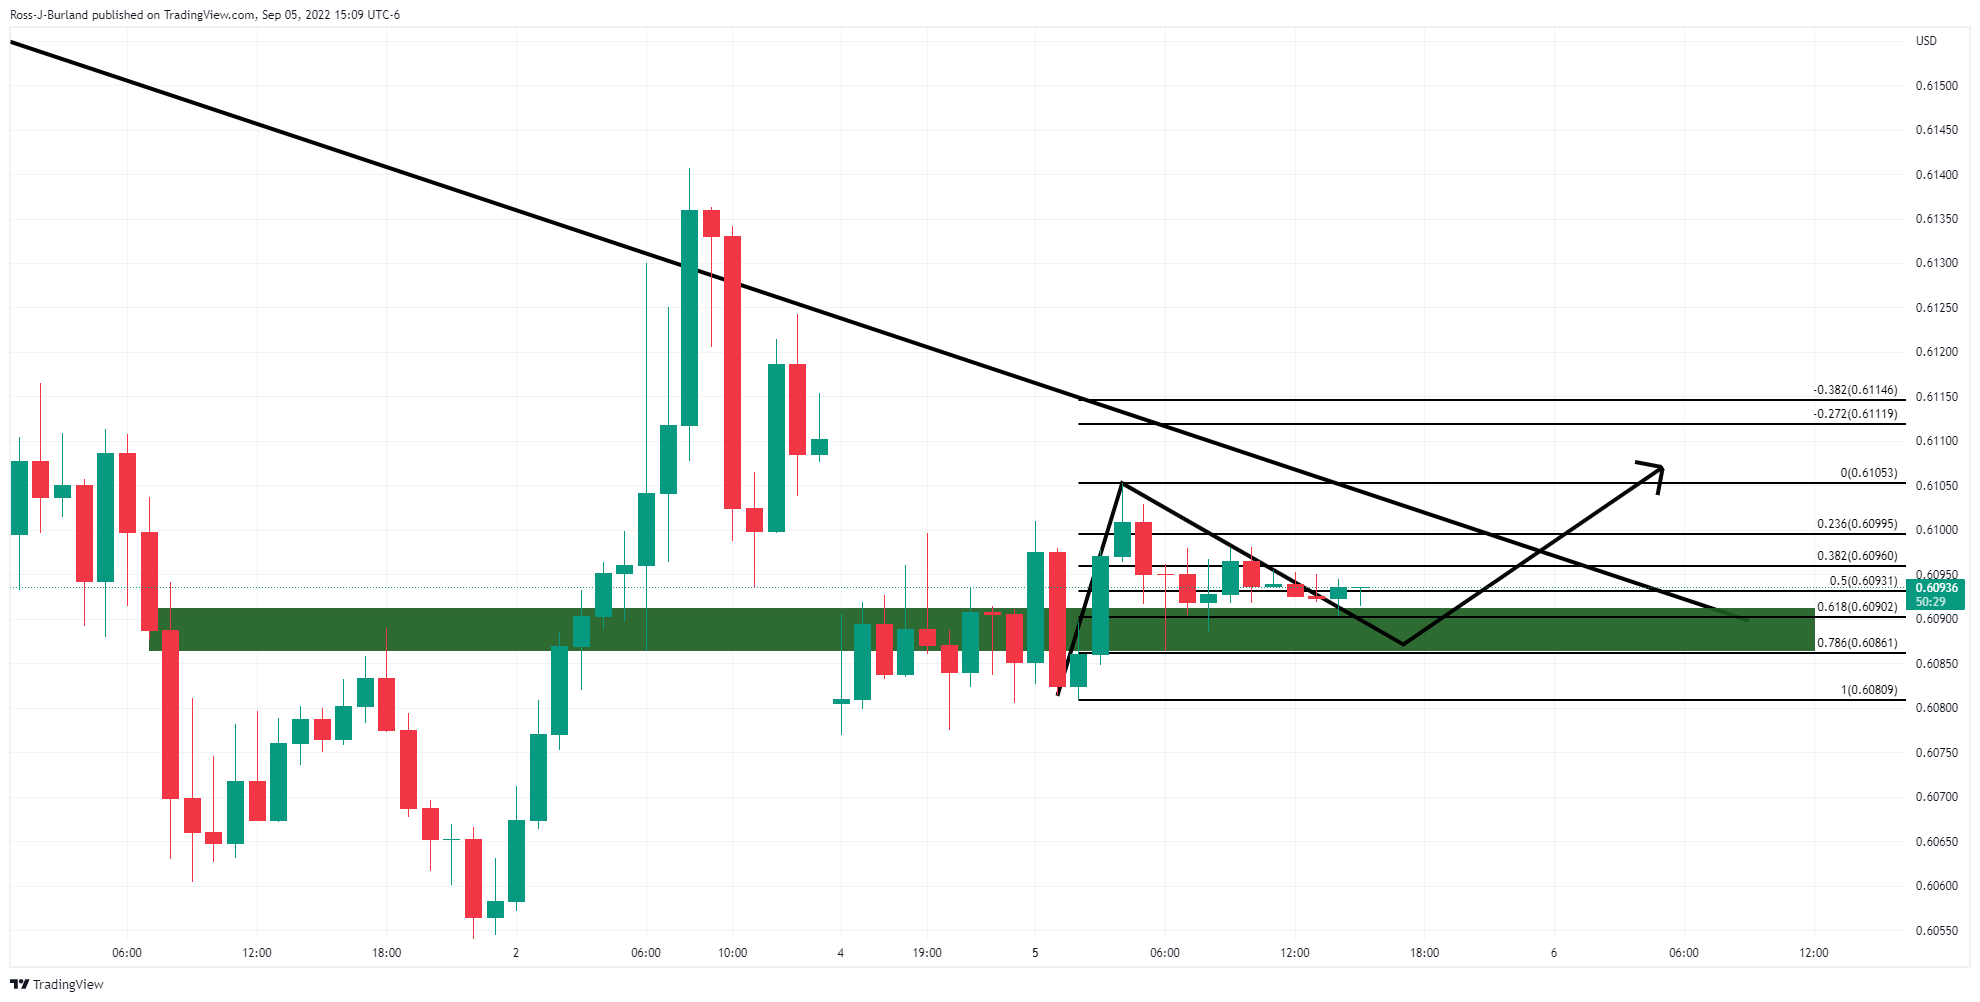
The hourly time frame has seen a pull back into the support area that coincides with a 61.8% ratio that is so far holding up, so this adds to the bullish conviction for the near term.
-
21:35
Oil slides from session highs but holds in positive territory
- WTI bulls are taking up the bullish territory above $88.00.
- Iran remains the wild card for energy markets.
Oil prices have been supported by expectations gas prices would leap in Europe and WTI rallied to a high of $90.37 from a low of $87.06 with the European energy crisis dominating news as the gas supply from Russia has been halted indefinitely.
Meanwhile, OPEC+ met on and was expected to keep oil output quotas unchanged for October if not only a small production cut to bolster prices that have slid due to fears of an economic slowdown in Europe and China which is suffering from lockdowns due to COVID-19.
''Crude oil prices are revealing an extremely damaged microstructure, featuring vanishing liquidity with open interest and net speculative positioning declining to multi-year lows, contributing to wild price swings. On the surface, energy prices are melting as we stare down the barrel of a recession, with Chinese demand continuously at risk from the nation's zero-covid strategy,'' analysts at TD Securities explained.
As for OPEC, the cartel modestly cut oil production by 100,000 barrels a day, rolling back the increase they approved a month ago with the group being determined to defend a price level of around $100 a barrel. ''OPEC Plus is also demonstrating that it is willing to shrug off the entreaties of the Biden administration, which has been lobbying Saudi Arabia, the United Arab Emirates and other oil producers to increase output to help bring down the price of gasoline, in part to avoid a backlash against the war in Ukraine for causing higher energy prices,'' the New York Times reported.
Elsewhere, the Iran nuclear deal is a wildcard for oil markets. The analysts at TD Securities explained that there us potential to put an end to the pandemic-era bull market by substantially adding to the world's spare capacity, thereby allowing other producers to play catch-up.
''However,'' they say, ''US most recently raised doubts that an agreement can be reached by characterizing Iran's latest response as 'not constructive'. Further, any potential resolution appears plagued with legal and political risks which blur the outlook. What is more clear, is that failure to reach a deal would likely translate into a sharp repricing of supply risk premia, which should once again begin to insulate energy prices from a downturn in demand.''
-
20:36
Forex Today: Dollar reigns as risk aversion leads
What you need to take care of on Tuesday, September 6:
The greenback started the week advancing against most major rivals, although a Federal holiday in the US maintained volumes at their lows and major pairs within limited intraday ranges.
The EUR/USD pair fell to 0.9877, a fresh 22-year low, as the energy crisis steepens. Russian gas provider Gazprom shut down the Nord Stream 1 pipeline on Friday, reporting a leakage. On Monday, news agencies reported that Moscow’s decision to cut energy to Europe would continue until Western nations lift sanctions imposed after the Ukraine invasion. Germany announced it will keep maintaining two nuclear power plants until April. Uncertainty ahead of the winter is likely to maintain the shared currency on the negative side of the equation.
The GBP/USD pair settled at 1.1515 after falling to 1.1442. The United Kingdom confirmed Liz Truss would become the next Prime Minister after beating Rishi Sunak as Tory leader.
USD/CAD is lifeless around 1.3140, while the AUD/USD pair battles the 0.6800 level ahead of the Reserve Bank of Australia monetary policy decision. The central bank is expected to hike the cash rate by 50 bps for a fourth consecutive month.
Safe-haven gold saw no action, stuck around $1,710 a troy ounce. The OPEC+ announced plans to cut production targets by about 100,000 K barrels per day starting October. The announcement lifted oil prices, although the US holiday limited activity around WTI, now changing hands at $88.80 a barrel.
The USD/JPY pair trades at around 140.50, while USD/CHF hovers around 0.9800.
Top 3 Price Prediction Bitcoin, Ethereum, Ripple: Whale Watching 101 – Guppies vs Goldfish
Like this article? Help us with some feedback by answering this survey:
Rate this content -
20:22
Gold Price Forecast: XAU/USD drops from daily highs but still above the $1700 figure
- Gold price barely slides 0.13%, weighed by higher US T-bond yields and a strong US dollar.
- Tensions between Europe and Russia threaten to worsen Europe’s energy crisis.
- US Calendar: Fed’s Mester, and Powell, to hit the stand on Wednesday and Thursday, respectively.
Gold price losses some of its brightness at the beginning of the week, down by 0.49%, in a thin liquidity trading day, with US markets, closed in the observance of Labour day. At the time of writing, the XAU/USD is trading at $1710 a troy ounce.
Monday’s market narrative includes tensions arising due to the energy crisis in Europe. Russia’s Gazprom halted natural gas flows through the Nord Stream 1 pipeline, citing a leak. Nevertheless, the headline crossed newswires after a G7 reunion put a lid on Russian oil prices.
In the meantime, the US Dollar Index, a measure of the buck’s value vs. a basket of six currencies, gains 0.20%, a headwind for the yellow metal, up at 109.826. The US 10-year benchmark note rate followed suit, gaining four bps at 3.231%.
Last week’s employment figures, released on Friday by the US Department of Labor, revealed that the US economy added 315K jobs in August, higher than forecasts to 298K. Although it was a positive reading, reinforcing the case for the Fed going 75 bps, the previous two months were downward revised by 107K.
Worth noting that the Unemployment Rate ticked up 3.7%, showing signs of softening. After data’s released, Federal Fund rates (FFR) futures easied a tone. Markets expected that the US central bank would tighten 63.9 basis points instead of 68.
What to watch
The US economic docket will feature Fed speakers, led by Cleveland President Loretta Mester, on Wednesday and Jerome Powell’s speech on Thursday. On Thursday, Initial Jobless Claims for the week ending on September 2, alongside the S&P Global and ISM Services PMI, would be eyed by investors looking for clues of how the US economy fares.
Gold (XAU/USD) Key Technical Levels
-
20:13
EUR/USD Price Analysis: Bulls eye a 50% mean reversion near 0.9950
- EUR/USD bulls are committing at 0.9925 support.
- If the right-hand shoulder of the H&S continues to build above 0.9900, then a 50% mean target 0.9950 will be eyed.
As per the prior analysis, EUR/USD Price Analysis: Bears eye a move into test 0.9900, the price indeed moved in to test the round number, reaching a low of 0.9877 on the day. This happened in a bearish gap and subsequent follow-through as the US dollar firmed to score fresh bull cycle highs around 110.20 as per the DXY index.
The dollar has since been faded which gave some relief to the forex space and the euro. At the time of writing, DXY is trading at 109.779 and recently plummeted to 109.534.
The euro's recovery has started to decelerate but the price is yet to close the opening gap or correct meaningfully to a significant retracement of the prior 4-hour bearish impulse. This leaves prospects of a deeper bullish correction for the day ahead as illustrated in the following analysis.
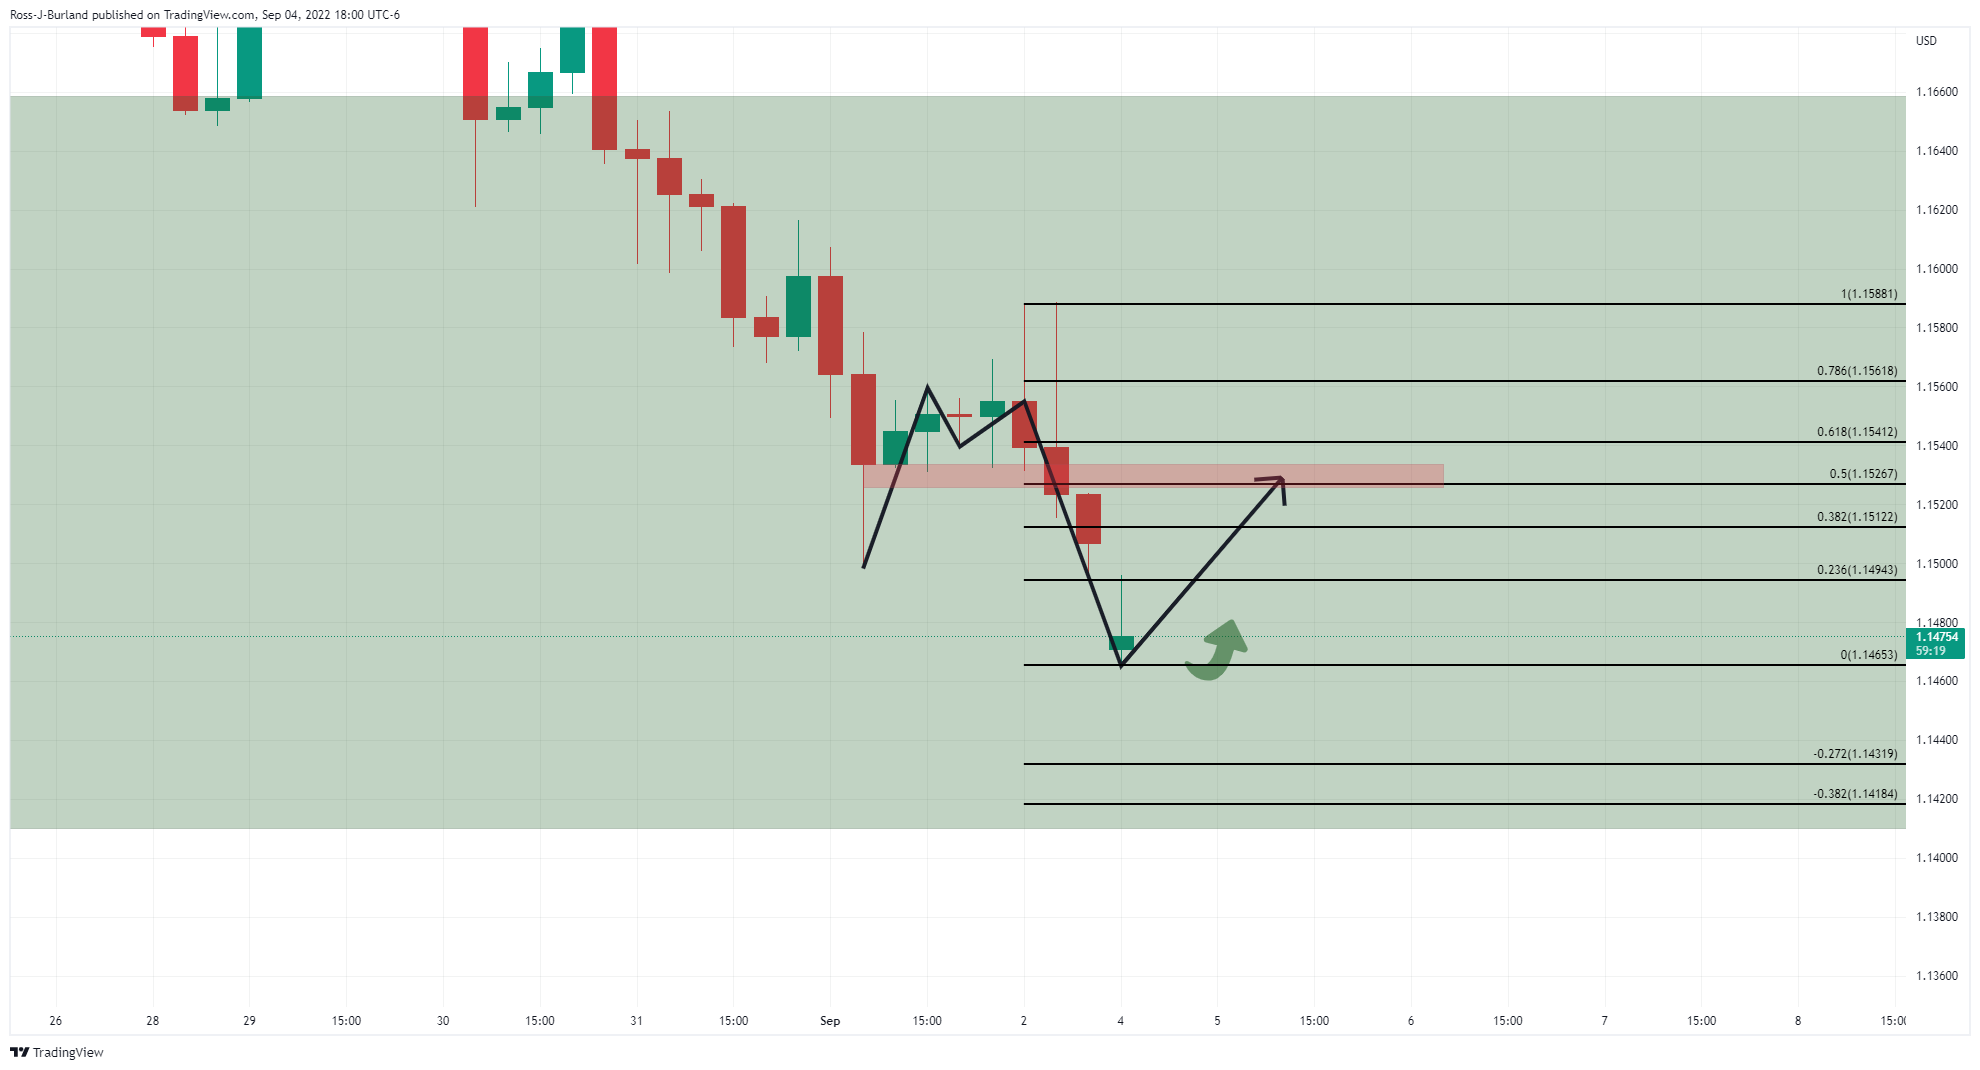
EUR/USD prior analysis, H4 chart
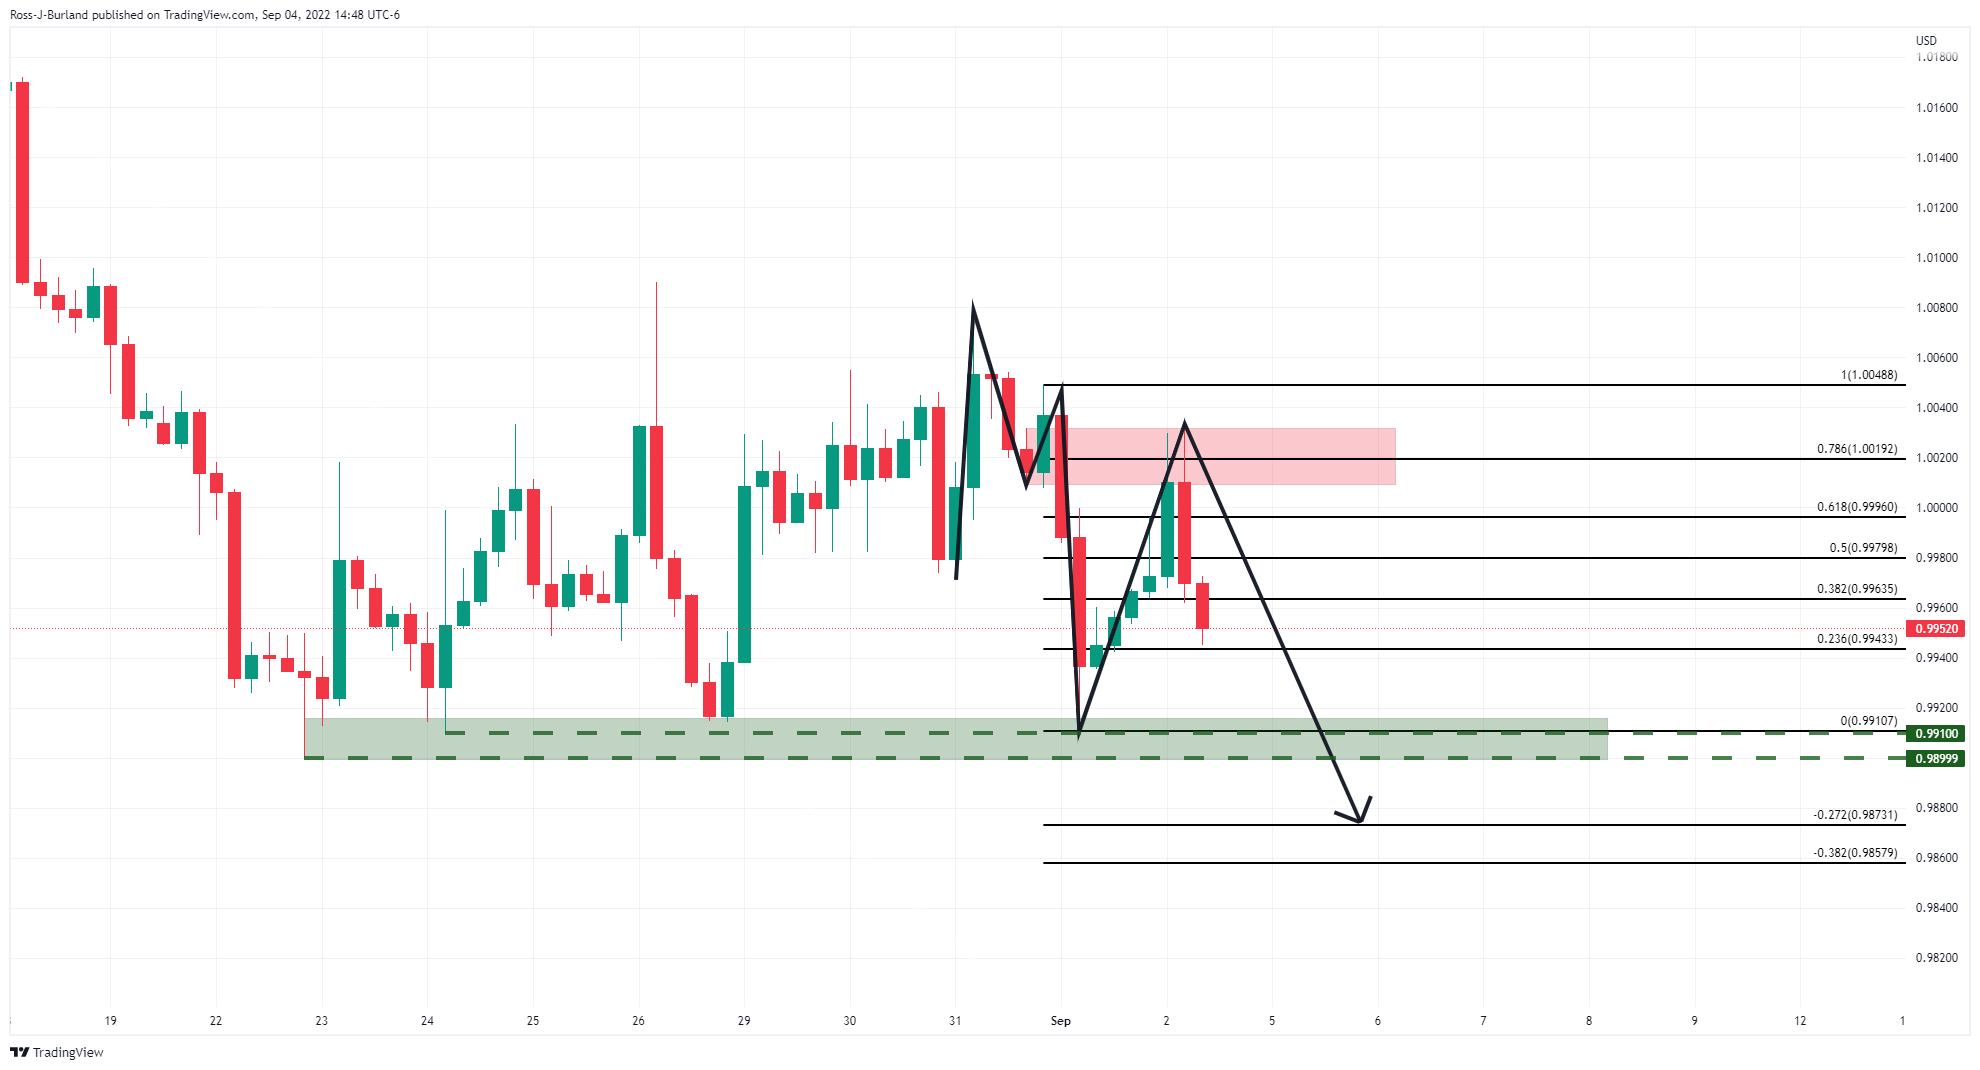
It was explained that the price had dropped heavily from the 78.6% Fibonacci retracement area that met with the resistance of the M-formation's neckline. The tweezer top was also a bearish feature and a move to test support was on the cards should 0.9940 give out:
EUR/USD live update
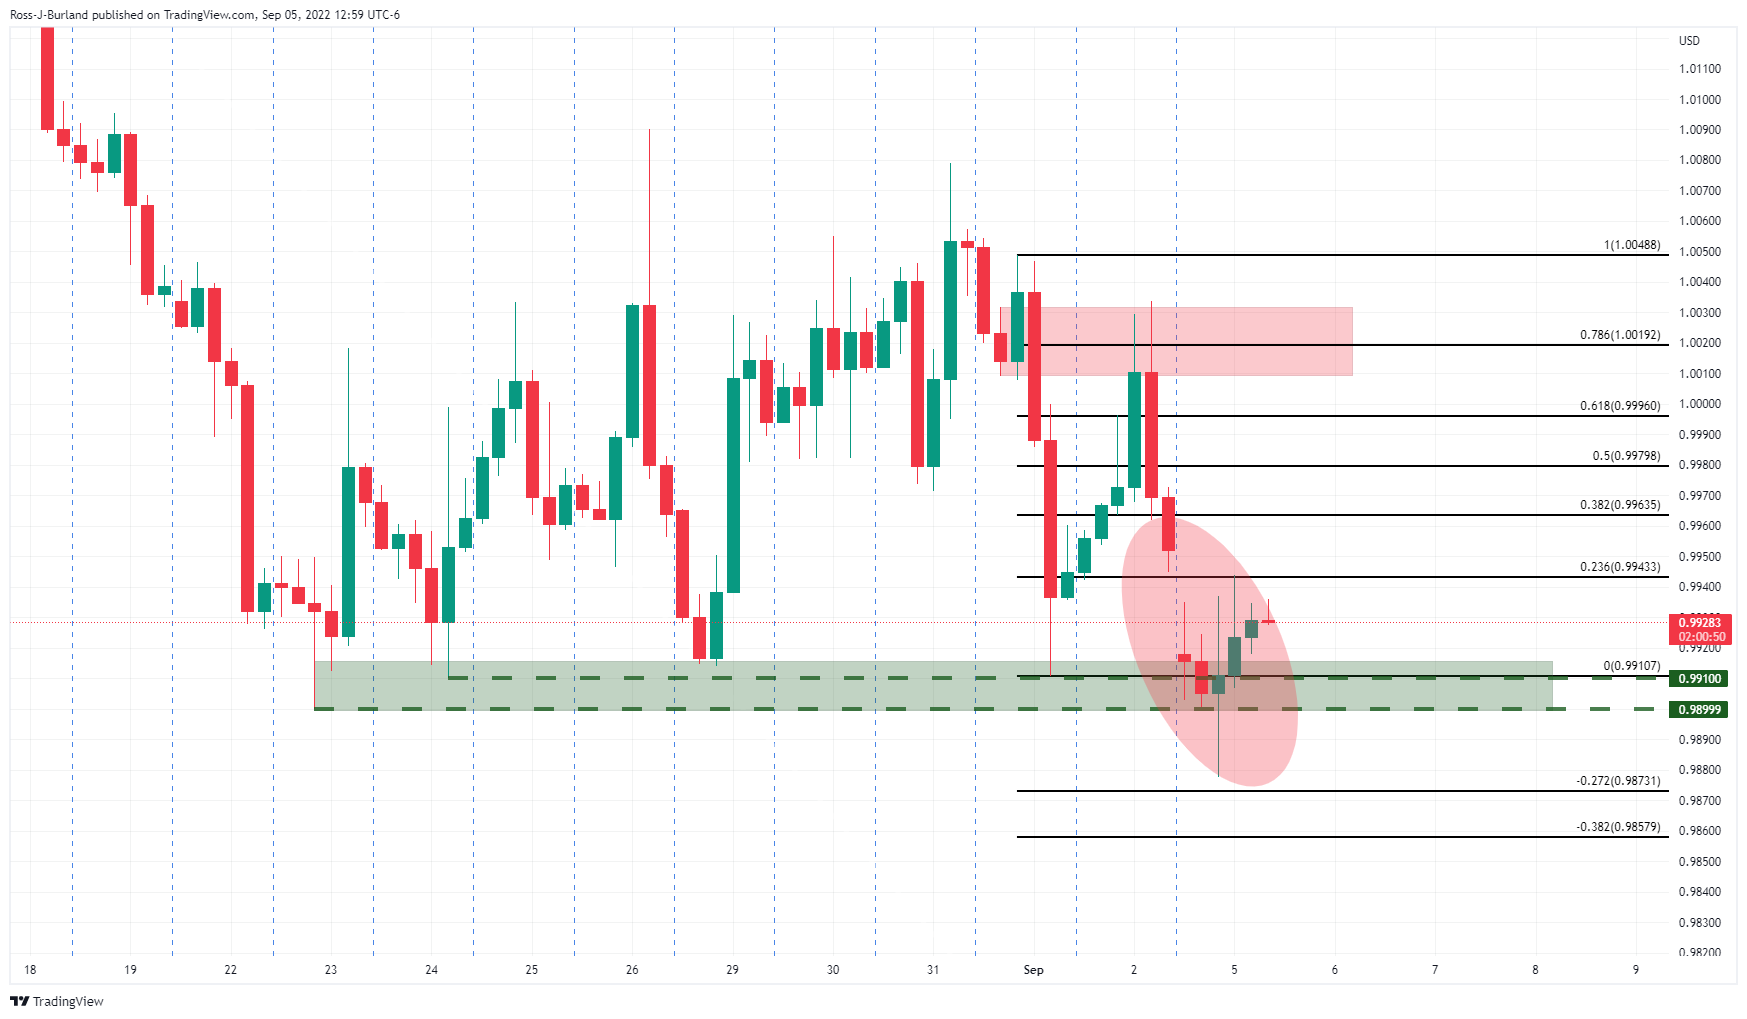
The price is creeping in on the gap and it has made a 38.2% Fibonacci retracement, but a fuller correction could be on the cards prior to the next bearish impulse to the downside:
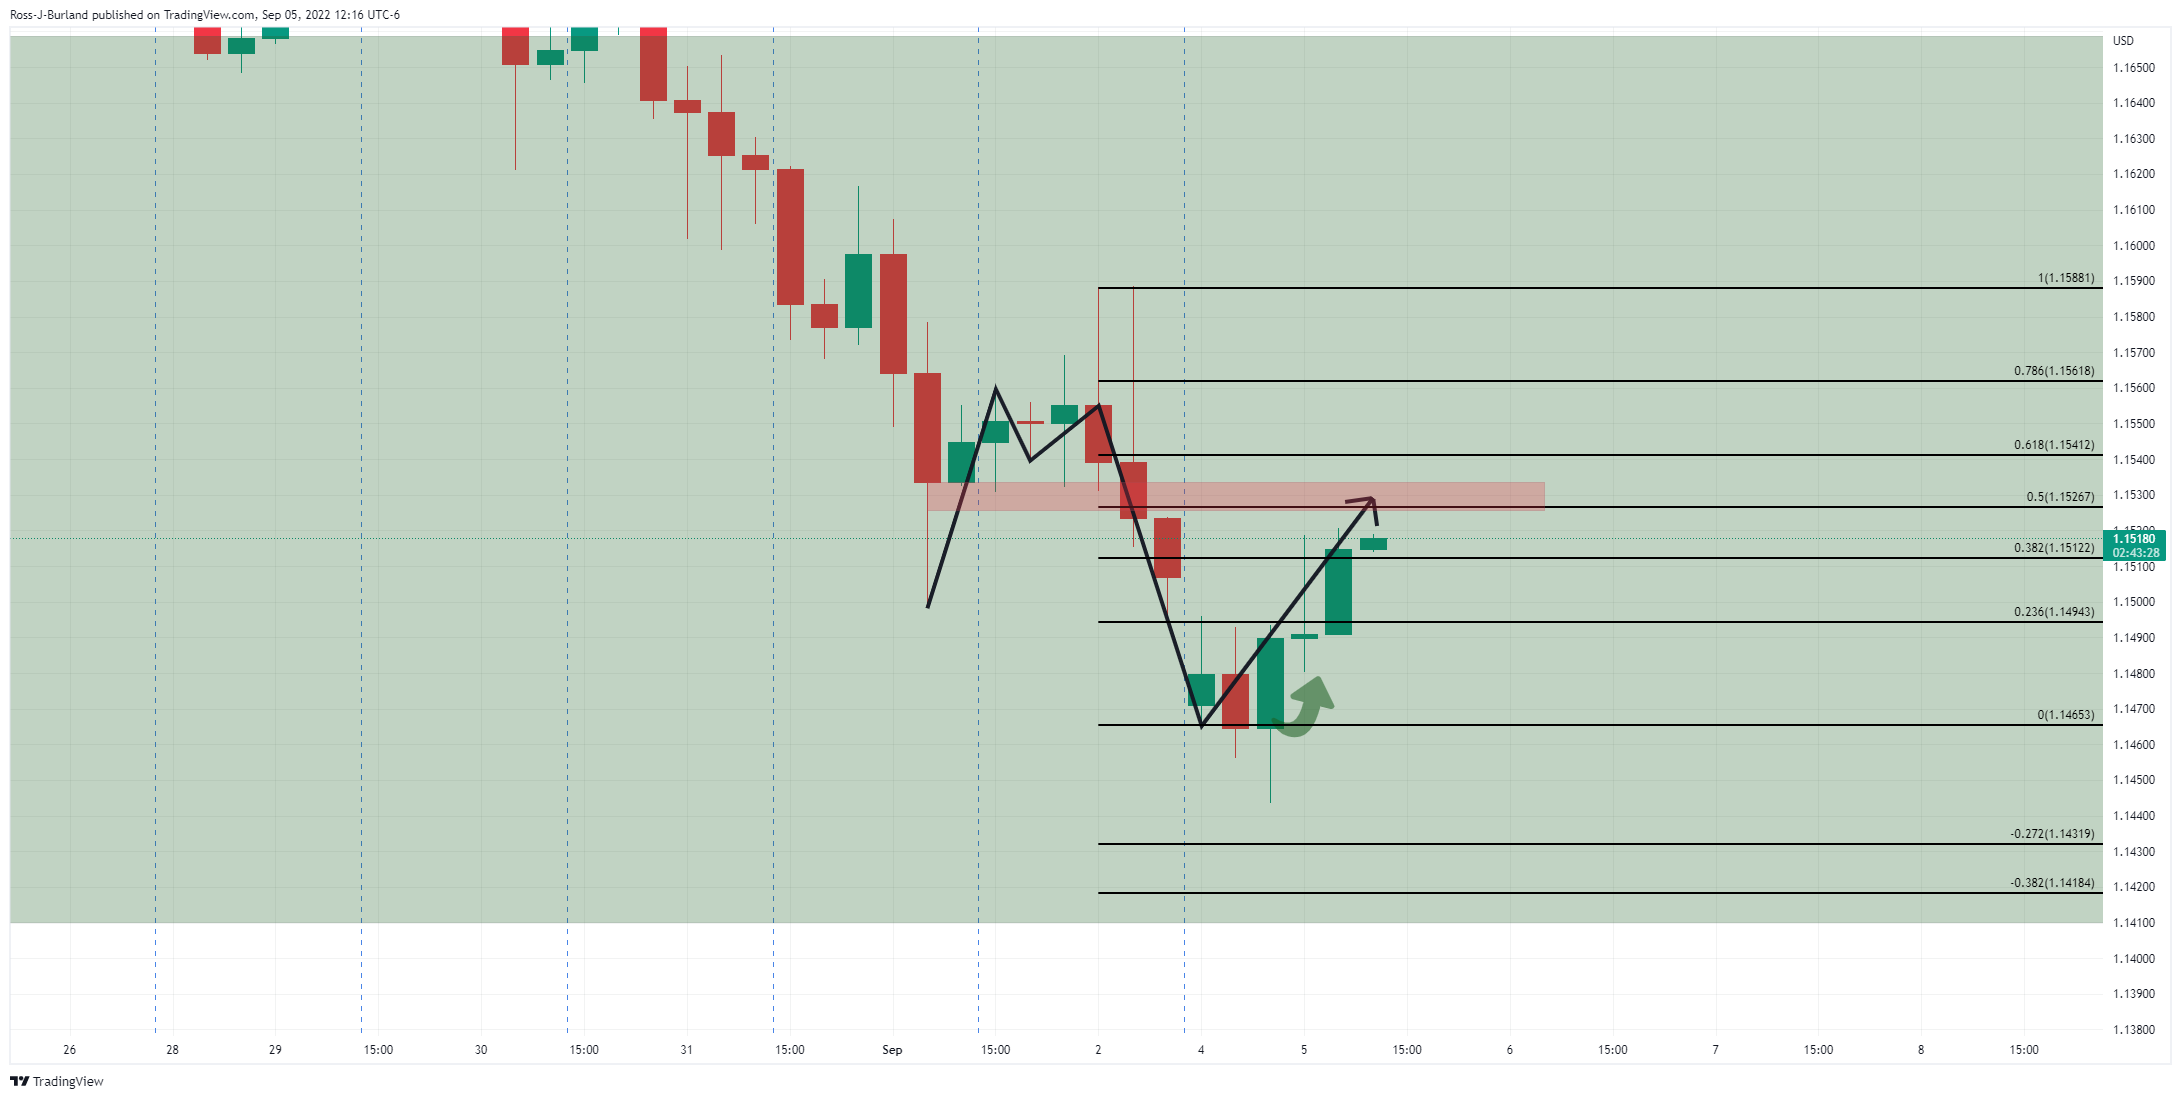
EUR/USD H1 charts
On the chart above, the bullish inverse head and shoulders are a compelling feature on the hourly time frame. this is also accompanied by the W-formation below:

Should the support around 0.9925 hold, then an imminent bullish impulse could be on the cards. If the right-hand shoulder continues to build above 0.9900, then the bulls will be seen to be committing to the correction for the day ahead and a higher retracement on the breakout would be expected. The 50% mean reversion target is located around 0.9950.
-
19:29
GBP/USD bulls hold the fort above critical levels at the edge of the abyss
- GBP/USD holds in bullish territories as the US dollar slides from fresh bull cycle highs.
- GBP/USD bulls step in at a key area of support on the near and longer-term charts.
GBP/USD remains in bullish territory above 1.1500 having recovered from the low of the day down at 1.1443, around a two-and-a-half-year low, making its way into test 1.1520 in recent trade. The US dollar is the driver in the forex space but, domestically, the main feature so far for the week has been Liz Truss becoming Britain's next prime minister after winning a leadership race for the governing Conservative Party.
Truss will take power and name her cabinet on Tuesday, and markets will be on the lookout for any leaks of her fiscal plans. She has already pledged not to raise taxes nor to ration energy and has specifically ruled out any windfall taxes on energy companies.
Reports suggest Truss is preparing an emergency mini-budget in her first month as Prime Minister and it is yet to be seen whether she will follow through on her promises to immediately cut taxes in an effort to jump-start the economy. British government bonds suffered their biggest monthly price losses in decades in August, due to inflation fears but also on Truss's planned tax cuts and proposals to stimulate the economy with fiscal spending.
Meanwhile, on Wednesday, the Bank do England Governor, Andrew Bailey & 3 members of the Monetary Policy Committee will face MPs for a grilling on the outlook for inflation and interest rates. This will be the last we will hear from them ahead of the September BoE meeting, so traders will be all ears to the ground for hints with regards to a bias leaning towards either a 50bps or 75bps hike for the MPC rate decision.
''Governor Bailey, Chief Economist Pill, and MPC members Mann and Tenreyro will testify. They will of course come under heavy criticism for allowing inflation to rise so much above target,'' analysts at Brown Brothers Harriman said. ''Tightening expectations continue to rise, as WIRP suggests nearly 70% odds of a 75 bp hike to 2.5% September 15. Looking ahead the swaps market is pricing in 275 bp of tightening over the next 12 months that would see the policy rate peak near 4.5%, up from 4.0% just two weeks ago.''
US dollar is faded through 110 psychological level
The US dollar, as measured by the DXY index, rallied to 110.271 on Monday, helped by a plunge in the euro due to the Russian gas halt and a drop in the Chinese yuan that struggles in the face of a resurgence of COVID-19 infections across the country. Besides the risk-off pulses, the greenback continued to be driven higher on the coattails of Fed Chair Jerome Powell's recent remarks made at the Jackson Hole symposium in Wyoming, explaining that rates would need to be high "for some time" to combat stubbornly high inflation. However, the dollar has since been faded from the highs which gave some relief to the forex space, including the pound. At the time of writing, DXY is trading at 109.779 and recently plummeted to 109.534.
For the week ahead, the data highlight will be August ISM services PMI Tuesday. The headline is expected at 55.4 vs. 56.7 in July. Traders will be taking note of the employment and prices paid data, which stood at 49.1 and 72.3 in July, respectively. fed speakers will also be key. Chair Powell, Vice-Chair Brainard, and Governor Waller will make public appearances to talk about the economic outlook and markets will be looking for them to build on Powell's Jackson Hole remarks.
''They will stress that inflation is still too high and bringing it down is priority number 1, which requires further rate hikes as well as keeping the policy rate high for "some time" once the terminal is reached,'' analysts at TD Securities said.
GBP/USD technical analysis
As per the start of the day's analysis, GBP/USD Price Analysis: Bulls move in but there could be more from the US dollar, the bulls have moved in and we did see more from the US dollar.
GBP/USD H4 chart, prior analysis
GBP/USD, update
The price made fresh lows but the bulls stuck in there and have subsequently moved in on the 50% mean reversion target as the prior analysis had projected. At this juncture, bulls will need to keep above 1.1490 or face prospects of a move to the lowest levels since 1985, below 1.1413:
GBP/USD monthly charts
On the other hand, should the bulls stay the course, then the upside eyes prospects of a significant retracement:
-
19:28
AUD/USD solid, meandering around 0.6800 ahead of the RBA's decision
- AUD/USD is registering solid gains amidst a dismal market sentiment.
- Softer than estimated US employment figures pushed the Federal funds rate expectations lower than previously.
- Based on data, TDS Securities Analysts commented that the RBA might hike 50 bps.
The AUD/USD recovers some ground after recording fresh two-month lows during the last week, amid a negative market sentiment trading session, with US equities being closed in the observance of Labor day, while European stocks are trading in the red. Factors like Europe’s energy crisis, alongside high inflation, added to the risks of a global economy.
The AUD/USD opened the week near the session’s lows, around 0.6770s, but edged higher and exchanging hands around the 0.6800 figure at the time of writing.
Last Friday’s US employment report exceeded estimates, but downward revisions on the previous two months, easied expectations of a Federal Reserve 75 bps rate hike. Nonfarm Payrolls came at 315K vs. 298K estimated, while the unemployment rate was 3.7%. That said, Federal Funds futures lost 3.7 bps on Friday, to 63.9 bps to tightening, right in the middle of 50-75 bps.
Meanwhile, the US Dollar Index records decent gains of 0.16%, at 109.779, capped by a sour sentiment.
AUD/USD to edge higher on the RBA 50 bps hike expected
On Tuesday, the Reserve Bank of Australia is expected to hike rates by 50 bps as they continue to fight to tame inflation. Analysts at TD Securities forecast a 50 bps rate hike on the thesis that the labor market remains tight, a solid consumer spending, and price pressures spread wide.
“A 50bps hike is consistent with prior RBA hikes and in line with firm data outcomes. Of more importance is the language accompanying a 50bps hike. Does the RBA strengthen its language/resolve to get on top of inflation by removing ‘even keel’ or ‘path to achieve this balance is a narrow one and clouded in uncertainty’. Or does the RBA signal a more prolonged hiking cycle but highlights a step down in the pace of rate hikes? We favour the 2nd option.”
What to watch
Australia’s economic docket will feature the RBA’s monetary policy decision, alongside the Current Account Balance, Exports, and the Real GDP. The US calendar will feature Fed speakers with Cleveland President Loretta Mester on Wednesday and Jerome Powell’s speech on Thursday. Furthermore, unemployment claims for the week ending on September 2, alongside the S&P Global and ISM Services PMI, would be eyed by investors, looking for clues of how the US economy fares.
AUD/USD Key Technical Levels
-
17:59
Bank of Canada to deliver a 75 bps hike to 3.25% on Wednesday – Wells Fargo
The Bank of Canada (BoC) will have its monetary policy meeting on Wednesday. A rate hike of 75 basis points is expected. Analysts at Wells Fargo think the BoC will slow down the pace of its hikes beyond September, only taking the policy rate to 3.75% by the end of the fourth quarter.
Key Quotes:
“The Bank of Canada (BoC) will also have its September monetary policy meeting on Wednesday. The BoC has embarked on one of the more aggressive tightening cycles among the G10 countries, and there are some hints the effects of tighter monetary policy might be starting to cool inflation down. Headline inflation in Canada decelerated to a 7.6% year-over-year pace in July, driven by falling commodity prices. However, the average of three core inflation measures ticked up to 5.3%, indicating that underlying price pressures still remain elevated for now.”
“After a jumbo 100 bps rate hike in July, we expect the BoC to deliver a 75 bps hike to 3.25% at its September meeting. We think the BoC will slow down the pace of its hikes beyond September, only taking the policy rate to 3.75% by the end of Q4-2022, although we see the risks as remaining tilted to a higher peak. We will be particularly interested in guidance on future policy from the BoC, especially against a backdrop of slowing growth and still-elevated inflation.”
-
17:59
USD/JPY Price Analysis: Retraces from the YTD highs, stays around 140.50s
- USD/JPY marches firmly around 0.28% amidst a light trading session.
- The weekly chart shows the pair in overbought conditions, opening the door for a pullback.
- A doji in the USD/JPY daily chart depicts the balance between buyers/sellers, suggesting the major consolidating in a range.
The USD/JPY is recording solid gains during the North American session, amidst light liquidity trading conditions, due to Wall Street being closed in observance of the US Labor day. The USD/JPY is trading at 140.53, at the time of writing, after refreshing 24-year highs on Friday at 140.80.
USD/JPY Price Analysis: Technical outlook
From a weekly chart perspective, the USD/JPY is still upward biased, but overbought conditions begin to be present. After refreshing YTD highs during May, July, and September, peaking at 131.34, 139.38, and 140.80, respectively, the Relative Strength Index (RSI) reached 88, 84, and 72. Hence, buying pressure might be easing due to traders refraining from opening fresh longs, alongside profit taking.
The USD/JPY daily chart portrays the pair breaking above the rising-wedge trendline, invalidating the bearish bias of the pattern. However, USD/JPY Friday’s price action formed a doji, meaning buyers and sellers in balance, spurred by rumors of Japanese authorities intervening in the Forex Market due to the perceived yen weakness. Therefore, the major might consolidate in the 139.00-140.00 range.
The USD/JPY first resistance would be YTD high at 140.80. Break above will expose the 141.00 psychological level before testing 24-year highs at 147.67. On the flip side, the USD/JPY first support would be the 140.00 mark. Once cleared, the next support would be the September 1 daily low at 138.83, followed by the 138.00 mark.
USD/JPY Key Technical Levels
-
17:41
RBA: Data outcomes do not support the central bank pausing this year – TDS
On Tuesday, the Reserve Bank of Australia (RBA) will announce its decision on monetary policy. Market participants expect a 50 basis points rate hike. Analysts at TD Securities point out business confidence remains buoyant, capex plans are firm, labour market/capacity utilisation remains tight, the consumer continues to spend and price pressures are 'widespread'. They consider a rate hike from the RBA of less than 50bps would represent a loosening of financial conditions.
Key Quotes:
“The data outcomes do not support the RBA pausing this year. Of most interest is how the Bank will telegraph ongoing hikes but signal a step down in the pace of hikes from October to 25bps increments. Reiterating the Bank is not on a 'pre-set path' would meet this objective.”
“A 50bps hike is consistent with prior RBA hikes and in line with firm data outcomes. Of more importance is the language accompanying a 50bps hike. Does the RBA strengthen its language/resolve to get on top of inflation by removing 'even keel' or 'path to achieve this balance is a narrow one and clouded in uncertainty'. Or does the RBA signal a more prolonged hiking cycle but highlights a step down in the pace of rate hikes? We favour the 2nd option.”
-
17:33
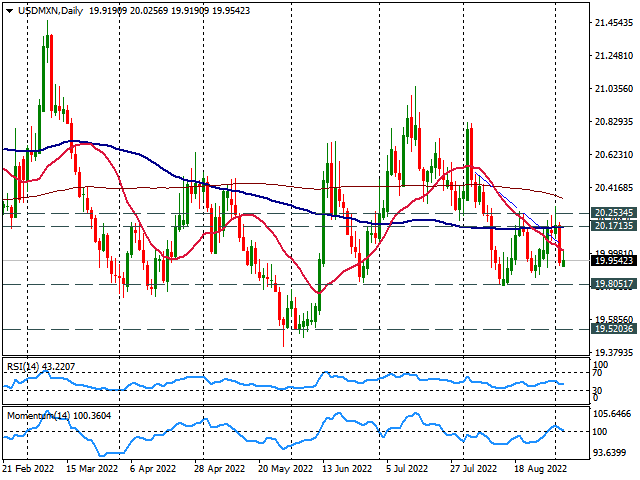
USD/MXN Price Analysis: Looking at 19.80 while under 20.00
- USD/MXN with bearish bias in the very short-term, in range.
- Next support below 19.90 at 19.80.
- Critical resistance around 20.20/25.
The USD/MXN is rising modestly on Monday as it remains trading near the weekly low it hit at the beginning of the week at 19.91. Momentum and technical indicators point to the downside in the very short-term. A break under 19.90 would expose the next support area at 19.80.
Since mid-August USD/MXN is moving sideways in a range between 19.80 and 20.25. The 19.80 should hold if tested in the near-term, offering a rebound. A firm break lower would weaken the dollar further, exposing 19.72.
On the upside, the immediate resistance stands 20.02 (20-day Simple Moving Average) followed by 20.17. A daily close above 20.25, would change the short-term bias to neutral/bullish and should open the doors to more gains, targeting initially the 20.45 zone.
USD/MXN daily chart
-
16:41
BoE's Mann: Gradual pace of rate hikes has not tempered expectations enough
Bank of England (BoE) policymaker Catherine Mann said on Monday that the gradual pace of increase in bank rate has not tempered expectations enough, as reported by Reuters.
Additional takeaways
"Fast and forceful tightening potentially by a hold or reversal is superior to a gradualist approach."
"Long-term expectation metrics apparently remain anchored and consistent with the 2% target."
"Credibility of monetary policy is intact."
"Drift in medium-term expectations is already apparent in the data."
"We cannot be complacent in the face of the short-term spikes and medium-term drift."
"Acting more forcefully now is designed to avoid depending on a deeper and longer contraction."
"If current wholesale energy prices are allowed to be passed on to households and firms, this will lead to enormous pain for millions."
"Monetary policy is a relatively blunt instrument and is ill-equipped and not intended to deal with large relative price movements like the one we’re seeing currently."
"Ratcheting-up from short-term to medium-term expectations has been apparent for a while, and could portend a persistent drift higher."
"This has the potential to cement expectations inconsistent with the 2% target which would necessitate a persistently tighter stance of monetary policy."
"We will not tolerate a persistent inflation overshoot and will stay vigilant even when headline rates start to come down."
"The more we control medium-term inflation expectations now, the less tight for long monetary policy will need to be."
Market reaction
GBP/USD showed no immediate reaction to these remarks and was last seen trading flat on the day at 1.1505.
-
16:38
GBP/JPY rises toward 162.00 from two-week lows, Truss to become UK PM
- Liz Truss wins Conservative Party leadership battle.
- UK data: S&P Global Service PMI for August revised lower.
- Yen remains under pressure, despite risk aversion.
The GBP/JPY cross turned positive for the day and erased losses, after recovering from the lowest level in almost three weeks. It bottomed at the beginning of the week at 160.63 and recently hit a fresh daily high at 161.91.
The recovery of the cross took place as GBP/USD moved off multi-year lows and as USD/JPP climbed back to the 140.50 area. The yen remains weak even as European stocks drop sharply.
The pound was unaffected following the result of the Tory race that offered no surprises. Liz Truss will become the next prime minister. “I will deliver a bold plan to cut taxes and grow our economy”, said Truss in brief acceptance speech. Regarding the energy crisis she said she will deal “with people’s energy bills but also dealing with the long-term issues we have on energy supply.”
Truss will become PM on Tuesday. On Wednesday, Bank of England’s official will testify to a Treasury Committee at the Parliament. Over the next days, market participants will keep an eye on Truss’s comments on BoE’s mandate.
On economic data, the UK S&P Global Service PMI came in at 50.9 in August, below the 52.5 of the flash estimate.
Technically, GBP/JPY is moving sideways around 161.50 since mid-August. A close below 161.00 should point to more losses while on the upside, a break above 162.50 would increase the odds of a more sustainable recovery targeting 164.00 initially.
Technical levels
-
16:33
Silver Price Forecast: XAG/USD steadily around $18.00 amid sour sentiment
- Silver price begins the week on the right foot, up by 0.30%.
- Europe’s energy crises worsen as G7 ministers put a lid on Russian oil prices while Russia halts gas exports.
- Real yields in the US remain above the 0.70% threshold but almost ten bps off the day’s highs.
Silver price regained some composture advancing more than 0.50% on Monday, despite thin liquidity conditions, with US markets closed for Labor Day. Meanwhile, the common bloc energy crisis worsens with Gazprom halting gas deliveries to Europe as retaliation after a G7 meeting put a cap on Russian oil. At the time of writing, the XAG/USD is trading at $18.08, above its opening price.
Global equities are trading in the red, reflecting the market deterioration. Last week US employment data, with Nonfarm Payrolls exceeding expectations, downward reviews, and the unemployment rate increasing by 3.7%, diminished the odds of an aggressive Federal Reserve.
The US Dollar index refreshed 20-year highs at around $110.27, sending the EUR/USD tumbling below the 0.9900 figure, though the white metal edged lower but above its opening price. The US 10-year TIPS, a proxy for real yields, which measures the 10-year nominal yield minus inflation expectations, remains positive but off the highs of the day around 0.827%, at 0.729%, a tailwind for XAG/USD.
What to watch
The US docket will feature Fed speakers with Cleveland President Loretta Mester on Wednesday and Jerome Powell’s speech on Thursday. Also, unemployment claims for the week ending on September 2, alongside the S&P Global and ISM Services PMI, would be eyed by investors, looking for clues of how the US economy fares.
Silver Price Forecast (XAG/USD): Technical outlook
XAG/USD remains neutral to downward biased, despite the recent jump off YTD lows at $17.56. Nevertheless, a break above the July 14 low at $18.14 is needed to open the door to a re-test of the confluence of the 20-50-DMAs, at around $19.25-40. Otherwise, expect a resumption to the downside and another attempt to break below the YTD low on its way towards June 2020 lows at $16.95.

-
16:15
French President Marcon: France in favour of common gas buying at European level
Following his phone call with German Chancellor Olaf Scholz, French President Emmanuel Macron noted that are ahead of the gas storage targets, having 92-93% of the storage capacity already filled, as reported by Reuters.
Additional takeaways
"Germany needs our gas and we need power from the rest of Europe, notably Germany.",
"On energy prices, measures are at first-hand national but there must also be measures at a European level."
"France is in favour of common gas buying at a European level."
"We need to act against speculation on energy prices at an EU level."
Market reaction
Markets paid little to no attention to these comments and EUR/USD was last seen losing 0.3% on the day at 0.9920.
-
16:03
Germany to keep two nuclear power plants as emergency reserve – Spiegel
According to Der Spiegel, German Economy Minister Robert Habeck wants to keep two nuclear power stations as emergency reserves until mid-April, 2023, as reported by Reuters.
Earlier in the day, German gas importer Uniper's CEO Klaus-Dieter Maubach told Reuters that Germany might eventually be forced to consider gas rationing following Russia's latest decision to halt gas flows via Nord Stream.
Market reaction
This headline failed to help the shared currency find demand and EUR/USD was last seen losing 0.27% on a daily basis at 0.9924.
-
15:52
OPEC+ decision sends message to market that group will intervene to bring stability – Reuters
OPEC+ decision to lower the oil output target by 100,000 barrels per day in October sends a message to the market that the group will intervene to bring stability, Reuters reported on Monday, citing a Gulf OPEC source.
"Opec+ members have trusted the chairman - Saudi energy minister - to intervene whenever necessary to stabilize markets," the source told Reuters.
Market reaction
Crude oil prices continue to rise despite the Labor Day holiday in the US. As of writing, the barrel of West Texas Intermediate (WTI) was up 3.5% on a daily basis at $90.10.
-
15:23
Germany: Gas rationing will occur in the winter if supplies are not resumed soon – Commerzbank
Russia will not be supplying natural gas to Germany until further notice. Can Germany close the natural gas gap? Strategists at Commerzbank try to give an answer.
Rationing threatens in winter
“In the best-case scenario (the 80 TWh gas gap) and a mild winter, supply could just about be met through conservation and stock withdrawals, even without the resumption of Russian supplies.”
“A gas gap of 245 TWh would require savings of 195 TWh in the next 12 months. Although extremely high prices provide a significant incentive for savings, this does not appear achievable. Rationing is probably inevitable in this case. In that case, the recession we already expect would be much more severe.”
-
14:47
Gold Price Forecast: XAU/USD remains confined in a range, upside potential seems limited
- Gold struggles to gain any meaningful traction and oscillates in a range on Monday.
- A modest USD pullback from a two-decade high offers some support to the metal.
- Expectations for aggressive tightening by major central banks might continue to cap.
Gold lacks any firm directional bias and seesaws between tepid gains/minor losses through the early North American session on Monday. The XAU/USD, so far, has managed to hold above the $1,700 round-figure mark and remains below Friday's swing high touched in the aftermath of the mixed US monthly jobs report.
The US dollar trims a part of its intraday gains to a fresh two-decade high and offers some support to the dollar-denominated gold. A modest USD pullback could be solely attributed to some profit-taking amid slightly overbought conditions and relatively thin trading volumes on the back of the Labor Day holiday in the US. Apart from this, recession fears assist the safe-haven precious metal to attract some dip-buying near the $1,707 region.
That said, the prospects for a further policy tightening by major central banks to tame inflation act as a headwind for the non-yielding yellow metal. In fact, the Reserve Bank of Australia is anticipated to raise the cash rate at its meeting on Tuesday. Furthermore, the markets have been betting on a bumper rate hike by the European Central Bank on Thursday. The Bank of England is also expected to raise interest rates by at least 50 bps.
Adding to this, the markets have been pricing in a supersized 75 bps rate hike by the Federal Reserve at its upcoming policy meeting on September 20-21. This remains supportive of elevated US Treasury bond yields and favours the USD bulls. The fundamental backdrop should hold back traders from placing bullish bets around gold, warranting caution before positioning for an extension of last week's bounce from the vicinity of the YTD low.
Technical levels to watch
-
14:41
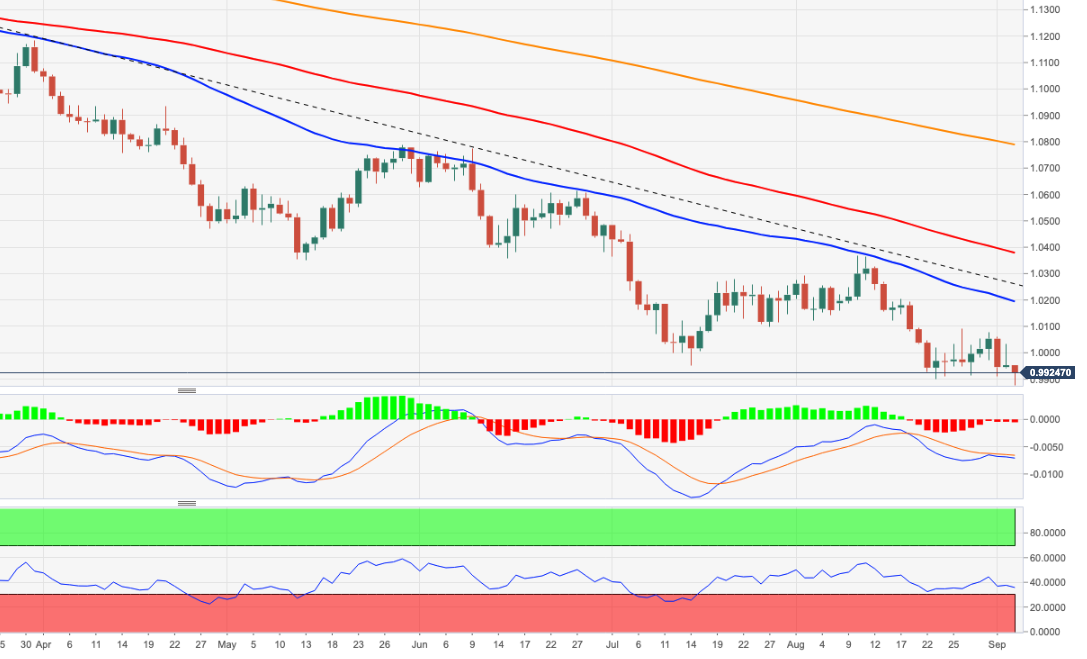
EUR/USD Price Analysis: Extra losses still favoured
- EUR/USD accelerates losses and drops to new cycle lows.
- Below the YTD low comes the December 2002 low at 0.9859.
EUR/USD resumes the leg lower and breaks below the 0.9900 level to reach new 2-decade lows in the 0.9880/75 band on Monday.
The continuation of the downtrend could not be ruled out just yet, as the daily RSI around 36 still allows for some weakness prior to reach the oversold territory.
Against that, the next support of note comes at 0.9859 (December 2002 low) seconded by 0.9685 (October 2002 low).
In the longer run, the pair’s bearish view is expected to prevail as long as it trades below the 200-day SMA at 1.0787.
EUR/USD daily chart
-
14:24
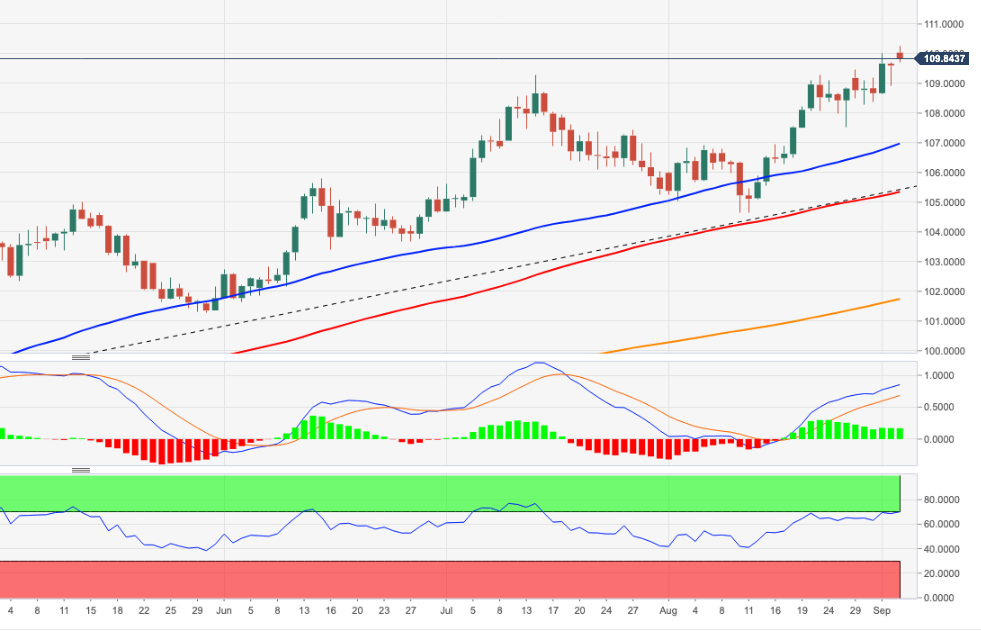
US Dollar Index Price Analysis: Overbought levels could spark a corrective move
- DXY climbs to new highs near 110.30 on Monday.
- A technical correction should not be ruled out.
DXY extends the march north to the vicinity of 110.30, where it seems to have met some initial resistance.
The short-term bullish view in the dollar remains well in place for the time being and propped up by the 7-month support line, today around 105.70.
However, the current overbought conditions of the index could trigger some corrective downside, which should be seen as a buying opportunity.
Still on the upside, the surpass of the recent top could face the next barrier at the weekly highs at 111.90 (June 6 2002) and 113.35 (May 24 2002).
Looking at the long-term scenario, the bullish view in the dollar remains in place while above the 200-day SMA at 101.06.
DXY daily chart
-
14:06
USD/CNY: Forex RRR cut unlikely to stem the yuan's weakening trend – ING
The People's Bank of China cut the required reserve ratio of foreign currency deposits that banks need to keep at the central bank. Nonetheless, the yuan is set to keep weakening, economists at ING report.
Cutting FX RRR won't strengthen yuan
“The PBoC cut the forex RRR again this year – this time to 6% from 8% effective 15 September 2022. We believe that this RRR cut will not change the yuan weakening trend. This is because this round of yuan weakness comes from a strong US dollar and the expectation of more Federal Reserve hikes at the coming meetings.”
“Our USD/CNY forecast is 7.05 by the end of 3Q22.”
“Less aggressive rate hike talk in the market nearer the end of the year might help the yuan to strengthen slightly. As such, we expect USD/CNY to fall to 6.85 by the end of the year.”
-
13:55
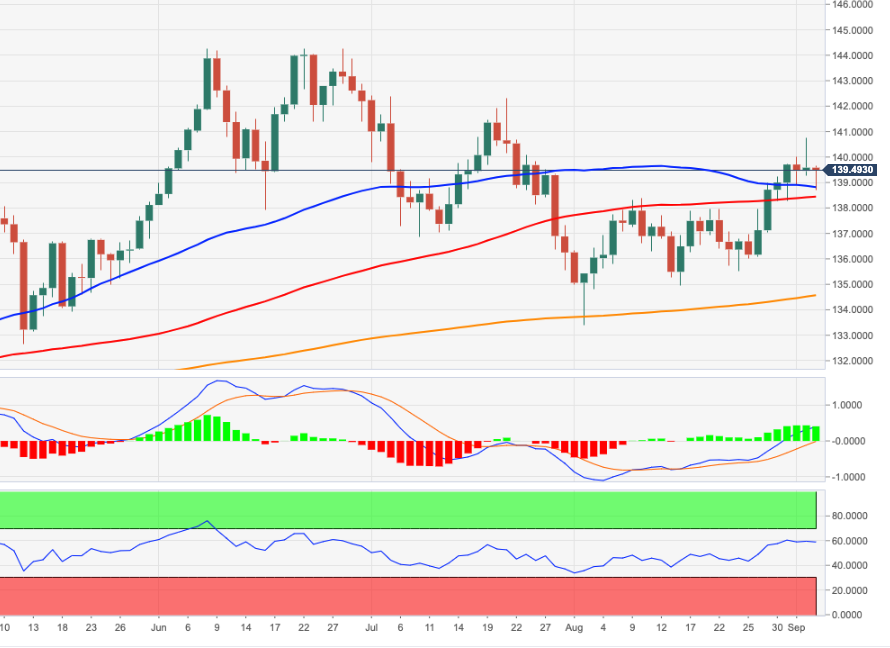
EUR/JPY Price Analysis: The 142.30 region emerges as the next target
- EUR/JPY adds to Friday’s small gains below 140.00.
- The next hurdle of note turns up at the 142.30 zone.
EUR/JPY alternates gains with losses around 139.00 after bottoming out in earlier lows near 138.70 on Monday.
Extra gains in the cross are now favoured once it clears the recent high at 140.74 (September 2). Beyond this level, another visit of the weekly top at 142.32 (July 21) should re-emerge on the horizon prior to the 2022 peak at 144.27 (June 28).
While above the 200-day SMA at 134.54, the prospects for the pair should remain constructive.
EUR/JPY daily chart
-
13:42
GBP/USD struggles to register any meaningful recovery, hangs near two-and-half-year low
- GBP/USD attracts some intraday buying on Monday, though lacks follow-through.
- A modest USD pullback from a two-decade high offers some support to the major.
- The fundamental/technical backdrop still seems tilted in favour of bearish traders.
The GBP/USD pair stages a modest bounce from its lowest level since March 2020, around the 1.1445 area touched earlier this Monday. Spot prices hit a fresh daily high during the mid-European session, albeit seemed to struggle to capitalize on the move or find acceptance above the 1.1500 psychological mark.
The US dollar trims a part of its early gains to a fresh two-decade high and turns out to be a key factor offering some support to the GBP/USD pair. That said, expectations that the Fed will stick to its aggressive policy tightening path act as a tailwind for the greenback. Apart from this, a bleak outlook for the UK economy continue to undermine the British pound and kept a lid on any meaningful gains for the major.
It is worth recalling that the Bank of England had warned last month that the UK economy will enter a prolonged recession during the last quarter of the year. Adding to this, the British Chambers of Commerce (BCC) downgraded its forecast and now expects the UK economy to record three consecutive quarters of contraction. This, to a larger extent, overshadows the prospects for further interest rate hikes by the UK central bank.
On the UK political front, Liz Truss won the Conservative Party leadership race to become the next British Prime Minister. The news, however, did little to impress bullish traders, suggesting that the path of least resistance for the GBP/USD pair is to the downside. That said, relatively lighter trading volumes on the back of the Labor Day holiday in the US might hold back traders from placing aggressive bearish bets and limit losses.
Nevertheless, the fundamental backdrop still supports prospects for an extension of a three-week-old downward trajectory. Even from a technical perspective, acceptance below the 1.1500 mark and the GBP/USD pair's inability to attract any buyers suggests that the near-term selling bias is still far from being over. Hence, any attempted recovery move could be seen as a selling opportunity and runs the risk of fizzling out rather quickly.
Technical levels to watch
-
13:35
OPEC+ agrees to lower oil output targets by 100K bpd in October – Reuters
Reuters reported on Monday that the Organization of the Petroleum Exporting Countries and allies including Russia, known collectively as OPEC+, have agreed to lower oil output targets by 100,000 barrels per day in October.
The group is scheduled to meet again on October 5 and the chairman is reportedly considering calling for an OPEC and non-OPEC ministerial meeting anytime to address market developments, if necessary.
Market reaction
Crude oil prices cling to strong daily gains with the barrel of West Texas Intermediate (WTI) rising more than 3% on the day at $89.90.
-
13:20
USD/MYR: Strong resistance at 4.4980 appears out of reach – UOB
The continuation of the uptrend in USD/MYR seems favoured for the time being, but a visit to the solid hurdle at 4.4980 seems not favoured, suggests FX Strategist Quek Ser Leang at UOB Group’s Global Economics & Markets Research.
Key Quotes
“We highlighted last Monday (29 Aug, spot at 4.4800) that ‘the bias for USD/MYR is on the upside but the major resistance at 4.4980 is likely out of reach’. USD/MYR subsequently rose to 4.4890 before trading sideways.”
“While upward momentum has not improved, there is room for USD/MYR to edge higher. However, 4.4980 is still likely out of reach. On the downside, support is at 4.4750 followed by the major level at 4.4650.”
-
13:16
USD/TRY resumes the upside and approaches the all-time high
- USD/TRY fades Friday’s pullback and rises above 18.22.
- Türkiye’s Inflation Rate came at 80.21% YoY in August.
- Türkiye’s Producer Prices rose 143.75% YoY during last month.
The Turkish lira resumes its usual depreciation vs. the greenback and pushes USD/TRY back above the 18.22 level on Monday.
USD/TRY keeps targeting the 18.25 region and above
USD/TRY advances modestly above the 18.20 level at the beginning of the week, although keeping the prevailing multi-week consolidative phase well in place for yet another session.
The resumption of the bearish mood in the lira came after inflation figures in Türkiye rose 80.21% YoY in August, the highest pace since September 1998. On a monthly basis, consumer prices rose 1.46%.
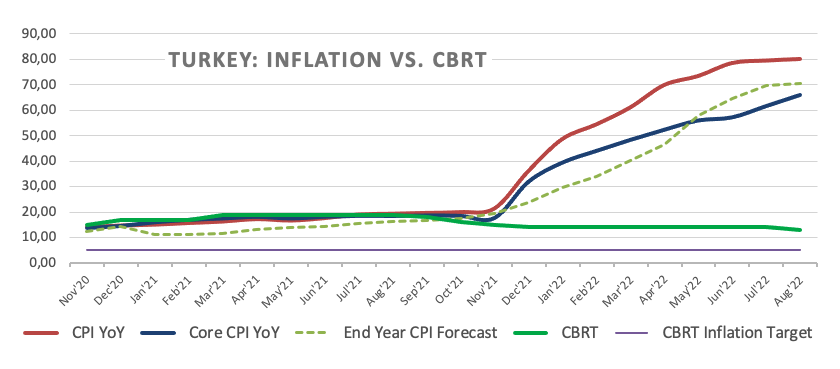
In addition, Producer Prices rose 2.41% inter-month and 143.75% from a year earlier.
Over the weekend, the Medium Term Program updated the country’s economic targets for the 2023-2025 period and now sees inflation rising 65% in 2022, 24.9% next year, 13.8% in 2024 and 9.9% in 2025.
What to look for around TRY
USD/TRY flirted with all-time highs around 18.25 last Friday, keeping the uptrend well in place and entering the ninth consecutive month in the positive territory.
In the meantime, price action around the Turkish lira is expected to keep gyrating around the performance of energy and commodity prices - which are directly correlated to developments from the war in Ukraine - the broad risk appetite trends and the Fed’s rate path in the next months.
Extra risks facing the Turkish currency also come from the domestic backyard, as inflation gives no signs of abating (despite rising less than forecast in July), real interest rates remain entrenched well in negative territory and the political pressure to keep the CBRT biased towards low interest rates remains omnipresent.
In addition, there seems to be no other immediate option to attract foreign currency other than via tourism revenue, in a context where official figures for the country’s FX reserves remain surrounded by increasing skepticism.
Key events in Türkiye this week: Inflation Rate, Producer Prices (Monday).
Eminent issues on the back boiler: FX intervention by the CBRT. Progress of the government’s scheme oriented to support the lira via protected time deposits. Constant government pressure on the CBRT vs. bank’s credibility/independence. Bouts of geopolitical concerns. Structural reforms. Presidential/Parliamentary elections in June 23.
USD/TRY key levels
So far, the pair is gaining 0.39% at 18.2233 and faces the immediate target at 18.2574 (2022 high September 2) seconded by 18.2582 (all-time high December 20) and then 19.00 (round level). On the other hand, a breach of 17.7586 (monthly low August 9) would pave the way for 17.6272 (55-day SMA) and finally 17.1903 (weekly low July 15).
-
13:05
OPEC+ JMMC recommends cutting oil output targets by 100K bpd in October – Reuters
Joint Ministerial Monitoring Committee (JMMC) of the Organization of the Petroleum Exporting Countries and allies including Russia, known collectively as OPEC+, has recommended cutting oil output targets by 100,000 barrels per day in October, Reuters reported on Monday, citing sources.
Market reaction
Crude oil prices edged higher on this headline. As of writing, the barrel of West Texas Intermediate (WTI) was trading at $89.90, where it was up 3.3% on a daily basis. Similarly, the barrel of Brent was rising 3.4% on the day at $96.50.
-
12:55
EUR/USD is unlikely to stage a steady rebound
EUR/USD has steadied above 0.9900 following earlier decline. However, the pair remains vulnerable, FXStreet’s Eren Sengezer reports.
EUR/USD has more room on the downside
“Although the trading action is likely to remain muted in the second half of the day, the euro is unlikely to stage a steady rebound.”
“0.9900 (psychological level, static level) aligns as first support on the downside. With a drop below that level, EUR/USD could extend its slide toward 0.9875 (daily low) and 0.9800 (psychological level).”
“On the upside, first resistance is located at 0.9950 (static level) ahead of 0.9975 (20-period SMA, 50-period SMA) and 1.0000 (psychological level, Fibonacci 32.6% retracement of the latest downtrend).”
-
12:40
UK: Liz Truss wins contest to become the next UK Prime Minister
Liz Truss won the Conservative Party leadership race to become the next British Prime Minister.
"I will deal with long-term issues on energy supply," Liz Truss said in her acceptance speech and noted that she will deal with the crisis in households' energy bills.
Additional takeaways
"I will govern as a conservative."
"I intend to deliver what we promised voters in 2019."
"I will deliver a bold plan to cut taxes and grow our economy."
"We will deliver a great victory for the conservative party in 2024."
Market reaction
The UK's FTSE 100 Index showed no immediate reaction to these comments and was last seen losing 0.6% on a daily basis. Meanwhile, the GBP/USD pair continues to fluctuate at around 1.1500 during the European trading hours.
-
12:37
Further upside not ruled out in USD/IDR – UOB
USD/IDR looks poised to extend the uptrend although it faces a tough barrier around 14,990, according to FX Strategist Quek Ser Leang at UOB Group’s Global Economics & Markets Research.
Key Quotes
“We expected USD/IDR to break the declining trend-line resistance last week. Our view was not wrong as USD/IDR edged above the trendline last Friday (02 Sep) before rising sharply upon opening today. Rapid improvement in upward momentum suggests USD/IDR is likely to advance further.”
“For this week, USD/IDR is unlikely to challenge the resistance at 14,990. On the downside, support is at 14,840 followed by 14,790.”
-
12:12
EU Commission Spokesman: Russia is weaponizing its gas supplies to Europe
"If there was a technical problem which was impeding supplies via Nord Stream 1, there would be a possibility, if there was willingness, to deliver gas to Europe through other pipelines," a European Commission spokesperson said on Monday, as reported by Reuters.
"That's something we're not seeing happening," the spokesman added and noted that this was demonstrating the weaponization of energy by Russia.
Market reaction
These comments failed to trigger a noticeable market reaction. As of writing, the EUR/USD pair was down 0.25% on a daily basis at 0.9927.
-
12:01
Mexico Consumer Confidence s.a came in at 40.9, below expectations (42.5) in August
-
12:01
Mexico Consumer Confidence: 40.3 (August) vs previous 41.3
-
11:47
USD/CAD pares intraday gains, retreats to mid-1.3100s amid rising oil prices
- USD/CAD trims a part of its intraday gains, though the downside remains cushioned.
- Rising oil prices underpin the loonie and act as a headwind amid a modest USD pullback.
- Aggressive Fed rate hike bets favour the USD bulls and should lend support to the pair.
The USD/CAD pair builds on Friday's late rebound from the 1.3075 area and kicks off the new week on a positive note. The pair, however, struggles to capitalize on the move and trims a part of its strong intraday gains, retreating to mid-1.3100s during the first half of the European session.
Expectations that OPEC+ producers will cut production to support prices at a meeting later this Monday push crude oil prices higher. This, in turn, boosts the commodity-linked loonie and acts as a headwind for the USD/CAD pair. Apart from this, a modest US dollar pullback from a fresh two-decade high attracts some sellers near the 1.3175 region.
Signs of recovery in the risk sentiment - as depicted by a generally positive tone around the equity markets - prompt some profit-taking around the safe-haven greenback. That said, worries about a deeper global economic downturn should cap any optimism. This, along with hawkish Fed expectations, should help limit any meaningful USD corrective slide.
Despite Friday's mixed US monthly jobs report, investors seem convinced that the Fed will stick to its aggressive policy tightening path. In fact, the markets are currently pricing in a supersized 75 bps rate hike at the upcoming FOMC meeting on September 20-21. This remains supportive of elevated US Treasury bond yields and favours the USD bulls.
The fundamental backdrop suggests that the path of least resistance for the USD/CAD pair is to the upside and any meaningful pullback might still be seen as a buying opportunity. Traders, however, might refrain from placing aggressive bets ahead of the OPEC meeting and amid relatively thin trading volumes on the back of the Labor Day holiday in the US.
Technical levels to watch
-
11:29
RBA could raise the OCR by 40 bps – UOB
Economist at UOB Group Lee Sue Ann suggest the RBA could hike the OCR by 40 bps at its meeting on Tuesday.
Key Quotes
“Following the 50bps hike in Aug, the RBA is expected to continue pushing interest rates higher. We believe the RBA can afford to raise the OCR by a further 40bps to 2.25% at the Sep meeting, given the extremely tight labour market and soaring inflation.”
“From there, we believe the RBA will remain data dependent, monitoring the impact of higher interest rates, particularly on household spending, inflation, and wages.”
-
10:46
AUD/USD hangs near its lowest level since mid-July, focus shifts to RBA decision on Tuesday
- AUD/USD is seen oscillating in a narrow trading range below the 0.6800 mark on Monday.
- Bets for aggressive Fed rate hikes lift the USD to a two-decade high and act as a headwind.
- Relatively thin trading volumes limit the downside ahead of the RBA meeting on Tuesday.
The AUD/USD pair struggles to gain any meaningful traction on Monday and oscillates in a narrow trading band through the first half of the European session. The pair is currently placed around the 0.6780 region, just a few pips above its lowest level since mid-July touched on Friday.
The US dollar hits a fresh two-decade high on the first day of a new week and turns out to be a key factor acting as a headwind for the AUD/USD pair. Despite Friday's mixed US jobs report, expectations that the Fed will stick to its aggressive policy tightening path continue to underpin the greenback. In fact, the markets are pricing in a greater chance of a supersized 75 bps rate hike at the next FOMC meeting on September 20-21.
That said, the better-than-expected Chinese service sector activity report, along with signs of stability in the equity markets, offers some support to the risk-sensitive aussie. Apart from this, relatively thin liquidity conditions on the back of the Labor Day holiday in the US help limit the downside for the AUD/USD pair. Investors also seem reluctant ahead of the central bank event risk - the Reserve Bank of Australia (RBA) meeting.
The RBA is scheduled to announce its decision during the Asian session on Tuesday and is widely expected to continue to raise the cash rate gains. Investors, however, remain divided over the size of the rate hike. Hence, the focus will be on the accompanying monetary policy statement, which will be looked upon for clues if the Australian central bank will continue to normalise rates amid worries about a deeper global economic downturn.
This, in turn, will play a key role in influencing the Australian dollar and help determine the near-term trajectory for the AUD/USD pair. In the meantime, spot prices are more likely to prolong the range-bound price action. The fundamental backdrop, however, favours bearish traders, though a sustained break below the 0.6775-0.6770 support is needed to confirm the negative bias.
Technical levels to watch
-
10:39
USD/THB could revisit the 36.95 major hurdle – UOB
FX Strategist Quek Ser Leang at UOB Group’s Global Economics & Markets Research suggested further upside lies ahead for USD/THB.
Key Quotes
“Last Monday (29 Aug, spot at 36.42), we highlighted that ‘the rapid improvement in momentum suggests USD/THB could strengthen further’. However, we were of the view ‘July’s high at 36.95 is unlikely to come into the picture’. Our view turned out to correct as USD/THB rose to a high of 35.85 last Friday (02 Sep). Shorter-term conditions are deeply overbought but upward momentum remains strong.”
“For this week, USD/THB could rise above 36.95 but in view of the overbought conditions, it is unlikely able to maintain a foothold above this major resistance level. The next resistance at 37.15 is unlikely to come into the picture. Support is at 36.60 followed by the rising trend-line support, currently at 36.31. The rising trend-line support is unlikely to come under threat, at least for this week.”
-
10:24
Kremlin on Nord Stream shutdown: Gas transportation problems arose due to sanctions by western countries
Speaking on the Nord Stream 1 pipeline shutdown, the Kremlin said on Monday that “the only turbine left is malfunctioning, that leads to stoppages.”
“Gas transportation problems arose because of sanctions introduced by western countries,” Kremlin added.
Market reaction
EUR/USD shrugs off the Kremlin statement, as it is trading at 0.9912, down 0.36% on the day, as of writing.
-
10:15
PBOC: Will cut FX reserve requirement ratio to help limit yuan weakness
The People's Bank of China (PBOC) said in an online statement on Monday that it would cut the foreign exchange reserve requirement ratio (RRR) by 200 basis points (bps) to 6% from 8% beginning September 15, per Reuters.
The central bank said that the move is aimed at slowing the pace of the yuan's recent depreciation and improving the forex capital capacity of financial institutions.
Market reaction
USD/CNY is largely unchanged on the above headlines, keeping its range around 6.9320, up 0.48% on the day.
-
10:01
Eurozone Retail Sales drop 0.9% YoY in July vs. -0.7% expected
- Eurozone Retail Sales stood at 0.3% MoM in July vs. 0.4% expected.
- Retail Sales in the bloc arrived at -0.9% YoY in July vs. -0.7% expected.
Eurozone’s Retail Sales rose by 0.3% MoM in July versus 0.4% expected and -1.0% last, the official figures released by Eurostat showed on Monday.
On an annualized basis, the bloc’s Retail Sales came in at -0.9% in July versus -3.2% recorded in June and -0.7% estimated.
FX implications
The euro is defending 0.9900 on the downbeat Eurozone data. At the time of writing, the major is trading at 0.9907, down 0.43% on the day.
About Eurozone Retail Sales
The Retail Sales released by Eurostat are a measure of changes in sales of the Eurozone retail sector. It shows the performance of the retail sector in the short term. Percent changes reflect the rate of changes of such sales. The changes are widely followed as an indicator of consumer spending. Usually, positive economic growth anticipates "Bullish" for the EUR, while a low reading is seen as negative, or bearish, for the EUR.
-
10:00
European Monetary Union Retail Sales (MoM) below forecasts (0.4%) in July: Actual (0.3%)
-
10:00
European Monetary Union Retail Sales (YoY) below expectations (-0.7%) in July: Actual (-0.9%)
-
09:56
USD/JPY sticks to gains near mid-140.00s, just below 24-year peak amid stronger USD
- USD/JPY catches fresh bids on Monday and inches back closer to a 24-year peak.
- A broad-based USD strength and the Fed-BoJ policy divergence remain supportive.
- Bulls seem reluctant amid thin trading volumes on the back of a holiday in the US.
The USD/JPY pair attracts fresh buying on the first day of a new week and maintains its bid tone through the first half of the European session. The pair is currently around the 140.50-140.55 region, just a few pips below a 24-year peak touched on Friday.
The US dollar hits a new two-decade high and turns out to be a key factor acting as a tailwind for the USD/JPY pair. Despite the mixed US jobs report released on Friday, firming expectations that the Fed will continue with its aggressive policy tightening remains supportive of the underlying strong bullish sentiment surrounding the USD.
In fact, the current market pricing suggests a greater chance of a supersized 75 bps Fed rate hike at the September meeting. In contrast, the Bank of Japan remains committed to its ultra-loose monetary policy stance. The resultant Fed-BoJ policy divergence continues to undermine the Japanese yen and offers additional support to the USD/JPY pair.
Furthermore, signs of stability in the equity markets could further dent demand for the safe-haven JPY and support prospects for an extension of over a three-week-old uptrend. Investors, however, seem reluctant amid relatively thin liquidity conditions on the back of the Labor Day holiday in the US and slightly overbought RSI on the daily chart.
Nevertheless, the fundamental backdrop remains tilted firmly in favour of bullish traders. This, in turn, suggests that any meaningful pullback could be seen as a buying opportunity and is more likely to remain limited.
Technical levels to watch
-
09:53
Eurozone Sentix Investor Confidence deteriorates to -31.8 in Sept vs. -27.5 expected
The Eurozone Sentix Investor Confidence index came in at -31.8 in September from -25.2 in August vs. -27.5 expected. The index snapped its recovery amid mounting recession fears.
The current situation in the eurozone dropped to -31.8 points in September from -25.2 in August.
An expectations index tumbled to -37.0, which was the lowest since December 2008.
Key takeaways
“Never before in more than 20 years of history, with the exception of the financial crisis in 2008, have investors' assessments of the eurozone economy been so weak - and at the same time expectations have been so low.”
"At the moment, there are no signs of monetary aid similar to the central bank response after the economic collapse caused by the coronavirus pandemic in 2020.”
EUR/USD reaction
The shared currency fails to show any reaction to the Eurozone Sentix data. EUR/USD is trading at 0.9911, down 0.39% on the day.
-
09:44
GBP/USD: Sellers to dominate the action unless 1.1550 turns into support
GBP/USD has managed to erase a large portion of its daily losses after having dropped to its weakest level since March 2020. But bearish bias stays intact below 1.1550, FXStreet’s Eren Sengezer reports.
Sellers are likely to retain control as long as 1.1550 resistance holds
“Liz Truss is widely expected to win the Conservative Party leadership race. The market action is likely to be muted because participants want to see what the new PM will do to help households amid surging energy costs. Moreover, Brexit remains an unresolved issue that is likely to make it difficult for the pound to stage a decisive rebound.”
“In case cable stages a technical correction, 1.1500 (psychological level, static level) forms interim support before 1.1550 (static level, the upper limit of the descending regression channel, 20-period SMA). If the latter turns into support, additional recovery gains toward 1.1600 (static level, psychological level) could be witnessed.”
“On the downside, 1.1450 (daily low) aligns as next support ahead of 1.1400 (psychological level, lower limit of the descending channel).”
-
09:30
United Kingdom S&P Global/CIPS Services PMI below expectations (52.5) in August: Actual (50.9)
-
09:30
European Monetary Union Sentix Investor Confidence below forecasts (-27.5) in September: Actual (-31.8)
-
09:30
United Kingdom S&P Global/CIPS Composite PMI registered at 49.6, below expectations (50.9) in August
-
09:25
GBP/USD remains on the defensive below 1.1500 mark ahead of UK PM results
- GBP/USD drops to its lowest level since March 2020 and is pressured by a combination of factors.
- The UK’s gloomy economic outlook undermines the British pound amid a broad-based USD strength.
- Traders await the announcement of the UK Prime Minister amid relatively thin liquidity conditions.
The GBP/USD pair kicks off the new week on a weaker note and hits a fresh low since March 2020 during the early European session. Spot prices, however, manage to rebound a few pips, though remain on the defensive below the 1.1500 psychological mark.
The British pound continues to be weighed down by a bleak outlook for the UK economy and uncertainty over the economic policies of the next British Prime Minister. The recent surge in energy prices has raised concerns over the UK cost of living crisis and intensified fears of a deeper economic downturn. The worries were further fueled by the latest forecast from the British Chambers of Commerce (BCC), which expects the UK economy to record three consecutive quarters of contraction this year.
Apart from this, the underlying strong bullish sentiment surrounding the US dollar keeps exerting some downward pressure on the GBP/USD pair. As investors look past Friday's mixed US jobs report, firming expectations that the Fed will stick to its aggressive policy tightening path to tame inflation lifts the USD to a fresh two-decade high. In fact, the markets are currently pricing in a greater chance of a supersized 75 bps rate hike move at the upcoming FOMC policy meeting on September 20-21.
This, in turn, remain supportive of elevated US Treasury bond yields and continues to underpin the greenback. That said, signs of stability in the financial markets seem to act as a headwind for the safe-haven buck amid relatively thin trading volumes on the back of the Labor Day holiday in the US. Traders also seem reluctant to place aggressive bets and prefer to wait on the sidelines ahead of the announcement of the next UK Prime Minister later this Monday at 11:30 am GMT.
Technical levels to watch
-
09:22
RBA Preview: Forecasts from seven major banks, 50 bps rate hike for four months in a row
The Reserve Bank of Australia (RBA) will announce its next policy decision on Tuesday, September 6 at 04:30 GMT and as we get closer to the release time, here are the forecasts by the economists and researchers of seven major banks regarding the upcoming central bank's decision.
The RBA is set to hike the Official Cash Rate (OCR) by another 50 basis points (bps) to 2.25% in September vs. August’s 1.85%. Furthermore, Governor Lowe is giving his annual Anika Foundation speech on Thursday, titled “Inflation and the Monetary Policy Framework”.
ANZ
“The RBA will hike by 50 bps and likely keep the final paragraph of the post-meeting statement very similar to that in August. A focus on recent elevated inflation pressures or a dropping of the reference to keeping the economy on an ‘even keel’ would be a hawkish development. But we are also alert to the possibility of a dovish shift via the reference to the normalisation of monetary policy being changed or dropped. Given that the market is already pricing a cash rate of close to 4%, we think the hurdle for a hawkish shift is higher than for a dovish shift.”
Westpac
“We anticipate that the RBA will lift the cash rate by 50 bps. That will take the cash rate to 2.35%, to be in the ‘neutral zone’. Moves beyond this point are likely to be more measured. Globally and domestically, the inflation outlook is challenging, with risks that inflation expectations ratchet higher. In Australia, headline inflation is expected to climb to over 7% by year-end, the labour market is the tightest in 50 years, and wages growth is accelerating, albeit from modest levels. It is in this environment that the RBA is removing ultra-easy monetary conditions and will shift to a contractionary stance. We anticipate that the cash rate will rise to 3.10% by year-end and then peak at 3.35% in February 2023 – with moves of 25 bps each meeting from October to February.”
Standard Chartered
“We expect the RBA to continue to hike in September, but at a smaller magnitude of 40 bps (versus 50 bps in August), taking the policy rate to 2.25%. Thereafter, we expect the RBA to continue hiking policy rates by 25 bps in each of the months in Q4. The risk is for the RBA to hike again by 50 bps at the upcoming meeting given elevated inflation and inflation expectations.”
TDS
“We expect the RBA to hike the cash rate 50 bps at its Sep Board Meeting – the cash rate remains below neutral and data has generally been firm. Of more interest is whether Governor Lowe mirrors an urgency to get on top of inflation like the Fed/BoC/RBNZ.”
Danske Bank
“We expect the RBA to hike by another 50bps. RBA has signalled a data-dependent meeting-by-meeting approach and elevated inflation expectations and tighter labour markets point to further policy tightening.”
SocGen
“We expect the RBA to increase the cash rate target from 1.85% to 2.35%, which would mark four consecutive 50 bps rate hikes since the initial one in June. The key question now is both when and at what level the policy rate hike will terminate. We continue to think that the rate-hike cycle will terminate near the end of this year (i.e., December), while we have raised the level of the terminal policy rate from c.2.5% to c.3.0%.”
Citibank
“RBA is expected to persist with its hawkish rhetoric and raise the cash rate by 50 bps to 2.35%. From here on, we expect 25 bps hikes across October, November and December, for a year-end cash rate of 3.1% to approach the so-called “neutral” rate. RBA Governor Lowe will also deliver a speech on Thursday, titled ‘Inflation and the Monetary Policy Framework’. A more hawkish speech would make a stronger case for more 50 bps rises beyond this week.”
-
09:13
EUR/USD looks offered in new cycle lows in sub-0.9900 levels
- EUR/USD drops below 0.9900 to clinch new cycle lows.
- Germany final Services PMI came at 47.7 in August.
- US markets will remain closed due to the Labor Day holiday.
Sellers returned to the European currency and drags EUR/USD to fresh lows in the 0.9880/75 band for the first time since December 2002 on Monday.
EUR/USD weaker on USD-strength, prudent ahead of ECB
EUR/USD manages to leave behind the initial pessimism and rebounds from nearly 2-decade lows in the sub-0.9900 area at the beginning of the week, always against the backdrop of fresh buying interest in the dollar.
Indeed, the US Dollar Index (DXY) rose to more than 20-year highs north of the 110.00 hurdle before the opening bell in the old continent on Monday, as investors continue to adjust to the prospects for extra rate hikes by the Fed in the next months.
However, and before the Fed’s event, the ECB will meet later this week and expectations among investors appear to still favour a 75 bps rate hike, all amidst the unabated elevated inflation and with the spectre of the energy crush still hovering around the region.
In the docket, final figures saw the Services PMI in Germany at 47.7 in August and 49.8 in the broader Euroland. Later in the session, Retail Sales in the euro area will close the daily calendar.

What to look for around EUR
EUR/USD remains well under pressure and breaches the 0.9900 mark to flirt with levels last seen nearly 20 years ago.
So far, price action around the European currency is expected to closely follow dollar dynamics, geopolitical concerns, fragmentation worries and the Fed-ECB divergence. The latter, in the meantime, keeps closely following the prevailing debate around the size of the next interest rate hikes by both the ECB and the Federal Reserve.
On the negatives for the single currency emerge the so far increasing speculation of a potential recession in the region, which looks propped up by dwindling sentiment gauges as well as an incipient slowdown in some fundamentals.
Key events in the euro area this week: Germany, EMU Final Services PMI, EMU Retail Sales, EMU Sentix Index (Monday) – Germany Construction PMI (Tuesday) – Flash EMU Q2 GDP Growth Rate (Wednesday) – ECB Interest Rate Decision, Fed Powell (Thursday) – Eurogroup Meeting, Emergency Energy Meeting (Friday).
Eminent issues on the back boiler: Continuation of the ECB hiking cycle. Italian elections in late September. Fragmentation risks amidst the ECB’s normalization of its monetary conditions. Impact of the war in Ukraine and the persistent energy crunch on the region’s growth prospects and inflation outlook.
EUR/USD levels to watch
So far, the pair is losing 0.39% at 0.9912 and the breach of 0.9877 (2022 low September 5) would target 0.9859 (December 2002 low) en route to 0.9685 (October 2022 low). On the other hand, there is an initial up barrier at 1.0090 (weekly high August 26) ahead of 1.0192 (55-day SMA) and then 1.0202 (August 17 high).
-
09:01
European Monetary Union S&P Global Composite PMI below forecasts (49.2) in August: Actual (48.9)
-
09:01
European Monetary Union S&P Global Services PMI below expectations (50.2) in August: Actual (49.8)
-
08:56
Germany S&P Global/BME Services PMI registered at 47.7, below expectations (48.2) in August
-
08:56
Germany S&P Global/BME Composite PMI below forecasts (47.6) in August: Actual (46.9)
-
08:56
Germany S&P Global/BME Composite PMI came in at 46 below forecasts (47.6) in August
-
08:50
France S&P Global Composite PMI above forecasts (49.8) in August: Actual (50.4)
-
08:50
France S&P Global Services PMI came in at 51.2, above forecasts (51) in August
-
08:47
PBOC Deputy Governor: Don't bet on yuan's one-way moves
The People’s Bank of China’s (PBOC) Deputy Governor said on Monday that “don't bet on yuan's one-way moves. “
Additional quotes
“International recognition of Chinese yuan will increase.”
“China has relatively ample room for monetary policy.”
Separately, China’s state planner official said that policy measures to support economic growth are gaining traction.
Market reaction
USD/CNY was last seen trading at 6.9362, up 0.54% on the day.
-
08:45
Italy S&P Global Services PMI came in at 50.5, above expectations (48.3) in August
-
08:38
USD/CNH: Upside mitigated below 6.8700 – UOB
FX Strategists at UOB Group Lee Sue Ann and Quek Ser Leang noted USD/CNH could see its upside momentum alleviated on a breach of the 6.8700 level.
Key Quotes
24-hour view: “We expected USD to ‘trade sideways between 6.8900 and 6.9250’ last Friday. Our view was not wrong even though USD traded within a narrower range than expected (6.9004/6.9209). The underlying tone has improved and USD is likely to edge higher for today. However, a break of 6.9400 is unlikely (there is another resistance at 6.9325). Support is at 6.9120 followed by 6.9040.”
Next 1-3 weeks: “Our update from last Friday (02 Sep, spot at 6.9100) still stands. As highlighted, while upward momentum has waned somewhat, only a break of 6.8700 (no change in ‘strong support’ level from last Friday) would indicate that USD is not strengthening further. Looking ahead, resistance levels are at 6.9400 and 6.9600.”
-
08:31
US Dollar Index advances to fresh cycle highs past 110.00
- The index accelerates its gains beyond the 110.00 barrier.
- The Fed’s tightening bias returns to the fore on Monday.
- US markets will be closed due to the Labor Day holiday.
The US Dollar Index (DXY), which gauges the greenback vs. a bundle of its main rivals, resumes the upside and reaches new cycle tops beyond 110.00 the figure on Monday.
US Dollar Index in more than 20-year highs
The index leaves behind Friday’s inconclusive price action and resumes the upside in quite a firm pace at the beginning of the week, surpassing the 110.00 mark for the first time since June 2002.
Indeed, the firmer pace in the dollar comes in tandem with the equally persistent expectations of further monetary tightening by the Federal Reserve, as the September gathering looms closer.
Speaking about the September 21 meeting, and according to CME Group’s FedWatch Tool, the probability of a 75 bps rate hike is now at 58%, from around 75% a week ago.

Nothing scheduled in the docket on Monday amidst the inactivity in the US markets due to the Labor Day holiday.
What to look for around USD
The index keeps the bullish outlook well in place near 20-year highs above the 110.00 zone.
Bolstering the dollar’s strength appears the firmer conviction of the Federal Reserve to keep hiking rates until inflation looks well under control regardless of a likely slowdown in the economic activity and some loss of momentum in the labour market. This view was reinforced by Chair Powell’s speech at the Jackson Hole Symposium.
Extra volatility in the dollar, however, should not be ruled out considering the ongoing debate around the size of the September’s interest rate hike by the Federal Reserve amidst the ongoing data-dependent stance in the Fed.
Looking at the more macro scenario, the greenback appears propped up by the Fed’s divergence vs. most of its G10 peers in combination with bouts of geopolitical effervescence and occasional re-emergence of risk aversion.
Key events in the US this week: ISM Non-Manufacturing, Final Services PMI (Tuesday) – MBA Mortgage Applications, Balance of Trade, Fed Beige Book (Wednesday) – Initial Claims, Consumer Credit Change, Fed Powell (Thursday) – Wholesale Inventories (Friday).
Eminent issues on the back boiler: Hard/soft/softish? landing of the US economy. Prospects for further rate hikes by the Federal Reserve vs. speculation over a recession in the next months. Geopolitical effervescence vs. Russia and China. US-China persistent trade conflict.
US Dollar Index relevant levels
Now, the index is advancing 0.41% at 100.06 and a break above 110.27 (2022 high September 5) would aim for 111.90 (weekly high September 6 2002) and then 113.35 (weekly high May 24 2002). On the other hand, the next contention turns up at 107.58 (weekly low August 26) seconded by 106.79 (55-day SMA) and then 104.63 (monthly low August 10).
-
08:27
Gold Price Forecast: XAU/USD edges lower on stronger USD, Fed rate hike jitters
- Gold meets with a fresh supply on Monday and is pressured by a combination of factors.
- Hawkish Fed expectations lift the USD to a two-decade high and weigh on the commodity.
- A positive risk tone further undermines demand for the traditional safe-haven XAU/USD.
- Thin trading volumes on the back of a US holiday warrant some caution for bearish traders.
Gold edges lower on the first day of a new week and erodes a part of Friday's strong gains. The XAU/USD remains on the defensive through the early European session, though lacks follow-through selling and so far, has managed to hold above the $1,700 round-figure mark.
The US dollar jumps to a new 20-year high on Monday and turns out to be a key factor exerting downward pressure on the dollar-denominated gold. Despite the mixed US jobs report released on Friday, growing acceptance that the Fed will stick to its aggressive policy tightening path continues to underpin the greenback. In fact, the markets are pricing in a greater chance of a supersized 75 bps rate hike at the next FOMC meeting on September 20-21.
The bets were reaffirmed by the recent hawkish remarks by hawkish remarks by several Fed officials, indicating that interest rates are likely to keep rising until inflation is substantially closer to the 2% target. Moreover, the Reserve Bank of Australia, the European Central Bank and the Bank of England are also expected to continue to raise interest rates. This is seen as another factor that contributes to driving flows away from the non-yielding gold.
Apart from this, signs of stability in the equity markets further seem to undermine demand for traditional safe-haven gold. That said, growing worries about a deeper economic downturn should keep a lid on any optimism. This, along with relatively thin trading volumes on the back of the Labor Day holiday in the US, could hold back traders from placing aggressive bets around gold. This, in turn, warrants some caution before positioning for any further losses.
Technical levels to watch
-
08:26
USD/JPY to become top-heavy past 140 due to concerns of currency intervention – MUFG
USD/JPY fluctuates in a relatively tight range above 140.00. Economists at MUFG Bank expect the pair to become top-heavy past 140.
Japanese authorities to step up efforts to stop the yen from weakening
“We forecast that the USD/JPY will move beyond 140 around the time of the FOMC meeting in September, but do not expect significant upside from there.”
“We think the authorities will strengthen moves to curb yen weakness if the USD/JPY passes 140 considering that the last yen-buying intervention was in June 1998.”
-
08:22
US Dollar Index: 111.30 looks to be the next resistance area – ING
The US Dollar Index has touched its highest level in two decades above 110.00. Economists at ING expect DXY to target the 111.30 mark.
USD to remain bid
“Offering 2.3% overnight deposit rates and backed by near energy independence and a relatively strong US economy, it should not be a surprise to see the dollar remaining bid.”
“DXY is now comfortably through 110 and 111.30 looks to be the next resistance area. Don’t fight the trend here.”
-
08:18
EUR/USD: No obvious support level until the 0.9600/9650 area – ING
EUR/USD has dropped below 0.9900 for the first time since October 2002. Economists at ING expect the world’s most popular currency pair to extend its slide towards the 0.9600/9650 area.
75 bps hike is a leap too far for the ECB
“The gas news has sent EUR/USD to a new low for the year and it is not obvious where the next support levels exist – perhaps 0.9850 and then not until the 0.9600/9650 area.”
“We feel that the weekend package of support measures to the German economy does not go far enough – worth just 2% of GDP compared to 15% of GDP levels of support seen through the pandemic.”
“We think a 75 bps hike at Thursday’s meeting is a leap too far for the ECB – we look for 50 bps. This will not help the euro.”
-
08:16
Spain S&P Global Services PMI came in at 50.6 below forecasts (52.9) in August
-
08:14
GBP/USD eyes the 1.1410 March 2020 flash crash low – ING
GBP/USD edged lower dropped below 1.1500. Economists at ING expect the pair to stay offered.
0.86-0.87 could be the new trading range for EUR/GBP
“The broadly stronger dollar has seen GBP/USD losses extend and the 1.1410 March 2020 flash crash low come into view.”
“Given the negative growth environment – sterling is a pro-cyclical currency – it is hard to see the pound turn around against the dollar.”
“It seems the UK bond market is starting to prove uneasy with the fiscal outlook – potentially inserting a sovereign risk premium into sterling.”
“Cable should stay offered, while 0.8600-0.8700 could be the new trading range for EUR/GBP.”
-
08:09
USD/THB forecasts at 37.50 and 38.00 for Q3 and Q4 this year – MUFG
USD/THB hit a low of 36.16 on 11th August but was bid thereafter. In the view of economists at MUFG Bank, the Thai bath may be weighed down by external downside risks for the rest of 2022.
USD/THB to fall to 37.250 and 36.250 in Q1 and Q2 next year
“A cloudy external environment may weigh on Thailand’s exports and GDP growth. We now forecast GDP growth at 2.9% and 3.5% for 2022 and 2023, down from 3.4% and 4.0% prior.”
“We expect 75 bps of rate hikes in 2022 and 2023 which may pale in comparison to other central bank’s tightening.”
“We forecast USD/THB at 37.500 and 38.000 for Q3 and Q4 this year, before decreasing to 37.250 and 36.250 in Q1 and Q2 next year.”
-
08:01
Turkey Producer Price Index (MoM) dipped from previous 5.17% to 2.41% in August
-
08:01
Turkey Consumer Price Index (YoY) below forecasts (81.22%) in August: Actual (80.21%)
-
08:01
Turkey Producer Price Index (YoY) fell from previous 144.61% to 143.75% in August
-
08:01
Forex Today: Dollar builds on last week's gains despite thin trading conditions
Here is what you need to know on Monday, September 5:
The US Dollar Index preserved its bullish momentum after having gained %0.7 last week and touched its highest level in two decades above 110.00 early Monday. The cautious market mood helps the greenback continue to outperform its rivals as investors await Sentix Investor Confidence and Retail Sales data from the euro area while keeping an eye on headlines surrounding the energy crisis. The US market will be closed due to the Labor Day holiday and the trading action could remain subdued in the second half of the day.
Gazprom announced late Friday that it had halted gas flows to Europe after having detected an oil leakage. The gas supplier refrained from setting a timeframe for how long the maintenance would last. Siemens said that Nord Stream should have other operational turbines at the compressor station where the leak was detected and argued that there was no reason for the pipeline's operation to fully stop. Over the weekend, Gazprom said it would deliver 42.7 million cubic meters of natural gas through Ukraine but this development didn't allow the shared currency to find demand at the beginning of the week.
Meanwhile, the data from China showed that the Caixin Services PMI declined to 55 in August from 55.5 in July.
EUR/USD dropped below 0.9900 for the first time since October 2002 before recovering modestly in the early European morning. As of writing, the pair was down 0.5% on the day at 0.9902. Retail Sales in the euro area are forecast to decline by 0.7% in July.
GBP/USD edged lower amid broad-based dollar strength during the Asian trading hours and dropped below 1.1500. The pair stays on the back foot at around 1.1480. Later in the day, the UK Conservative Party will announce the result of the UK leadership contest at 1130 GMT.
USD/JPY is struggling to gather bullish momentum as the risk-averse market environment helps JPY find demand. The pair fluctuates in a relatively tight range above 140.00.
Gold staged a decisive rebound on Friday but ended up closing the week in negative territory. XAU/USD stays relatively quiet early Monday as US bond markets remain closed.
Bitcoin continues to move sideways below $20,000 and Ethereum holds steady at around $1,500.
-
08:00
Turkey Consumer Price Index (MoM) below forecasts (2%) in August: Actual (1.46%)
-
08:00
Switzerland Gross Domestic Product (YoY) came in at 2.8% below forecasts (3%) in 2Q
-
08:00
Switzerland Gross Domestic Product s.a. (QoQ): 0.3% (2Q) vs previous 0.5%
-
07:56
USD/CAD bulls keep reins around 1.3150 despite firmer oil prices, US/Canada holiday
- USD/CAD grinds higher around the monthly top, sidelined of late.
- Oil prices cheer energy crisis, receding hawkish hopes from the Fed.
- Labor Day holiday in the US, Canada trouble the pair traders.
- BOC, Canadian GDP will be crucial for short-term directions.
USD/CAD remains on the front foot at around 1.3150 as buyers regain control, after the first negative day in four. In doing so, the Loonie pair pays a little heed to the firmer prices of Canada’s main export item, WTI crude oil, during early Monday morning in Europe.
WTI crude oil prices increase 1.9% daily to $88.50 by the press time. In doing so, the black gold appreciates the weekend headlines that intensified recession fears in the Eurozone. The same also signaled lesser oil output from Russia and a lack of the US-Iran deal that might have released oil from Tehran to ease the global energy supply crunch.
Elsewhere, the market sentiment remains sluggish as the reduction in the hawkish Fed bets, around 57% by the press time from above 70% in the last week, seems to probe the US dollar bulls. Even so, the market’s fears of recession and the Fed’s aggression helped the US Dollar Index (DXY) to refresh the 20-year high earlier in the day, up 0.45% intraday near 110.10 at the latest.
Other than the economic slowdown fears, the Sino-American jitters over the Trump-era sanctions and Taiwan also exert downside pressure on the market sentiment and help the USD/CAD pair to remain firmer.
While portraying the mood, the US stock futures remain sidelined but those from Europe print losses. It’s worth noting that the Labor Day holiday in the US and Canada restricts market moves and could challenge the USD/CAD traders. That said, the Bank of Canada (BOC) monetary policy meeting, the second quarter (Q2) Canadian Gross Domestic Product (GDP) data and the ISM Services PMI for August are crucial catalysts for the pair traders to watch for clear directions.
Given the comparatively more hawkish Fed than the BOC, the anticipated 0.75% from the latter could only offer a kneejerk reaction unless surprising the markets.
Technical analysis
Unless providing a daily closing below the three-week-old support line, near 1.3010 by the press time, USD/CAD remain on the way to cross the immediate hurdle around 1.3170, comprising an upward sloping resistance line from late December 2021.
-
07:51
USD/JPY to trade in the range of 131-136 if US 5Y yield moves in the range of 3.0-3.5% – SocGen
The USD/JPY has been correlated with the difference in 5Y rates between the US and Japan since 2021. The pair should trade in the range of 131-136 if US 5Y yield moves in the range of 3.0-3.5%, economists at Société Générale report.
Deterioration of Japan’s current account balance will lead to additional yen depreciation
“If US 5Y yield moves in the range of 3.0-3.5% in the future, USD/JPY would move in the range of 131-136 yen. However, since June, USD/JPY has been higher than the fair value calculated by the difference in 5Y rates.”
“There is a possibility that the deterioration of Japan’s current account balance will lead to additional yen depreciation.”
-
07:51
USD/JPY shifts the focus to 141.50 – UOB
Extra gains in USD/JPY could revisit the 141.50 region in the short-term horizon, said FX Strategists at UOB Group Lee Sue Ann and Quek Ser Leang.
Key Quotes
24-hour view: “We highlighted last Friday that ‘further USD strength is likely even though overbought conditions suggest USD may not be able to maintain a foothold above 140.50’. Our view was not wrong as USD rose briefly to 140.79 before easing off to close unchanged at 104.20. Upward momentum is positive and we see room for USD to retest the 140.80 level. A sustained advance above 140.80 is unlikely for now (the major resistance at 141.50 is unlikely to come under threat). Support is at 140.05 followed by 139.80.”
Next 1-3 weeks: “Last Friday (02 Sep, spot at 139.95), we highlighted that upward momentum remains strong and a break of 140.50 would shift the focus to 141.50. USD subsequently cracked 140.50 and rose to a high of 140.79. The price actions suggest USD is likely to advance further and the focus is at 141.50 now. On the downside, a breach of 139.30 (‘strong support’ level was at 138.60 last Friday) would indicate that USD is unlikely to advance further.”
-
07:48
Natural Gas Futures: Weakness is not expected to last
Considering advanced prints from CME Group for natural gas futures markets, traders trimmed their open interest positions by more than 4K contracts on Friday, reversing the previous daily build. On the other hand, volume increased for the third straight session, now by nearly 19K contracts.
Natural Gas remains limited by $10.00
Friday’s downtick in prices of natural gas was on the back of shrinking open interest, which leaves the prospects for further decline somewhat curtailed in the near term. In the meantime, the upside remains capped by the YTD peaks around the $10.00 mark per MMBtu.
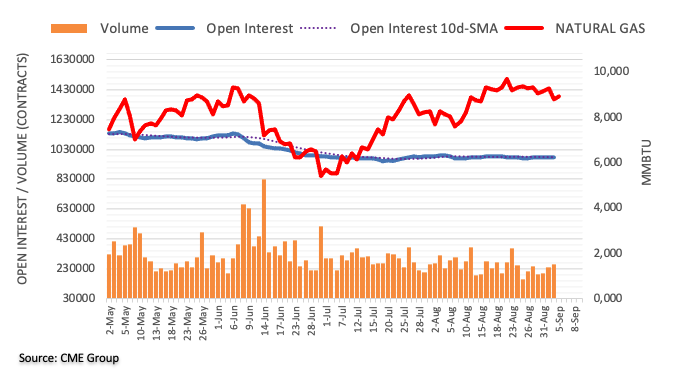
-
07:44
USD/KRW set to move up to 1,370 by year-end – MUFG
Amid the background of a 2.6% appreciation in the US Dollar Index, the Korean won fell 3.3% against the US dollar in August, the worst performer among EM Asia peers. Economists at MUFG Bank expect the USD/KRW pair to extend its upmove towards 1,370 by end-2022.
Strong USD to further weigh on KRW
“We see the USD/KRW remaining highly positively correlated with the US dollar index and negatively correlated with Korean equity markets this month.”
“A strong US dollar and persisting risk aversion will likely further pressure the KRW lower in near term.”
“We see USD/KRW moving up to 1,370 by year-end.”
-
07:40
IMF calls for EU fiscal capacity, rules to be linked to risk
The International Monetary Fund (IMF) said on Monday, the European Union (EU) should set up fiscal capacity and debt reduction pace to be linked to individual country risk, per Reuters.
Key quotes
“Independent national fiscal councils should play a bigger role.”
“EU needs fiscal capacity for climate change, energy, defense.”
"The speed and ambition of fiscal adjustments would be linked to the degree of fiscal risks.”
“The IMF proposal is timed to coincide with the start of discussions among EU finance ministers later this week.”
Market reaction
EUR/USD remains heavy selling pressure near two-decade lows of 0.9877 reached earlier in the Asian session. A 35% jump in the European gas prices amid news of Russia’s Gazprom halting gas deliveries to the old continent smashes the shared currency.
-
07:40
A very high inflation peak in the eurozone will force the ECB to react – Natixis
In the opinion of analysts at Natixis, inflation is likely to peak higher in the eurozone than in the United States for four reasons. This will force the European Central Bank (ECB) to react.
The four causes of high inflation in the eurozone
“Given the deterioration in the terms of trade, the ECB’s slow reaction, the hiring difficulties and expansionary fiscal policy, inflation is likely to peak higher in the eurozone than in the United States.”
“This ought to lead to a more restrictive monetary policy in the eurozone than in the United States, which is not at all priced in at present.”
-
07:30
AUD/USD: A breach of 0.6750 could expose 0.6705 – UOB
AUD/USD remains under pressure and could break below the 0.6750 level in the next few weeks, according to FX Strategists at UOB Group Lee Sue Ann and Quek Ser Leang.
Key Quotes
24-hour view: “Last Friday, we expected AUD to weaken but we were of the view that ‘the major support at 0.6750 could be out of reach’. Our expectations did not materialize as AUD traded between 0.6780 and 0.6855 before closing at 0.6808 (+0.33%). Momentum indicators are ‘flattish’ now and AUD is likely to consolidate for today, expected to be within a range of 0.6770/0.6830.”
Next 1-3 weeks: “There is not much to add to our update from last Friday (02 Sep, spot at 0.6800). As highlighted, AUD is expected to weaken and a break of 0.6750 would shift the focus to 0.6705. That said, oversold shorter-term conditions could lead to a couple of days of consolidation first. Overall, only breach of 0.6870 (no change in ‘strong resistance’ level from last Friday) would indicate that the downside risk has dissipated.”
-
07:29
Russia: Further loosening to support a struggling economy – Standard Chartered
Economists at Standard Chartered now expect the Central Bank of Russia (CBR) to cut its key rate to 7.5% from 8.0% on 16 September. They see a further 50 bps of cuts in Q4, taking the key rate to 7.0% by end-2022.
More rate cuts to come
“We lower our end-2022 policy rate forecast to 7.0% from 8.0%; this incorporates the bigger-than-expected cut delivered in July, our view of a 50 bps move in September, and additional cuts for the rest of H2 on softening inflation and worsening economic conditions.”
“We expect another 50 bps of cuts in Q1-2023 to 6.5% – ‘neutral’, as defined in the CBR’s latest macroeconomic survey. We expect it to stay there for the foreseeable future, and we raise both our end-2023 and end-2024 policy rate forecasts to 6.5% (from 6.0%) accordingly.”
“We maintain our medium-term inflation forecasts but see upside risks. A significant import recovery (imports from China have risen nearly 80% since April) could weigh on the RUB, increasing inflation pass-through effects.”
-
07:23
Gold Price Forecast: XAU/USD sellers look to keep upper hand amid an impending bear cross
Gold price lacks follow-through recovery momentum. Sell the XAU/USD bounce above $1,700? FXStreet’s Dhwani Mehta analyzes XAU/USD’s technical picture.
Short-term technical outlook for gold remains bearish
“Bears need to find footing once again below $1,700 to resume the downside momentum. The next cushion is seen at the rising trendline support at $1,690. Should the decline accelerate below the latter, a test of the 2021 low of $1,677 will be on the table, below a break of the yearly lows.”
“The 21-Daily Moving Average (DMA) is set to cut the 50 DMA from above, which if confirmed on a daily closing basis will represent a bear cross. The bearish crossover will add credence to the bearish potential in the metal.”
“Bulls will meet initial resistance at Friday’s high of $1,718, above which the $1,720 round number could come into play. The August 31 high of $1,727 could be a tough nut to crack for XAU buyers.”
-
07:23
EUR/JPY Price Analysis: Further downside eyes 138.40 key support
- EUR/JPY takes offers to refresh intraday low, extend pullback from six-week high.
- A convergence of 50-DMA, 100-DMA restrict immediate declines ahead of monthly support line.
- Two-month-old horizontal hurdle adds filters to the north.
- RSI retreat hints at further weakness but bears should remain cautious.
EUR/JPY extends the previous day’s pullback from a six-week high as bears attack 139.00 heading into Monday’s European session. The cross-currency pair’s latest gains could also be linked to the RSI (14) retreat, as well as the recently easing MACD signals.
That said, a joint of the 100-DMA and the 50-DMA, around 138.40, appears a tough nut to crack for the pair sellers.
Even if the quote drops below 138.40, an upward sloping support line from early August, near 137.30 by the press time, could probe the pair’s further declines.
In a case where the EUR/JPY prices drop below 137.30, the odds of witnessing a south-run towards the previous monthly low near 133.40 can’t be ruled out.
On the contrary, upside moves may initially aim for the 140.00 threshold before Friday’s top surrounding 140.75.
Following that, a horizontal area comprising tops marked since early July, near 142.35-40, could challenge the EUR/JPY buyers before directing them to the yearly top marked in July around 144.25-30.
EUR/JPY: Daily chart

Trend: Further weakness expected
-
07:21
EUR/SEK: The current krona losses are once again excessive – Commerzbank
The Swedish krona is unable to escape recession fears. But in the view of economists at Commerzbank, the EUR/SEK pair should move back down to the 10.35 area.
Riksbank is turning into a hawk
“EUR/SEK is once again trading above 10.70. However, I urge caution in this context as the ECB will have to meet the market expectations this week, as otherwise there is potential for a correction in the euro.”
“The Riksbank expects interest rates to peak at 2% in mid-2023. I assume that it will hike its key rate by 75bp on 20th September and raise its rate path. Moreover, it is likely to continue sounding hawkish. As a result, the Riksbank should then be on a par with the ECB.”
“If market sentiment has also improved at that point there is nothing preventing EUR/SEK exchange rates in the area of 10.35 any longer so I stick to my view that the current SEK losses are once again excessive.”
-
07:15
EUR/USD: Scope for a correction if the ECB were to disappoint – Commerzbank
EUR/USD has broken below 0.99. Economists at Commerzbank expect the world’s most popular currency pair to extend its downfall if the European Central Bank (ECB) disappoints markets.
How to interpret the NFP data?
“The unemployment rose because more employees were interested in taking up work. However, job growth remained very strong. Everything all told, the report paints the picture of a small slowing of employment growth, according to our experts – i.e. things are calming down a little. So there is no reason to question the Fed’s approach and sell the dollar as a result.”
“For now, all eyes are on the ECB and the question whether it will deliver on Thursday or not. If the ECB were to disappoint, we see scope for a correction in the euro, as market expectations have gone a long way.”
-
07:15
BOE to hike rates by 50 bps at September meeting – Goldman Sachs
Economists at Goldman Sachs, in their latest note, maintained the view of a 50 bps rate hike by the Bank of England (BOE) at its September policy decision while revising up their forecasts for a 50 bps hike in the coming months.
Key quotes
"In the runup to the September meeting, the MPC is likely to focus on the extent to which strong wage growth is becoming embedded, and on assessing the reaction of inflation expectations to high spot inflation. The UK labor market remains remarkably strong, with many indicators just as tight as in the US Households' inflation expectations have firmed sharply, and we see risks as skewed towards more persistent inflation expectations."
"While not a done deal, we continue to think that a 50bp hike at the September MPC meeting is more likely than a step-up to 75bp. That said, given strong and persistent wage growth, elevated inflation expectations and the likelihood of the new Prime Minister announcing further fiscal support, there is a case for the BoE to take monetary policy rapidly into contractionary territory.”
"On the heels of the firmer inflation outlook, we revise up our Bank Rate forecast to include 50bp hikes at both the November and December MPC meetings (from 25bp previously), taking Bank Rate to 3.25% by year-end. After this, we look for a step down to a 25bp hike in February, given we expect the data to show the UK economy to be in the middle of a technical recession at this point. This puts our terminal Bank Rate at 3.50%, up from 2.75% previously, but below market pricing."
-
07:14
WTI marches towards $90.00 on potential supply cuts by OPEC
- Oil prices are attempting to kiss the immediate hurdle of $90.00 amid escalating supply cut fears.
- Eurozone may substitute oil for energy to mitigate the requirement of energy to some extent.
- The announcement of lockdown curbs in China to corner Covid-19 has trimmed the overall demand.
West Texas Intermediate (WTI), futures on NYMEX, is displaying a subpar performance after a gap-up opening on Monday. The black gold has turned sideways led by the unavailability of upside momentum due to reversal hacks. The asset is oscillating in a range of $87.70-88.60 and is expected to march towards the round-level resistance of $90.00.
Oil bulls have gained decent traction as the announcement of production cuts seems on cards in the OPEC meeting on Monday. The cartel has already signaled for production cuts to offset the recent decline in oil prices. For the oil cartel, weaker prices are always considered an imbalance as they generate lower revenues for oil-exporting nations. Therefore, the oil cartel prefers to keep oil prices higher in order to accelerate revenues.
On the demand front, the deepening energy crisis in eurozone after Moscow halted energy supply for an indefinite period is expected to step up oil demand. The old continent is expected to tap oil as a substitute to mitigate the oil requirements. It is worth noting that the winter season is arriving sooner and higher energy stockpiles are required to cater to the pump-up demand.
Meanwhile, the resurgence of Covid-19 in the world’s second-largest economy and the world’s largest oil importer, China has trimmed overall demand prospects. The adaptation of lockdown curbs to contain the spread has forced restrictions on the movement of men, materials, and machines will result in deprived oil demand ahead.
-
07:12
Crude Oil Futures: Extra gains likely near term
Open interest in crude oil futures markets reversed three consecutive daily pullbacks and went up by around 3.5K contracts at the end of last week, according to preliminary readings from CME Group. Volume, instead, shrank for the third straight session, now by around 26.8K contracts.
WTI met support below $86.00
Prices of the barrel of WTI bounced off recent lows in the sub-$86.00 level on Friday. The downtick was amidst increasing open interest, which hints at the idea that further rebound looks on the cards in the very near term. Next on the upside for crude oil emerges the 200-day SMA, today at $96.30.
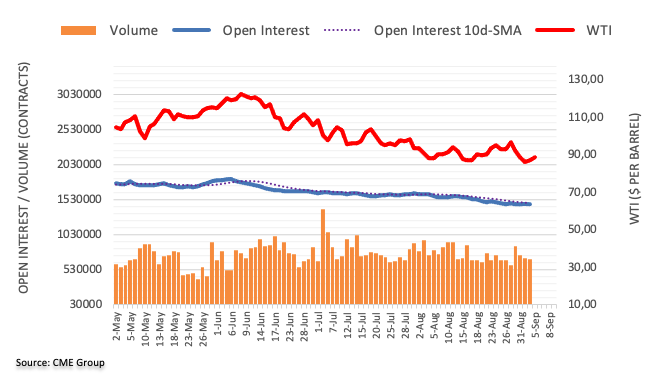
-
07:11
Gold Price Forecast: XAU/USD to witness additional recovery gains as long as $1,700 support holds
Gold registered losses for the third straight week despite Friday's rebound. XAU/USD looks to extend correction, in the view of FXStreet’s Eren Sengezer.
$1,700 aligns as significant support
“The Relative Strength Index (RSI) indicator turned north and recovered to 40 after testing 30 on Thursday. This technical development suggests that gold could extend its upward correction in the near term.”
“On the upside, the 20-day and the 50-day SMAs form an important resistance area at $1,750. A daily close above that hurdle could open the door for an extended rebound toward $1,780 (Fibonacci 23.6% retracement of the latest downtrend) and $1,800 (psychological level, 100-day SMA).”
“$1,700 (psychological level, end-point of the latest downtrend) aligns as significant support. In case XAU/USD falls below that level again and confirms it as resistance, it could target $1,680 (July 21 low).”
-
07:02
Russia S&P Global Services PMI dipped from previous 54.7 to 49.9 in August
-
06:58
GBP/USD: Rising bets for a drop below 1.1415 – UOB
In the opinion of FX Strategists at UOB Group Lee Sue Ann and Quek Ser Leang, GBP/USD could slip back below the 1.1415 region in the next weeks.
Key Quotes
24-hour view: “Last Friday, we expected GBP to weaken but we were of the view that it ‘may not be able to maintain a foothold below 1.1500’. Our view did not quite materialize as GBP rose to 1.1589 before dropping to a low of 1.1497 during late NY hours. GBP fell sharply during early Asian hours and moved clearly below 1.1500. Further decline appears likely but the next major support at 1.1415 is likely out of reach for today. On the upside, a breach of 1.1535 (minor resistance is at 1.1505) would indicate that the weakness in GBP has stabilized.”
Next 1-3 weeks: “In our latest narrative from last Friday (02 Sep, spot at 1.1545), we held the view that further GBP weakness is likely but it is left to be seen if the Mar 2020 low near 1.1415 is within reach this time round. GBP closed at 1.1520 (0.21%) in NY but dropped sharply upon opening in Asian today. Downward momentum has improved rapidly and the chance for a sustained decline below 1.1415 has increased. Looking ahead, a clear break of 1.1415 would shift the focus to 1.1300. Overall, only a break of 1.1605 (‘strong resistance’ level was at 1.1635 last Friday) would indicate that the weakness in GBP that started early last week has run its course.”
-
06:55
USD/TRY bulls approach yearly top near 18.30 with eyes on Turkish inflation
- USD/TRY grinds higher after refreshing two-week top the previous day, prints three-day uptrend.
- Fears of another bumper inflation figures keep buyers hopeful but US holidays, softer data test upside momentum.
- Turkish government expects easing inflation by late 2022, sharp fall in 2023.
- Turkish CPI for August is likely to refresh record top near 80.0%.
USD/TRY bulls brace for another positive day with eyes on the Turkish inflation data, mildly bid around 18.20 heading into Monday’s European session. In addition to the pre-data anxiety, the US holiday and mixed concerns over the Fed’s next move also probe the pair buyers of late.
Turkiye is up for releasing August month inflation numbers and the same becomes crucial after the latest increase in electricity and gas prices in the nation. Also highlighting the importance of the inflation data is the Central Bank of the Republic of Türkiye’s (CBRT) rate cut of 100 basis points (bps).
On Sunday, the Turkish government released an official update expecting the annual inflation rate to ease to 65% by the end of 2022, from nearly 80% in July and falling sharply to 24.9% by the end of 2023. The Reuters’ news also mentioned that the current account deficit was seen at $47.3 billion this year, up from $14.9 billion last year, dropping to $22 billion in 2023.
That said, the latest Reuters poll hints at the annual inflation figure exceeding 81% in August. “Polls show Turks believe inflation is far higher than official data,” said Reuters.
On the other hand, Friday’s mixed prints of the US employment data for August receded the hawkish Fed bets and allowed the US dollar to pare some gains amid a lackluster session due to the US Labor Day holiday. US employment data marked mixed readings as the headline Nonfarm Payrolls (NFP) rose past 300K forecast to 315K, versus 526K prior, but the Unemployment Rate rose to 3.7% compared to 3.5% expected and prior. Further details reveal that the Average Hourly Earnings reprinted 5.2% growth for August, a bit lesser than the 5.3% market consensus. Also, Factory Orders dropped to -1.0% for July compared to 0.2% forecasts and 1.8% in previous readings.
Even so, the USD/TRY buyers remain hopeful amid fears of economic slowdown.
Technical analysis
The lower high formation since late 2021 challenges USD/TRY bulls unless the quote renews the yearly top, currently around 18.28. The bears, however, should remain off the table until witnessing clear trading below the early August tops surrounding the 18.00.
-
06:48
EUR/GBP sees downside below 0.8630 on deepening Eurozone energy crisis, UK leadership eyed
- EUR/GBP is expected to display more losses to near 0.8620 amid escalating Eurozone energy crisis.
- As Eurozone HICP has scaled above 9%, odds for a 75 bps rate hike by the ECB have strengthened.
- UK PM contender Liz Truss has promised o scale down energy bills if she becomes the next PM.
The EUR/GBP pair has given a downside break of the consolidation formed in a narrow range of 0.8634-0.8644 in the Asian session. The cross is expected to decline towards the immediate cushion of 0.8620 as escalating Eurozone energy crisis is weighing over the shared currency bulls. On a broader note, the pair has declined after a failed attempt of overstepping the previous week’s high at 0.8670.
As Russian gas giant Gazprom has adopted a heated route after G7 countries issued a price cap on Russian oil, the energy crisis in the old continent has deepened further. The closure of the Nord Stream 1 pipeline under the Baltic Sea for an indefinite period citing leakage issues has accelerated the energy crisis, energy prices, and energy bills for households for a substantial period. Apart from that, growth prospects have been hit dramatically.
Adding to that, the growth prospects are also expected to witness a serious impact as the European Central Bank (ECB) policymakers are gearing up for hiking its interest rates. It is highly likely that ECB President Christine Lagarde will step up interest rates by 75 basis points (bps), taking it to 1.25%. The most preferred inflation-gauge tool of the ECB, Harmonized Index of Consumer Prices (HICP) has scaled above 9%.
On the UK front, investors are keenly awaiting the outcome of the UK Prime Minster elections. The world's sixth largest economy has been through political instability after the resignation of UK PM Boris Johnson. The UK economy is also facing the headwinds of soaring energy prices. And, UK Foreign Minister Liz Truss has favored an immediate action to combat ramping up energy bills if she becomes the next Prime Minister.
-
06:46
Gold Futures: Upside appears limited
CME Group’s flash data for gold futures markets noted open interest dropped by just 635 contracts on Friday following five consecutive daily builds. In the same line, volume shrank by around 27.3K contracts, reversing two daily pullbacks in a row.
Gold: A drop to the 2022 low is not ruled out
Gold prices regained the smile on Friday and reversed a 4-session negative streak. The move, however, was on the back of declining open interest and volume and is indicative that the rebound looks capped in the very near term. A potential visit to the YTD low at $1,680 remains well on the cards for the time being.
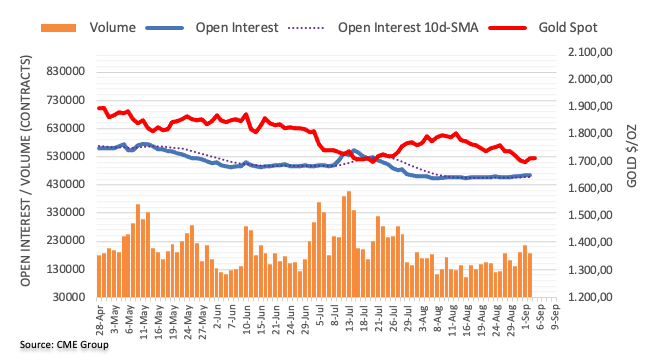
-
06:25
USD/CHF Price Analysis: Bulls again aim for 0.9860-70 resistance zone
- USD/CHF picks up bids to reverse Friday’s pullback from a four-month-old horizontal resistance area.
- Sustained trading beyond 100-DMA, bullish MACD signals favor buyers.
- Sellers need to conquer three-week-old support line for fresh entries.
USD/CHF picks up bids to refresh intraday high near 0.9830-35 during early Monday morning in Europe. In doing so, the Swiss currency (CHF) pair approaches a horizontal region comprising multiple hurdles marked since early May those have been pushing back the bulls of late.
It’s worth noting that the USD/CHF pair’s successful trading above the 100-DMA and a three-week-long upward sloping support line joins bullish MACD signals to keep the pair buyers hopeful.
Even so, the 0.9860-70 area appears a tough nut to crack for the bulls to aim for the 0.9900 threshold. Also acting as an important resistance is the 1.0000 psychological magnet, as well as the yearly high of 1.0064.
Alternatively, pullback moves may initially aim for the aforementioned support line, at 0.9755 by the press time ahead of the 100-DMA support near 0.9685.
The early August swing highs near 0.9650 also act as a downside filter before directing the USD/CHF bears towards the previous monthly trough surrounding 0.9370.
To sum up, USD/CHF is likely to remain on the bull’s radar but the upside momentum needs validation from 0.9370.
USD/CHF: Daily chart
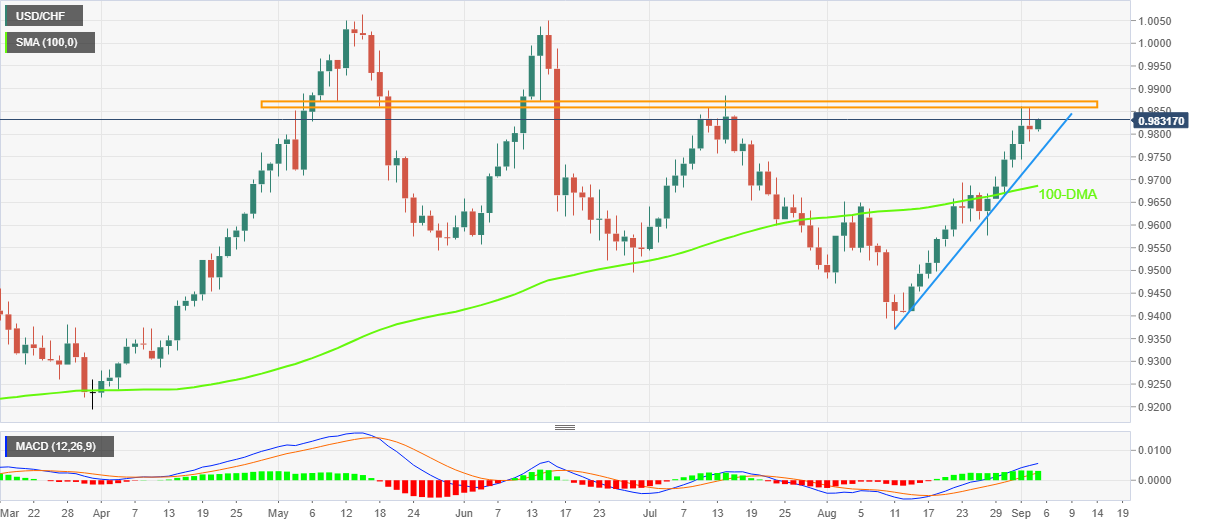
Trend: Further upside expected
-
06:14
EUR/USD risks further decline once 0.9900 is cleared – UOB
FX Strategists at UOB Group Lee Sue Ann and Quek Ser Leang suggest EUR/USD could accelerate losses on a close below 0.9900.
Key Quotes
24-hour view: “EUR popped to a high of 1.0033 during NY session before dropping sharply to a low of 0.9941. EUR opened on a weak note in Asia and the improving downward momentum is likely to lead to a break of 0.9900. For today, the next support at 0.9850 is unlikely to come under threat. Resistance is at 0.9945 followed by 0.9970.”
Next 1-3 weeks: “Last Friday (02 Sep, spot at 0.9945), we highlighted that the risk for EUR has shifted to the downside. We added, EUR has to close below the major support at 0.9900 before a sustained decline is likely. EUR subsequently popped to within a couple of pips of our ‘strong resistance’ at 1.0035 (high of 1.0033) before dropping back down quickly. We continue to hold the same view as long as the ‘strong resistance’ level at 1.0005 (level was at 1.0035 last Friday) is not breached. Looking ahead, the next level to monitor below 0.9900 is at 0.9850.”
-
06:08
AUD/USD Price Analysis: More downside is on cards, 0.6700 eyed
- Availability of barricades around 61.8% Fibo retracement has strengthened bearish reversal bets.
- Declining 20-and 50-EMAs indicates a continuation of the downside move.
- A break into the bearish range of 20.00-40.00 by the RSI (14) will trigger downside momentum.
The AUD/USD pair is displaying topsy-turvy moves in a narrow range of 0.6774-0.6800 in the Asian session. After a gap down open, the aussie bulls attempted a break above the critical hurdle of 0.6800, however, the risk-off market tone strengthened the greenback bulls.
On a four-hour scale, the asset has witnessed a steep fall after facing barricades around the 61.8% Fibonacci retracement (placed from July 14 low at 0.6682 to August 11 high at 0.7137) near 0.6857. The availability of critical hurdles while attempting to overstep 61.8% Fibo retracement warrants a completion of 100% retracement ahead.
The 20-and 50-period Exponential Moving Averages (EMAs) at 0.6820 and 0.6850 respectively are declining lower, which adds to the downside filters.
Meanwhile, the Relative Strength Index (RSI) (14) is expected to dive into the bearish range of 20.00-40.00, which will trigger a fresh downside move ahead.
Should the asset drop below Thursday’s low at 0.6770, the greenback bulls will get activated and may drag the aussie bulls towards the round-level support at 0.6700, followed by 6 March 2020 high at 0.6657.
Alternatively, the aussie bulls could regain strength and may send the asset towards Wednesday’s high at 0.6904 and 38.2% Fibo retracement at 0.6964, if the asset oversteps 61.8% Fibo at 0.6857 decisively.
AUD/USD four-hour chart
-637979512550530976.png)
-
06:04
Breaking: EUR/USD breaks below 0.9900 for the first time since Dec 2020
EUR/USD has breached the 0.9900 key support for the first time since December 2020, extending its declines amid unrelenting US dollar demand across the board. Risk-aversion bolsters the safe-haven demand for the greenback at the start of the week, despite Friday's mixed US labor market report.
The deepening European energy crisis has exacerbated concerns about an imminent global recession, killing the appetite for riskier assets. Gazprom halted its key European gas pipeline indefinitely after G7 leaders agreed to implement a price cap on Russian oil last Friday. Some media outlets reported on Saturday that the Russian oil giant has restarted gas deliveries to Europe via Ukraine, although there is no official confirmation about it so far.
The US dollar is shrugging off receding bets for a 75 bps Fed rate hike this month on an unexpected uptick in the US unemployment rate while the headline US Nonfarm Payrolls outpaced expectations, arriving at 315K vs. 526K previous. The odds for a 75 bps September Fed rate hike have dropped sharply to around 55% following Friday’s US jobs data vs. 75% pre-NFP.
All eyes will remain on the energy crisis in the old continent ahead of the critical ECB rate hike decision this Thursday. The central bank remains on track for a 75 bps rate hike this week, with markets wagering an 80% probability. The ECB policy announcement is widely anticipated and, therefore, investors could see the expected 75 bps rate hike as a good EUR selling opportunity.
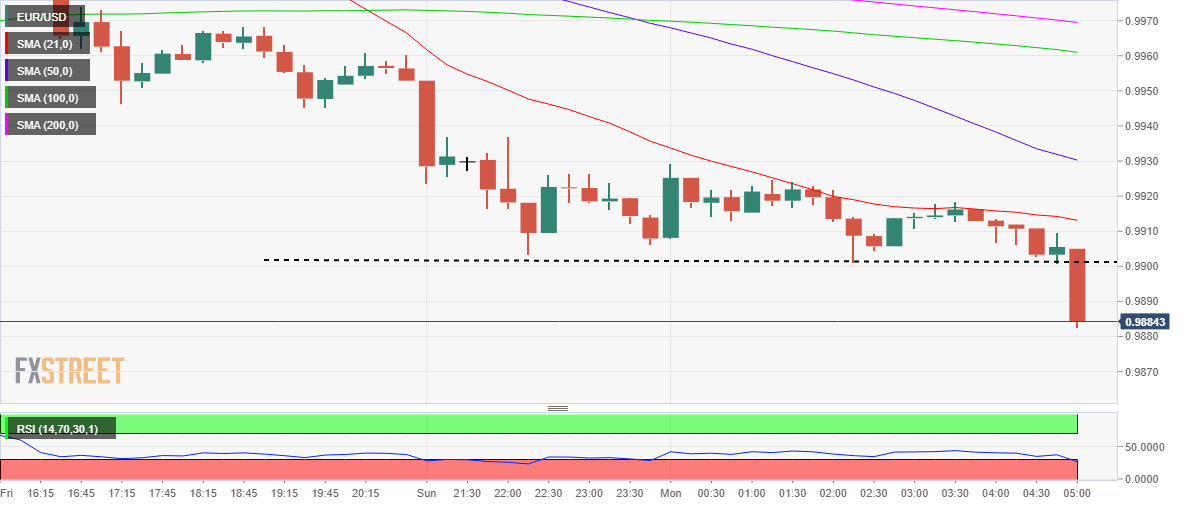
EUR/USD: 15-minutes chart
EUR/USD: Technical levels
-
06:01
Singapore Retail Sales (MoM) above expectations (-0.4%) in July: Actual (0.6%)
-
06:00
Singapore Retail Sales (YoY) came in at 13.7% below forecasts (16.5%) in July
-
05:52
Steel price licks its wounds as recession fears escalate
- Steel price struggles to defend the corrective pullback as China-linked pessimism spreads.
- US holidays help countertrend traders amid a sluggish session.
- Typhoon in South Korea, emission-led production halt in China battle fears of economic slowdown.
Steel price portrays a corrective pullback around the monthly low but stays pressured amid an inactive trading session during the early Monday morning in Europe.
The metal’s recent rebound could be linked to the fears of more supply crunch as South Korea prepares for a very strong typhoon. Also likely to have triggered the rebound is the cautious optimism in the market after the previous day’s downbeat US jobs report.
US employment data marked mixed readings as the headline Nonfarm Payrolls (NFP) rose past 300K forecast to 315K, versus 526K prior, but the Unemployment Rate rose to 3.7% compared to 3.5% expected and prior. Further details reveal that the Average Hourly Earnings reprinted 5.2% growth for August, a bit lesser than the 5.3% market consensus. Also, Factory Orders dropped to -1.0% for July compared to 0.2% forecasts and 1.8% in previous readings.
Additionally favoring the metal price could be the recent slowdown in the Chinese production of the metal as Beijing pushes factories for emission targets. On the same line are covid-led lockdowns in the key steel-producing regions of China.
Even so, the recession fears emanating from the European energy crisis join the coronavirus woes in Beijing to weigh on the metal prices. Furthermore, hawkish central bank moves and the Sino-American tussles are extra challenges for the metal traders.
Earlier in the day, China’s Caixin Services PMI dropped to 55.0 in August, versus 55.5 in prior readings. In doing so, the private activity gauge traced the major PMIs from the dragon nation that recently signaled pessimism for the world’s largest industrial player.
Moving on, a lack of major data/events and the US holiday may test the steel traders but the bears are likely to keep the reins.
-
05:28
GBP/USD renews two-year low under 1.1500, UK leadership contest results eyed
- GBP/USD prints seven-day downtrend as bears attack the year 2020 bottom.
- Firmer DXY joins fears of worsening energy crisis to exert downside pressure.
- Liz Truss’ plan to overcome cost of living crisis gains more accolades than Rishi Sunak’s reasoning.
- Any recovery on Truss’ selection appears tepid amid US holiday, broad risk-off favoring the greenback.
GBP/USD slides to the fresh low since March 2020 as the cable traders await the UK PM Leadership results on Monday. That said, the cable trades take offers near 1.1470 heading into the London open.
It’s worth noting that the pre-result anxiety joins the fears of a worsening energy crisis in the UK and more noise surrounding the US-China tussle to exert downside pressure on the pair. However, the Labor Day holiday in the US appears to challenge the momentum traders.
That said, the energy woes escalated after the Group of Seven (G7) nations agreed on capping the price of Russian oil in the international markets. Following that, Moscow halted energy supplies to the European Union (EU) through Nord Stream 1 pipeline, citing a ‘leak’, during the weekend.
Alternatively, Politico ran a story mentioning that Russia’s Gazprom said on Saturday it would increase its shipments of gas to Europe via Ukraine, citing media reports.
Even so, a likely halt in the US-Iran nuclear talks also amplifies oil woes for the old continent, as well as for the globe. “Iran nuclear talks stall again after latest response from Tehran,” said Bloomberg.
Elsewhere, US President Joe Biden’s administration poured cold water on the face of expectations that the US may ease/remove the Trump-era tariffs on China. “The Biden administration will allow Trump-era tariffs on hundreds of billions of dollars of Chinese merchandise imports to continue while it reviews the need for the duties,” said Bloomberg.
At home, Liz Truss’ pre-result promise of dragging the UK out of the energy bill crisis appears to put her ahead of Rishi Sunak, which in turn could help the GBP/USD prices if she becomes the next British Prime Minister. However, her plans to review the Bank of England (BOE) and more stimulus fail to impress economists like Sunak and hence can keep the pair depressed after an initial rebound. The Tory Leadership Contest outcome will be around 23:00 GMT on Monday and will be important for the pair traders to watch for short-term directions.
It should be observed that the recent retreat in the hawkish Fed bets appears to stop the US dollar bulls amid a sluggish session, despite refreshing the multi-year high. That said, the US employment data marked mixed readings as the headline Nonfarm Payrolls (NFP) rose past 300K forecast to 315K, versus 526K prior, but the Unemployment Rate rose to 3.7% compared to 3.5% expected and prior. Further details reveal that the Average Hourly Earnings reprinted 5.2% growth for August, a bit lesser than the 5.3% market consensus. Also, Factory Orders dropped to -1.0% for July compared to 0.2% forecasts and 1.8% in previous readings.
Technical analysis
March 2020 low surrounding 1.1410 appears the last defense for the GBP/USD bulls, a break of which could make the pair vulnerable to declining towards the lows marked during 1985.
-
05:19
USD/INR Price News: Advances towards 80.00 amid upbeat DXY, US ISM Services PMI eyed
- USD/INR is aiming to overstep the 79.68-79.97 high volume area as DXY has strengthened.
- The US NFP remained upbeat despite Fed’s caution over softening labor market.
- India has now become the 5th largest world economy after beating the UK economy.
The USD/INR pair is attempting to cross the prior balanced area that is placed in a narrow range of 79.68-79.97 amid a firmer US dollar index (DXY). The major is expected to recapture the psychological resistance of 80.00 as investors are underpinning the DXY amid a risk-off market mood
On a broader context, the DXY is delivering a stellar performance after the release of the upbeat US Nonfarm Payrolls (NFP) data. The US economy created 315k jobs in August vs. the expectation of 300k and the prior release of 526k. It is worth noting that the Federal Reserve (Fed) warned about softening labor data, however, no downbeat signals have been displayed by the labor market yet despite soaring interest rates. So, the DXY is enjoying gains as the US economy is rock-solid.
The US markets will remain closed on Monday on account of Labor Day. Therefore, investors’ entire focus will remain on the US ISM Services PMI data, which will release on Tuesday. The economic data is expected to decline to 54.9 against the prior release of 56.7.
On the Indian rupee front, investors should understand the fact that the Indian rupee is declining seldom in comparison with the mighty DXY. However, it has displayed a stellar performance against other-risk sensitive currencies. The upbeat macro fundamentals are supporting the Indian rupee. Oil prices are declining on expectations of global recession fears. As India is a leading importer of black gold, a significant fall in oil prices is trimming India’s fiscal deficit.
Also, India has become the 5th largest world economy after beating the UK economy. As per the April-June quarter, India’s Gross Domestic Product (GDP) numbers grew by 13.5%.
-
05:06
Gold Price Forecast: XAU/USD steadies above $1,700, falling wedge, energy crisis in focus
- Gold price struggles to justify falling wedge breakout as US holiday limits trading moves.
- DXY jumps to fresh high in 20 years before trading sideways.
- EU’s energy crisis, Sino-American tussles join softer China data to weigh on prices.
- Mixed US jobs report triggered corrective bounce, central bankers are in focus ahead.
Gold price (XAU/USD) treads water at around $1,710 during Monday’s Asian session as the US holiday challenges momentum traders. In doing so, the bright metal ignores the firmer US Dollar, as well as challenges to the risk appetite.
That said, the US Dollar Index (DXY) prints mild gains as it seesaws around 110.00 after rising to the fresh high since 2002 during the early Asian session. The underlying reason should be the weekend headlines surrounding the escalating energy crisis in Europe, as well as the US-China tension.
On late Friday, the Group of Seven (G7) nations agreed on capping the price of Russian oil in the international markets. Following that, Moscow halted energy supplies to the European Union (EU) through Nord Stream 1 pipeline, citing a ‘leak’, during the weekend. It’s worth noting, however, that Politico ran a story mentioning that Russia’s Gazprom said on Saturday it would increase its shipments of gas to Europe via Ukraine, citing media reports. In addition to the Russia-linked energy problems and a likely recession due to the same, a halt in the US-Iran nuclear talks also amplifies oil woes for the old continent, as well as for the globe. “Iran nuclear talks stall again after latest response from Tehran,” said Bloomberg.
On a different page, US President Joe Biden’s administration poured cold water on the face of expectations that the US may ease/remove the Trump-era tariffs on China. “The Biden administration will allow Trump-era tariffs on hundreds of billions of dollars of Chinese merchandise imports to continue while it reviews the need for the duties,” said Bloomberg.
It’s worth noting that the greenback’s gauge versus the six major currencies, namely the DXY, eased late Friday after the US employment data flashed mixed numbers for August.
US employment data marked mixed readings as the headline Nonfarm Payrolls (NFP) rose past 300K forecast to 315K, versus 526K prior, but the Unemployment Rate rose to 3.7% compared to 3.5% expected and prior. Further details reveal that the Average Hourly Earnings reprinted 5.2% growth for August, a bit lesser than the 5.3% market consensus. Also, Factory Orders dropped to -1.0% for July compared to 0.2% forecasts and 1.8% in previous readings.
Amid these plays, S&P 500 Futures print mild gains while the US holiday limits the moves of the US Treasury yields.
Moving on, the US holiday could restrict XAU/USD moves but challenges to the risk appetite may test the buyers.
Technical analysis
A clear breakout of the eight-day-old falling wedge joins firmer RSI and bullish MACD signals to keep gold buyers hopeful. That said, a convergence of the 50-SMA and 61.8% Fibonacci retracement level of July-August upside, near $1,729, appears immediate hurdle for the XAU/USD bulls to watch.
Following that, the 200-SMA and the late August swing high, respectively near $1,753 and $1,766 in that order, will be important for the bullion traders to aim.
It should be noted that the falling wedge confirmation signals the theoretical target of $1,778.
Meanwhile, pullback moves remain harmless until staying beyond the stated wedge’s resistance line, now support around the $1,700 round figure.
Should the metal price fails to rebound from the $1,700 support, the yearly low marked in July at around $1,680 will be eyed by the bears.
Gold: Four-hour chart
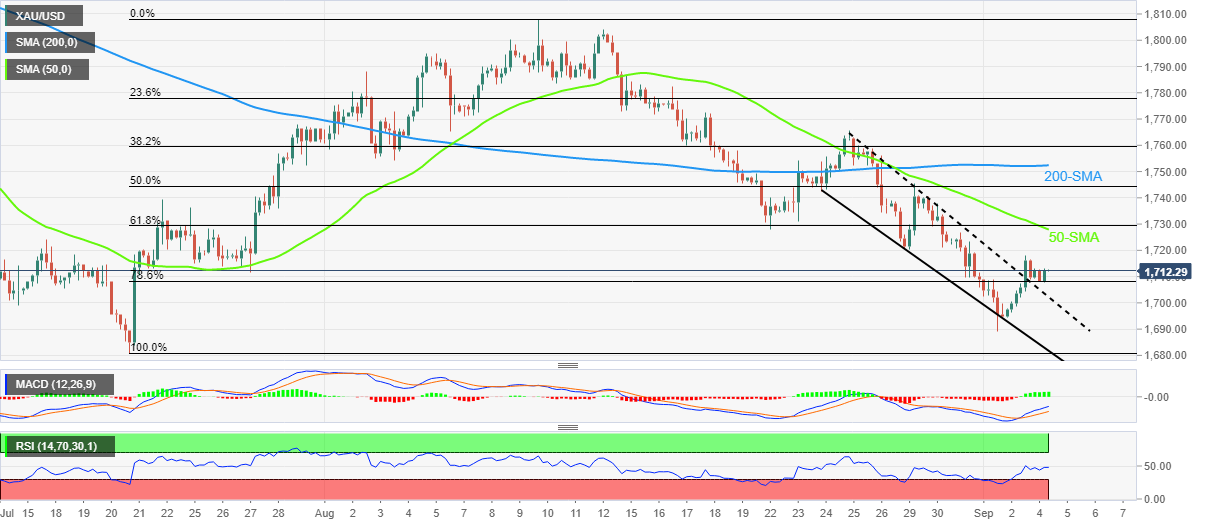
Trend: Further recovery expected
-
04:38
EUR/USD juggles around 0.9900, downside looks likely on potential German energy crisis
- EUR/USD is oscillating in a narrow range of 0.9906-0.9935 after a gap down open ahead of ECB policy.
- Gazprom's promise of energy supply is insufficient to offset energy supply cut from Nord Stream 1 pipeline.
- The DXY has refreshed its two-decade high at 110.09 on upbeats US NFP data.
The asset is witnessed a steep fall continuously after the release of the eurozone Harmonized Index of Consumer Prices (HICP). The preferred inflation indicator by the European Central Bank (ECB) landed at 9.1% led by the soaring energy crisis in the eurozone. The escalation of unscheduled maintenance of the Nord Stream 1 pipeline under the Baltic Sea due to leakage issues triggered an energy crisis. To offset the same, Russian energy giant, Gazprom said it will increase its shipments of gas to Europe via Ukraine, according to Politico.
Well, this doesn’t seem to be a permanent solution for energy supplies. Adding to that, the gas supplies en-routing through Ukraine could be troublesome as things are still complicated between Moscow and Kyiv.
Apart from that, the event of an interest rate decision by the ECB scheduled on Thursday has kept the investors on the tenterhooks. The ECB has remained laggard in hiking interest rates and is now forced to sound extremely hawkish to cool down the heated inflation. ECB President Christine Lagarde is expected to announce an interest rate hike by 50 basis points (bps) escalating the critical rates to 1%.
As US markets will remain closed on account of Labor Day, risk sentiment is going to drive the FX domain. Investors should be noted that the US dollar index (DXY) has refreshed its two-decade high at 110.09. The release of the upbeat US Nonfarm Payrolls (NFP) data strengthened the DXY. This will support the Federal Reserve (Fed) while handling the tedious job of slowing down inflationary pressures.
-
04:25
S.Korea FinMin Choo vows pre-emptive action to stabilize markets
South Korean Finance Minister Choo Kyung-ho said on Monday that the government will take action if needed to stabilize markets in a pre-emptive manner.
He added that they are closely watching the fx market.
Market reaction
USD/KRW was last seen trading at 1,371.55, 0.65% higher on the day. These comments come after the South Korean won (KRW) extends its bearish moemntum to the weakest level since April 2009 against the US dollar at 1,371.96.
-
04:03
PBOC will let USD/CNY surpass 7 mark – Bloomberg
“The yuan is set to slide past 7 per dollar with scarcely a murmur as a range of metrics show the currency would still be relatively expensive against its non-dollar peers,” Bloomberg reports, citing analysts.
Additional quotes
“The authorities will allow the currency to weaken past that key psychological barrier and merely seek to prevent a rapid decline that may cascade into a disorderly selloff.”
“While allowing the yuan to slide beyond 7, the central bank may continue “to warn off aggressive yuan bears via explicit communication and implicit interventions.”
“Economists are also watching to see whether its slide deters the PBOC from further easing policy to support a slowing economy.”
Related reads
- USD/CNH renews two-year top near 6.9400 on downbeat China data
- China's Caixin/ S&P Global Services PMI drops to 55.0 in August vs. 55.5 previous
-
03:55
NZD/USD declines after facing barricades around 0.6100 on downbeat China’s Services PMI data
- NZD/USD has sensed selling pressure around 0.6100 as China’s Services PMI has trimmed.
- A follow-up decline in China’s Services PMI after displaying weak Manufacturing PMI has weakened kiwi.
- Expectations of the Fed’s third consecutive rate hike by 75 bps are gaining traction.
The NZD/USD pair has witnessed selling pressure after attempting to cross the immediate hurdle of 0.6100 in the Asian session. In early Tokyo, the asset opened lower than Friday’s closing price but found buyers as oscillators turned oversold on a lower timeframe. However, the follow-buying buying has failed to cross the critical hurdle of 0.6100 and is declining firmly to test the previous week’s low around 0.6050.
The pair have witnessed a steep fall after the release of downbeat China’s Caixin Services PMI data. The economic data landed at 55, lower than the prior release of 55.5. As the Chinese economy is facing a slowdown amid a resurgence of Covid-19, again and again, PMI activities are facing severe heat. Therefore, a decline in Services PMI was highly expected.
Last week, China’s Caixin Manufacturing PMI data also remained weaker. The economic data was trimmed to 49.5 against the consensus of 50.2 and the prior release of 50.4. As lockdown curbs are escalating in the Chinese economy, economic activities are facing wrath. It is worth noting that New Zealand is a leading trading partner of China and a slowdown in Chinese activities could weaken the kiwi’s appeal.
Meanwhile, the US dollar index (DXY) has refreshed its two-decade high at 110.09 as odds of a consecutive 75 basis points (bps) interest rate hike by the Federal Reserve (Fed) has advanced. Soaring employment additions in the US labor market have strengthened the appeal for more bumper rate hikes. However, the Average Hourly Earnings data remained stagnant. The labor cost index landed at 5.2, similar to its prior close but lower than the consensus of 5.3%. Optimism brewed on stellar job creation could be offset by subdued labor cost data.
-
03:53
Biden contemplates moves to restrict US investment in Chinese tech companies
Citing people familiar with the matter, Bloomberg carried a story over the weekend that US President Joe Biden’s administration is considering restricting investment in Chinese technology companies.
Key takeaways
“The investment curbs taking shape would likely come as an executive order to be signed by Biden in the coming months.”
“US Department of Commerce might place further restrictions on chips used for artificial intelligence computing.”
“White House is in discussions with the US Congress on legislation requiring companies to disclose planned investments in certain Chinese industries.”
Market reaction
Asian stocks are in a sea of red at the start of the week, despite a minor uptick in the S&P 500 futures. Investors assess the risks of a global recession, in the face of the European energy criss and US-China tensions.
-
03:49
USD/JPY Price Analysis: Friday’s Doji, overbought RSI probe bulls at 24-year high above 140.00
- USD/JPY picks up bids to print mild gains around 24-year high.
- Bearish candlestick, overbought RSI (14) signal pullback moves amid sluggish session.
- Ascending trend line from April, June 1998 high lure the bulls.
- Sellers need validation from a three-week-old ascending support line.
USD/JPY bulls seem running out of steam at the highest levels since 1998 during Monday’s Asian session. That said, the Doji candlestick and overbought RSI (14) appear to challenge the yen pair’s upside momentum near 140.35 by the press time.
It’s worth noting, that the pullback moves may aim for the July month top near 139.40.
Even so, the sellers are likely to remain away unless witnessing a clear downside break of the three-week-old support line, at 138.65 by the press time.
In a case where the USD/JPY prices decline below 138.65, the 20-DMA and the early August swing high, respectively around 136.60 and 135.55, will be in focus.
On the contrary, an upward sloping resistance line from late April, close to 144.50 by the press time, appears immediate hurdle for the USD/JPY bulls to watch during the further upside moves.
Also acting as the resistances are the highs marked during July 1998 and October 1998, close to 146.80 and 147.70 in that order.
USD/JPY: Daily chart
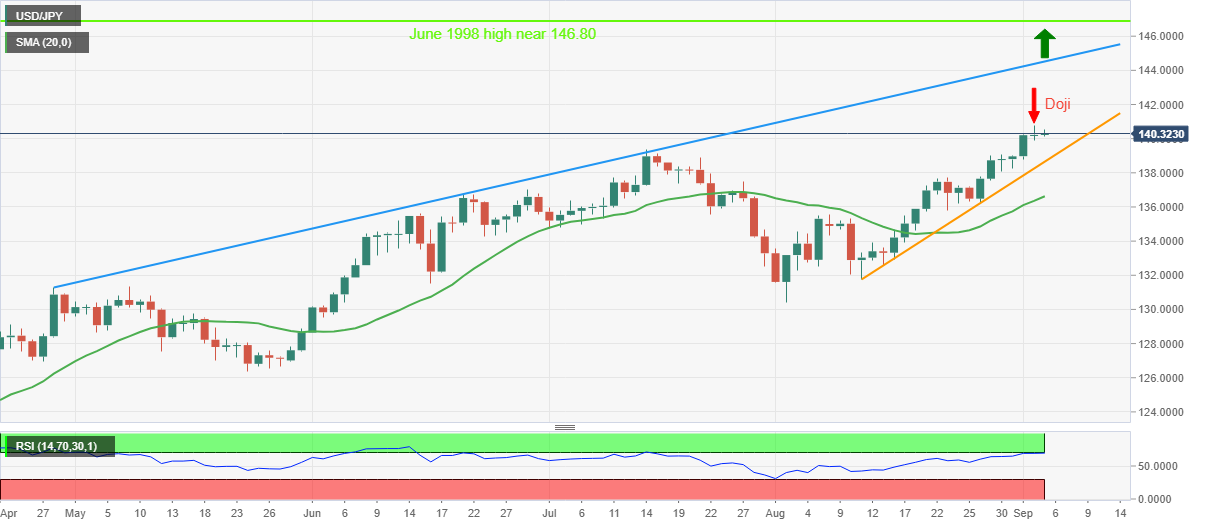
Trend: Pullback expected
-
03:26
USD/CNH renews two-year top near 6.9400 on downbeat China data
- USD/CNH takes the bids to refresh multi-day high, prints three-day uptrend.
- China Caixin Services PMI eased to 55.00 in August.
- Escalating US-China tension, fears of global recession underpin US dollar’s safe-haven demand.
- US, Canada holiday restrict market moves, mixed US jobs report also test buyers.
USD/CNH marches to the highest levels since August 2020 as a risk-aversion wave joins softer China data to propel the offshore Chinese yuan (CNH) pair. That said, the quote rises to 6.9375 during Monday’s Asian session.
That said, China’s Caixin Services PMI dropped to 55.0 in August, versus 55.5 in prior readings. In doing so, the private activity gauge traced the major PMIs from the dragon nation that recently signaled pessimism for the world’s largest industrial player.
It should be noted that the US Dollar Index (DXY) rose to a fresh high since 2002 while piercing the 110.00 threshold, around 109.98 by the press time, as traders rush towards the risk safety amid fears of recession and the US-China tussles.
Economic slowdown woes could be linked to the recent energy crisis emanating from Europe. Group of Seven (G7) nations agreed on capping the price of Russian oil in the international markets. Following that, Moscow halted energy supplies to the European Union (EU) through Nord Stream 1 pipeline, citing a ‘leak’, during the weekend. It’s worth noting, however, that Politico ran a story mentioning that Russia’s Gazprom said on Saturday it would increase its shipments of gas to Europe via Ukraine, citing media reports. In addition to the Russia-linked energy problems and a likely recession due to the same, a halt in the US-Iran nuclear talks also amplifies oil woes for the old continent, as well as for the globe. “Iran nuclear talks stall again after latest response from Tehran,” said Bloomberg.
Elsewhere, US President Joe Biden’s administration poured cold water on the face of expectations that the US may ease/remove the Trump-era tariffs on China. “The Biden administration will allow Trump-era tariffs on hundreds of billions of dollars of Chinese merchandise imports to continue while it reviews the need for the duties,” said Bloomberg.
Furthermore, global rating agency Moody’s stated that China's property sales continue to decrease because of weak demand.
It should be noted that the US dollar lost upside momentum after Friday’s mixed US jobs report. US employment data marked mixed readings as the headline Nonfarm Payrolls (NFP) rose past 300K forecast to 315K, versus 526K prior, but the Unemployment Rate rose to 3.7% compared to 3.5% expected and prior. Further details reveal that the Average Hourly Earnings reprinted 5.2% growth for August, a bit lesser than the 5.3% market consensus. Also, Factory Orders dropped to -1.0% for July compared to 0.2% forecasts and 1.8% in previous readings.
Even so, hawkish Fed bets and the People’s Bank of China’s (PBOC) support for the easy money, not to forget covid woes in the dragon nation, keeps favoring the USD/CNH bulls.
Technical analysis
A three-week-old bullish channel, currently between 6.9140 and 6.9900, keeps USD/CNH buyers hopeful.
-
03:07
US dollar Price Analysis: DXY bulls pushing the barriers
- US dollar reaches into the 110 area and bulls remain in control.
- The bears need to get back below 108.90 structure for the days ahead.
Following on from last week's positive close, it has been a bullish start for the week in the greenback. The US dollar has touched 110 in trade to start the week but the Shark harmonic pattern remained as a bearish feature on the charts.
DXY H4 chart
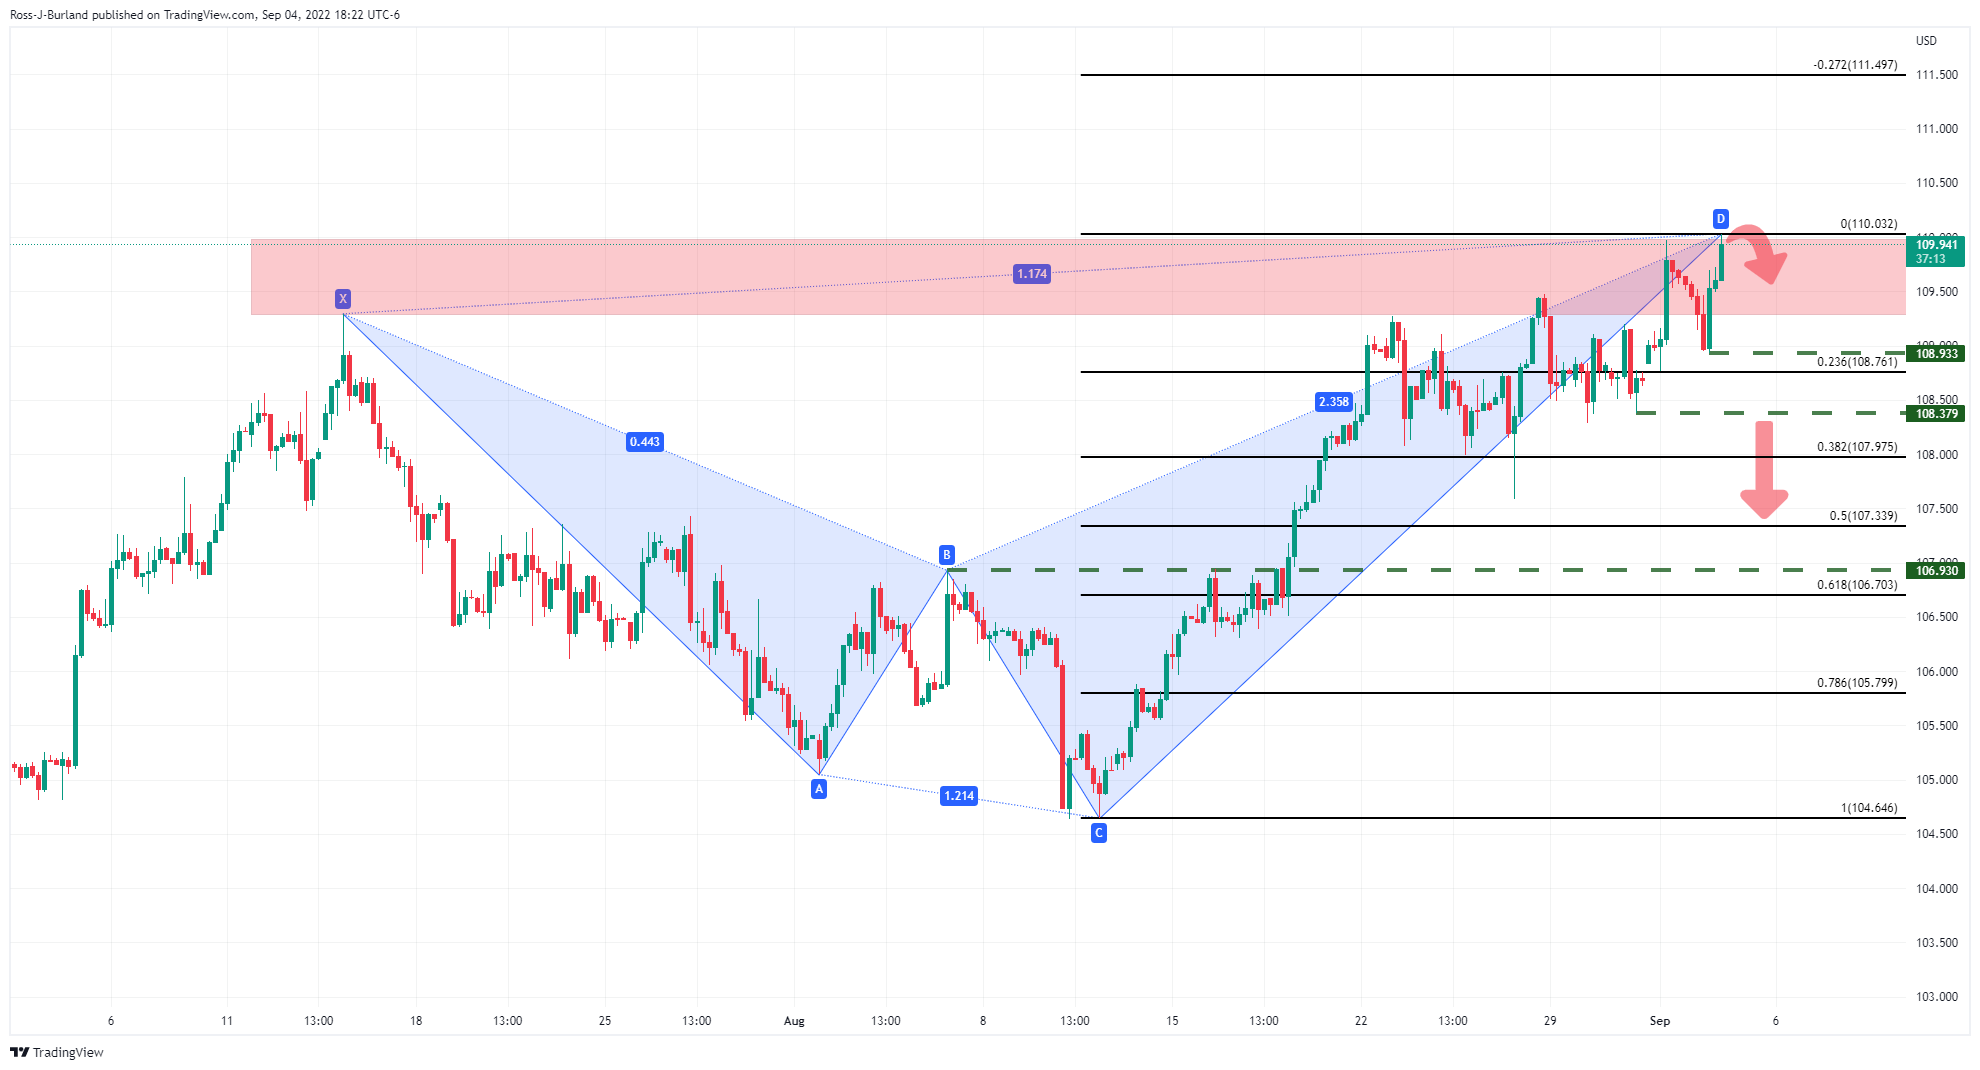
The price will need to get below the 108.90s for prospects of a deeper run through the 108's and to offer some relief, if only temporary, within the firm bullish cycle in the greenback.
With that being said, there is room for the index to run until it meets January 2002 lows at 110.98:
DXY monthly chart
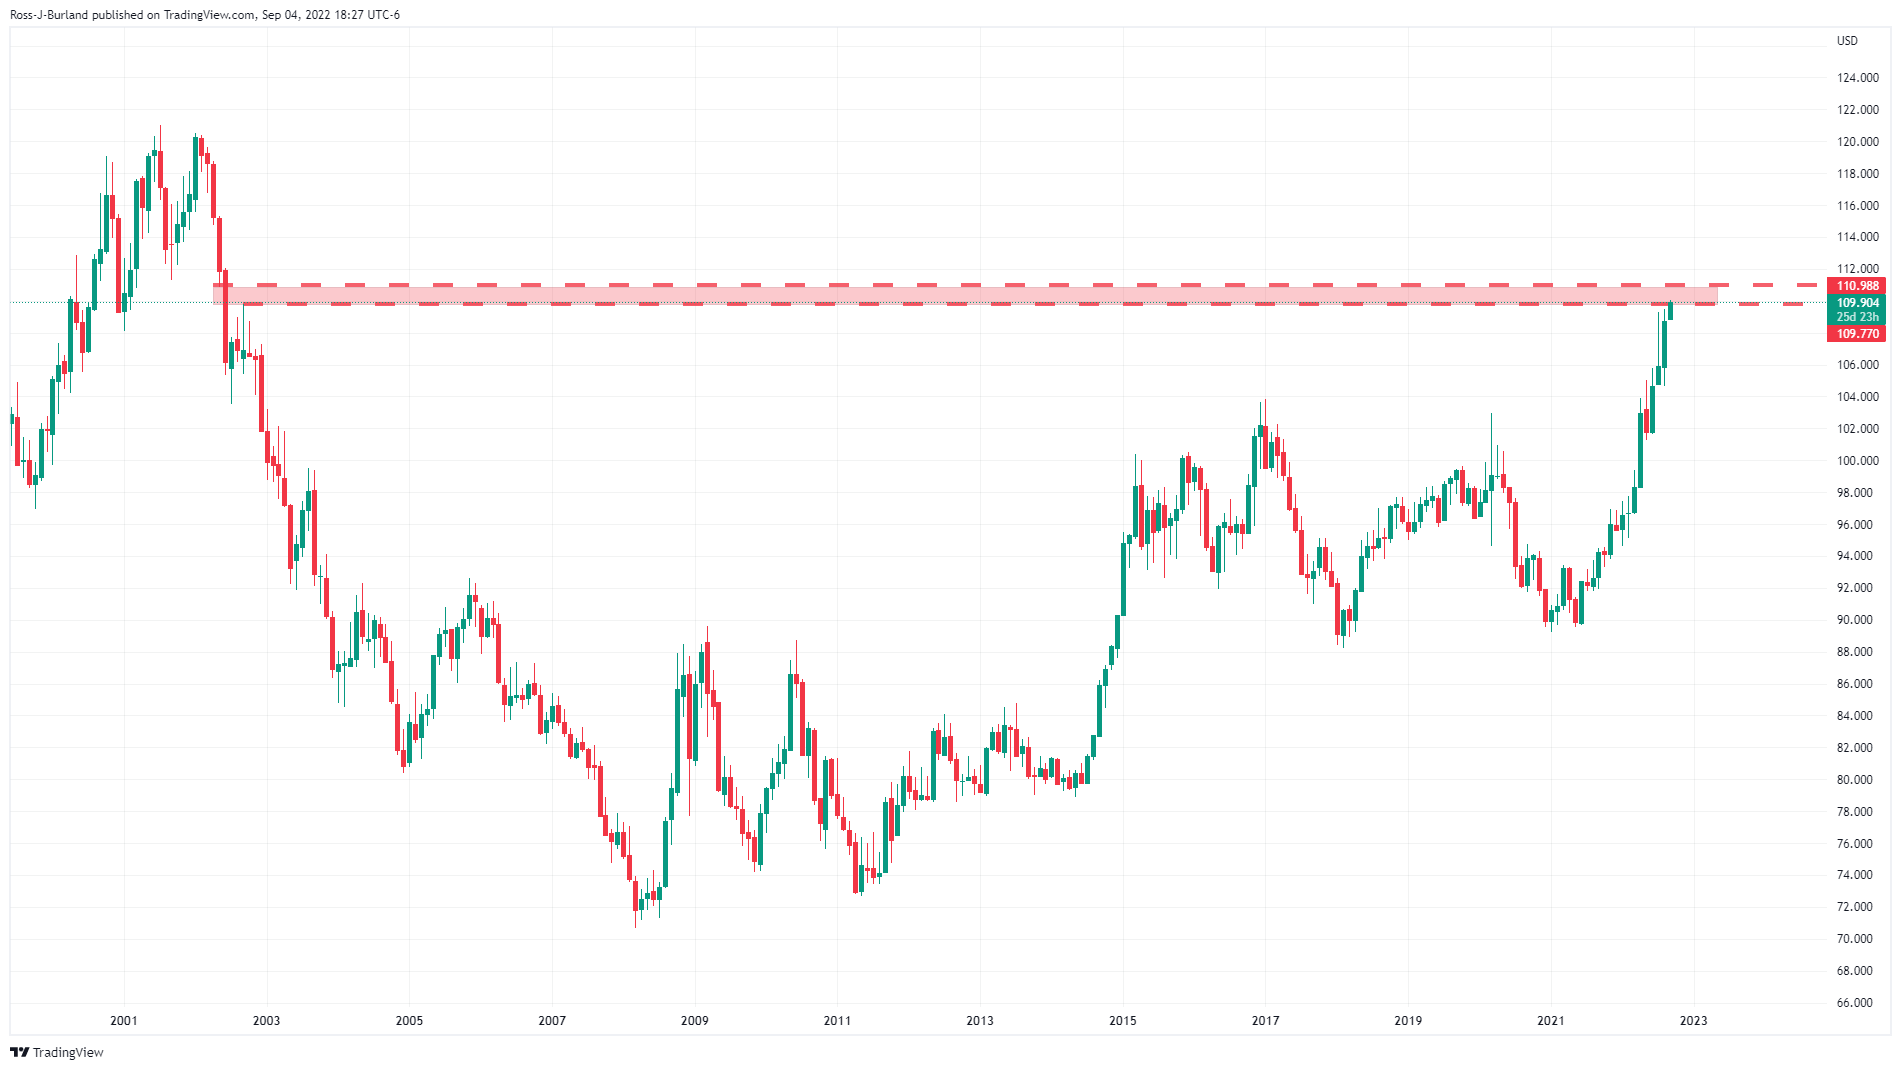
As illustrated, there is room to go to the upside given the gap that could be filled in the month ahead, if not days or weeks. Volatility in the forex space has picked up over the course of 2022 and especially into the summer months:
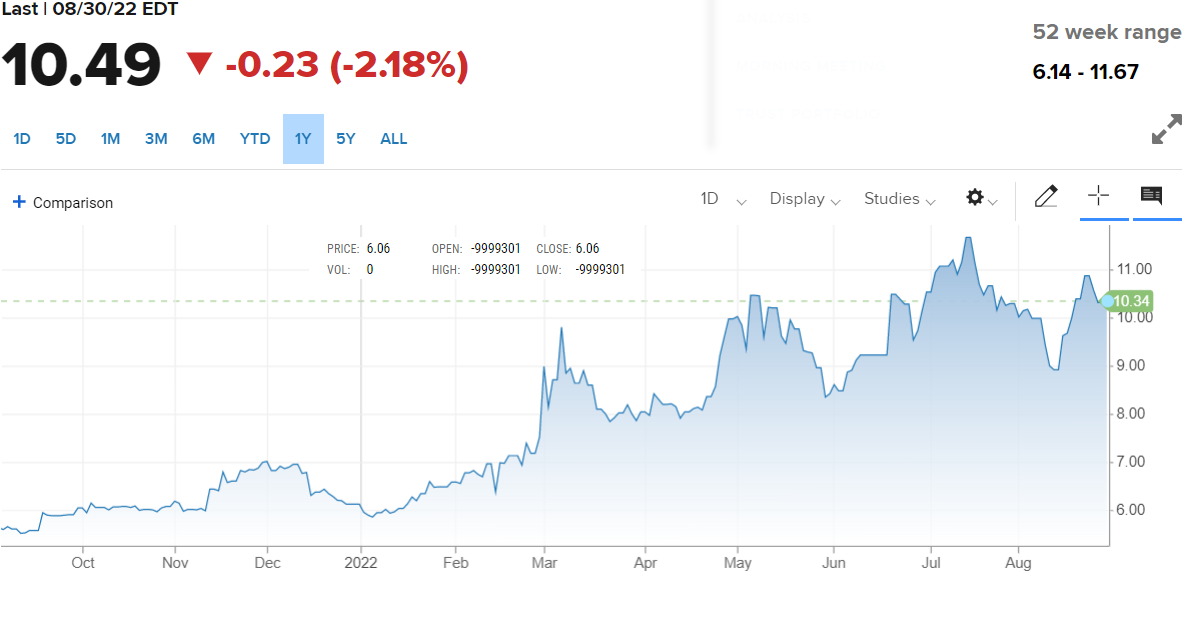
As per CNBC's DBCVIX USD Volatility Index, August has seen a pick up in volatility which could be just getting started.
-
02:58
AUD/USD sellers dominate below 0.6800 on mixed China/Aussie data, RBA eyed
- AUD/USD holds lower grounds near the lowest levels in seven weeks, reverses Friday’s gains.
- Mixed prints of the second-tier data from Australia/China, challenges to sentiment exert downside pressure.
- Holidays in the US, Canada restrict momentum ahead of the RBA, Aussie GDP.
AUD/USD takes offers to refresh intraday low near 0.6780 as bears reverse the previous day’s corrective move amid challenges to risk appetite. Also weighing the risk barometer pair are the recently flashed statistics from Australia and its biggest customer China. It should, however, be noted that a Labor Day holiday in the US and Canada restricts the market’s movement despite multiple risk-negative catalysts.
China’s Caixin Services PMI dropped to 55.0 in August, versus 55.5 in prior readings. In doing so, the private activity gauge traced the major PMIs from the dragon nation that recently signaled pessimism for the world’s largest industrial player.
At home, the AiG Performance of Construction Index and S&P Global Services PMI for August improved in August while TD Securities Inflation dropped to -0.5% during the stated monthly, versus 1.2% prior. Further, Australia’s ANZ Job Advertisements improved to 2.0% compared to -1.1% prior whereas the Company Gross Operating Profits for the second quarter (Q2) rose past 4.0% market forecast to 7.0%, compared to 10.2% previous readings.
Elsewhere, S&P 500 Futures print mild gains while the US holiday limits the moves of the US Treasury yields. Even so, risk-negative catalysts exert downside pressure on the AUD/USD prices.
The Group of Seven (G7) nations agreed on capping the price of Russian oil in the international markets. Following that, Moscow halted energy supplies to the European Union (EU) through Nord Stream 1 pipeline, citing a ‘leak’, during the weekend. It’s worth noting, however, that Politico ran a story mentioning that Russia’s Gazprom said on Saturday it would increase its shipments of gas to Europe via Ukraine, citing media reports. In addition to the Russia-linked energy problems and a likely recession due to the same, a halt in the US-Iran nuclear talks also amplifies oil woes for the old continent, as well as for the globe. “Iran nuclear talks stall again after latest response from Tehran,” said Bloomberg.
On a different page, US President Joe Biden’s administration poured cold water on the face of expectations that the US may ease/remove the Trump-era tariffs on China. “The Biden administration will allow Trump-era tariffs on hundreds of billions of dollars of Chinese merchandise imports to continue while it reviews the need for the duties,” said Bloomberg.
Talking about the data, US employment data marked mixed readings as the headline Nonfarm Payrolls (NFP) rose past 300K forecast to 315K, versus 526K prior, but the Unemployment Rate rose to 3.7% compared to 3.5% expected and prior. Further details reveal that the Average Hourly Earnings reprinted 5.2% growth for August, a bit lesser than the 5.3% market consensus. Also, Factory Orders dropped to -1.0% for July compared to 0.2% forecasts and 1.8% in previous readings.
Looking forward, the US data may restrict the market moves but the traders’ preparations for this week’s Reserve Bank of Australia (RBA) monetary policy verdict and Australia’s Q2 Gross Domestic Product (GDP) will be important to observe. Given the recent challenges for the Pacific economy, mainly emanating from China, the RBA may choose a cautious path and can disappoint AUD/USD bulls. That said, the Aussie central bank is expected to unveil 0.50% rate hike.
Technical analysis
The AUD/USD pair’s failure to cross the monthly support-turned-resistance line, near 0.6845 by the press time, during Friday’s rebound hints at the quote’s further downside targeting the yearly low of around 0.6680.
-
02:47
China's Caixin/ S&P Global Services PMI drops to 55.0 in August vs. 55.5 previous
China's Caixin/ S&P Global services PMI for August arrived at 55.0 vs. 55.5 prior, showing that the country’s services activity growth slowed in the reported month.
August survey data suggested that the upturn was supported by a solid rise in overall sales, as companies reported higher customer numbers as market conditions continued to normalize.
Wang Zhe, Senior Economist at Caixin Insight Group said, “The service sector’s recovery from a widespread outbreak of Covid-19 earlier in the year continued in spite of new flare-ups.”
"Both supply and demand in the sector expanded. The services PMI and the gauge for total new business fell slightly from July but stayed well above 50. Although some firms mentioned that the recent Covid outbreaks affected their operations, the majority reported that business improved. By comparison, new export business fell for the eighth straight month as the pandemic continued to weigh on overseas demand.,” Wang added.
AUD/USD drops below 0.6800
The weak print of the Chinese Services PMI added to the weight on the aussie dollar, as AUD/USD is trading at 0.6784, down 0.32% on the day, at the time of writing.
-
02:45
China Caixin Services PMI down to 55 in August from previous 55.5
-
02:44
Australia TD Securities Inflation (YoY) fell from previous 5.4% to 4.9% in August
-
02:44
Australia ANZ Job Advertisements: 2% (August) vs -1.1%
-
02:38
S&P 500 Futures ignore energy woes to print mild gains amid US/Canada holidays
- Market sentiment dwindles amid extended holidays in the US, Canada.
- Easing hawkish Fed bets post NFP seems favoring cautious optimism despite worsening recession woes.
- US-China jitters also acts as a risk-negative catalyst but lack of market participation probes bears.
- Yields dropped after Friday’s mixed US jobs report, DXY refreshes 20-year high.
Traders struggled for clear directions during early Monday as mildly positive stock futures contradict the risk-negatives catalysts concerning Europe, China and the US. Also challenging the market movement is the Labor Day holiday in the US and Canada.
While portraying the mood, the S&P 500 Futures print 0.22% intraday gains around 3,935, consolidating recent losses around a seven-week low. However, the US Dollar Index (DXY) refreshed the 20-year high to 110.03 even as there was no major move on the bond front.
It should be noted that the US 10-year Treasury yields marked a nearly 2.0% daily loss the previous day after the US employment data disappointed the greenback bulls. However, the fears relating to the US-China tussles and energy crisis in the bloc seem to exert downside pressure on the market’s movement.
US employment data marked mixed readings as the headline Nonfarm Payrolls (NFP) rose past 300K forecast to 315K, versus 526K prior, but the Unemployment Rate rose to 3.7% compared to 3.5% expected and prior. Further details reveal that the Average Hourly Earnings reprinted 5.2% growth for August, a bit lesser than the 5.3% market consensus. Also, Factory Orders dropped to -1.0% for July compared to 0.2% forecasts and 1.8% in previous readings.
On Friday, the Group of Seven (G7) nations agreed on capping the price of Russian oil in the international markets. However, it appeared to be a bad choice, even if its acceptance and implementation are still in limbo, as Moscow halted energy supplies to the European Union (EU) through Nord Stream 1 pipeline, citing a ‘leak’, during the weekend. It’s worth noting, however, that Politico ran a story mentioning that Russia’s Gazprom said on Saturday it would increase its shipments of gas to Europe via Ukraine, citing media reports.
In addition to the Russia-linked energy problems and a likely recession due to the same, a halt in the US-Iran nuclear talks also amplifies oil woes for the old continent. “Iran nuclear talks stall again after latest response from Tehran,” said Bloomberg.
US President Joe Biden’s administration poured cold water on the face of expectations that the US may ease/remove the Trump-era tariffs on China. “The Biden administration will allow Trump-era tariffs on hundreds of billions of dollars of Chinese merchandise imports to continue while it reviews the need for the duties,” said Bloomberg. The news magnifies the risk-off mood and exerts additional downside pressure on the market sentiment.
Moving on, chatters surrounding the energy crisis, the UK’s politics and the Sino-American tension may entertain traders ahead of the full markets.
-
02:33
Gold Price Forecast: XAU/USD pressured as US dollar catches eyes on test of 110 DXY
- Gold is losing traction on the bid in the face of a strong US dollar in Tokyo.
- The price could be headed for a test of the $1,700 level in the coming sessions.
The gold price is attempting to correct higher but has come up against a strong US dollar for the start of the week that follows Friday's mixed US labour report. At the time of writing, gold is losing highs of $1,712.66 and printing a low of $1,707.79. Meanwhile, the US dollar has captured the market's attention with the index, that measures the greenback vs. a basket of currencies, rallying to a new bull cycle high of 110.032.
The US dollar is the driving force in markets currently as traders get behind the world's reserve currency in the face of pending recessions among the world economic powerhouse economies such as China and Europe. Markets are also anticipating more to come from the Federal Reserve following Fed Chair Jerome Powell's recent remarks made at the Jackson Hole symposium in Wyoming. Powell stated that rates would need to be high "for some time" to combat stubbornly high inflation.
This environment has been weighing on the gold price and analysts at TD Securities argued that ''with every tick lower in gold prices, we continue to see odds of a major capitulation event growing, which could coincide with a break below a multi-decade uptrend in the yellow metal near $1675/oz.''
''After all, the hawkish Fed narrative may have driven money manager positioning to multi-year lows, but gold markets still feature an extremely concentrated and bloated position held by a small number of family offices and proprietary trading shops. As prices approach their pandemic-era entry levels, risks of a sharp liquidation event are growing.''
However, since the comments, the jobs data from the US offered some relief for the yellow metal. The headline was a beat but the details in the report were less inflationary and such easing of the tight labour market will help the Fed tame inflation. ''This could potentially reduce its need to tighten rates aggressively, analysts at ANZ Bank argued.
Nonfarm Payrolls showed that US hiring had climbed more than expected in August, albeit, wage growth moderated and the Unemployment Rate ticked higher. The Unemployment Rate came in at 3.7% vs. 3.5% expected and Average Hourly Earnings missed the mark as well, at 0.3% month on month vs. 0.4% expected.
However, Fed funds futures were unchanged after the jobs report and are pricing about a 75% chance that the Fed hikes rates by 75 basis points this month, according to Refinitiv data, which could be supportive for the greenback in the lead into the Federal Reserve this month. For the day ahead, we will be in thin trading due to the long North American Labor Day.
Gold technical analysis
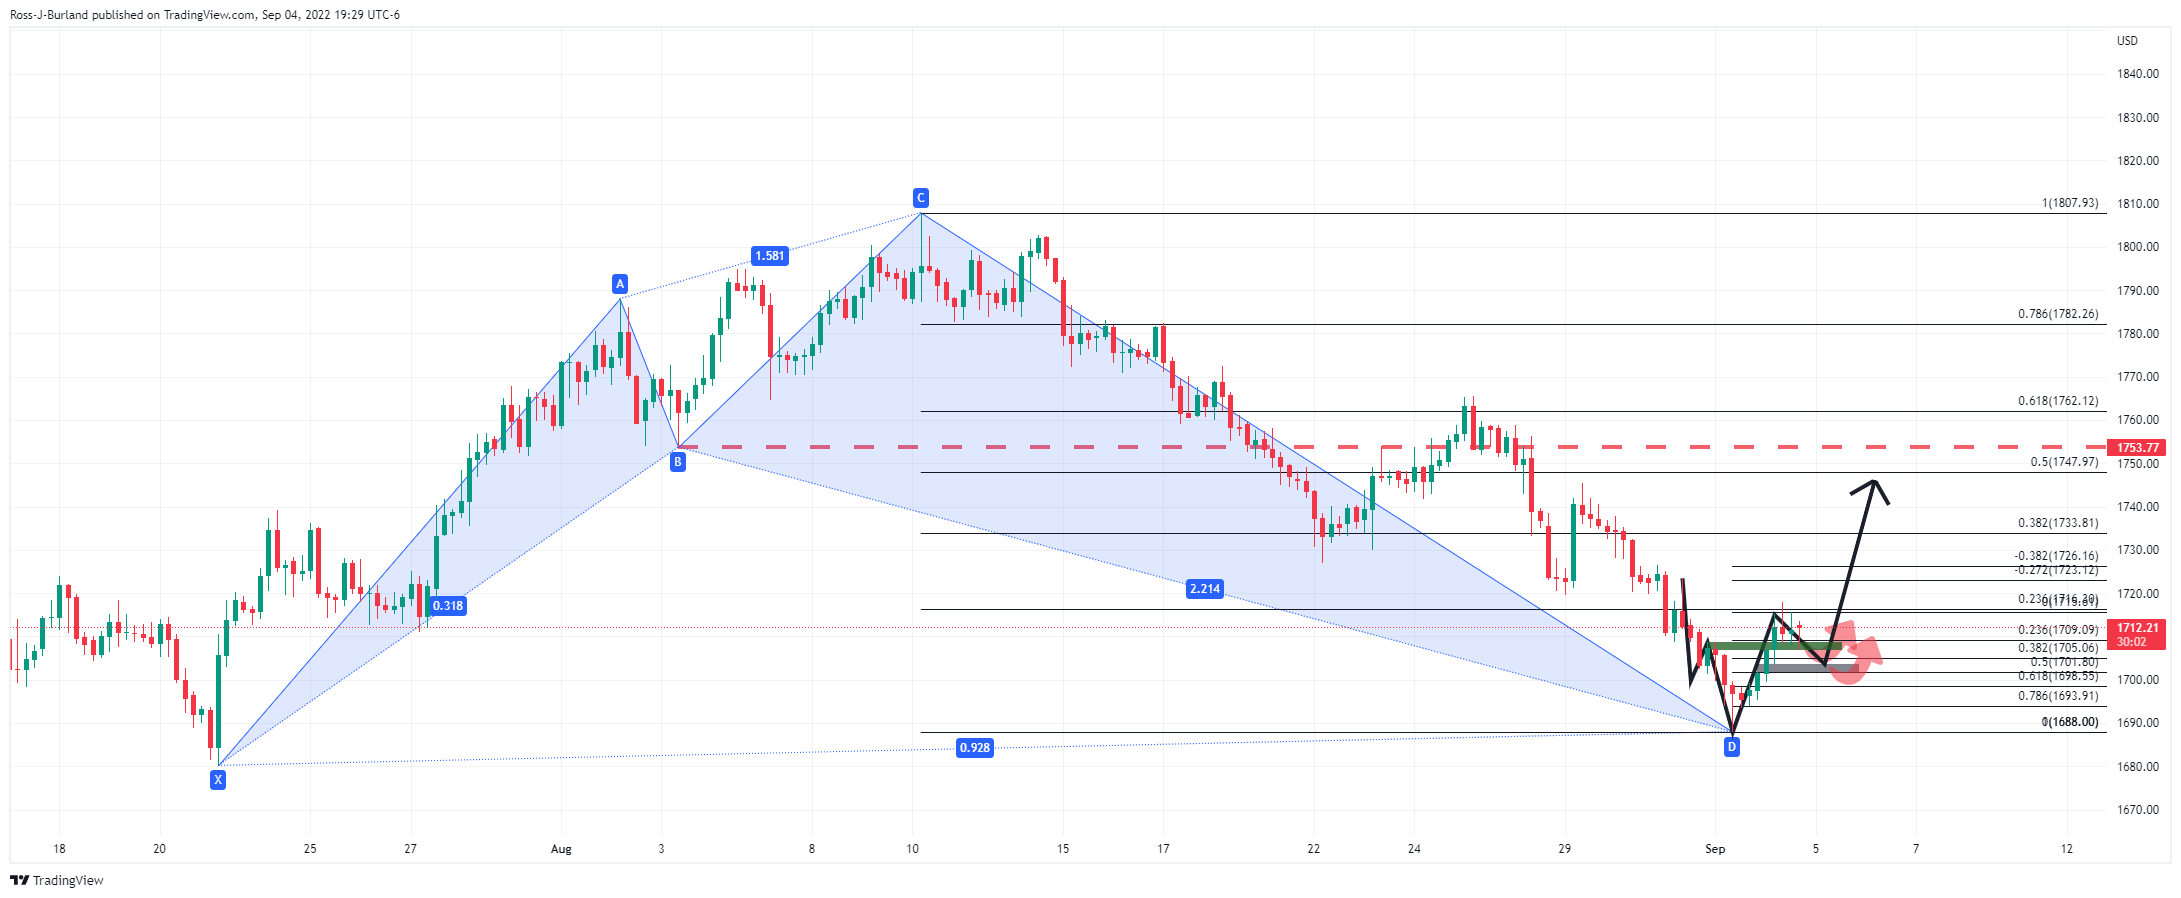
On the four-hour chart, gold is losing its traction but a 50% mean reversion could offer support as it meets the neckline of the bullish M-formation. Also, the Shark harmonic pattern is in play which is a bullish confluence that leaves scope for a deeper correction towards the neckline near $1,750.
-
02:30
Australia Company Gross Operating Profits (QoQ) came in at 7.6%, above forecasts (4%) in 2Q
-
02:19
USD/CNY fix: 6.8998 vs. estimated 6.9153
In recent trade today, the People’s Bank of China (PBOC) set the yuan (CNY) at 6.8998 vs the last close of 6.9015 and estimated 6.9153. This is a strong fix that could lend some support to the Aussie. This is the weakest fix since August 26, 2020.
About the fix
China maintains strict control of the yuan’s rate on the mainland.
The onshore yuan (CNY) differs from the offshore one (CNH) in trading restrictions, this last one is not as tightly controlled.
Each morning, the People’s Bank of China (PBOC) sets a so-called daily midpoint fix, based on the yuan’s previous day's closing level and quotations taken from the inter-bank dealer.
-
02:13
USD/CAD Price Analysis: Pierces immediate hurdle on the way to 1.3200
- USD/CAD regains upside momentum, picks up bids around seven-week high.
- Bulls attack three-day-old resistance line inside three-week-old bullish channel.
- Weekly support line, 100-SMA also restrict bear’s entry.
USD/CAD crosses a downward sloping resistance line from Thursday during Monday’s Asian session, grinds higher around the intraday top of 1.3152 by the press time.
In addition to the upside break of the short-term resistance line near 1.3150, the USD/CAD bulls also cheer firmer RSI (14), not overbought, to aim for the monthly high near 1.3210.
However, the upper line of an ascending trend channel from August 11, near the 1.3200 threshold, could test the buyers. Also challenging the upside momentum is the yearly top marked in July, around 1.3225.
It should be noted that the USD/CAD pair sellers are less likely to take the risk of entry until witnessing a clear downside break of the bullish channel’s support, at 1.3005 by the press time.
Even so, the 100-SMA level surrounding 1.2985 acts as an additional downside filter before directing the bears towards the previous monthly bottom near 1.2730.
That said, an upward sloping support line from August 25, around 1.3100, acts as short-term key support inside the bullish chart pattern.
Overall, USD/CAD remains on the bull’s radar but the upside is likely to be slow and gradual.
USD/CAD: Four-hour chart

Trend: Further upside expected
-
02:09
EUR/JPY struggles around 139.40 as Europe energy crisis dwindles, ECB hogs limelight
- EUR/JPY is facing hurdles around 139.40 as market mood sours on the Eurozone energy crisis.
- Gazprom’s promise of energy supplies won’t be able to offset the expected supply from Nord Stream.
- Japanese GDP data is expected to remain upbeat ahead.
The EUR/JPY pair is facing hurdles around 139.40 as the risk-off market tone has weakened the risk-sensitive currencies. A follow-up buying after a gap-down opening is displaying exhaustion signals as the shared currency bulls are sensing barricades around Friday’s low. The asset is expected to display topsy-turvy moves as investors have shifted their focus on the interest rate decision by the European Central Bank (ECB).
The eurozone has entered into the elite club of a 9%+ inflation rate after the US and the UK and it has left no other option for the ECB than to dictate a jumbo rate hike. Investors should be aware of the fact that the ECB has yet not hiked its interest rates like the other central banks. The ECB has announced only one rate hike of 50 basis points (bps) yet, other central banks are approaching towards conclusion fastly.
The announcement of increasing gas supplies to eurozone is bewildering the market participants. After unscheduled maintenance of the Nord Stream 1 pipeline to Germany, which was expected to conclude on Saturday, escalated due to requirements for more maintenance. However, the Russian energy giant, Gazprom will increase its shipments of gas to Europe via Ukraine, according to Politico. The company said it would ship some 42.7 million cubic meters of natural gas through Ukraine to Europe. Its delivery from Ukraine is creating havoc for the market participants.
Meanwhile, Japanese Gross Domestic Product (GDP) data will also remain a key event for investors. The quarterly GDP is expected to improve to 0.7% against the prior release of 0.5%. While the annualized data is seen as extremely higher at 2.9% vs. 2.2% recorded earlier.
-
02:04
Australia TD Securities Inflation (MoM): -0.5% (August) vs previous 1.2%
-
02:04
New Zealand ANZ Commodity Price came in at -3.3% below forecasts (-1.3%) in August
-
01:50
USD/CHF leans bullish above 0.9800 on firmer options market signals, Swiss GDP eyed
USD/CHF grinds higher around 0.9830, picking up bids to reverse the previous day’s pullback from a seven-week top, amid broad US dollar strength.
Also keeping the pair buyers hopeful are the options market’s signals, as well as optimism ahead of the second quarter (Q2) Swiss GDP, up for publishing on Monday.
It’s worth noting that the one-month risk reversal (RR), the spread of call versus puts, of USD/CHF printed the third weekly gain with the latest figures being 0.110. The daily RR, however, snapped a four-day uptrend with the -0.065 mark for Friday, per Reuters data.
Although the daily RR signals a corrective pullback of the USD/CHF pair, the strength of the weekly RR and broad challenges to risk keeps the pair buyers hopeful ahead of the key data.
Also read: USD/CHF advances towards a six-week high near 0.9860 ahead of US ISM Services PMI
-
01:37
EUR/USD Price Analysis: Bears have a bumpy road beyond 0.9860
- EUR/USD takes offers to attack fortnight-old horizontal support comprising yearly low.
- Descending trend line from mid-July, 61.8% FE also challenge the bears.
- Bulls need validation from 100-SMA to retake control.
EUR/USD sellers flirt with the yearly low surrounding the 0.9900 threshold amid mixed concerns and the US Labor Day holiday on Monday. That said, the major currency pair seesaws around 0.9915-20 during the Asian session.
A two-week-old horizontal support area near 0.9910-9900 appears the tough nut to crack for the pair sellers even as the bearish MACD signals hint at the further downside. Also favoring the quote’s south-run is the descending RSI (14) line, not oversold.
It should, however, be noted that the downside break of the 0.9900 round figure won’t be enough to please the EUR/USD bears as a descending support line from mid-July, near 0.9880 could challenge the pair’s additional south-run.
Even if the quote drops below 0.9880, the likely oversold RSI conditions at that point could join the 61.8% Fibonacci Expansion (FE) of August 15-26 moves, near 0.9860, to restrict the pair’s further weakness.
In a case where EUR/USD breaks the 0.9860 support, it becomes vulnerable to testing the October 2002 lows near 0.9685.
Alternatively, recovery remains elusive until crossing the 100-SMA hurdle surrounding 1.0050.
Following that, the late July swing low near 1.0100 could test the EUR/USD upside before giving control to the bulls.
EUR/USD: Four-hour chart
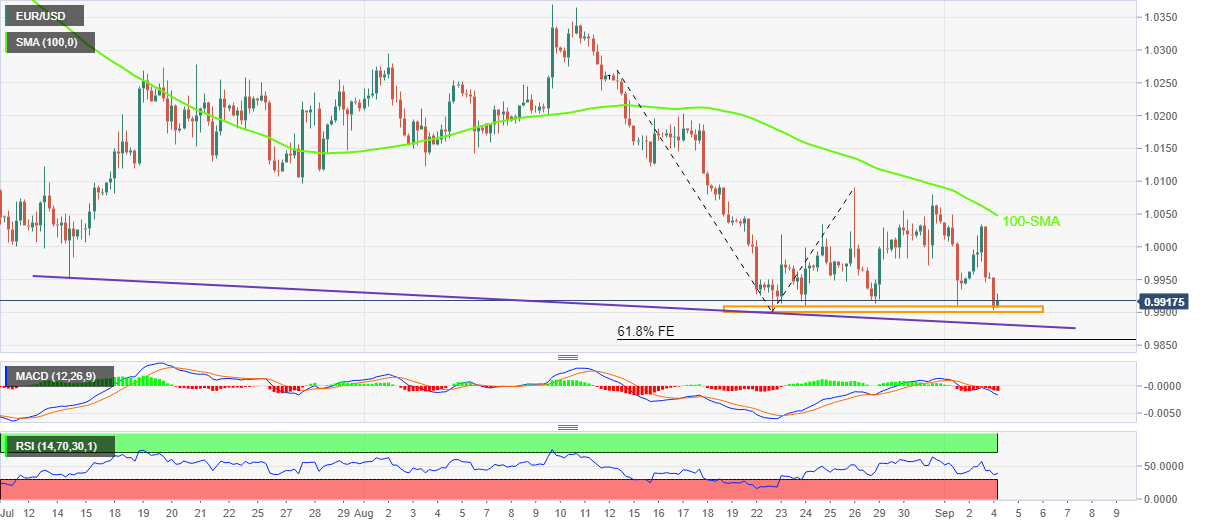
Trend: Limited downside expected
-
01:32
Hong Kong SAR Nikkei Manufacturing PMI came in at 51.2 below forecasts (52.4) in August
-
01:31
Japan Jibun Bank Services PMI above expectations (49.2) in August: Actual (49.5)
-
01:30
USD/JPY aims to recapture 24-year high near 141.00 amid firmer DXY, US ISM Services PMI eyed
- USD/JPY is gearing up to recapture its 24-year high at 140.80 as upbeat US NFP has strengthened DXY.
- The DXY has refreshed its two-decade high above 110.00 as odds for a hawkish Fed soar.
- Risk sentiment will remain in play as US markets will remain closed on account of Labor Day.
The USD/JPY pair is advancing towards the 24-year high at 140.80, recorded last week. The asset is gaining a lot of traction as the US dollar index (DXY) has refreshed its two-decade high at 110.03. The DXY is auctioning near the escalated levels and is gearing up for a fresh rally ahead.
As US Nonfarm Payrolls (NFP) remained upbeat last week, the DXY has become a darling asset for the market participants. The asset is gaining higher as higher additions of jobs by the US economy in August have delighted the Federal Reserve (Fed). Price pressures are extremely hurting the paychecks of the households as recent exhaustion signals are insufficient to force the latter to step up their spending pattern (quantity-wise). Therefore, higher employment generation will support the Fed policymakers to sound hawkish unhesitatingly.
Going forward, the release of the US ISM Services PMI will hog the limelight. As the US economy is known for possessing tech biggies and providing IT business to emerging economies, the importance of the US Services PMI is extremely higher. The economic data is seen lower at 54.9 against the prior release of 56.7. This may halt the DXY’s dream rally and the asset may find critical hurdles.
US Markets will remain closed on Monday on account of Labor Day, therefore, market sentiment will mainly drive the asset ahead.
On the Tokyo front, investors are awaiting the release of the second-tier economic data on Monday. The Jibun Bank Services PMI data is expected to remain stable at 49.2. While the release of Japan’s Gross Domestic Product (GDP) data will remain a key event ahead. The quarterly GDP is expected to improve to 0.7% against the prior release of 0.5%. While the annualized data is seen as extremely higher at 2.9% vs. 2.2% recorded earlier.
-
01:29
GBP/USD Price Analysis: Bulls move in but there could be more from the US dollar
- GBP/USD bulls are coming out of hiding to close the gap.
- US dollar has touched 110.00 DXY, but have the bulls got the legs?
GBP/USD has been a choppy start to the week with some jitters in the markets from the weekend noise surrounding the euroland energy crisis. This has fuelled a risk-off bid into the US dollar and weighed on the forex space with gaps across major pairs.
Nevertheless, there has been a correction in Tokyo and the following analysis is from a bullish perspective for cable given the lofty heights in the DXY touching the psychological 110 level.
GBP/USD weekly charts
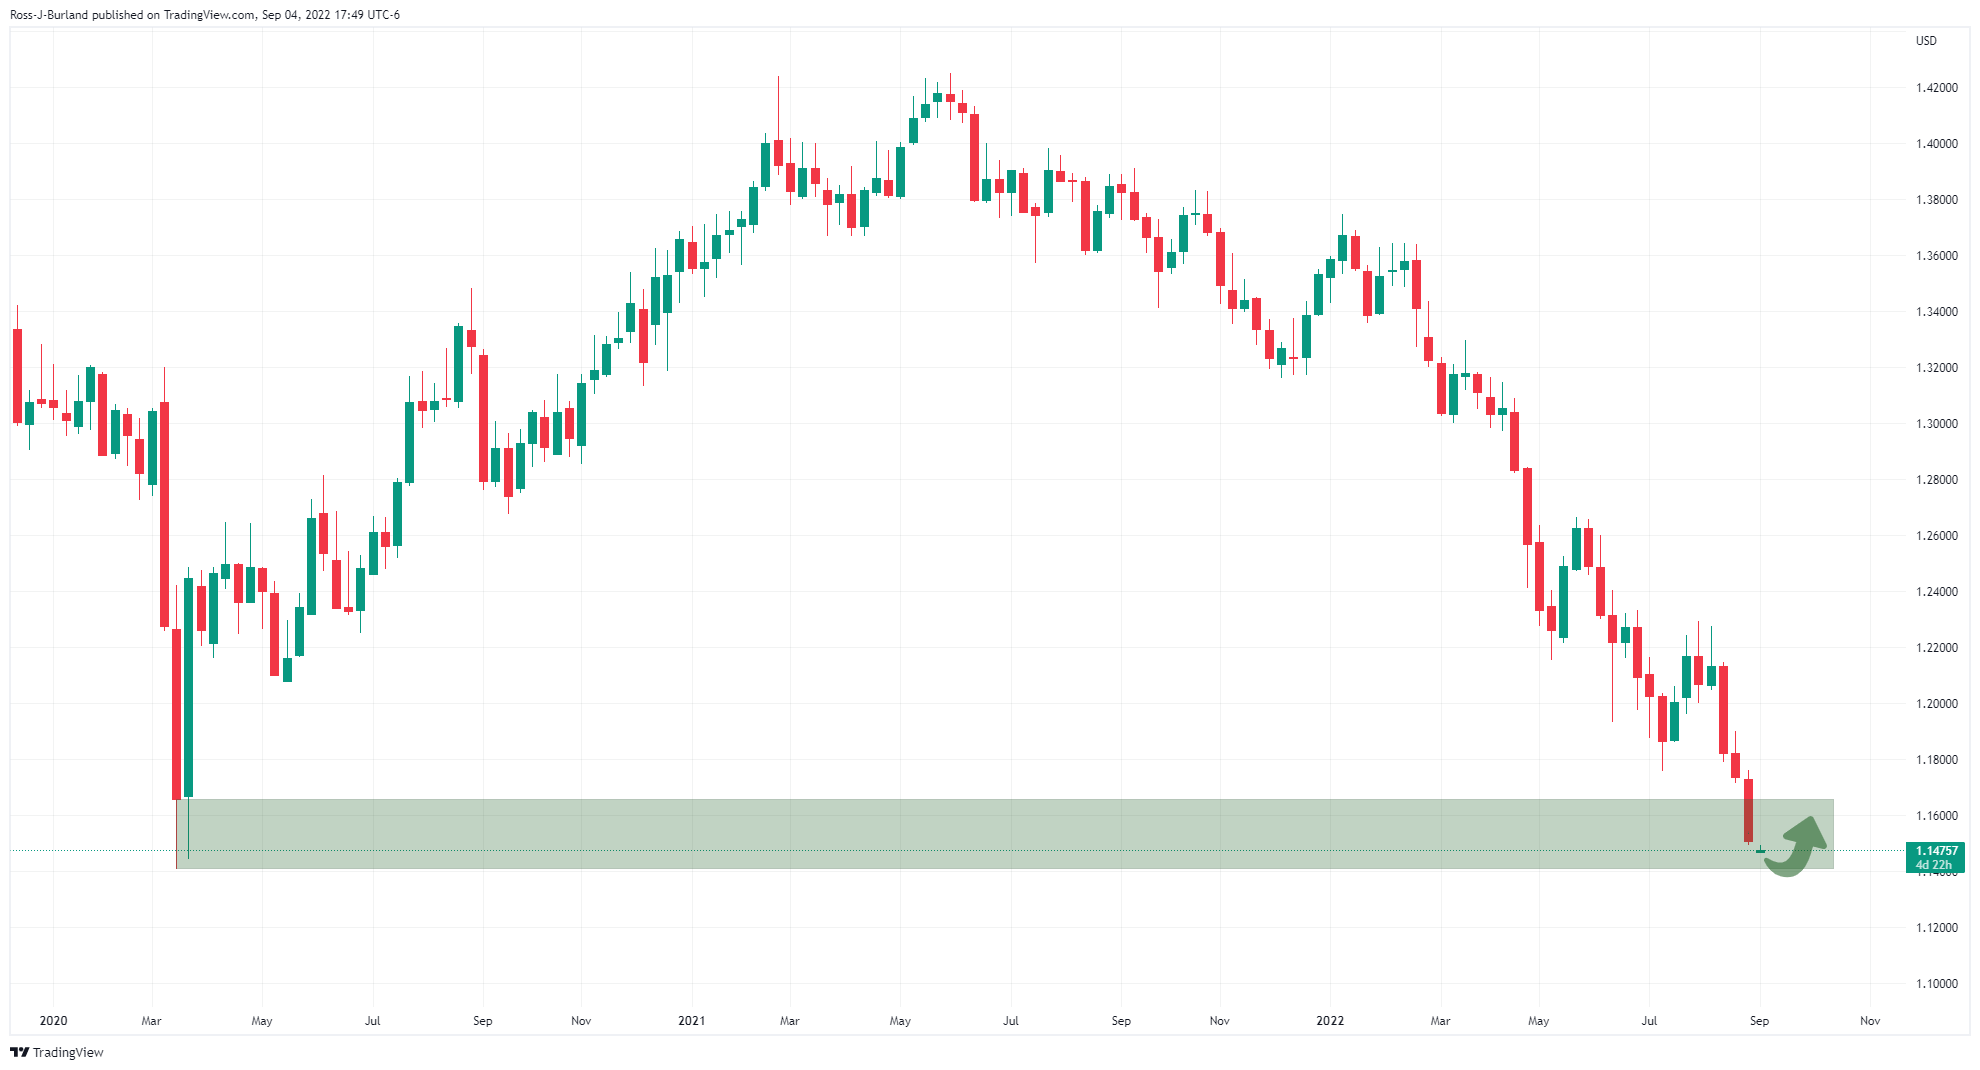
The pair have run into demand territory as per the weekly chart, so a phase of accumulation would be expected for the week ahead.
The M-formation is also compelling:
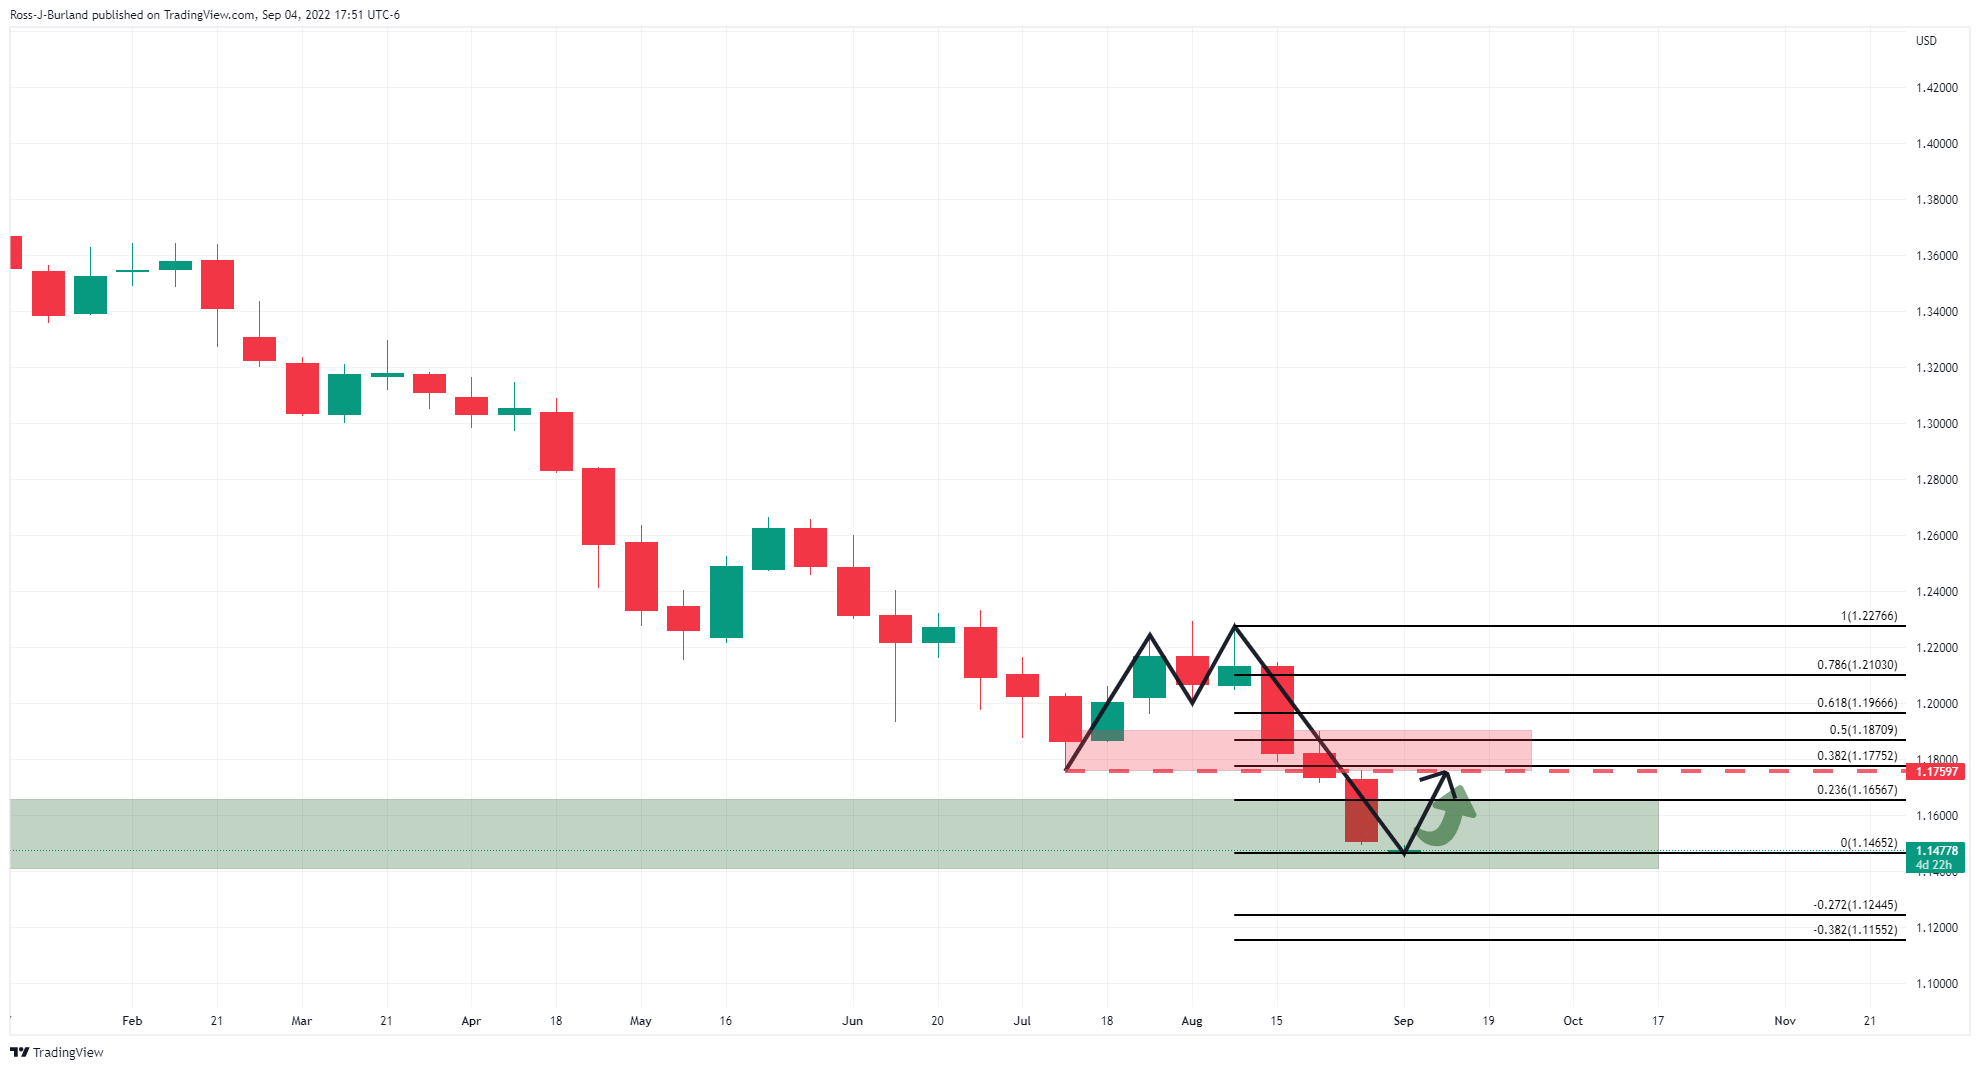
This is a reversion pattern and would be expected to see the price correct into the next area of resistance that, in this case, has a confluence with the 38.2% Fibonacci retracement level.
GBP/USD daily chart
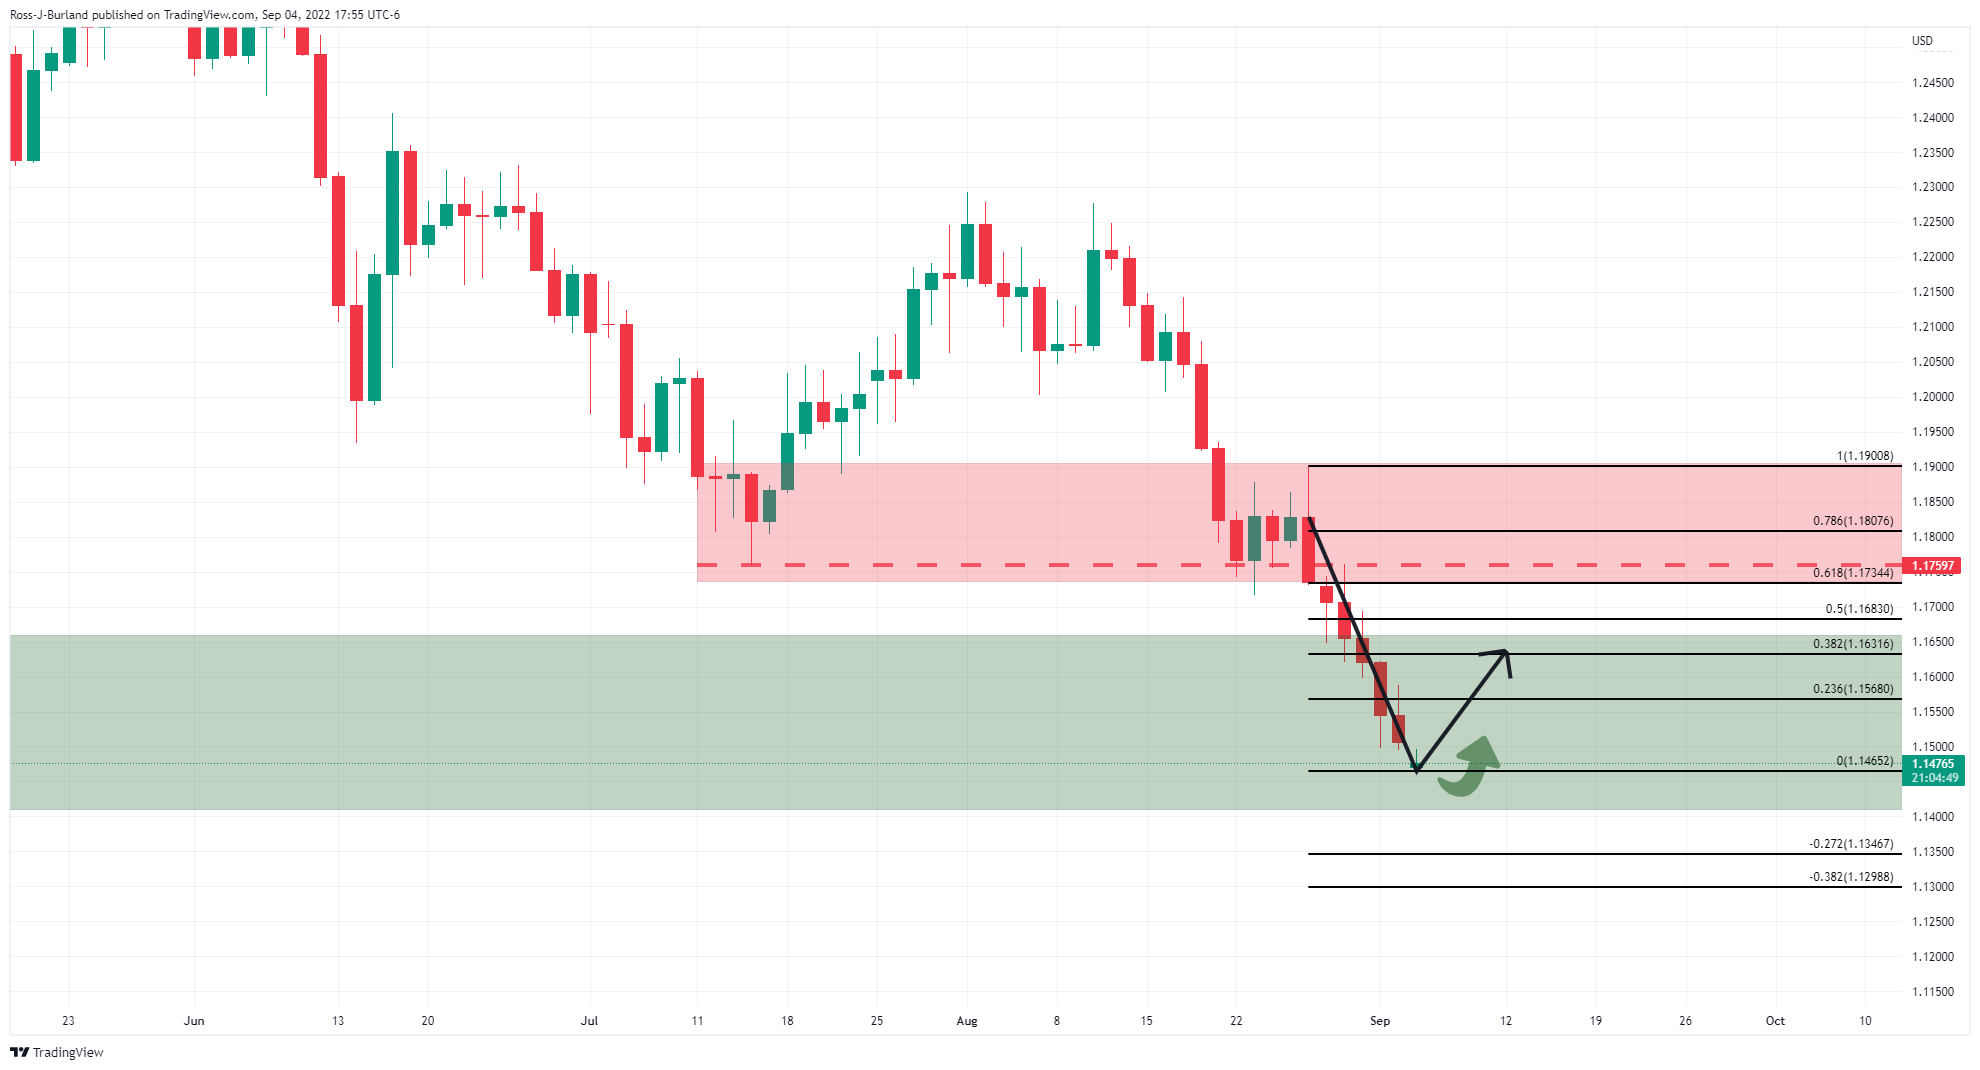
This chart is very overextended and a correction would be expected.
GBP/USD H4 chart
The four-hour chart is offering a bullish reversion pattern as well, so a move to mitigate the gap with a bullish 4-hour close could be expected to encourage further demand into a higher correction for the sessions ahead.
DXY bearish bias
The US dollar has touched 110 in trade to start the week but the Shark harmonic pattern is bearish. With that being said, there is room for the index to run until it meets January 2002 lows at 110.98:
(Monthly chart)
-
01:15
Currencies. Daily history for Friday, September 2, 2022
Pare Closed Change, % AUDUSD 0.68075 0.25 EURJPY 139.623 0.12 EURUSD 0.99574 0.09 GBPJPY 161.416 -0.25 GBPUSD 1.15127 -0.28 NZDUSD 0.61079 0.41 USDCAD 1.31255 -0.2 USDCHF 0.98113 -0.03 USDJPY 140.219 0.03 -
01:06
Breaking: US Dollar Index jumps to fresh two-decade high near 110.00
- US Dollar Index rallied to a fresh high since mid 2002s.
- Challenges to market sentiment from energy crisis, US-China tussles favor DXY bulls.
- Mixed US jobs report test the upside momentum amid Labor Day holiday.
US Dollar Index (DXY) marked a leap to poke the 110.00 threshold, also refreshing the 20-year high, to begin the week’s trading amid fears surrounding the energy crisis in the European Union (EU), as well as the escalating Sino-US tussles. Also fueling the DXY prices could be the hawkish Fed bets.
However, an off in the US markets due to the Labor Day holiday and mixed jobs report appeared to have challenged the DXY bulls as the quote retreats to 109.70 following the gap-up opening.
That said, the Group of Seven (G7) nations agreed on capping the price of Russian oil in the international markets. Following that, Moscow halted energy supplies to the European Union (EU) through Nord Stream 1 pipeline, citing a ‘leak’, during the weekend. It’s worth noting, however, that Politico ran a story mentioning that Russia’s Gazprom said on Saturday it would increase its shipments of gas to Europe via Ukraine, citing media reports. In addition to the Russia-linked energy problems and a likely recession due to the same, a halt in the US-Iran nuclear talks also amplifies oil woes for the old continent. “Iran nuclear talks stall again after latest response from Tehran,” said Bloomberg.
On a different page, US President Joe Biden’s administration poured cold water on the face of expectations that the US may ease/remove the Trump-era tariffs on China. “The Biden administration will allow Trump-era tariffs on hundreds of billions of dollars of Chinese merchandise imports to continue while it reviews the need for the duties,” said Bloomberg.
Talking about the data, US employment data marked mixed readings as the headline Nonfarm Payrolls (NFP) rose past 300K forecast to 315K, versus 526K prior, but the Unemployment Rate rose to 3.7% compared to 3.5% expected and prior. Further details reveal that the Average Hourly Earnings reprinted 5.2% growth for August, a bit lesser than the 5.3% market consensus. Also, Factory Orders dropped to -1.0% for July compared to 0.2% forecasts and 1.8% in previous readings.
After the data release, the US Treasury yields retreated from the multi-day high and exerted downside pressure on the DXY. However, the fears of recession and firmer wage growth appeared to keep the greenback bulls hopeful.
Moving on, the US holiday may restrict the market’s moves but the challenges to risk appetite and hawkish bets on the 0.75% Fed rate hike in September, could keep the DXY on the front foot.
Technical analysis
Unless breaking a three-week-old support line, near 109.10 by the press time, DXY remains on the bull’s radar.
-
01:02
Ireland Purchasing Manager Index Services dipped from previous 56.3 to 54.7 in August
-
00:55
USD/CHF advances towards a six-week high near 0.9860 ahead of US ISM Services PMI
- USD/CHF is marching towards a six-week high to near 0.9860 amid an upbeat DXY.
- In this week’s key event, US ISM Services PMI data is seen lower at 54.9 vs. 56.7.
- Swiss Franc CPI has escalated by 10 bps to 3.5%.
The USD/CHF pair is scaling higher gradually towards the six-week high near 0.9860 in the early Tokyo session. On a broader note, the asset has turned sideways after remaining in the grip of bulls for the past month. The major is oscillating in a 0.9783-0.9859 range and is expected to deliver a vertical upside move ahead.
The asset has strengthened significantly after the release of an upbeat US Nonfarm Payrolls (NFP) on Friday. As the US economy has added 315k jobs in August against expectations of 300k, odds of a third consecutive 75 basis points (bps) rate hike by the Federal Reserve (Fed) have soared. Fed policymakers are facing the harsh reality of delayed response on higher inflation. However, the spree of decent labor additions in the US economy is trimming troubles for the Fed.
Meanwhile, the US dollar index (DXY) has printed a fresh two-decade high at 110.03 despite an escalation in the Unemployment Rate. The jobless rate landed at 3.7% higher than the expectation and the prior release of 3.5%. Going forward, investors will focus on the US ISM Services PMI data, which will release on Tuesday. The economic data is expected to decline to 54.9 against the prior release of 56.7. Investors should be informed that the US markets will remain closed on Monday on account of Labor Day.
Meanwhile, less-than-expected Real Retail Sales data have weakened the Swiss franc. The economic data landed at 2.6%, lower than the consensus of 3.3% but remained higher than the prior release of 0.7%. Also, the Consumer Price Index (CPI) has improved to 3.5% against expectations and the former print of 3.4% on an annual basis.
-
00:54
GBP/JPY struggles to fill the gap around 161.00 with eyes on UK politics, energy crisis
- GBP/JPY began the week with a gap-down before portraying a corrective move near two-week low.
- Fears over UK’s recession escalate amid fresh challenges to energy supplies.
- Tory leadership results will be crucial this week.
GBP/JPY stays defensive around 161.20, after beginning the week’s trading with a downside gap of 160.85, as traders struggle for clear directions during Monday’s Asian session. Even so, the mixed mood and concerns surrounding UK politics, as well as the energy crisis, exert downside pressure on the cross-currency pair.
Russia’s permanent break to the EU oil supplies via Nord Stream 1 pipeline joined a pause in the US-Iran oil deal talks to amplify recession concerns and weigh on the GBP/JPY prices of late. On the same line could be the US-China tussles and uncertainty over the UK politics ahead of the Tory leadership results.
After the Group of Seven (G7) nations agreed on capping the price of Russian oil in the international markets, Moscow halted energy supplies to the European Union (EU) through Nord Stream 1 pipeline, citing a ‘leak’, during the weekend. It’s worth noting, however, that Politico ran a story mentioning that Russia’s Gazprom said on Saturday it would increase its shipments of gas to Europe via Ukraine, citing media reports. In addition to the Russia-linked energy problems and a likely recession due to the same, a halt in the US-Iran nuclear talks also amplifies oil woes for the oil continent. “Iran nuclear talks stall again after latest response from Tehran,” said Bloomberg.
On a different page, US President Joe Biden’s administration poured cold water on the face of expectations that the US may ease/remove the Trump-era tariffs on China. “The Biden administration will allow Trump-era tariffs on hundreds of billions of dollars of Chinese merchandise imports to continue while it reviews the need for the duties,” said Bloomberg.
At home, chatters around the energy bill are the key as Liz Truss and Rishi Sunak both hold their breaths for the Conservative Party leadership. Ahead of the results, up for publishing during late Monday, The Telegraph mentioned that Liz Truss is considering freezing energy bills for millions of households this winter if she wins the Conservative Party leadership race.
It’s worth noting that Liz Truss gained more acceptance amid her plans to help via energy bill whereas the ex-Chancellor Rishi Sunak has sound financial knowledge and is popular for the same to defend the economy. However, the latest concern is more prone to the energy crisis and hence a victory of Liz Truss should be cheered by the GBP/JPY buyers.
Elsewhere, an off in the US and Canada might restrict the market moves but recession fears can battle the cautious optimism, especially after the mixed US jobs report, which may entertain traders.
It should be noted that Japan’s second quarter Gross Domestic Product (GDP), as well as the yields amid fears of more divergence between the monetary policies of the Bank of England (BOE) and the Bank of Japan (BOJ), will be important release for the pair traders to watch.
Technical analysis
An upward sloping support line from May 12 restricts short-term GBP/JPY declines near 161.00. The recovery moves, however, need validation from 161.85-90 resistance confluence comprising the 21-DMA and a five-week-old descending trend line.
-
00:26
WTI Price Analysis: Multiple hurdles to test recovery towards $90.00
- WTI picks up bids to extend Friday’s recovery from 13-day low.
- One-week-old descending trend line, support-turned-resistance from August 17 will precede 200-SMA to test bulls.
- RSI, MACD signals keep buyers hopeful, short-term rising trend line challenges fresh downside.
WTI crude oil grinds higher around $87.70 as it stretches Friday’s rebound during Monday’s initial Asian session. The black gold’s recovery moves also gain support from the RSI (14) and MACD to tease bulls to aim for the $90.00 threshold.
An impending bull cross on the MACD joins recently firmer RSI, not overbought, to keep buyers hopeful.
With this, the quote rises towards a downward sloping resistance line from the last Wednesday, around $88.75 at the latest.
However, a 13-day-old previous support line and the 200-SMA, respectively near $89.80 and $90.15, could challenge the WTI crude oil buyers afterward.
In a case where the black gold crosses the $90.15 hurdle, the August-end swing high near $92.55 will be in focus.
Alternatively, an ascending support line from Thursday, near $86.50, restricts the immediate downside of the commodity prices.
Following that, the recent low of around $85.80-75 precedes the previous monthly bottom near $85.40 to challenge the WTI bears.
Overall, oil prices are likely to remain firmer but the road to the north is a bumpy one.
WTI: Four-hour chart
-05092022-637979307473612746.png)
Trend: Further upside expected
-
00:13
AUD/USD attempts a break above 0.6800 on upbeat Aussie Services PMI, RBA policy in focus
- AUD/USD is aiming to cross 0.6800 on higher-than-expected Aussie Services PMI data.
- The RBA may announce a fourth consecutive interest rate hike by 50 bps to tame inflation.
- An upbeat US NFP data has driven the DXY above the significant hurdle of 110.00.
The AUD/USD pair is sensing less-confident barricades around 0.6800 in the early Tokyo session. A follow-up buying has been witnessed after a gap-down move as oscillators turned extremely oversold on a lower timeframe. Now, the release of the upbeat Aussie Services PMI data has strengthened the antipodean.
The economic data has been released at 50.2, higher than the consensus and the prior release of 49.6. Adding to that, the Australian Industry Group (AIG) has reported a significant uptick in the Performance of Construction Index data. The macro data has released at 47.9 vs. 45.3 released earlier.
This week, the entire focus will remain on the interest rate decision by the Reserve Bank of Australia (RBA), which will release on Tuesday. Taking into account that price pressures have not displayed any exhaustion signals yet in the Aussie economy, the RBA will announce a fourth consecutive 50 basis points (bps) rate hike. This will step up the Official Cash Rate (OCR) to 2.35%.
Meanwhile, the US dollar index (DXY) has overstepped the prior week’s high and has touched an intraday high above the psychological resistance of 110.00. The DXY is aiming higher as odds of a bumper rate hike by the Federal Reserve (Fed) are soaring significantly. After upbeat US Nonfarm Payrolls (NFP) data, the Fed is extremely delighted and may move the interest rate needle higher unhesitatingly. It is important to note that the US markets are closed on Monday on account of Labor Day.
-
00:03
USD/CAD stays defensive above 1.3100 amid gas woes, focus on BOC, Canada employment
- USD/CAD grinds higher around the yearly top, reverses Friday’s pullback.
- Russian oil flow, G7 chatters challenge the sentiment but supply fears exert downside pressure on Loonie pair.
- Risk catalysts are important for fresh clues, especially linked to the energy market.
- BOC braces for another bumper rate hike but oil price moves, Canada jobs report will be crucial to watch.
USD/CAD begins the week on a positive footing around 1.3130-40 as bulls brace for the key Bank of Canada (BOC) monetary policy decision and Canada employment data amid oil woes for the bloc. In doing so, the Loonie pair returns to the bull’s radar but mixed concerns over Canada’s main export item, namely WTI crude oil, challenge the upside momentum.
That said, the WTI crude oil prices remain firmer around $87.70 as hopes of easing the energy crisis wane even as Gazprom signals more gas supplies to Europe. The reason could be linked to Russia’s indefinite halt of energy supplies through the Nord Stream 1 pipeline, as well as the failure of the US and Iran policymakers to unveil the oil deal.
In addition to the energy crisis, mixed US data also test the USD/CAD traders. On Friday, US employment data marked mixed readings as the headline Nonfarm Payrolls (NFP) rose past 300K forecast to 315K, versus 526K prior, but the Unemployment Rate rose to 3.7% compared to 3.5% expected and prior. Further details reveal that the Average Hourly Earnings reprinted 5.2% growth for August, a bit lesser than the 5.3% market consensus. Also, Factory Orders dropped to -1.0% for July compared to 0.2% forecasts and 1.8% previous readings.
Elsewhere, US President Joe Biden’s administration poured cold water on the face of expectations that the US may ease/remove the Trump-era tariffs on China. “The Biden administration will allow Trump-era tariffs on hundreds of billions of dollars of Chinese merchandise imports to continue while it reviews the need for the duties,” said Bloomberg. The news magnifies the risk-off mood and exerts additional downside pressure on the USD/CAD prices.
Amid these plays, Wall Street closed on a negative front while S&P 500 Futures print mild losses at the latest. Further, the US 10-year Treasury yields dropped seven basis points (bps) to 3.195%.
Moving on, a holiday in the US and Canada might restrict Monday’s USD/CAD moves, which in turn highlight risk catalysts to watch for clear directions. Following that, the monthly prints of Canada’s employment numbers for August and the BOC interest rate decision will be important for the pair traders to watch as the Canadian central bank is likely to announce 0.75% rate hike after inflating the benchmark by 1.0% in the last meeting.
Technical analysis
An upward sloping resistance line from late December 2021, around 1.3170 by the press time, challenges USD/CAD bulls amid a nearly overbought RSI (14) line. The pullback moves, however, need a clear downside break of the three-week-old support line, at 1.3010, to recall the sellers.
-
00:02
Australia S&P Global Composite PMI rose from previous 49.8 to 50.2 in August
-
00:02
Australia S&P Global Services PMI came in at 50.2, above forecasts (49.6) in August
-