Notícias do Mercado
-
23:59
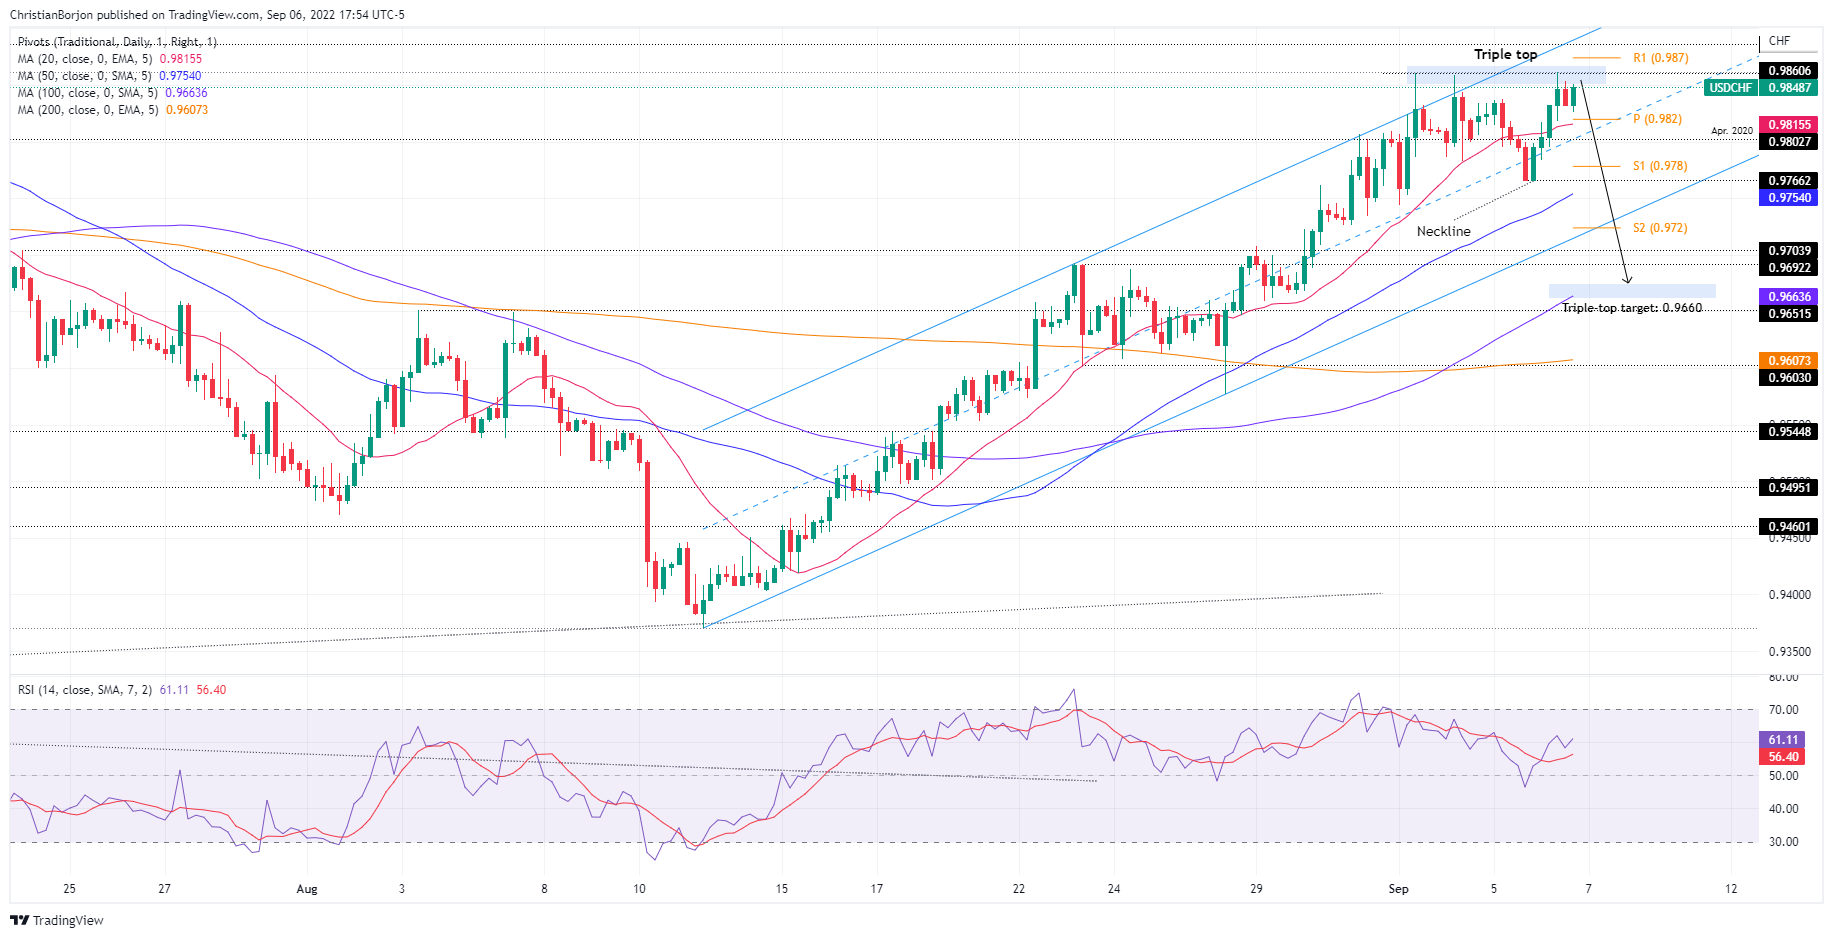
USD/CHF Price Analysis: Triple-top in the hourly chart emerges, targets 0.9660
- USD/CHF remains subdued for five consecutive trading days, eyeing a break of the 0.9861 weekly high.
- A triple-top chart pattern in the USD/CHF hourly chart could pave the way towards 0.9660.
The USD/CHF barely advances as the Asian session begins, up by 0.09%, consolidating in the 0.9765-0.9860 range for the fifth straight trading session. At the time of writing, the USD/CHF is trading at 0.9848, above its opening price, after hitting the respective weekly low and high, at 0.9765-0-9861, on Tuesday.
USD/CHF Price Analysis: Technical outlook
The USD/CHF is subdued, though exchanges hands below the weekly high. The Relative Strength Index (RSI), albeit near overbought conditions, suggests that buyers remain in control of the price action. A break above 0.9861 would exacerbate a move towards the July 14 daily high at 0.9886 before testing the 0.9900 psychological level. Once broken, the next stop would be parity.
Short term, the USD/CHF four-hour chart depicts a triple-top formation, meaning that further downside pressure is expected. To validate the pattern, the USD/CHF needs to break below the “neckline” at 0.9765, exacerbating a move towards the triple-top 100-pip target at 0.9660.
USD/CHF Key Technical Levels
-
23:44
EUR/USD sellers flirt with 0.9900 at 19-year low, focus on ECB, Fed’s Powell
- EUR/USD steadies at the lowest levels in two decades as bears keep riens.
- Recession fears, firmer US data favor sellers ahead of the key events.
- ECB is likely to announce 0.50% rate hike, Fed’s Powell may defend aggressive policies.
- Updates on stimulus packages from Europe and the US, second-tier data may entertain traders ahead of the key Thursday.
EUR/USD treads water around 0.9900 after refreshing the 19-year low the previous day as traders await the European Central Bank (ECB) monetary policy meeting and a speech from Fed Chairman Jerome Powell. Also restricting the major currency pair’s latest moves are mixed concerns during Wednesday’s Asian session.
Russia’s pause to all oil/gas exports to the European Union (EU) and firmer US ISM Services PMI enabled the EUR/USD bears to cheer a fresh multi-year low. In doing so, the quote ignored the policymakers’ signals for more stimulus measures to defend the energy companies and the public from the energy crisis.
That said, US ISM Services PMI rose to 56.9 versus 55.1 market forecast and 56.7 prior. However, the S&P Global Composite PMI and Services PMI eased to 44.6 and 43.7 respectively versus 45.0 and 44.1 initial forecasts in that order. Even so, the US Dollar Index (DXY) rose after the release and refreshed a 20-year high.
It should be noted that the mixed comments from the ECB policymakers and downbeat German Factory Orders for August, -13.6% YoY versus -6.1% expected and -9.0% prior, also weighed on the EUR/USD prices.
“Eurozone inflation is close to its peak,” ECB Governing Council member Yannis Stournaras said on Tuesday. Further, ECB policymaker Martins Kazaks said in an interview with Eurofi magazine on Tuesday that the “ECB will hike above a neutral rate if needed.” However, he added that a broad and protracted recession could slow rate hikes. Meanwhile, Governing Council member Mario Centeno said that “the ECB may achieve inflation goal with slow normalization.”
Against this backdrop, Wall Street closed in the red while the 10-year US Treasury yields jumped the most in a month to poke the highest levels since mid-June.
Looking forward, final readings of the Eurozone’s second quarter (Q2) Gross Domestic Product, expected to confirm 0.6% QoQ and 3.9% YoY prints, will precede Fedspeak to entertain EUR/USD traders. However, major attention will be given to the ECB’s action and Fed’s Powell as recession fears challenge the policy hawks.
Technical analysis
A sustained downside trading below July’s low near 0.9950 directs EUR/USD towards the 61.8% Fibonacci Expansion (FE) of May-August moves, near 0.9845. Also acting as an immediate support is the December 2002 low of around 0.9860.
-
23:31
Australia AiG Performance of Services Index rose from previous 51.7 to 53.3 in August
-
23:30
Gold Price Forecast: XAU/USD attempts a rebound from $1,700, Fed Powell’s speech buzz
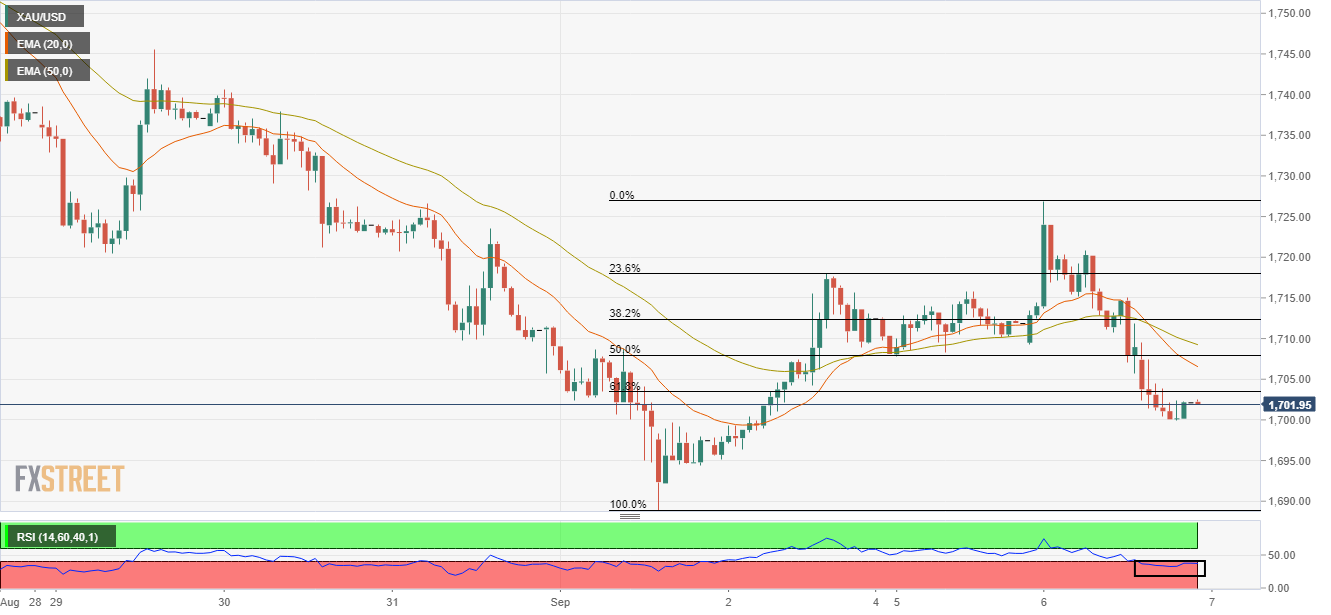
- Gold price has sensed a buying interest around $1,700.00, downside remains favored on firmer DXY.
- A surprise rise in the US ISM Services PMI data has weakened the precious metal.
- An establishment below 61.8% Fibo retracement at $1,703.51 is indicating more downside ahead.
Gold price (XAU/USD) has picked bids around the psychological support of $1,700.00 in the early Asian session. The precious metal has fetched a buying interest after displaying a sheer downside. Earlier, the yellow metal witnessed selling pressure after attempting to cross $1,725.00 and accelerated downside momentum after dropping below $1,710.00.
The gold prices fell like a house of cards after the release of surprisingly higher US ISM Services PMI data. As the Federal Reserve (Fed) is hiking interest rates vigorously for the past few months to scale down inflationary pressures, a decline in Services PMI was expected by the market participants. However, the Non-Manufacturing data landed at 56.9 vs. 55.1 the expectations, and 56.7 the prior release.
Later this week, the speech from Federal Reserve (Fed) chair Jerome Powell will be of utmost importance. No doubt, price pressures have already displayed signs of exhaustion and have trimmed to 8.5% in July against 9.1% recorded for June. But, the price rise index is still higher than the desired rate of 2% for the longer term. Therefore, investors should brace for a ‘hawkish’ stance by Fed Powell while addressing the world economy about the interest rates.
Gold technical analysis
On an hourly scale, gold prices have surrendered the 61.8% Fibonacci retracement (placed from Thursday’s low at $1,688.92 to Tuesday’s high at $1,726.84) at $1,703.51. A bear cross, represented by the 20-and 50-period Exponential Moving Averages (EMAs) at $1,711.97, is indicating more weakness ahead.
Meanwhile, the Relative Strength Index (RSI) (14) has shifted into the bearish range of 20.00-40.00, which signals a continuation of downside momentum.
Gold hourly chart
-
23:17
AUD/USD steadies below 0.6750 as bears approach yearly low, Aussie GDP, Fed’s Powell eyed
- AUD/USD remains pressured at seven-week low with eyes on yearly bottom.
- Risk-aversion joined RBA-inspired fears to weigh on prices, US ISM Services PMI favored greenback bulls.
- Stimulus hopes from major economies initially propelled prices before the buyers failed.
- Australia’s Q2 GDP will be important for fresh impulse.
AUD/USD stays bearish at an almost two-month low, after falling the most in eight days the previous day, as the traders await Australia’s second quarter (Q2) Gross Domestic Product (GDP) and a speech from Fed Chair Jerome Powell. That said, the Aussie pair holds lower ground near 0.6730 during the initial Asian session on Wednesday.
The Reserve Bank of Australia’s (RBA) fourth rate hike worth 50 basis points (bps) couldn’t impress the AUD/USD bulls as the Aussie central bank signaled to slow the pace of the rate increase. The RBA also mentioned household spending is “an important source of uncertainty,” weighing on the Aussie prices.
The risk barometer pair also dropped due to the broad risk-aversion amid fears of recession and the central bank aggression after the US data printed higher figures. US ISM Services PMI rose to 56.9 versus 55.1 market forecast and 56.7 prior. However, the S&P Global Composite PMI and Services PMI eased to 44.6 and 43.7 respectively versus 45.0 and 44.1 initial forecasts in that order. Even so, the US Dollar Index (DXY) rose after the release and refreshed a 20-year high.
On the contrary, stimulus hopes from the US, China, the UK and Europe, to battle the energy/covid crisis and defend against slowdown fears, seem to have favored the AUD/USD bulls earlier on Tuesday before the bears took control.
Amid these plays, Wall Street closed in the red while the 10-year US Treasury yields jumped the most in a month to poke the highest levels since mid-June.
Moving on, Australia’s Q2 GDP will be crucial amid the latest challenges to the growth, mainly emanating from China. The forecasts suggest 1.0% QoQ and 3.5% YoY figures versus 0.8% and 3.3% respective priors, matching which could help the AUD/USD prices to consolidate recent losses.
Following that, China's trade numbers for August and Thursday's speech from Fed Chair Jerome Powell will be important as traders seek more clues on the Fed’s next moves amid escalating recession fears.
Technical analysis
A clear downside break of the two-month-old horizontal support area surrounding 0.6770-60 directs the AUD/USD prices towards the yearly low near 0.6680. However, any further downside won’t hesitate to test the downward sloping support line from May near 0.6550.
-
23:17
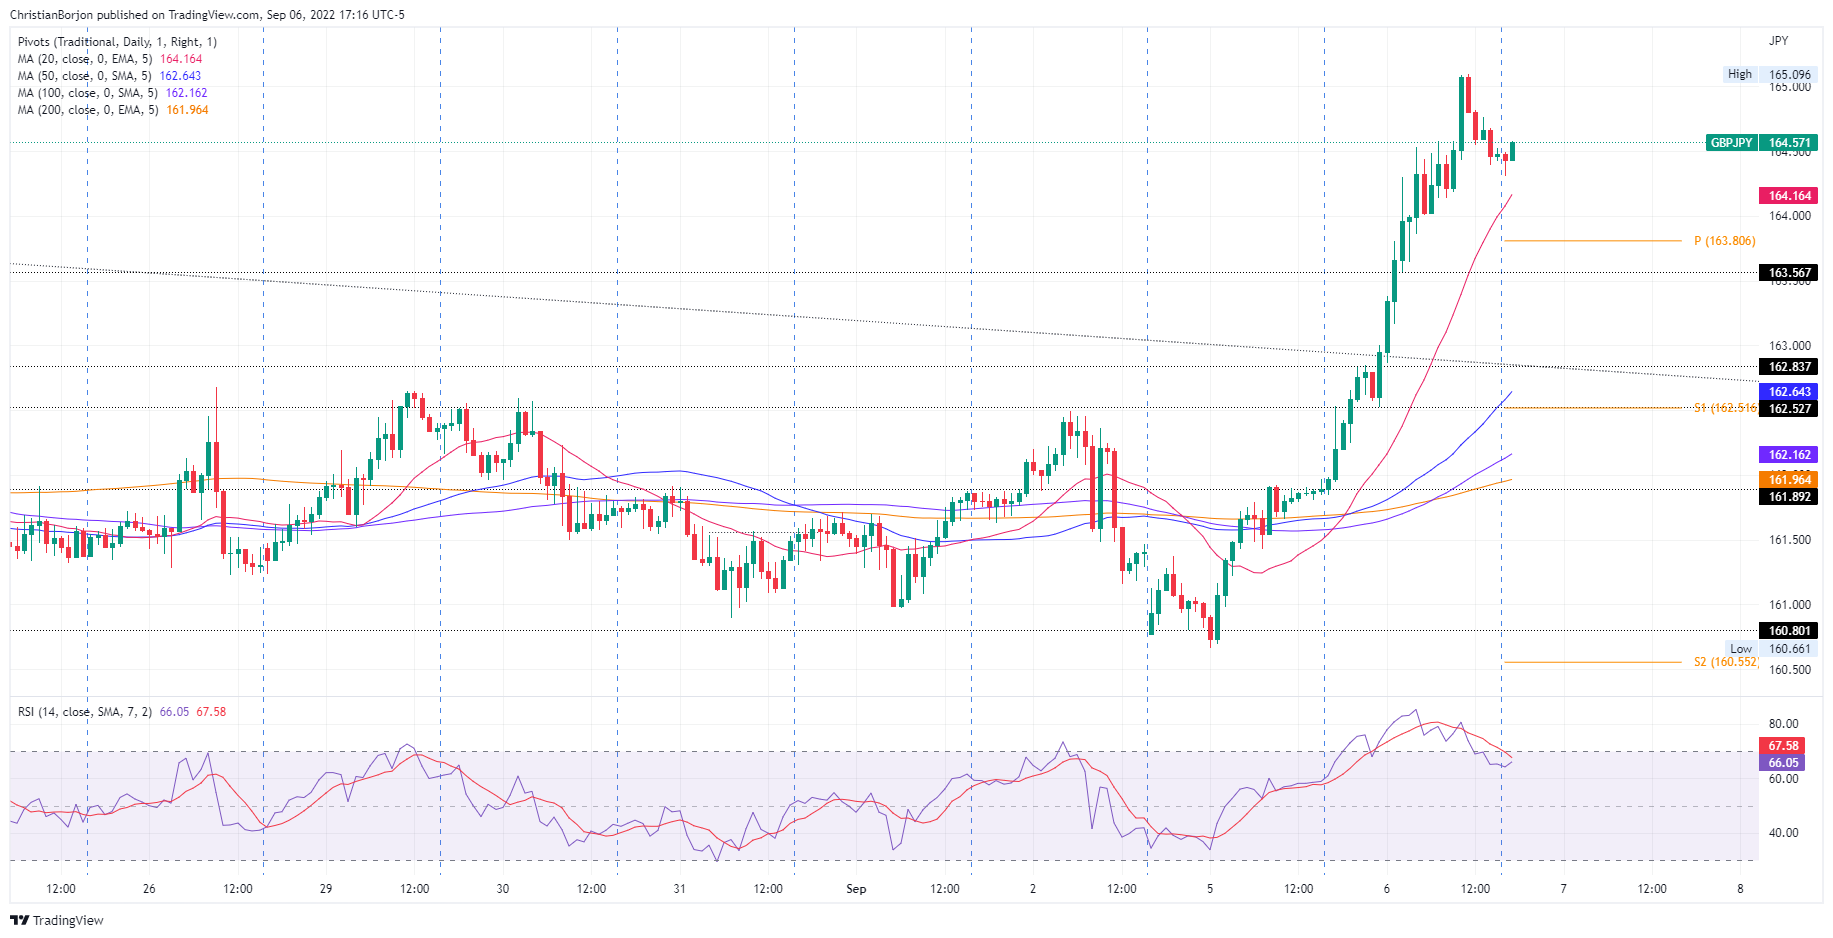
GBP/JPY Price Analysis: Rallies more than 200 pips on Tuesday, above 164.50 despite a risk-off mood
- GBP/JPY bounced from daily lows below 162.00, advancing sharply and reaching the 165.00 figure.
- The daily chart portrays the GBP/JPY as upward biased.
- Short term, the GB/JPY might retest the YTD highs; otherwise, a fall towards 163.00 is on the cards.
The GBP/JPY breaks above the 162.83 top of a 20-day trading range, rallying sharply more than 250 pips on Tuesday, courtesy of broad Japanese yen weakness across the board, despite a risk-off impulse in the financial markets.
On Tuesday, the GBP/JPY opened near the 20-day EMA, below it at around 161.88, and never looked back, soaring sharply, registering a six-weekly high at around 165.09, in the middle of the New York session. As the Asian Pacific session begins, the GBP/JPY is trading at 164.56, slightly below the opening price.
GBP/JPY Price Analysis: Technical outlook
The GBP/JPY daily chart illustrates the pair breaking above 162.83, top of the 160.80-162.83 range, opening the door for further gains. Worth noting that the Relative Strength Index (RSI) crossed above the 50-midline to the bullish territory. Therefore, the GBP/JPY could test the 166.00 figure in the near term.
Meanwhile, the GBP/JPY one-hour chart depicts the cross-currency pair retracing from daily highs nearby 165.00, eyeing a fall towards the 20-EMA at 164.15. If the GBP/JPY drops below the latter, it will exacerbate a move towards the daily pivot point at 163.80, followed by the 163.00 figure. Otherwise, if the GBP/JPY holds the fort above 164.00, its first resistance would be the 165.00 mark. Once cleared, the next resistance would be the R1 daily pivot at 165.77, followed by the psychological 166.00 price level.
GBP/JPY Key Technical Levels -
23:00
Chile BCCH Interest Rate registered at 10.75% above expectations (10.5%) in August
-
22:57
GBP/USD struggles around 1.1520 ahead of BOE Bailey and Fed Powell’s speech
- GBP/USD is sensing resistance around 1.1520 as the focus shifts to speeches from central banks.
- An upbeat US ISM Services PMI data has infused fresh blood into the DXY.
- Liz Truss seems on a spree of announcing relief packages to safeguard households against higher inflation.
The GBP/USD pair is facing barriers in crossing the immediate hurdle of 1.1520 in the early Tokyo session. The asset is displaying a volatility contraction phase after correcting from the round-level resistance of 1.1600 on Tuesday. The cable witnessed a steep fall after the market participants underpinned the greenback on robust US ISM Services PMI data.
Upbeat US ISM Services PMI strengthened he DXY
The Non-Manufacturing ISM data landed at 56.9, higher than the estimates and the prior release of 55.1 and 56.7 respectively. A surprising improvement in the Services PMI strengthened the mighty US dollar index (DXY) and printed a fresh two0decade high at 110.55. The DXY is establishing itself above the psychological resistance of 110.00 and is gearing up for a fresh rally ahead.
Going forward, the DXY will dance to the tunes of the speech from Federal Reserve (Fed) Jerome Powell scheduled on Thursday. Fed Powell will provide cues about the likely monetary policy action in September monetary policy meeting.
Truss’s relief packages to scale down the impact of higher inflation
On the UK front, after securing the position of next UK Prime Minister, Liz Truss is continuously announcing relief packages for the households against soaring inflation. To safeguard households from soaring energy bills, Liz Truss announced a fund of 130 billion pounds for freezing bills. Under this, the new cabinet will set a fixed unit price for energy suppliers to sell gas & electricity to households.
And, now Truss will cut taxes for households, which will remain supportive to combat higher payouts. Apart from that, the Cabinet will focus on making more investments and scaling up the employment generation process. In addition to that, the speech from Bank of England (BOE) Governor Andrew Bailey will remain in focus. BOE’s Bailey will dictate the likely monetary policy action at the next policy meeting, scheduled for September 15.
-
21:52
NZD/USD reaches a fresh YTD low at around 0.6035 on risk aversion
- NZD/USD creeps lower to fresh 2022 lows at around the 0.6030s region.
- The US ISM Non-Manufacturing PMI for August exceeded forecasts, surprising market players.
- ANZ Analysts on the NZD/USD: Hard to stand in front of the US dollar train.
The NZD/USD dives from weekly highs at 0.6128 due to worries that the US Federal Reserve would likely continue to tighten monetary policy aggressively after August ISM Manufacturing and Non-Manufacturing readings remained in expansionary territory, with better-than-expected figures.
The New Zealand dollar opened at around 0.6100 before advancing sharply toward the day’s highs. Nevertheless, as market sentiment turned sour, the greenback strengthened, as shown by the NZD/USD tumbling towards the daily lows at around 0.6035. At the time of writing, the NZD/USD is trading at 0.6040, below its opening price.
NZD/USD drops after US ISM Services PMI expanded more than estimates
Earlier in the North American session, the US Institute for Supply Management revealed that the Non-Manufacturing PMI for August expanded by 56.9, exceeding forecasts of 54.9 while peaking at July’s 56.9 reading. Furthermore, New Orders increased to 61.8, more than 59.9 in July, while Prices Paid slowed to 71.5 from 72.3, signaling that higher interest rates are beginning to affect the economy.
So far, US economic data released throughout September further cements the case for a 75 bps rate hike. As reported by the ISM, US factory and services activity continued expanding, and the Nonfarm Payrolls, exceeding estimates, paint a solid economic outlook for the US. The last piece of the puzzle would be the Consumer Price Index (CPI), to be released next week.
Meanwhile, the US Dollar Index, a gauge of the buck’s value, is up by 0.60%, at 110.263, hitting a fresh 20-year high during the session, underpinned by the rise in US T-bond yields. The US 10´-year benchmark note rate sits at 3.351%, up by 13 bps.
An absent New Zealand economic docket would leave NZD/USD traders adrift to US dollar dynamics, alongside Cleveland’s Fed Loretta Mester speech on Wednesday.
ANZ Analysts on the NZD/USD: Hard to stand in front of the US dollar train
Analysts of ANZ bank, in a note to clients, wrote: “Markets remain highly focussed on offshore factors, and while NZ interest rates here will rise in broad unison with their US counterparts, the USD’s dominance will just keep piling pressure in inflation here, which in turn speaks to a firmer policy response and more pain. Bottom line – it’s hard to stand in front of the US dollar train at the moment.”
NZD/USD Key Technical Levels
-
21:33
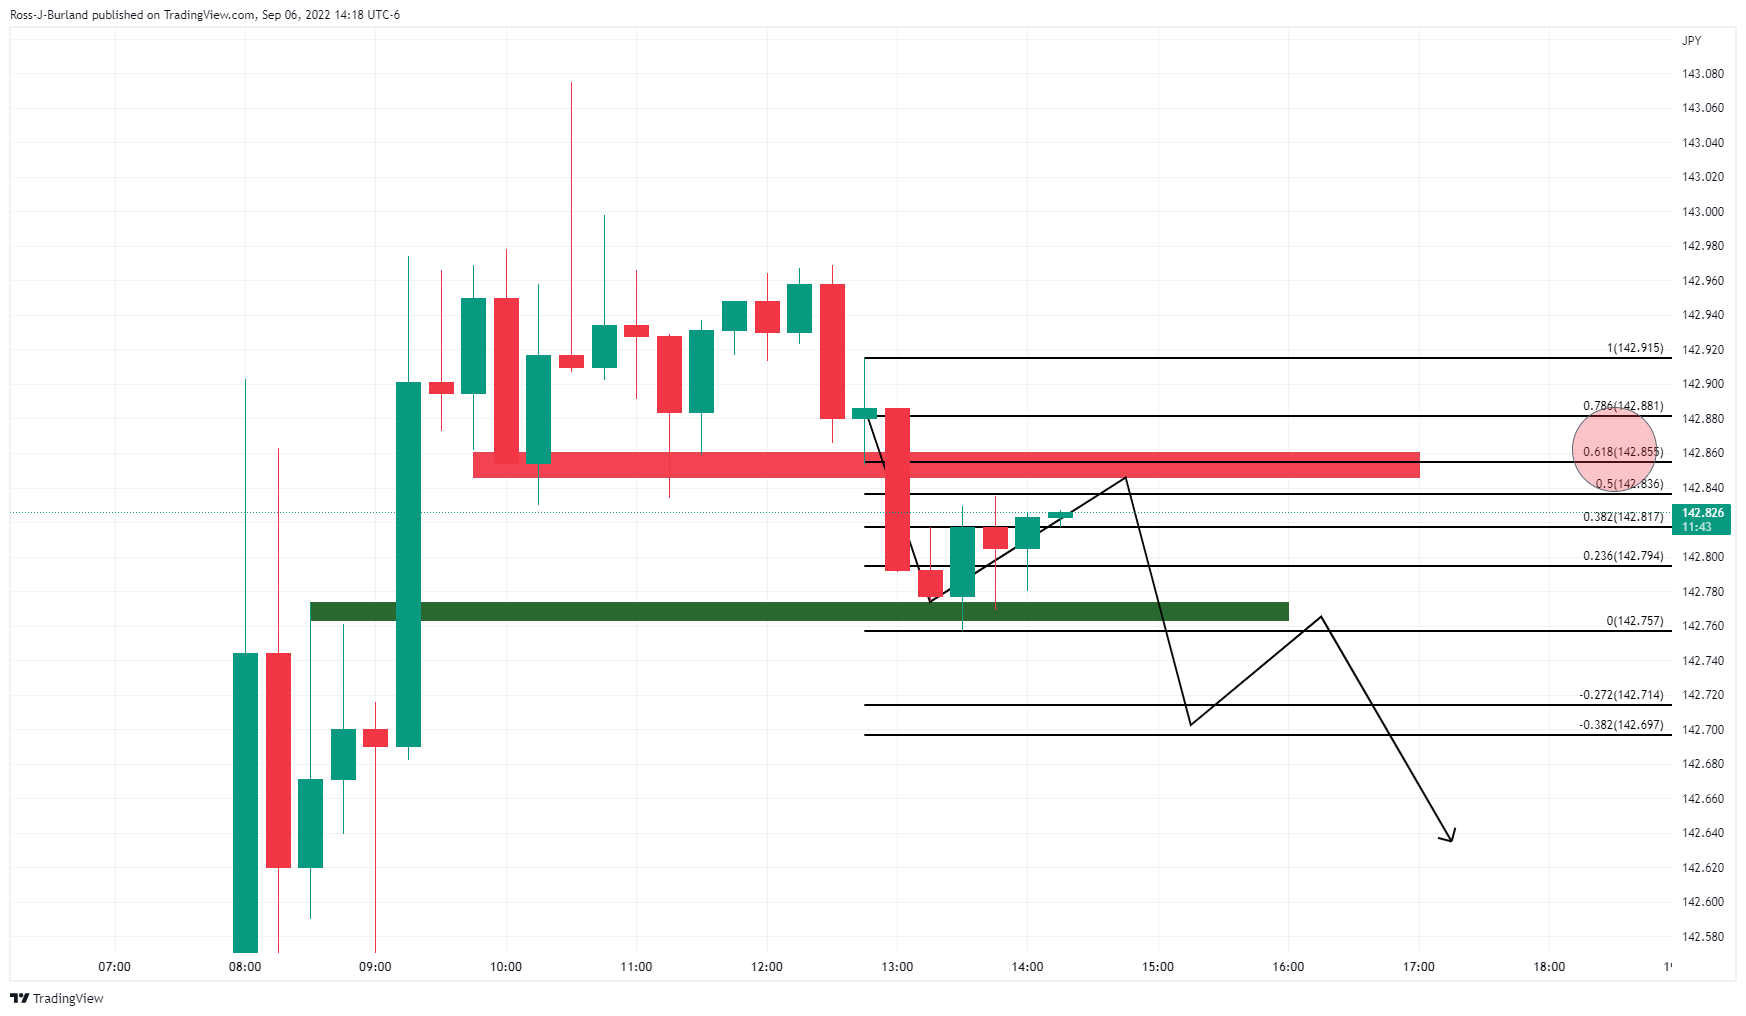
USD/JPY Price Analysis: Bears step in, but there is some work to do yet
- USD/JPY bears are moving in but there could be some more working of the highs to come yet.
- The price has rallied parabolically and a pullback could be on the cards.
USD/JPY rallied on Tuesday and took out the symbolic level of 142, scoring a fresh 24-year low as the US dollar sprung into life again and while the gap between Japanese monetary policy and its counterparts widens. USD/July hit the highest levels since August 1998.
The Japanese Finance Minister Shunichi Suzuki jaw-boned the currency but that did nothing to prevent it from falling to a 24-year low on Tuesday. He reiterated that sharp yen moves were "undesirable" and that he was watching rising volatility in the exchange market with a "great sense of urgency".
"It's important for currencies to move stably, reflecting economic fundamentals," Suzuki told reporters at the finance ministry. When pressed to comment on the impact of a weak yen on the economy, Suzuki said "a weak yen has both merit and demerit, but sharp moves are undesirable."
The yen has slumped nearly 20% since the start of the year, on diverging monetary policies between Japan and the United States. However, the Reserve Bank of Australia also hiked rates this week and the focus will turn to the European Central Bank which is also expected to pull the trigger again, potentially hiking as high as 75bps.
Meanwhile, the US dollar has been a major culprit in the extreme moves in forex this week. On Tuesday, data was the catalyst again with the August ISM services index beating expectations, rising to 56.9 (56.7 previously, 55.3 expected). ''The data complement the labour market’s strength and suggest that the economy remains some distance from recession,'' analysts at ANZ Bank said.
USD/JPY technical analysis
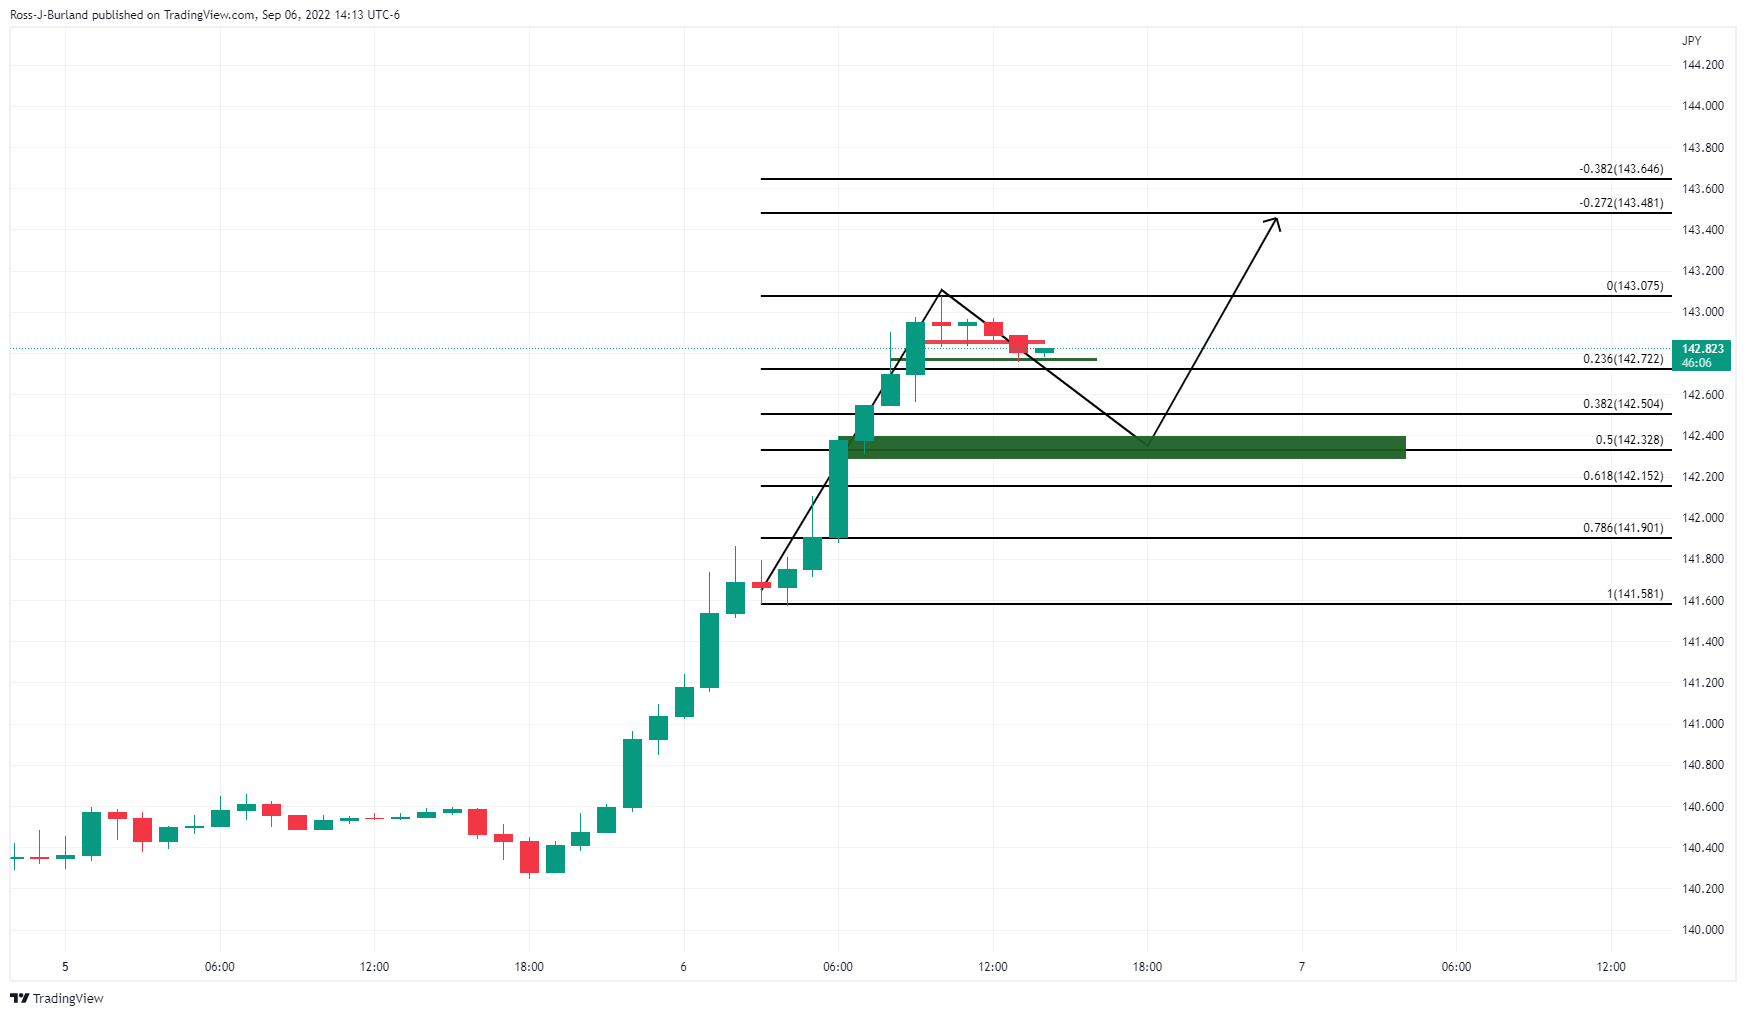
The price could be in for some corrective activity for the day ahead and the 50% mean reversion level signs with the first three hours of Wall Street's high.
From a 15-min time frame basis, the peak formation is more convincing, but a correction to the 61.8% could still be on the cards to restest the support of the topping formaiton. A downside extension of the bearish breakout impulse could be on the cards thereafter.
-
20:59
Forex Today: Pain for the EUR means gains for the USD
What you need to take care of on Wednesday, September 7:
The greenback extended its winning streak, ending Tuesday higher against most of its major rivals. The EUR and the JPY were the worst performers, falling to multi-year lows against their American rival. EUR/USD traded as low as 0.9863, now hovering around 0.9900, while USD/JPY trades a handful of pips below 143.07, a level that was last seen in 1998.
The weakness of the shared currency is directly linked to the conflict with Russia, as the latter cut all gas provision to the Old Continent. Western nations are still looking to cap Russian oil.
The GBP/USD pair is also under pressure, but ending the day, little changed at around 1.1510. The UK Prime Minister Liz Truss has announced energy bail-outs to cope with the crisis that affects all of Europe. Truss proposed to freeze roughly £130 billion in household energy bills while mulling another £40 billion for small businesses.
The Aussie was the weakest commodity-linked currency, with AUD/USD down to 0.6730 after the RBA hinted it would slow the hiking pace. The country will release Q2 Gross Domestic Product early on Wednesday.
The USD/CAD hovers around 1.3150, helped by weakening crude oil prices. WTI currently trades at $86.80 a barrel.
Spot gold trades at around $1,700 a troy ounce.
US data unexpectedly beat expectations as the US Services PMI advanced to 56.9 in August, also beating the market’s expectations. Government bond yields soared, with the 10-year Treasury note currently yielding 3.34%.
Wall Street seesawed between gains and losses along the session but gave up ahead of the close. Major indexes closed in the red, despite their European counterparts being able to post modest gains.
Binance to begin auto converting users’ USDC into BUSD
Like this article? Help us with some feedback by answering this survey:
Rate this content -
20:19
EUR/USD Price Analysis: Bears taking on critical H4 support
- EUR/USD bulls have moved in and there is a meanwhile focus on a correction.
- The bears, on the other hand, are seeking a break of the critical longer-term support structure.
As per the prior analysis from the start of the week, EUR/USD Price Analysis: Bulls eye a 50% mean reversion near 0.9950, the price moved into the key resistance but has subsequently fallen down to test a critical support structure again.
The following illustrates the bearish bias while below 0.9980:
EUR/USD prior analysis
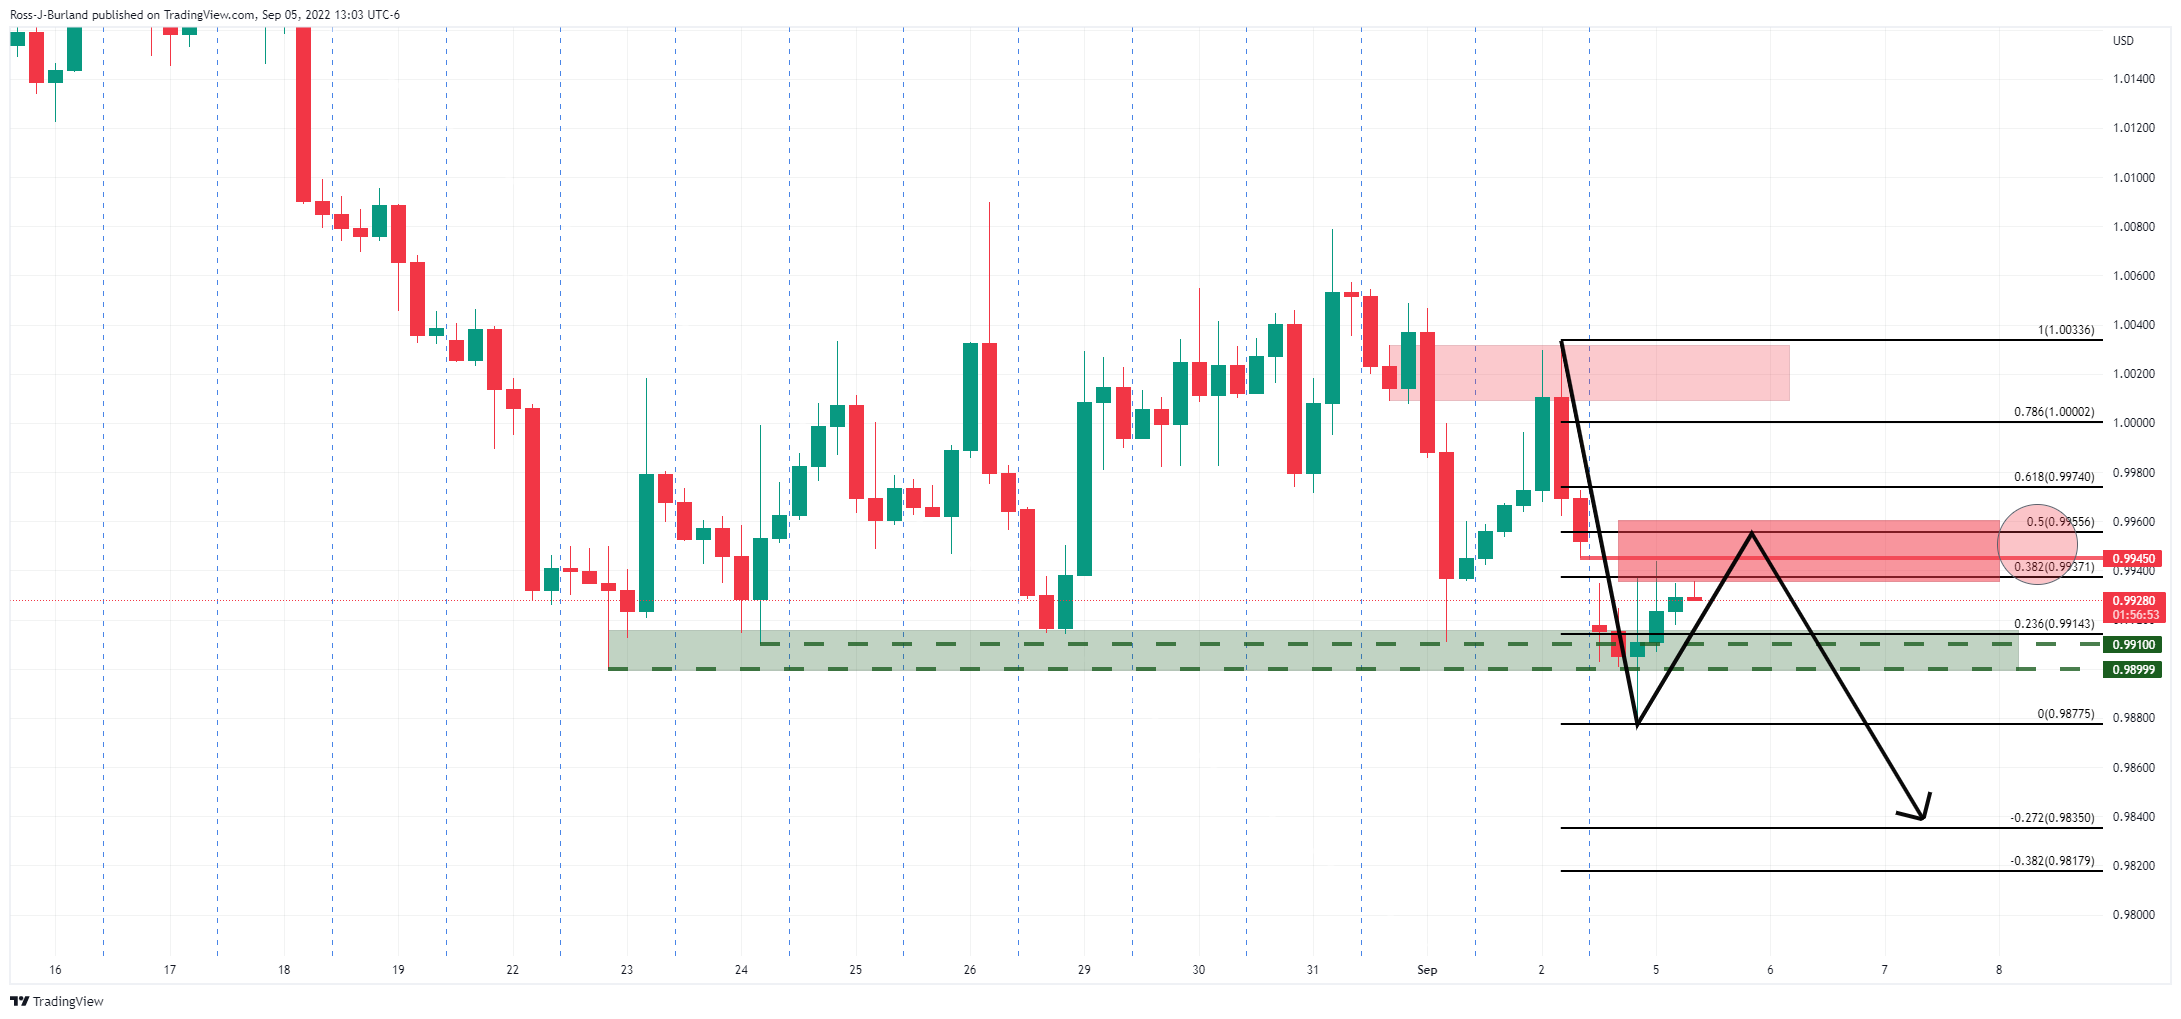
As illustrated above, the price was creeping in on the gap and it had made a 38.2% Fibonacci retracement, but a fuller correction was to be expected prior to the next bearish impulse to the downside.
The bullish inverse head and shoulders were also a compelling feature on the hourly time frame:
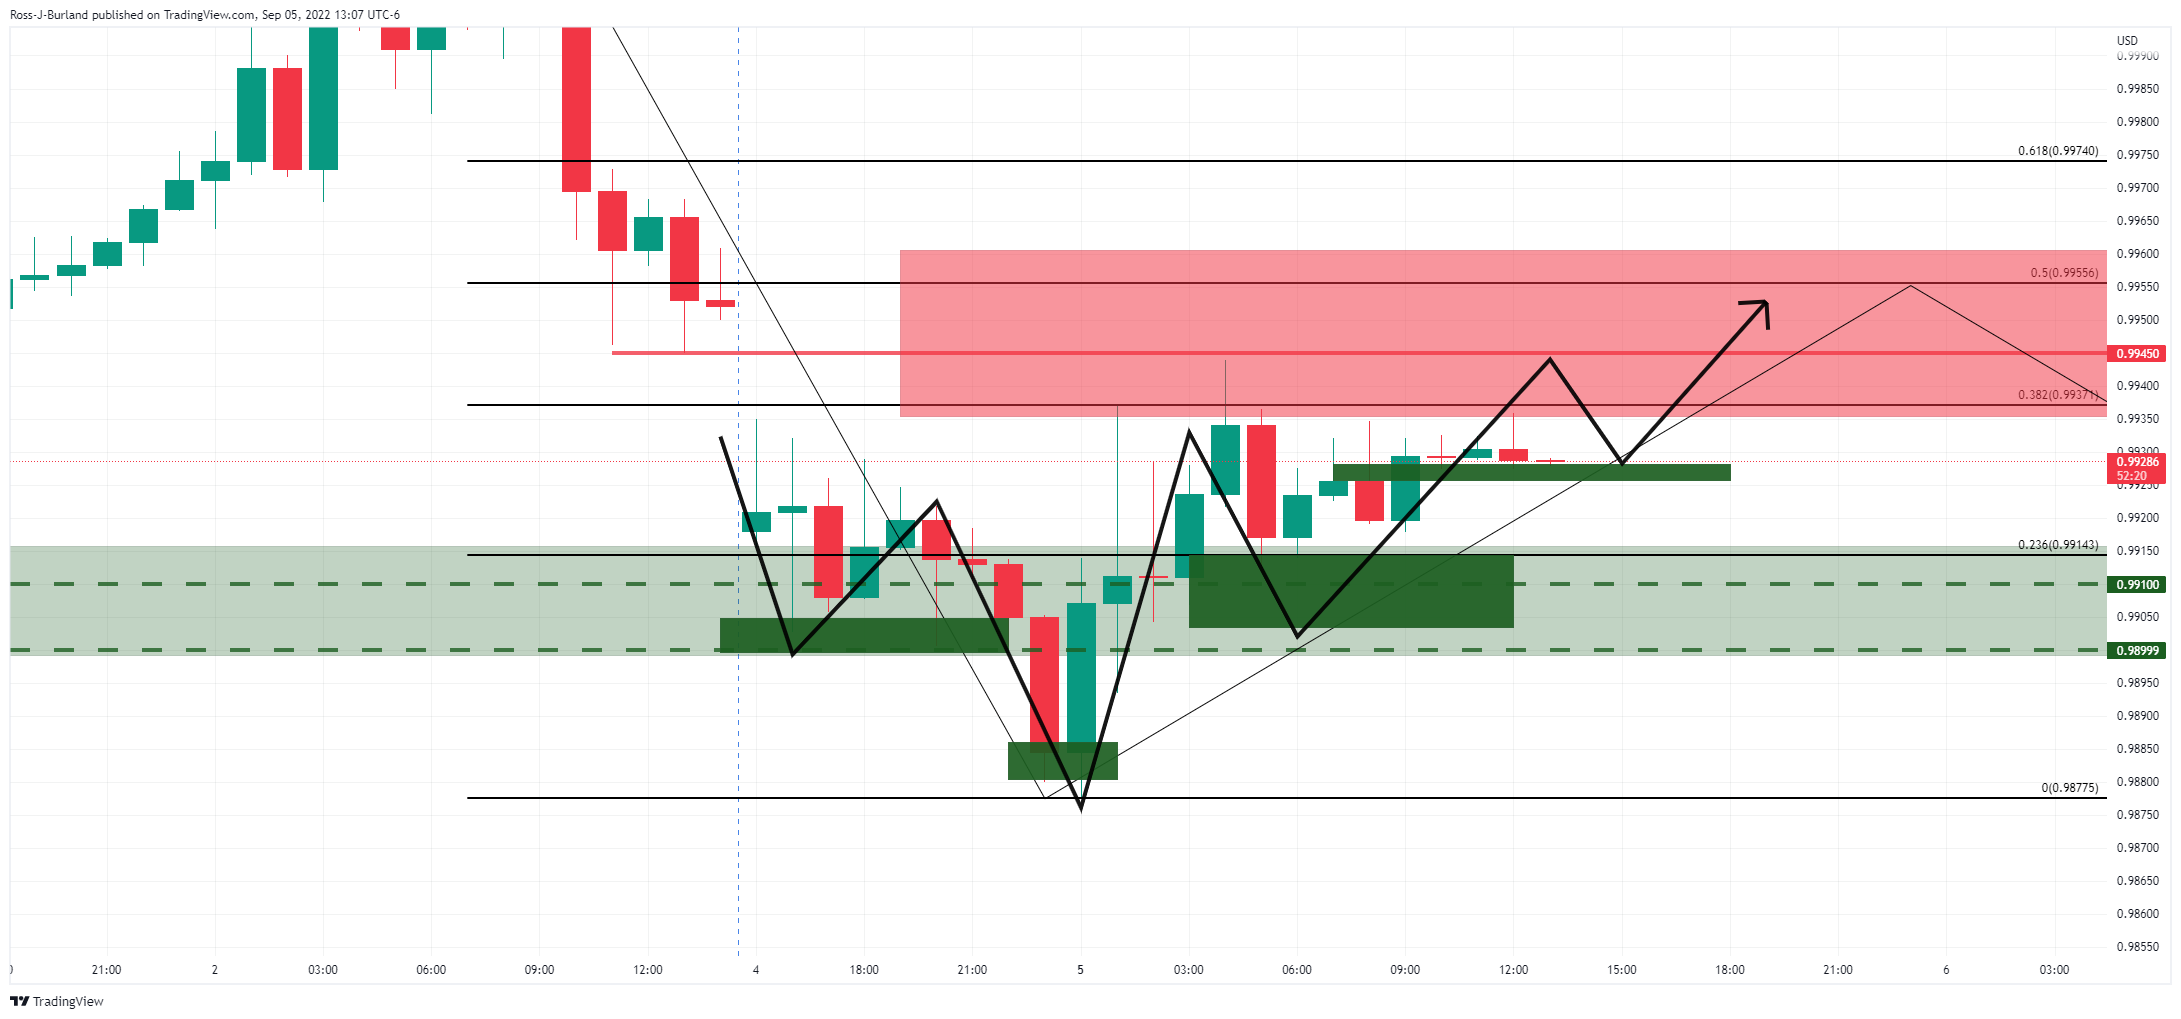
EUR/USD live update

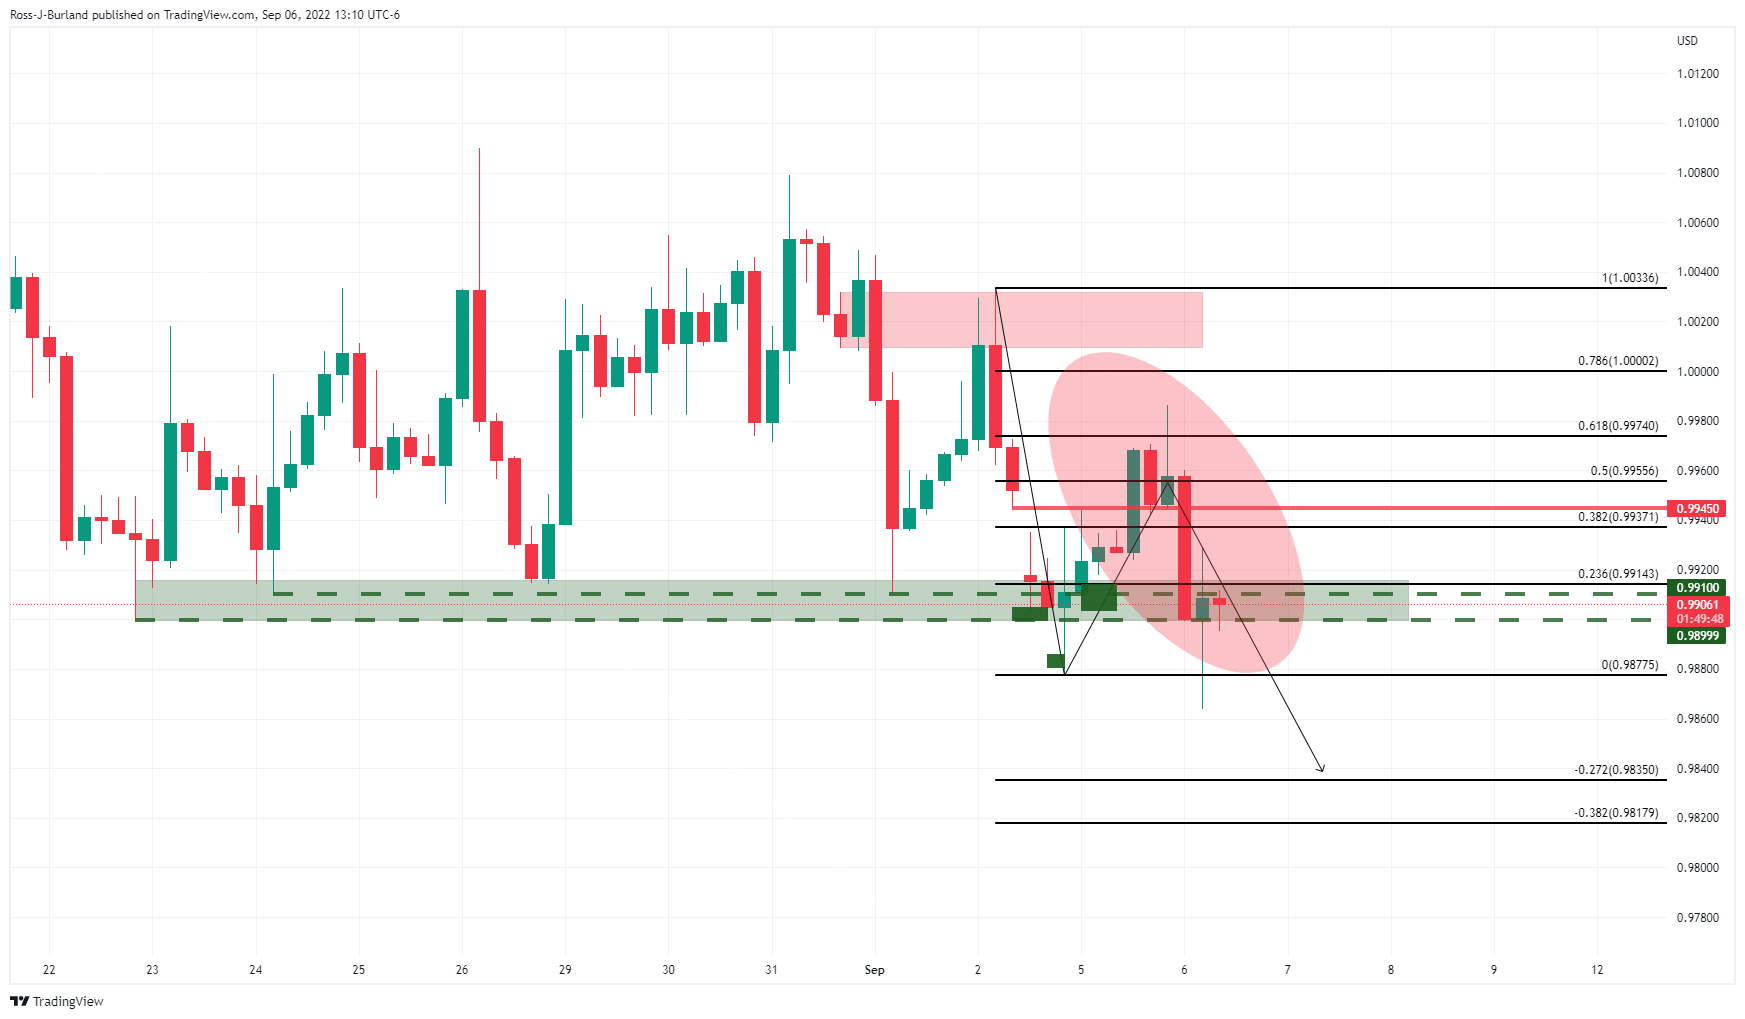
As shown, the price followed the projections accordingly and now the focus is on the M-formation and critical support that could now act as resistance:

On the other hand, there are bullish structures that have formed on the lower timeframes. The following 15-min W-formations could result in some meanwhile demand in the coming sessions:

-
19:41
EUR/JPY Price Analysis: Rallies to fresh seven-week highs due to JPY weakness
- EUR/JPY bounces nearby the 20-day EMA and jumps more than 200 pips on Tuesday.
- The EUR/JPY daily bias shifted from neutral to upwards.
- In the near term, a re-test of the YTD high at 144.27 is likely if EUR/JPY buyers reclaim 142.32; otherwise, it might fall towards 138.00.
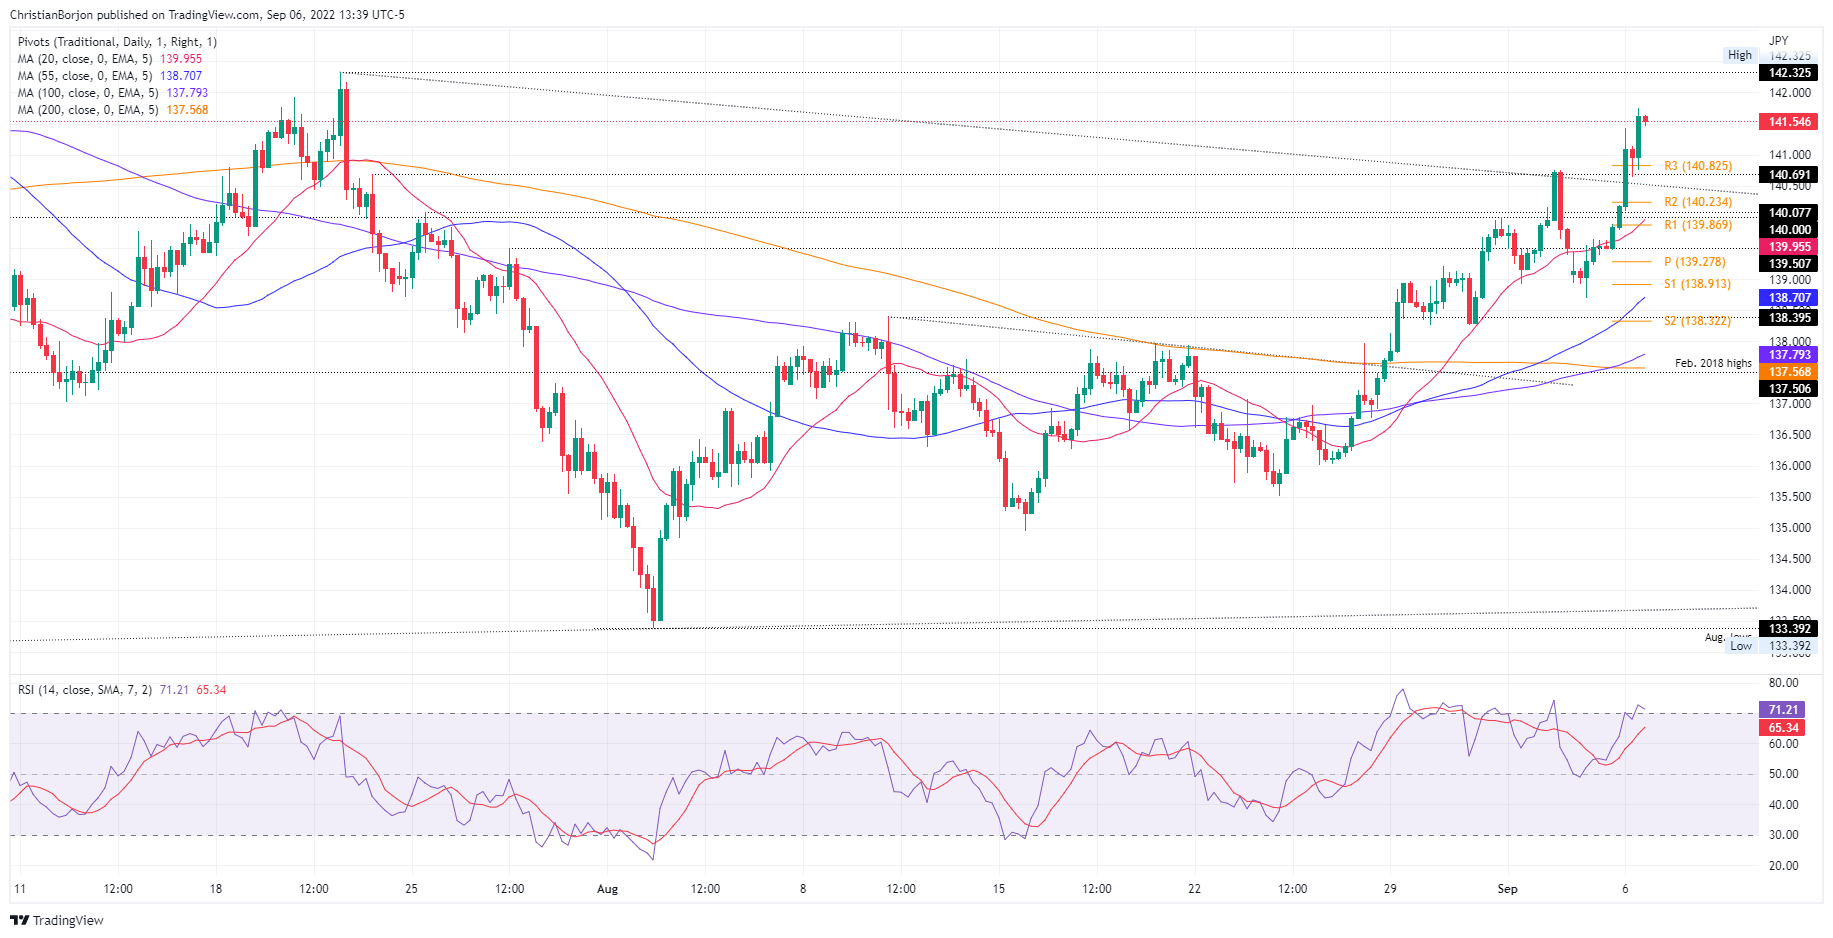
The EUR/JPY rallies sharply as the Japanese yen continues weakening across the FX board, up by almost 1.50%, nearly 200 pips. At the time of writing, the EUR/JPY is trading at 141.53, some pips below the seven-week high.
EUR/JPY Price Analysis: Technical outlook
The EUR/JPY extended its gains for the second consecutive day during the week. The cross-currency pair bounced off the week's lows at 136.91, so far advancing close to 300 pips, and on its way north, it cleared the September 2 daily high at 140.75. Therefore, the EUR/JPY bias shifted from neutral to upward biased, opening the door for further gains.
The EUR/JPY four-hour chart depicts the pair as upward biased, clearing crucial supply areas on its rally above 141.50. If EUR/JPY buyers reclaim the July 21 daily high at 142.32, a test of the YTD at 144.27 is on the cards.
Therefore, the EUR/JPY's first resistance would be the 142.00 mark. Break above will expose the July 21 high at 142.32, followed by the 143.00 figure and the YTD high target. On the flip side, the EUR/JPY first support would be the September 2 daily high at 140.75, followed by the 20-EMA at 139.95 and the 50-EMA at 138.70.
EUR/JPY Key Technical Levels
-
19:26
Gold Price Forecast: XAU/USD bleeds out from key resistance, but how far can the US dollar climb?
- Gold bears move back in following a significant bullish correction.
- The US dollar is moving on on a weekly target in the DXY near 110.80.
- The US CPI data next week will be a critical feature on the calendar ahead of the Fed.
The gold price on Tuesday has fallen back under pressure as the New York session blasts the US dollar to the moon on the back of mixed data at the start of the session. The yellow metal fell from a one-week high amid the ongoing speculation that global banks will continue along the path of their aggressive monetary policy tightening. Gold, at the time of writing, is lower by some 0.5% at $1,700 after falling from a high of $1,726.79 to the current lows.
The US dollar jumped on the back of the US services industry PMIs for August that have underpinned the market's opinion that the economy was not in recession last month. The DXY index, which measures the greenback vs. a basket of currencies rallied to fresh bull cycle highs of 110.553 while the Institute for Supply Management said its Non-manufacturing PMI edged up to a reading of 56.9 last month from 56.7 in July, the second consecutive monthly increase after three months of declines. The growth in services followed the ISM's manufacturing survey last week that showed US factory activity grew steadily in August, outpacing the nation's counterpart economies, such as Europe and China.
This data, however, will come in second place to next week's US Consumer Price Index for August where the core rate will be scrutinised for signs that the Fed will hike by 75bps rather the 50bps. Fed fund futures are now pricing in a 73% chance of a 75-basis-point rate hike by the Fed at its Sept. 20-21 policy meeting.
Meanwhile, the US benchmark Treasury yields rallied to their highest levels since June on expectations that the Federal Reserve will keep hiking interest rates which have weighed on the gold price considering its strips away the opportunity cost of holding the non-yielding precious metal.
However, analysts at TD Securities argued that ''while rates pricing now appears closer to fair, gold markets have failed to price the implications of a sustained period of restrictive interest rates.''
''Historical analogs suggest that periods in which market expectations for the real fed funds rate were above estimates of the natural rate of interest were accompanied by a persistent underperformance in gold prices. In turn, while gold prices may now have accurately captured the expected level of interest rates, they are not reflecting the implications of a sustained period of the restrictive policy,'' the analysts explained.
''Further,'' the analysts said, 'we see odds of a major capitulation event growing with every tick lower in gold prices, which could coincide with a break below a multi-decade uptrend in the yellow metal near $1675/oz. Gold markets still feature an extremely concentrated and bloated position held by a small number of family offices and proprietary trading shops, which are increasingly at risk as prices approach their pandemic-era entry levels.''
Gold technical analysis
As per the pre-open analysis, Gold, Chart of the Week: Bears eye a break of multi-decade uptrend near $1,676, it was explained that the price had since corrected from a strong sell-off on the daily timeframe and the bulls were moving which left prospects for a deeper correction over the start of the week as illustrated on the chart below:
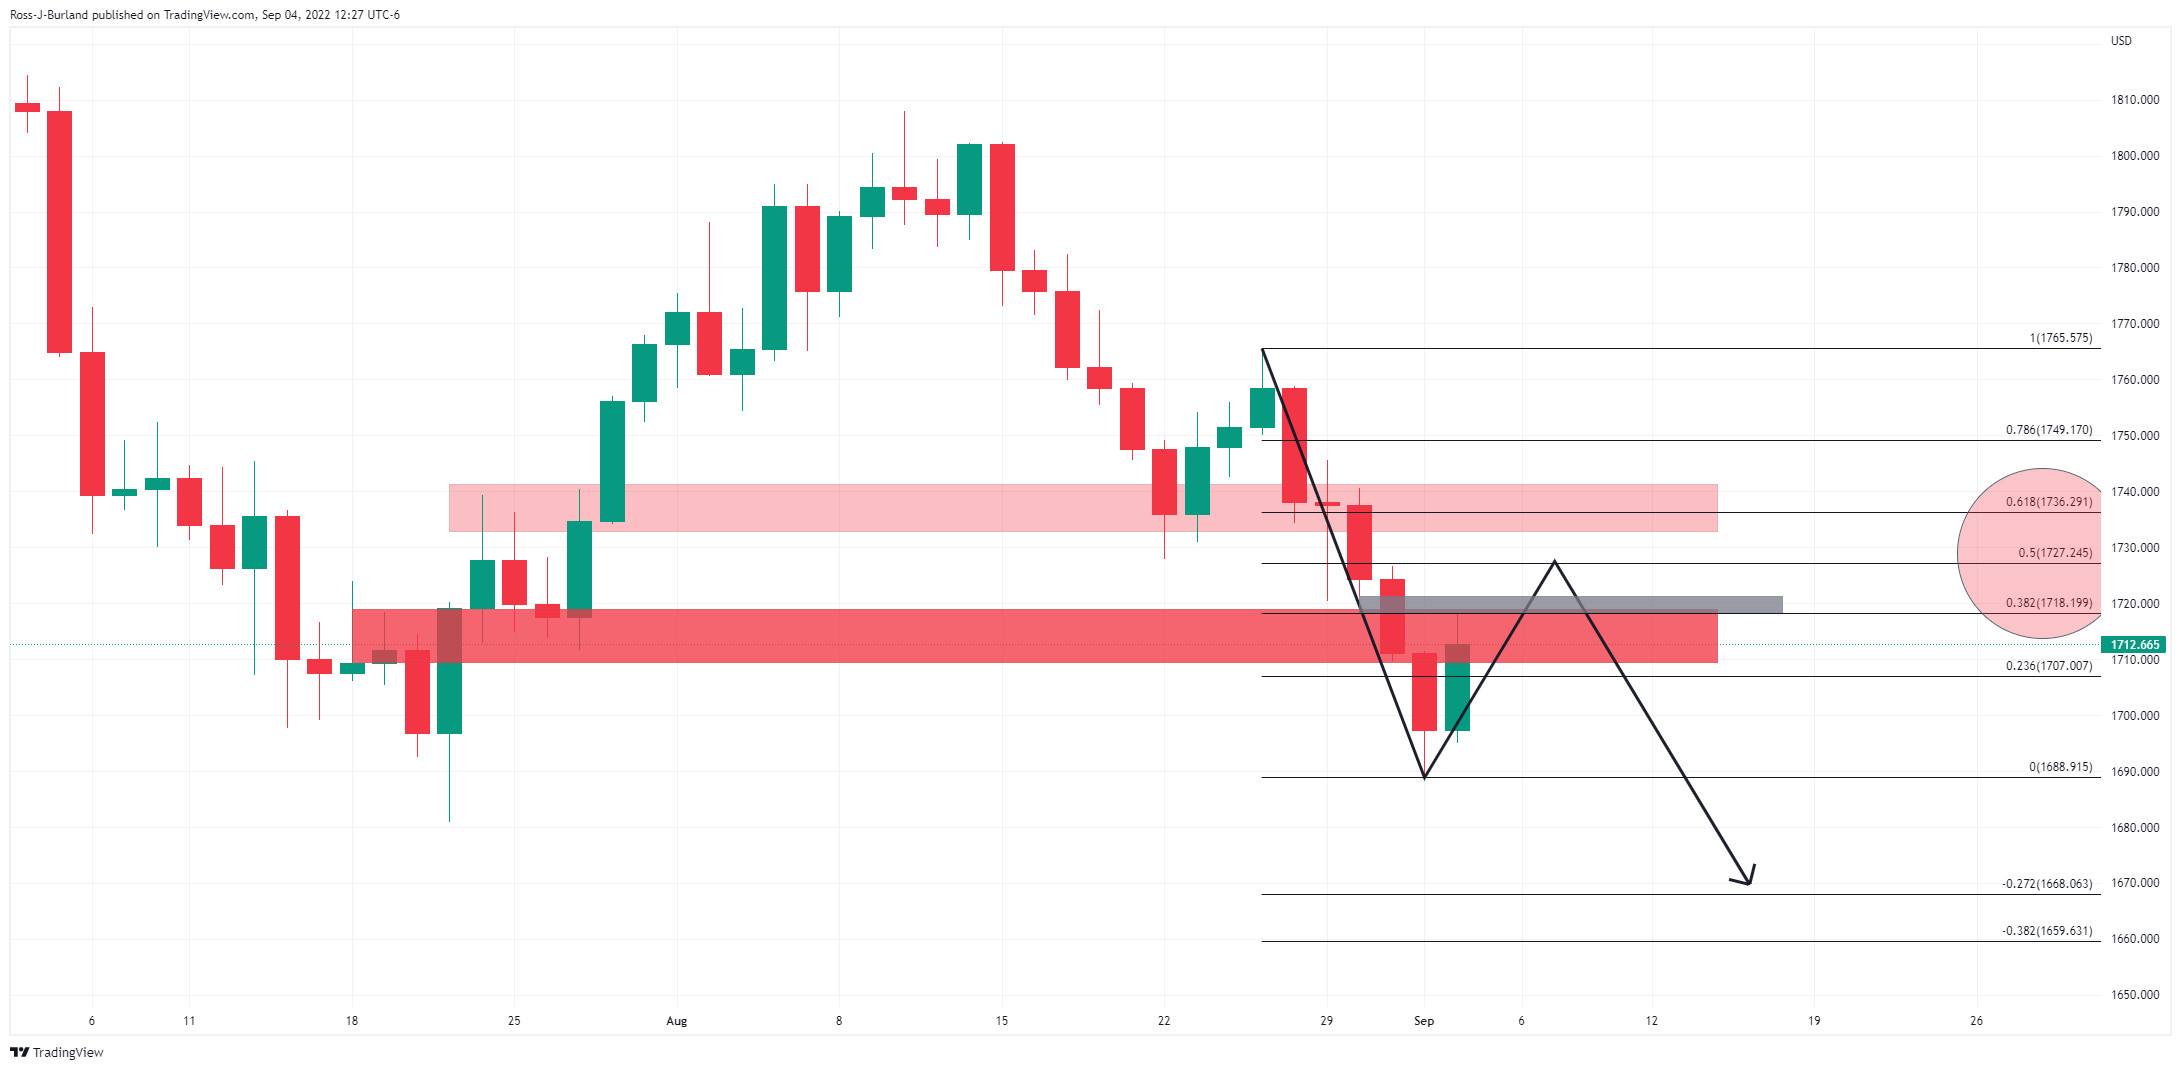
Gold, live market update

The price was headed towards a price imbalance near $1,721 and beyond there, a 50% mean reversion comes in near $1,727 prior structure. The bears have committed to the market here and we have seen a subsequent move to the downside again. This leaves the extension of the downside probable for a retest of the 2021 lows around $1,676:

With that being said, the US dollar may struggle at this juncture, at least for the immediate future as it homes in on a 110.80 weekly level:

-
18:51
United States 52-Week Bill Auction increased to 3.46% from previous 3.2%
-
18:27
AUD/USD falls sharply below 0.6800 despite RBA’s rate hike, Aussie GDP data eyed
- AUD/USD falls from weekly highs at around 0.6830s due to increased odds of an aggressive Fed hike.
- US ISM Non-Manufacturing activity for August surprisingly exceeded estimations, easing US recession worries.
- Australia’s GDP for the Q2, quarterly and yearly, is eyed on Wednesday’s Asian session.
The AUD/USD dives below its opening price, snapping two days of gains after the Reserve Bank of Australia hiked rates as expected. However, upbeat US economic data fueled estimations that, indeed, the US Federal Reserve would hike by 75 bps the Federal Funds Rate (FFR) in the September 21-22 meeting.
The AUD/USD reached Tuesday’s high after the RBA’s decision around 0.6832. but extended its losses, despite Philippe Lowe and Co. reiterating that the central bank is not done with tightening monetary conditions. So the AUD/USD extended its losses earlier in the North American session and is trading at 0.6732 at the time of writing.
AUD/USD dives on positive US economic data, despite RBA’s rate hike
During the New York session, August’s US ISM Non-Manufacturing PMI rose to 56.9, higher than forecasts at 54.9, and topped July’s 56.9 reading. Furthermore, New Orders increased to 61.8, more than 59.9 in July, while Prices Paid slowed to 71.5 from 72.3, signaling that higher interest rates are beginning to affect the economy.
Earlier in the Asian session, the Reserve Bank of Australia decided to raise rates by 50 bps, as widely estimated by analysts. Furthermore, the central bank kept the door open for further increases, but they are not on a pre-set path and would be guided by incoming economic data and the outlook for inflation and the labor market.
Later in the day, the Australian economic docket will feature GDP for Q2, with estimates at around 1% QoQ and 3.5% YoY. Analysts at TD Securities estimate GDP at 1.3% QoQ and 3.9% YoY.
“This should pip the market’s and the RBA’s 1% q/q, 3.5% y/y forecast. In terms of breakdown, we expect consumption +1% q/q, investment +0.6% q/q, net exports +0.8% ppt, and inventories +1.5% q/q. We don’t think a softer outcome (0.7 % q/q or below) will materially change the near-term RBA outlook, but a print of 1.5% q/q or above is likely to be viewed as hawkish by the market,” TDS analysts noted.
On the US front, Cleveland’s Fed President Loretta Mester is due to speak on Wednesday.
AUD/USD Key Technical Levels
-
17:40
Türkiye: CPI surprises to the downside in August, likely to be at 70% by year-end - BBVA
Inflation data in Türkiye came in below expectations in August with an increase of 1.46% in August. According to the Research Department at BBVA, stronger aggregate demand than supply, high cost push factors, recent utility price hikes and significantly deteriorated inflation expectations will lead to further acceleration in the Consumer Price Index despite recent easing in global commodity prices. Theys expect year-end consumer inflation at 70%, being supported by favorable base effects and assuming no further shocks to the exchange rate.
Key Quotes:
“Consumer prices rose by 1.46% in August, once again below both market consensus and our expectation (2%), which led to an annual inflation of 80.2%. The downside surprise stemmed from a larger decline in energy prices and weaker food inflation.”
“The surprise in energy prices also led to a smaller increase (2.4% mom) in domestic producer prices compared to previous months and resulted in an annual inflation of 143.7%.”
“We envisage that without any clear coordination on both fiscal and monetary policies to fight against inflation, the time inconsistency problem would eventually lead to higher inflation figures than the official targets as we had repeatedly witnessed in the recent years. High inertia, particularly on backward indexation (such as wages and rents), worsened inflation expectations, loose economic policies, and swelling intervention and regulatory barriers will continue to keep upside risks on the inflation outlook.”
“Ongoing high external financing needs and strong dollarization fuel depreciation pressures, which result in higher production costs. Therefore, we forecast consumer inflation to be 70% at the end of this year and 33% at the end of 2023, with risks skewed to the upside.”
-
17:24
USD/MXN Price Analysis: Testing 20.17 while looking at the critical 20.25
- USD/MXN jumps back above 20.00 as dollar strengthens versus emerging market currencies.
- Pair hits the 100-day SMA and retreats.
- Daily close above 20.25 to point to more gains.
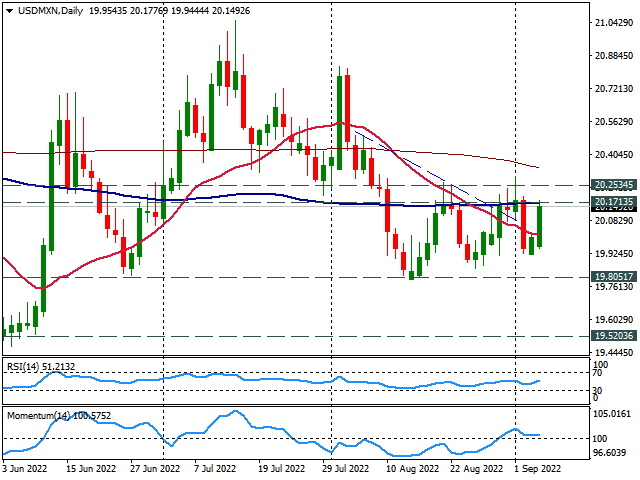
The USD/MXN is rising for the second day in a row on Tuesday, boosted by a stronger US dollar and extending a rebound after approaching to 19.90. The pair peaked at 20.17, after the release of US economic data, matching the 100-day Simple Moving Average (SMA).
The immediate resistance stands at 20.17; above the USD/MXN could rise to test 20.25. A break higher should change the short-term bias to neutral/bullish. A daily close above 20.25 would be a positive development of the US dollar, targeting the 20.45 zone.
Since mid-August USD/MXN is moving sideways in a range between 19.80 and 20.25. An interim support area is seen at 19.90. A firm break under 19.80 would weaken the dollar further, exposing 19.72.
USD/MXN daily chart
-
17:15
UK PM Truss: Will cut taxes to reward hard work
In a speech delivered on Tuesday, incoming British Prime Minister Liz Truss said that she will cut taxes to reward hard work, as reported by Reuters.
Additional takeaways
"We now face severe global headwinds."
Now is the time to tackle the issue holding Britain back."
"We need more investment and jobs in towns."
"We have what it takes to tackle national challenges."
"We can't have security at home without security abroad."
"I will get Britain working again."
"I will deal hands-on with the energy crisis."
"I will take action this week."
"I will secure our future energy supply."
"I will make sure people get the health services they need."
"We shouldn't be daunted by challenges we face."
Market reaction
GBP/USD pair showed no immediate reaction to these remarks and was last seen rising 0.25% on the day at 1.1540.
-
17:11
USD/CAD drops from weekly highs ahead of the BoC’s decision
- USD/CAD retraces from daily highs on the Bank of Canada’s monetary policy decision looming.
- In the last couple of weeks, upbeat US economic data reinforces the economy is stronger than the GDP contraction in the second quarter.
- On Wednesday, the Bank of Canada (BoC) is expected to hike rates by 75 bps.
The USD/CAD trims some of its Monday’s gains, edged slightly lower by some 0.08% after upbeat US economic data reinforced the scenario of the Fed’s tightening 75 bps in the September meeting. Nevertheless, the market’s reaction was limited due to expectations of the Bank of Canada hiking rates ahead of the Fed’s September meeting.
The USD/CAD extended its losses after hitting a daily high at 1.3170, though it erased those gains post-US economic data release, with the spot price stabilizing at current price levels. At the time of writing, the USD/CAD is trading at 1.3124.
USD/CAD trims some of its Monday’s gains on the BoC monetary decision looming
On Tuesday, the US economic calendar featured the US ISM Non-Manufacturing PMI for August, which exceeded estimations of 54.9, coming at 56.9 vs. 56.7 in the previous month’s reading. The same report showed the Prices Paid Index slowing to 71.5 from 72.3, while New Orders ticked up to 61.8, higher than 59.9 in July.
In the meantime, the US Dollar Index, a gauge of the buck’s value against a basket of six currencies, march firmly above the 110.000 mark, at 110.195, up by 0.54%, underpinned by higher US Treasury bond yields. The US 10-year benchmark note rate sits at 3.322%, up by ten bps, the highest level since June 2022.
Elsewhere, the Bank of Canada is expected to hike rates by 75 bps in September 7 meeting. The Bank of Canada Governor Tiff Macklem clarified that the central bank is focused on getting rates “slightly above” the neutral rate, where monetary policy neither stimulates nor weighs on the economy. Analysts estimate that the BoC would likely pause, after its anticipated hike, after last week’s GDP release suggested that the economy is cooling faster than expected.
What to watch
The Canadian economic docket will feature the Bank of Canada monetary policy decision on Wednesday. On the US front, Cleveland’s Fed President Loretta Mester will cross newswires.
USD/CAD Key Technical Levels
-
16:54
US ISM Services: Most components moving in the right direction – Wells Fargo
The ISM service sector activity index showed the highest reading in four months, after an unexpected increase in August. The underlying details point to services resilience with business activity and new orders notching their highest reading this year, explained analysts at Wells Fargo. They point out that supply challenges are easing, but hiring remains a challenge for employers.
Key Quotes:
“The ISM services index rose 0.2 points in August to 56.9, marking the fastest pace of expansion in the sector in four months. Most of the underlying components of the survey moved in the right direction and the headline index was buoyed by a pickup in business activity and new orders.”
“While hiring remains a challenge, the employment component climbed back into expansion territory in August. Hiring has wobbled between expansion and contraction for most of the year, despite sturdy job gains in the actual payroll report. Some of the gap is likely explained by employers being unable to find workers.”
“Among many crosscurrents in the economy at present, the outlook for services spending is an important one and the latest data suggest continued expansion in the sector. Consumer demand looks to be resilient despite high inflation and rising interest rates. It's not a lack of demand, but still strained supply that remains the biggest issue.”
-
15:58
GBP/USD wobbles around 1.1520 after upbeat US ISM Services PMI
- GBP/USD trimmed earlier gains nearby the 1.1600 figure on positive US economic data.
- The US services sector improved while price pressures continued to ease.
- Kwasi Kwarteng, the so-called new Chancellor in the UK: “Truss government would not blow a hole in public finances.”
The GBP/USD tumbled toward its opening price after the US ISM Non-Manufacturing PMI, a gauge of the services sector in August, improved, while supply bottlenecks and price pressures eased.
The GBP/USD is trading at 1.1528, slightly above its opening price, after hitting a fresh weekly high around 1.1609, but better-than-estimated US data sent cable nosediving, reaching a daily low at around 1.1493.
The Institute for Supply Management reported that the US ISM Non-Manufacturing PMI was up 56.9 vs. 56.7 in July, above estimates of 54.9, according to Reuters. Some of the report’s highlights were New Orders ticking up to 61.8, higher than 59.9 in July, while the Prices Paid Index decelerated to 71.5 from 72.3.
The GBP/USD edged lower, registering a daily low at the data release, at 1.1493. However, it bounced off the lows toward the current exchange rate. At the same time, the US Dollar Index, a gauge of the buck’s value vs. a basket of peers, edged towards 110.390, up 0.73%.
Earlier during the day, Queen Elizabeth appointed Liz Truss as the new UK Primer Minister. In the meantime, Kwasi Kwarteng, set to be the UK’s next Chancellor of the Exchequer, said that the new government would not blow a hole in the public finances, as widely expected via the FT.
Kwarteng added that the new administration would act in “a fiscally responsible way,” adding that the Truss government would be “bold” in promoting growth. He noted, “Liz is committed to a lean state and, as the immediate shock subsides, we will work to reduce the debt-to-GDP ratio over time.”
Datawise, the UK economic docket featured the S&P Global CIPS Construction PMI for August, which came at 49.2, higher than July’s 48.9, but remained in contractionary territory. The all-sector PMI, which includes data from the services segment and manufacturing, dropped to 49.6 from 51.8 in July, reinforcing the challenges that the new UK Prime Minister Liz Truss would face.
What to watch
The UK economic docket will feature the Halifax House Prices for August, while on the US front, the Trade Balance, alongside Fed speakers, will shed some light on the economic conditions in the US.
GBP/USD Key Technical Levels
-
15:57
New Zealand GDT Price Index above expectations (-1.4%): Actual (4.9%)
-
15:55
NZD/USD his two-year lows near 0.6000 after US data
- US dollar hits fresh highs across the board after US data.
- ISM service for August comes above expectation.
- NZD/USD drops sharply, remains above 0.6000.
The NZD/USD dropped further after the release of the US ISM service sector report and bottomed at 0.6034, the lowest level since May 2020. It then rebounded to 0.6050 trimming losses.
Upbeat US data, bad news
The August ISM service sector index rose unexpectedly to 56.9 against expectations of 55.1. The recovery boosted further the US dollar that printed fresh highs. Equity prices in Wall Street hit new lows and US yields jumped.
The NZD/USD reached levels below last week's lows. It is hovering around 0.6050, still on its way to the lowest daily close in years. A consolidation clearly below 0.6050 should open the doors for a test of 0.6000.
The stronger dollar and the deterioration in risk sentiment could keep the NZD/USD under pressure. Also, commodity prices are falling. The Chinese yuan hit new multi-year lows versus the dollar with USDCNH approaching 7.00.
On Wednesday, China will report trade data for August, and Australia, Q2 growth numbers. The relevant report of the week in New Zealand will be on Thursday with Q2 manufacturing activity. “This reading is key for the economic outlook after Q2 real retail sales unexpectedly fell -2.3% q/q vs. -0.9% in Q1, raising the risk that Q2 GDP also contracts again after -0.2% q/q in Q1”, said analysts at Brown Brothers Harriman.
Technical levels
-
15:25
Gold Price Forecast: XAU/USD not reflect the implications of a sustained period of restrictive policy – TDS
Gold markets have failed to price the implications of a sustained period of restrictive interest rates. Therefore, economists at TD Securities expect the yellow metal to remain vulnerable.
Odds of a major capitulation event grow with every tick lower
“Historical analogs suggest that periods in which market expectations for the real fed funds rate were above estimates of the natural rate of interest were accompanied by a persistent underperformance in gold prices. In turn, while gold prices may now have accurately captured the expected level of interest rates, they are not reflecting the implications of a sustained period of restrictive policy.”
“We see odds of a major capitulation event growing with every tick lower in gold prices, which could coincide with a break below a multi-decade uptrend in the yellow metal near $1,675.”
-
15:04
EUR/USD makes a U-turn and drops to new lows near 0.9870
- EUR/USD reversed the initial uptick to the vicinity of 0.9990.
- The dollar pushes higher and records new cycle highs.
- US ISM Non-Manufacturing next of relevance in the docket.
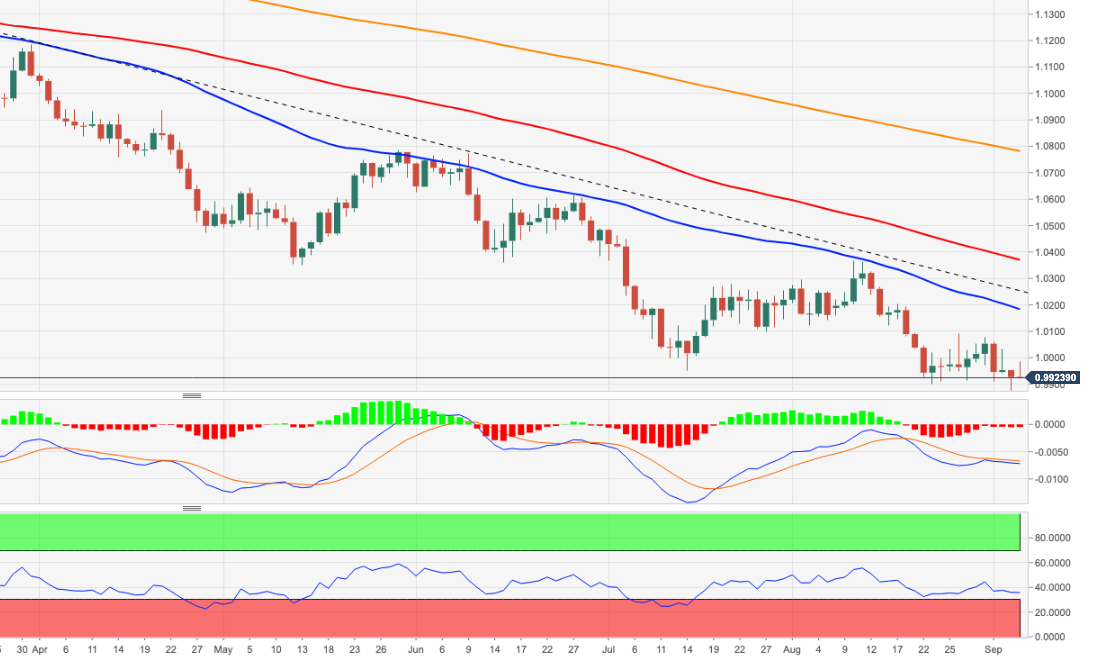
After briefly testing the 0.9990 region, EUR/USD sparked a corrective downside and returned to the sub-0.9900 region on Tuesday.
EUR/USD could now revisit the 2022 low
EUR/USD now adds to Monday’s negative start of the week and revisits the area below the 0.9900 yardstick on the back of the abrupt change of direction in the greenback, which lifts the US Dollar Index (DXY) to new highs near 110.30, an area last traded back in December 2002.
The daily downtick in the pair comes hand in hand with the march higher in US and German yields, as US investors return to their desks following Monday’s inactivity due to the Labor Day holiday.
Earlier in the euro docket, Germany’s Construction PMI eased to 42.6 in August (from 43.7). In the US calendar, the ISM Non-Manufacturing surprised to the upside at 56.9 in August.
What to look for around EUR
EUR/USD failed to ignite a lasting bullish attempt and succumbed once again to the unabated rally in the dollar.
So far, price action around the European currency is expected to closely follow dollar dynamics, geopolitical concerns, fragmentation worries and the Fed-ECB divergence. The latter, in the meantime, keeps closely following the prevailing debate around the size of the next interest rate hikes by both the ECB and the Federal Reserve.
On the negatives for the single currency emerge the so far increasing speculation of a potential recession in the region, which looks propped up by dwindling sentiment gauges as well as an incipient slowdown in some fundamentals.
Key events in the euro area this week: Germany Construction PMI (Tuesday) – Flash EMU Q2 GDP Growth Rate (Wednesday) – ECB Interest Rate Decision, Fed Powell (Thursday) – Eurogroup Meeting, Emergency Energy Meeting (Friday).
Eminent issues on the back boiler: Continuation of the ECB hiking cycle. Italian elections in late September. Fragmentation risks amidst the ECB’s normalization of its monetary conditions. Impact of the war in Ukraine and the persistent energy crunch on the region’s growth prospects and inflation outlook.
EUR/USD levels to watch
So far, the pair is losing 0.52% at 0.9876 and a breach of 0.9874 (2022 low September 5) would target 0.9859 (December 2002 low) en route to 0.9685 (October 2002 low). On the other hand, the next up barrier emerges at 1.0090 (weekly high August 26) ahead of 1.0182 (55-day SMA) and then 1.0202 (August 17 high).
-
15:02
US: ISM Services PMI improves to 56.9 in August vs. 55.5 expected
- US ISM Services PMI improved modestly in August.
- US Dollar Index touched a two-decade high above 110.50 after the data.
The business activity in the US service sector expanded at a slightly stronger pace in August than it id in July with the ISM Services PMI rising to 56.9 from 56.7. This reading came in better than the market expectation of 55.5.
Further detail of the publication revealed that the Prices Pair Index declined modestly to 71.5 from 72.3 and the Employment Index recovered to 50.2 from 49.1.
Commenting on the survey, "the services sector had a slight uptick in growth for the month of August due to increases in business activity, new orders and employment," noted Anthony Nieves, Chair of the Institute for Supply Management Services Business Survey Committee.
"Based on comments from Business Survey Committee respondents, there are some supply chain, logistics and cost improvements; however, material shortages remain a challenge," Nieves added. "Employment improved slightly despite a restricted labor market."
Market reaction
The US Dollar Index extended its dally and touched a fresh two-decade high of 110.55 with the initial reaction to the ISM report.
-
15:00
United States ISM Services PMI above expectations (55.1) in August: Actual (56.9)
-
15:00
United States ISM Services Prices Paid below expectations (76.5) in August: Actual (71.5)
-
15:00
United States ISM Services Employment Index above expectations (48.2) in August: Actual (50.2)
-
15:00
United States ISM Services New Orders Index registered at 61.8 above expectations (57) in August
-
14:52
Gold Price Forecast: XAU/USD refreshes daily low, eyes $1,700 amid Fed rate-hike jitters
- Gold struggles to preserve early gains to a one-week low and turns lower for the second straight day.
- Hawkish Fed expectations, rising US bond yields, resurgent USD demand exert downward pressure.
- The risk-on impulse overshadows recession fears and fails to lend support to the safe-haven XAU/USD.
Gold witnessed an intraday turnaround from a one-week high, around the $1,727 region touched earlier this Tuesday and turns lower for the second successive day. Spot prices refresh daily low during the early North American session, albeit have managed to hold above the $1,700 round-figure mark.
The risk-on impulse - as depicted by a generally positive tone around the equity markets - turns out to be a key factor that failed to assist the safe-haven gold to capitalize on its early positive move. Apart from this, the emergence of fresh US dollar buying attracts fresh selling around the dollar-denominated commodity and contributes to the intraday decline.
In fact, the USD Index has shot back closer to a two-decade high touched earlier this week and remains well supported by hawkish Fed expectations. Investors seem convinced that the Fed will continue to tighten its monetary policy more aggressively to tame inflation. Moreover, the current market pricing indicates a greater chance of a 75 bps rate hike in September.
This, in turn, triggers a fresh leg up in the US Treasury bond yields, which provides an additional lift to the buck and contributes to driving flows away from the non-yielding gold. That said, growing recession fears, along with economic headwinds stemming from fresh COVID-19 curbs in China, might keep a lid on the optimistic move and lend support to the precious metal.
Nevertheless, the bias still seems tilted in favour of bearish traders and supports prospects for a further depreciating move. Some follow-through selling below the $1,700 mark will reaffirm the negative outlook and make gold vulnerable to retesting last week's swing low, around the $1,689 region, before eventually dropping to the $1,680 area, or the YTD low touched in July.
Technical levels to watch
-
14:50
US: S&P Global Composite PMI falls to 44.6 (final) in August from 47.7
- US S&P Global Composite PMI declined to 44.6 in August.
- US Dollar Index posts strong gains above 110.00 in the American session.
Economic activity in the US private sector contracted at a stronger pace in August than it did in July with the S&P Global Composite PMI dropping to 44.6 from 47.7. This print came in weaker than the flash estimate and the market expectation of 45.
Further details of the publication revealed that the S&P Global Services PMI slumped to 43.7 from 47.3 in July, compared to the flash estimate of 44.1.
Commenting on the PMI report, "August saw the US economy slide into a steepening downturn, underscoring the rising risk of a deepening recession as households and business grapple with the rising cost of living and tightening financial conditions," said Chris Williamson, Chief Business Economist at S&P Global Market Intelligence.
Market reaction
The US Dollar Index showed no immediate reaction to this report and was last seen rising 0.6% on the day at 110.25.
-
14:46
United States S&P Global Composite PMI below expectations (45) in August: Actual (44.6)
-
14:46
United States S&P Global Services PMI came in at 43.7, below expectations (44.1) in August
-
14:28
BoC Preview: Forecasts from eight major banks, hiking rates again
The Bank of Canada (BoC) is set to announce its interest rate decision on Wednesday, September 7 at 14:00 GMT and as we get closer to the release time, here are the expectations as forecast by the economists and researchers of nine major banks, regarding the upcoming announcement.
The BoC is widely expected to hike its policy rate by 75 basis points (bps) to 3.25% from 2.50% following its September policy meeting.
BMO
“We now look for a 75 bps hike, with an outside chance of a larger move (a la their July 100 bps surprise).”
ING
“We do see a hawkish 75 bps hike supporting CAD on the day of the announcement, but most of the benefits of the BoC tightening for the loonie may take time to emerge, and would likely rely on stabilisation in global risk sentiment and some easing in USD strength. This could start to happen towards the end of the year, and still, high energy prices do suggest that a move to 1.25 in early 2023 is a tangible possibility.”
RBC Economics
“Another hefty 75 bps increase in the overnight rate is what we expect from the BoC. This would take the rate to a restrictive 3.25%, just above the 2% to 3% range the central bank deems ‘neutral’ (the rate at which interest rates are neither adding to nor subtracting from longer-run economic growth trends). And the bank’s commitment to front-loading rate hikes in the face of red-hot inflation means an even bigger 100 bps increase (matching July’s hike) can’t be ruled out. We expect policymakers to maintain a tightening bias beyond September, and follow up with an additional 25 basis point hike in October, bringing the overnight rate to 3.5%.”
TDS
“The economic situation clearly calls for restrictive policy rates, and we see a clear path for the BoC to hike by 75 bps in September. We expect the pace of tightening to slow in October however, which may imply some moderation in the Bank's forward-looking language in the September communique.”
NBF
“The BoC is set to deliver its fifth rate increase in as many meetings. We believe that 75 bps is the most likely outcome. In addition to the headline decision, there will be as much attention on updated policy guidance. We’ve argued that the BoC should pause its hiking cycle after bringing the policy rate into restrictive territory, allowing the economy time to catch up to the rapid tightening introduced to date. We might not see this explicitly written in the statement, but we’ll be looking for clues that the Bank is considering taking its foot off the brake – perhaps by emphasizing the need to be ‘data dependent’ going forward. The decision itself will be a statement-only affair, but we will hear from Senior Deputy Governor Carolyn Rogers on Thursday in an Economic Progress Report.”
Citibank
“We expect a 75 bps hike by the BoC, taking the policy rate to 3.25% with modestly hawkish risks around communications. Ultimately, the September meeting may still be too soon to sway much from a still-very aggressive stance to raising rates in order to cool inflation. Updates to the September policy statement could echo the op-ed released by Governor Macklem in August following the softer July CPI report. This suggests the statement could express some optimism around a potential peak in inflation as energy prices have declined. However, this is unlikely to reflect a new shift in the BoC’s assessment of the current inflation backdrop. So far, rate hikes have been explicitly characterized as front-loading, but this guidance may be rewritten as further rate hikes reflect a move to a restrictive level of rates. Our base case is that the BoC is unlikely to guide towards reaching a point of pausing the hiking cycle at least until the October meeting.”
CIBC
“We’re looking for a 75 bps hike, with the statement changing to say that interest rates might (rather than will) have to rise further.”
Wells Fargo
“We expect the BoC to deliver a 75 bps hike to 3.25%. We think the BoC will slow down the pace of its hikes beyond September, only taking the policy rate to 3.75% by the end of Q4-2022, although we see the risks as remaining tilted to a higher peak. We will be particularly interested in guidance on future policy from the BoC, especially against a backdrop of slowing growth and still-elevated inflation.”
-
14:08
When is the US ISM Services PMI and how could it affect EUR/USD?
US ISM Services PMI Overview
The Institute of Supply Management (ISM) will release the Non-Manufacturing Purchasing Managers' Index (PMI) - also known as the ISM Services PMI – at 14:00 GMT this Tuesday. The gauge is expected to fall to 55.1 in August from 56.7 in the previous month. Given that the Fed looks more at inflation than growth, investors will keep a close eye on the Prices Paid sub-component, which is anticipated to rise from 72.3 in July to 76.5 during the reported month.
According to Yohay Elam, Senior Analyst at FXStreet: “The services sector, America's largest, has been humming along at a rapid clip since the worst of the pandemic. Despite easing in early 2022, the indicator remained well above 50. That is the level separating expansion from contraction.”
How Could it Affect EUR/USD?
Ahead of the key release, the US dollar climbs back closer to a two-decade high set earlier this week amid a fresh leg up in the US Treasury bond yields, bolstered by hawkish Fed expectations. A stronger-than-expected US macro data will reinforce bets for a supersized 75 bps Fed rate hike move in September and lift the US bond yields even higher, along with the greenback.
Conversely, a weaker print will add to worries about a global economic downturn and act as a tailwind for the safe-haven greenback. This, along with worries about the worsening energy crisis in Europe, which could drag the region's economy faster and deeper into the recession, suggests that the path of least resistance for the EUR/USD pair is to the downside.
Eren Sengezer, European Session Lead Analyst at FXStreet, offers a brief technical overview of the EUR/USD pair: “The Relative Strength Index (RSI) indicator on the four-hour chart edged lower after having climbed above 50 during the Asian trading hours, reflecting the buyers' unwillingness to commit to additional euro gains.”
Eren also outlines important levels to trade the EUR/USD pair: “Currently, the pair is trading at 0.9950, where the 20-period SMA is located. In case this level turns into resistance, additional losses toward 0.9900 (psychological level) and 0.9880 (September 5 low) could be witnessed.”
“On the other hand, EUR/USD faces immediate resistance at 0.9980 (50-period SMA) ahead of 1.0000 (psychological level, Fibonacci 23.6% retracement of the latest downtrend) and 1.0025 (100-period SMA),” Eren adds further.
Key Notes
• ISM Services PMI Preview: High bar to help dollar bears pass through and take over
• EUR/USD Forecast: Euro could find it hard to benefit from risk flows
• EUR/USD: A drop to the 0.9600-0.9650 supports cannot be excluded – ING
About the US ISM manufacturing PMI
The Institute for Supply Management (ISM) Manufacturing Index shows business conditions in the US manufacturing sector. It is a significant indicator of the overall economic condition in the US. A result above 50 is seen as positive (or bullish) for the USD, whereas a result below 50 is seen as negative (or bearish).
-
13:49
USD/TRY remains bid above 18.00, keeps targeting 2022 highs
- USD/TRY adds to Monday’s gains and revisits 18.22.
- The stronger dollar puts the pair under upside pressure.
- The CBRT will decide on interest rates on September 22.
The persistent bid bias around the greenback pushes USD/TRY back to the 18.22 region on Tuesday.
USD/TRY up on USD-buying, looks to CBRT
USD/TRY extends the auspicious start of the week and once again trades at shouting distance from the all-time highs around 18.25 on Tuesday. The upbeat tone in the greenback continues to put the risk complex and the EM FX space under persistent pressure, always sustained by firm prospects of Fed’s tightening.
The lira, on the other hand, depreciated further after inflation figures in Türkiye ran at the hottest pace since September 1998 in August, at just above 80.0% YoY.
However, positive news for the lira came after the Türkiye’s Medium Term Program (MTP) now expects consumer prices to decline in the next years until levels below the 10.0% mark by 2025.
The MTP also expects the economy to expand 5% next year and 5.5% in 2024 and 2025. It is worth noting that Türkiye’s economy expanded the most in the G-20 in Q2, only after Saudi Arabia.
Türkiye’s finmin N.Nebati commented on the program and highlighted that policies aim at ensuring high-value added production, a continuing improvement in the current account, productivity and higher exports.
Now that inflation figures are out, investors' attention is expected to gyrate to the next monetary policy meeting by the Turkish central bank (CBRT).
What to look for around TRY
USD/TRY flirted with all-time highs around 18.25 last Friday, keeping the uptrend well in place and entering the ninth consecutive month in the positive territory.
In the meantime, price action around the Turkish lira is expected to keep gyrating around the performance of energy and commodity prices - which are directly correlated to developments from the war in Ukraine - the broad risk appetite trends and the Fed’s rate path in the next months.
Extra risks facing the Turkish currency also come from the domestic backyard, as inflation gives no signs of abating (despite rising less than forecast in July), real interest rates remain entrenched well in negative territory and the political pressure to keep the CBRT biased towards low interest rates remains omnipresent.
In addition, there seems to be no other immediate option to attract foreign currency other than via tourism revenue, in a context where official figures for the country’s FX reserves remain surrounded by increasing skepticism.
Eminent issues on the back boiler: FX intervention by the CBRT. Progress of the government’s scheme oriented to support the lira via protected time deposits. Constant government pressure on the CBRT vs. bank’s credibility/independence. Bouts of geopolitical concerns. Structural reforms. Presidential/Parliamentary elections in June 23.
USD/TRY key levels
So far, the pair is gaining 0.09% at 18.2235 and faces the immediate target at 18.2574 (2022 high September 2) seconded by 18.2582 (all-time high December 20) and then 19.00 (round level). On the other hand, a breach of 17.7586 (monthly low August 9) would pave the way for 17.6435 (55-day SMA) and finally 17.1903 (weekly low July 15).
-
13:38
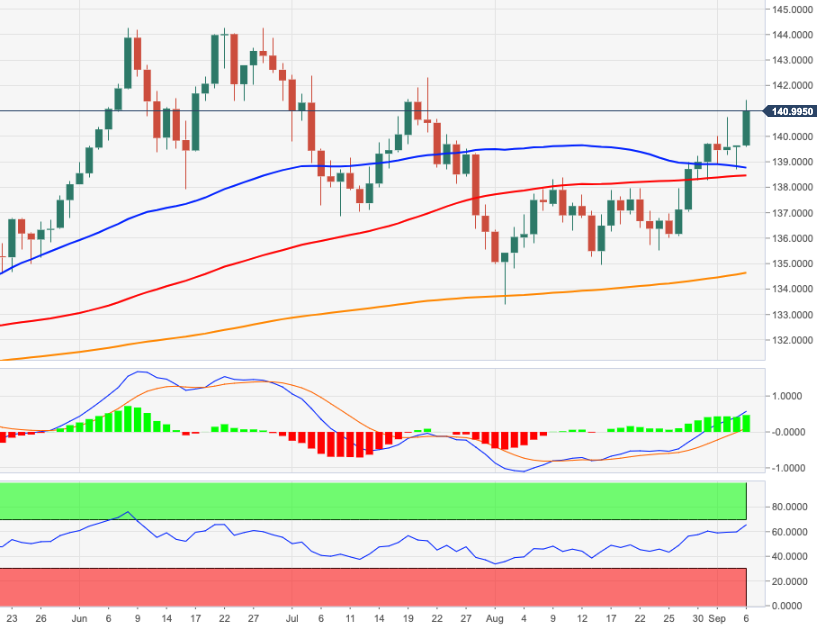
USD/JPY rallies to levels beyond 142.00 mark, highest since August 1998
- USD/JPY prolongs its recent strong bullish momentum and surges to a fresh 24-year peak.
- The Fed-BoJ policy divergence, widening US-Japan rate differential weigh heavily on the JPY.
- The emergence of fresh USD buying provides an additional boost and contributes to the rally.
The USD/JPY pair catches aggressive bids on Tuesday and rallies to levels just above the 142.00 mark, hitting a fresh 24-year high during the mid-European session.
The Japanese yen continues with its relative underperformance amid bets that the Bank of Japan’s ultra-loose monetary policy would continue. In contrast, the Federal Reserve is expected to stick to its aggressive policy-tightening path to tame inflation. This marks a big divergence in the monetary policy stance adopted by two major central banks and assists the USD/JPY pair to prolong a nearly one-month-old upward trajectory.
The recent hawkish remarks by several Fed officials reinforced market expectations for a supersized 75 bps rate hike at the September FOMC policy meeting. This remains supportive of elevated US Treasury bond yields, widening the US-Japan rate differential. Apart from this, the risk-on impulse - as depicted by a positive tone around the equity markets - undermines the safe-haven JPY and contributes to the USD/JPY pair's strong positive move.
The momentum is also supported by the emergence of fresh buying around the US dollar, which climbs back closer to a two-decade high amid hawkish Fed expectations. Furthermore, a sustained move above the previous YTD peak and a subsequent strength beyond the 141.00 mark seem to have prompted some technical buying around the USD/JPY pair. That said, the slightly overbought RSI (14) on the daily chart warrants some caution for aggressive bullish traders.
Nevertheless, the fundamental backdrop suggests that the path of least resistance for the USD/JPY pair is to the upside and any meaningful pullback might still be seen as a buying opportunity. Market participants now look forward to the US economic docket, featuring the ISM Services PMI for a fresh impetus during the early North American session. Traders will further take cues from the US bond yields, the USD price dynamics and the broader risk sentiment.
Technical levels to watch
-
13:18
EUR/PLN: Stable for now, decline expected in 2023 – ING
Economists at ING expect the EUR/PLN to trade sideways throughout the rest of the year. In 2023, however, the pair should start to move downward.
Zloty should be supported by high rates in Poland in 2023
“In the remainder of 2022, we expect EUR/PLN to remain in a broad horizontal trend. During the holiday period, investors betting against the zloty took notable stop-losses on low liquidity. Hence, now they should be less inclined to take long EUR/PLN or USD/PLN positions.”
“Next year, we expect a gradual EUR/PLN decline. The zloty should be supported by high rates in Poland, while some key central banks gear towards easing.”
-
13:15
EUR/JPY: Negative growth outlook favours downside – ING
Economists at ING note that EUR/JPY is positively correlated with growth cycle. Therefore, they expect the pair to move downward over the coming months.
The cycle is not looking good
“EUR/JPY typically tends to be positively correlated with the global growth cycle – and clearly the cycle is not looking good.”
“Fiscal efforts by governments to offset the energy crisis at both the consumer and business level will struggle to prevent economies entering recession. The recent hawkish turn from the ECB has yet to provide any lasting support to the euro.”
“Our EZ macro team looks for just a 75 bps ECB tightening cycle this year – compared to 166 bps of tightening expected by the market. If correct, that should leave the euro vulnerable this autumn.”
-
13:06
GBP/USD could extend its rebound if it manages to clear 1.1600
GBP/USD clings to daily recovery gains above 1.1550. The pair needs to clear 1.1600 to attract buyers, FXStreet’s Eren Sengezer reports.
The near-term technical outlook points to a bullish shift
“Near-term technical outlook points to a bullish tilt following the latest rebound.”
“1.1600 (psychological level, static level) aligns as immediate resistance. In case the pair manages to hold above that level, the 1.1640/50 area (50-period SMA, static level) could be seen as the next hurdle ahead of 1.1700 (static level, psychological level).”
“On the downside, 1.1550 (20-period SMA) forms first support before 1.1500 (psychological level, upper limit of the descending channel) and 1.1440 (September 5 low).”
-
12:49
Reuters Poll: ECB expected to hike by 75 bps on September 8
34 of 67 economists polled by Reuters said that they expect the European Central Bank (ECB) to hike the rate on the main refinancing operations by 75 basis points (bps) to 1.25% on September 8.
29 economists forecasted the bank to raise its key rate by 50 bps while four economists said they saw the ECB raising the rate by only 25 bps.
Market reaction
The shared currency stays under modest bearish pressure heading into the American session on Tuesday. As of writing, the EUR/USD pair was posting small daily losses at 0.9920.
-
12:00
EUR/USD Price Analysis: Upside remains capped by 1.0100
- EUR/USD fades the initial bull run to 0.9985/90.
- The resumption of the selling pressure could retest the YTD low.
EUR/USD climbed to the proximity of 0.9990 earlier in the session, just to deflate afterwards and return to the 0.9930 region.
Against that, the inability of the pair to regain serious upside traction should keep the door to further retracement open in the near term. Extra losses face the immediate target at the 2022 low at 0.9877 (September 5) seconded by 0.9859 (December 2002 low) and then 0.9685 (October 2002 low).
The continuation of the downtrend remains in the pipeline, as the daily RSI around 36 still allows for some weakness prior to reach the oversold territory.
In the longer run, the pair’s bearish view is expected to prevail as long as it trades below the 200-day SMA at 1.0780.
EUR/USD daily chart
-
11:54
UK's Truss planning to freeze energy prices for 18 months – BBC
British Prime Minister Liz Truss plans to freeze energy prices for households for 18 months and allow energy companies to take out government-guaranteed loans to make up for the difference between the wholesale and retail prices, BBC reported on Tuesday.
Truss is expected to unveil her plan on Thursday.
Market reaction
This headline doesn't seem to be having a significant impact on risk sentiment with the UK's FTSE 100 Index clinging to small daily gains at 7,299 points. Meanwhile, GBP/USD was last seen rising 0.5% on the day at 1.1572.
-
11:53
USD/CAD keeps the red on softer USD, downside remains cushioned amid sliding oil prices
- USD/CAD comes under fresh selling pressure on Tuesday amid the ongoing USD profit-taking slide.
- A sharp fall in crude oil prices undermines the loonie and helps limit deeper losses for the major.
- Investors now eye US ISM Services PMI for some impetus ahead of the BoC meeting on Wednesday.
The USD/CAD pair meets with a fresh supply on Tuesday and maintains its offered tone through the first half of the European session. The pair, however, recovers a few pips from the daily low and is currently trading comfortably above the 1.3100 round-figure mark.
A recovery in the global risk sentiment - as depicted by a generally positive tone around the equity markets - drags the safe-haven US dollar away from a two-decade high touched on Monday. This turns out to be a key factor exerting some downward pressure on the USD/CAD pair. That said, a sharp fall in crude oil prices undermines the commodity-linked loonie and offers some support to spot prices.
Oil prices come under renewed selling pressure and drop back closer to a multi-month low touched last week. An OPEC+ deal to cut output by 100,000 barrels per day in October was seen as a symbolic move. This, along with worries that a global economic downturn and COVID-19 curbs in China will dent fuel demand, overshadows concerns over tight global supply and weighs heavily on the black liquid.
Furthermore, rising US Treasury bond yields, bolstered by hawkish Fed expectations, support prospects for the emergence of some USD dip-buying and should limit losses for the USD/CAD pair. Investors seem convinced that the Fed will stick to its aggressive policy tightening path to tame inflation and have been pricing in a greater chance of a supersized 75 bps at the September FOMC policy meeting.
The fundamental backdrop suggests that the path of least resistance for the USD/CAD pair is to the upside and any meaningful slide might still be seen as a buying opportunity. Traders, however, might prefer to move to the sidelines ahead of the Bank of Canada meeting on Wednesday. In the meantime, the US ISM Services PMI might provide some impetus later during the early North American session.
Technical levels to watch
-
11:30
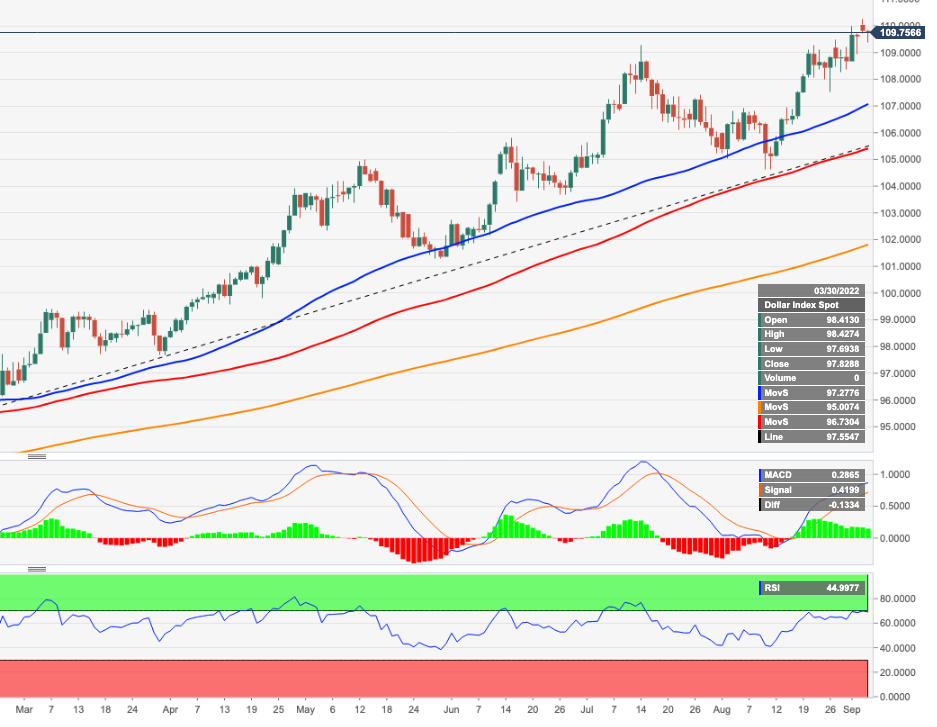
US Dollar Index Price Analysis: Another test of the 2022 high appears in store… soon
- DXY keeps navigating in the upper end of the range just below 110.00.
- Further upside could well see the YTD peak past 110.00 revisited.
DXY trades with modest gains in the 109.70/80 band on Tuesday.
The short-term bullish view in the dollar remains well in place for the time being and propped up by the 7-month support line, today around 105.80.
Still on the upside, the surpass of the recent top at 110.27 (September 5) could face the next barrier at the weekly highs at 111.90 (June 6 2002) and 113.35 (May 24 2002).
Looking at the long-term scenario, the bullish view in the dollar remains in place while above the 200-day SMA at 101.13.
However, the current overbought conditions of the index could trigger some corrective downside, which should be seen as a buying opportunity.
DXY daily chart
-
11:14
European energy bills to surge $2 trillion by 2023 – Goldman Sachs
Analysts at Goldman Sachs said in their latest note that energy bills for European households will surge by EUR2 trillion ($2 trillion) at their peak in early 2023.
Key quotes (via Bloomberg)
"At their height, energy bills will represent about 15% of Europe’s gross domestic product."
“In our view, the market continues to underestimate the depth, the breadth and the structural repercussions of the crisis.”
“We believe these will be even deeper than the 1970s oil crisis.”
“Stock investors are too pessimistic about the effect of regulatory efforts.”
“The introduction of price caps in power generation could save the bloc around 650 billion euros in power bills and offer consumers and markets some relief while allowing governments to forgo a windfall-profits tax.”
-
11:05
EUR/JPY Price Analysis: Increasing bets for a move to 142.00 and above
- EUR/JPY extends the rebound past the 141.00 mark on Tuesday.
- Immediately to the upside comes the 142.30 zone.
EUR/JPY accelerates gains and trespasses the 141.00 barrier, or multi-week highs, on Tuesday.
Extra gains in the cross remains favoured for the time being, with the next target now emerging at the weekly top at 142.32 (July 21) ahead of the 2022 peak at 144.27 (June 28).
While above the 200-day SMA at 134.60, the prospects for the pair should remain constructive.
EUR/JPY daily chart
-
11:02
AUD/USD slides to its lowest level since mid-July, seems vulnerable to weaken further
- AUD/USD struggles to capitalize on its intraday gains despite another 50 bps rate hike by the RBA.
- The risk-on mood undermines the safe-haven USD, though fails to benefit the risk-sensitive aussie.
- Hawkish Fed expectations favour the USD bulls and support prospects for further losses for the pair.
The AUD/USD pair witnessed an intraday turnaround from the 0.6830-0.6835 area on Tuesday and drops to its lowest level since mid-July during the first half of the European session. The pair is currently placed around the 0.6760 region and seems vulnerable to prolonging a nearly one-month-old descending trend.
Despite the Reserve Bank of Australia's decision to hike interest rates by 50 bps rate, the Australian dollar struggles to capitalize on its modest intraday gains. Expectations that the RBA is nearing the end of its rate hike cycle turn out to be a key factor acting as a headwind and attracting fresh selling around the AUD/USD pair.
Even the risk-on impulse, which is seen dragging the safe-haven US dollar away from a two-decade high touched the previous day, fails to impress bulls. The global risk sentiment stabilizes after China pledged to make renewed efforts to boost its economy. This, however, did little to lend any support to the risk-sensitive aussie.
Growing recession fears, along with the economic headwinds stemming from fresh COVID-19 curbs in China and the ongoing war in Ukraine, should keep a lid on any optimistic move. Apart from this, hawkish Fed expectations should limit the USD losses, suggesting that the path of least resistance for the AUD/USD pair is to the downside.
In fact, the markets seem convinced that the Fed will tick to its aggressive policy tightening path and have been pricing in a greater chance of a supersized 75 bps rate hike at the September meeting. This is reinforced by a fresh leg up in the US Treasury bond yields, which supports prospects for the emergence of some USD dip-buying.
Market participants now look forward to the US economic docket, featuring the release of the ISM Services PMI later this Tuesday. The data might influence the USD price dynamics and provide some impetus to the AUD/USD pair. The focus will then shift to the quarterly Australian GDP report, scheduled during the Asian session on Wednesday.
Technical levels to watch
-
10:56
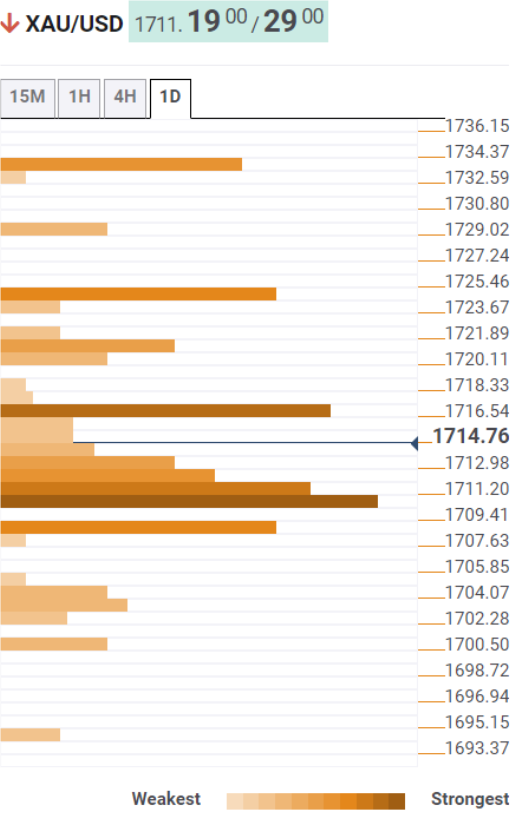
Gold Price Forecast: XAU/USD eyes $1,700 as path of least resistance appears down – Confluence Detector
- Gold price reverses sharply amid an upturn in the yields and the US dollar.
- Global tightening bets, recession fears continue to bode ill for the bullion.
- XAU/USD eyes the $1,700 mark amid a bear cross and a wall of resistance levels.
Gold price is looking to resume the recent downtrend, as sellers fight back control ahead of key US events and the ECB rate hike decision. The European energy crisis-led recession fears keep investors on the edge while driving yields higher globally. The benchmark US 10-year Treasury yields are roughly 2% higher on the day at around 3.25%, emerging as the main catalyst behind the dollar recovery and the renewed downside in the non-yielding bullion. The bright metal also remains weighed down by hopes for continued tightening by major global central banks, as they remain committed in their fight to tame inflation. Further, a looming bear cross on the metal’s daily chart also keeps the downside favored for sellers. All eyes now remain on the US ISM Services PMI, ECB policy announcement and Fed Chair Jerome Powell’s speech for fresh trading impetus.
Also read: Gold Price Forecast: Will XAU/USD find acceptance above 23.6% Fibo resistance?
Gold Price: Key levels to watch
The Technical Confluence Detector shows that the gold price is challenging powerful support at around $1,711, which is the convergence of the previous month’s low and Fibonacci 23.6% one-day.
A sustained break below the latter will put the previous day’s low of $1,709 under threat. The next support zone is seen around $1,703, where the Fibonacci 23.6% one-week and pivot point one-day S2 merge.
Sellers will then test the $1,700 mark, the round figure and the pivot point one-day S3.
On the flip side, a dense cluster of healthy resistance levels is stacked up around $1,713, the intersection of the SMA10 four-hour, Fibonacci 61.8% one-day and the SMA5 one-day.
The previous day’s high of $1,716 will offer further resistance to bulls on their road to recovery. The next relevant upside target is aligned at the Fibonacci 161.8% one-day at $1,720.
The confluence of the Fibonacci 61.8% one-week and pivot point one-day R3 at $1,724 will be the level to beat for buyers.
Here is how it looks on the tool
About Technical Confluences Detector
The TCD (Technical Confluences Detector) is a tool to locate and point out those price levels where there is a congestion of indicators, moving averages, Fibonacci levels, Pivot Points, etc. If you are a short-term trader, you will find entry points for counter-trend strategies and hunt a few points at a time. If you are a medium-to-long-term trader, this tool will allow you to know in advance the price levels where a medium-to-long-term trend may stop and rest, where to unwind positions, or where to increase your position size.
-
10:35
ECB: A 50 bps rate hike appears favoured – UOB
Economist at UOB Group Lee Sue Ann noted the ECB could raise rates by 50 bps at its event later this week, although a larger hike (75 bps) should not be ruled out.
Key Quotes
“Various ECB officials have sounded particularly hawkish, appearing to support the push for an outsized 75bps hike at the upcoming meeting.”
“We are not ruling out that move, although we have penciled in a 50bps increase at the Sep meeting. All in all, the ECB seems to be stressing its determination on a path of normalisation.’
-
10:31
South Africa Gross Domestic Product (QoQ) above expectations (-0.8%) in 2Q: Actual (-0.7%)
-
10:30
South Africa Gross Domestic Product (YoY) below expectations (0.6%) in 2Q: Actual (0.2%)
-
10:22
GBP/USD pares intraday gains to multi-day peak, faces rejection near 1.1600 mark
- GBP/USD edges higher for the second straight day, though lacks any follow-through buying.
- Hopes for a fiscal boost from the new UK PM, more aggressive BoE rate hike bets lift the GBP.
- The risk-on impulse prompts some follow-through USD profit-taking and remains supportive.
- Hawkish Fed expectations and the UK’s bleak economic outlook keep a lid on any further gains.
The GBP/USD pair retreats a few pips from a multi-day peak, around the 1.1600 mark touched earlier this Tuesday and for now, seems to have stalled its bounce from the lowest level since March 2020. The pair, however, holds in the positive territory for the second straight day and is currently placed around the 1.1565 region, still up over 0.40% for the day.
Speculation over the incoming UK Prime Minister Liz Truss’s energy relief plans offers a much-needed respite to the British pound. This, along with rising bets for more aggressive interest rate hikes by the Bank of England and a modest US dollar weakness, continues to act as a tailwind for the GBP/USD pair. In fact, the BoE policymaker Catherine Mann said on Monday that the central bank should be prepared to raise interest rates rapidly to bring down inflation. The markets were quick to react and are now pricing in an 85% chance that the BoE will hike rates by 75 bps on September 15.
The USD, on the other hand, retreats further from a two-decade high touched the previous day and offers additional support to the GBP/USD pair. The risk-on impulse - as depicted by a generally positive tone around the equity markets - is seen as the only factor undermining the safe-haven greenback. That said, the prospects for more sharp interest rate hikes by the Federal Reserve, along with a fresh leg up in the US Treasury bond yields, help limit deeper losses for the buck. Apart from this, the UK's bleak economic outlook further contributes to capping any meaningful upside for the GBP/USD pair.
On the economic data front, the UK Constructive PMI unexpectedly rose from 48.9 to 49.2 in August, though remained in the contraction territory. This, however, did little to influence sterling or provide any impetus to the GBP/USD pair. Hence, it will be prudent to wait for strong follow-through buying before confirming that spot prices have formed a near-term bottom and positioning for any further gains. Traders now look forward to the US ISM Services PMI for some impetus later during the early North American session.
Technical levels to watch
-
10:13
ECB’s Kazaks: The central bank will hike above neutral rate if needed
European Central Bank (ECB) policymaker Martins Kazaks said in an interview with Eurofi magazine on Tuesday that the “ECB will hike above a neutral rate if needed.”
However, he added that a broad and protracted recession could slow rate hikes.
Meanwhile, Governing Council member Mario Centeno said that “the ECB may achieve inflation goal with slow normalization.”
Market reaction
EUR/USD is receding towards 0.9900, with deliberate attempts by the ECB policymakers to douse expectations of a 75 bps rate hike on Thursday.
The pair was last seen trading at 0.9940, adding 0.16% so far.
-
10:08
ECB’s Stournaras: Eurozone inflation is close to its peak
“Eurozone inflation is close to its peak,” European Central Bank (ECB) Governing Council member Yannis Stournaras said on Tuesday.
Additional takeaways
“Inflation will start steady deceleration.”
“See energy costs moderating, bottlenecks easing.”
“Fragmentation risks must be forcefully confronted.”
“Further progressive rate normalization appropriate.”
Market reaction
The shared currency shrugs off the above comments, with EUR/USD adding 0.19% on the day at 0.9945, as of writing.
-
10:02
USD/CNH: A test of 7.0000 could be shaping up – UOB
FX Strategists at UOB Group Lee Sue Ann and Quek Ser Leang suggested that USD/CNH could challenge the 7.0000 region once 6.9600 is cleared.
Key Quotes
24-hour view: “While we expected USD to strengthen yesterday, we were of the view that ‘a break of 6.9400 is unlikely for now’. The anticipated USD strength exceeded our expectations as USD jumped to 6.9554 before pulling back. The pullback amidst overbought conditions suggest USD is unlikely to advance further. For today, USD is more likely to trade sideways between 6.9250 and 6.9500.”
Next 1-3 weeks: “We have expected a stronger USD for three weeks now. As USD struggle to extend its gains above 6.9325, we highlighted yesterday that while upward momentum has waned somewhat, only a break of 6.8700 would indicate that USD is not strengthening further. USD subsequently jumped to a high of 6.9554 before pulling back. Upward momentum has improved, albeit not by much. While further USD strength is likely, USD has to close above 6.9600 before a move towards 7.0000 can be expected. The chance for USD to close above 6.9600 would remain intact as long as USD does not move below 6.9070 (‘strong support’ level was at 6.8700 yesterday).”
-
09:55
GBP/USD: Sterling will struggle to strengthen given structural factors for UK remain an Achilles heel – MUFG
GBP/USD has risen up towards the 1.16 level and EUR/GBP has fallen back below 0.86 as more fiscal policy stimulus is on the way in the UK. Still, the pound remains vulnerable to further weakness, in the view of economists at MUFG Bank.
New Prime Minister Liz Truss set to unveil bold response to energy crisis
“The improvement in the cyclical outlook for the UK economy should offer more support for the pound at current weaker levels. On top of the energy price support, Liz Truss is planning additional tax cuts totalling around GBP30 billion which should help ease the BoE’s fears over five quarters of GDP contractions starting in Q4 of this year.”
“We should expect the BoE to deliver more rate hikes than they were planning in August even if the inflation peak is lower. But we remain sceptical that the BoE will raise the policy rate as high as current market expectations for a peak of around 4.50% next year.”
“The pound though would remain vulnerable to further weakness if global financial conditions continue to tighten. It is far from guaranteed that the pound will strengthen on the back of the improving cyclical UK outlook and higher rates given structural factors for the UK economy remain an Achilles heel.”
-
09:48
Spain 6-Month Letras Auction up to 0.868% from previous 0.449%
-
09:48
Spain 12-Month Letras Auction increased to 1.408% from previous 0.781%
-
09:45
UK PM Truss plans £40 billion energy-aid package for businesses
UK incoming Prime Minister (PM) Liz Truss’s spokesman said that she plans a £40 billion energy-aid package for businesses.
Citing sources, Bloomberg reported that Truss will discount firms' energy bills by fixing the wholesale price of gas and electricity.
Meanwhile, Reuters carried a story citing that household bills are due to jump by 80% in October but a source familiar with the situation said that Truss is looking at freezing bills this winter, in a plan that could cost more than the COVID-19 furlough scheme.
Market reaction
Amidst speculation over Truss’s energy relief plans, GBP/USD is keeping its range play intact around 1.1550, currently adding 0.40% on the day.
-
09:38
Silver Price Analysis: XAG/USD flirts with descending channel resistance, just below mid-$18.00s
- Silver gains traction for the third straight day and climbs to a four-day high on Tuesday.
- Bulls now await a sustained breakout through the descending trend-channel resistance.
- Weakness below the $18.00 mark will shift the bias back in favour of bearish traders.
Silver prolongs its recent bounce from the $17.55 area, or the lowest level since July 2020 set last week and gains traction for the third straight day on Tuesday. The momentum lifts the white metal to a multi-day high, around the $18.45 region during the early part of the European session.
The XAG/USD is currently flirting with a resistance marked by the top boundary of a downward sloping channel extending from the August monthly swing high. Sustained strength beyond will be seen as a fresh trigger for bullish traders and pave the way for an extension of the ongoing recovery move.
The subsequent short-covering rally has the potential to lift the XAG/USD towards the next relevant hurdle, just ahead of the $19.00 round figure. The latter coincides with the 100-period SMA on the 4-hour chart, which if cleared will reaffirm that spot prices have bottomed out in the near term.
The momentum could then get extended towards the 200-period SMA on the 4-hour chart, currently pegged near the $19.40-$19.45 region. Some follow-through buying beyond the $19.65 horizontal support breakpoint, turned resistance, should allow bulls to reclaim the $20.00 psychological mark.
On the flip side, any meaningful pullback now seems to find some support near the $18.25-$18.20 region ahead of the $18.00 round figure. Failure to defend the said support levels will suggest that the corrective rebound has run out of steam and shift the bias back in favour of bearish traders.
The XAG/USD might then accelerate the fall back towards the YTD low, around the $17.55 region touched last Thursday en-route the ascending channel support, around the $17.00 round-figure mark.
Silver 4-hour chart
-637980502456727870.png)
Key levels to watch
-
09:31
United Kingdom S&P Global Construction PMI above forecasts (48) in August: Actual (49.2)
-
09:24
AUD/USD: A deeper pullback now appears unlikely – UOB
Further retracements in AUD/USD now seem to have lost some momentum, according to FX Strategists at UOB Group Lee Sue Ann and Quek Ser Leang.
Key Quotes
24-hour view: “AUD traded between 0.6773 and 0.6802 yesterday, narrower than our expected consolidation range of 0.6770/0.6830. The relatively quiet price actions offer no fresh clues and AUD could continue to consolidate, likely between 0.6780 and 0.6830.”
Next 1-3 weeks: “Last Friday (02 Sep, spot at 0.6800), we highlighted that AUD is likely to weaken and a break of 0.6750 would shift the focus to 0.6705. However, AUD has not been able to make much headway on the downside as it consolidated the past couple of days. Downward momentum has waned and a break of 0.6870 (no change in ‘strong resistance’ level from yesterday) would indicate that AUD is unlikely to head below 0.6750.”
-
08:58
USD/INR: Ruppe likely to weaken into the year-end – ING
The Indian rupee was one of Asia’s best-performing currencies in August, declining by only 0.48% against the USD. Economists at ING believe that the INR is set to weaken into the end of the year.
Speculation about bond index supports INR
There is undoubtedly some currency support from the RBI, but the INR has also benefited from renewed speculation about the inclusion of government securities in a global bond index.”
“At 13.5% YoY, the 2Q22 GDP print undershot expectations and activity will be softer in the coming quarters as the boost from reopening wanes, external headwinds increase, and further RBI rate hikes begin to bite.”
“We would expect the INR to weaken into the year-end unless the bond index inclusion happens, or unless oil prices soften.”
-
08:57
EUR/GBP bounces off multi-day low, reverses an intraday dip to sub-0.8600 levels
- EUR/GBP remains under some selling pressure for the second successive day on Tuesday.
- Hopes for a fiscal boost from the new UK PM, more aggressive BoE rate hikes lift the GBP.
- The euro draws support from a weaker USD and helps limit any further losses for the cross.
The EUR/GBP cross is extending its retracement slide from a two-month high touched last week and losing ground for the second successive day on Tuesday. The downward trajectory drags spot prices to a four-day low during the early European session, though bulls show some resilience below the 0.8600 mark.
The news British Prime Minister Liz Truss is expected to finalize a two-year package of energy relief for households and businesses within days. This comes at a time when the country is facing a cost-of-living crisis and provides a much-needed respite to the British pound. This, along with hawkish remarks by the Bank of England policymaker Catherine Mann, is seen as another factor behind sterling's relative outperformance and exerts downward pressure on the EUR/GBP cross.
That said, a bleak outlook for the UK economy holds back the GBP bulls from placing aggressive bets. It is worth recalling that the Bank of England had warned last month that the UK economy will enter a prolonged recession during Q4 2022. Adding to this, the British Chambers of Commerce (BCC) now expects the UK economy to record three consecutive quarters of contraction. This, along with a modest pickup in demand for the shared currency helps limit losses for the EUR/GBP cross.
The euro draws some support from the ongoing US dollar profit-taking slide from a two-decade high set on Monday. That said, worries about a potential economic recession in the Eurozone, fueled by Russia's indefinite closure of its main gas supply pipeline, could act as a headwind for the common currency. The mixed fundamental backdrop warrants some caution before placing aggressive directional bets around the EUR/GBP cross amid absent relevant market-moving economic releases on Tuesday.
Investors might also prefer to move to the sidelines ahead of the key event risk - the European Central Bank meeting on Thursday. The record-high inflation in the Eurozone has raised expectations for another bumper interest hike by the ECB. Nevertheless, the outcome and the near-term policy outlook will play a key role in influencing the euro and help determine the next leg of a directional move for the EUR/GBP cross.
Technical levels to watch
-
08:56
Forex Today: Dollar holds steady ahead of ISM Services PMI data
Here is what you need to know on Tuesday, September 6:
With trading conditions normalizing following the three-day weekend in the US, the US Dollar Index stays relatively quiet early Tuesday. The ISM's August Services PMI will be the only high-tier data featured in the US economic docket. Meanwhile, risk flows seem to have returned with major European equity indices trading in positive territory. Moreover, US stock index futures are up between 0.8% and 1.1% while the benchmark 10-year US Treasury bond yield gains more than 1%.
During the Asian trading hours, the Reserve Bank of Australia (RBA) announced that it hiked its policy rate by 50 basis points (bps) to 2.35% from 1.85%. In its policy statement, the RBA said that it expects to increase the policy rate further over the months ahead but noted that the board is not on a pre-set rate path. Regarding the inflation outlook, the RBA noted that it sees medium-term inflation expectations remaining well-anchored. Although AUD/USD edged higher toward 0.6850 during the Asian session, it lost its traction and turned negative on the day below 0.6800.
Earlier in the day, Germany's Destatis reported that Factory Orders contracted by 13.6% on a yearly basis in July, compared to the market expectation for a decrease of 6.1%. On energy-related news, Gazprom's Deputy CEO Vitaly Markelov stated on Tuesday that Nord Stream 1 pipeline will not be launched until Siemens Energy replaces the faulty equipment. Over the weekend, Siemens said it had not been asked to do the job and reiterated that sanctions would not prohibit maintenance. Despite the dismal Germany data and heightened concerns over a deepening energy crisis in Europe, EUR/USD rises toward parity, supported by the improving market mood.
USD/JPY extended its rally on rising US yields and climbed to its highest level in over two decades above 141.00 on Tuesday. The data from Japan showed that Overall Household Spending rose by 3.4% on a yearly basis in July, missing the market expectation of 4.2%. Commenting on the market developments, “I have the impression that recent forex moves are becoming more significant," Japanese Finance Minister Shunichi Suzuki said on Tuesday.
Liz Truss won the Conservative Party leadership race to become the next British Prime Minister on Monday, as expected. "I will deliver a bold plan to cut taxes and grow our economy," Truss said during her acceptance speech. After having touched its weakest level since March 2020 at 1.1443 on Monday, GBP/USD staged a decisive rebound and was last seen rising 0.75% on the day at 1.1600.
Gold started the second day of the week on a firm footing and advanced to a fresh weekly high of $1,726. With US T-bond yields starting to edge higher during the European session, however, XAU/USD erased a large portion of its daily gains and was last seen trading at around $1,715.
Bitcoin continues to fluctuate in an extremely narrow range below $20,000 and Ethereum clings to modest daily gains above $1,600 in the European morning on Tuesday.
-
08:54
EUR/USD: A drop to the 0.9600-0.9650 supports cannot be excluded – ING
EUR/USD is surging this morning and trades near parity. However, economists at ING expect the pair to remain under pressure and believe that the shared currency could plummet to the 0.9600-0.9650 support zone.
Energy crisis is set to keep EUR/USD capped for now
“The energy crisis is set to keep EUR/USD capped for now, despite the short-term swap rate differential having continued to widen in favour of the euro and is at the highest in six months.”
“The 0.9900 support appears to be a rather fragile one and was briefly broken yesterday, we could see 0.9850 or 0.9800 as the next key levels, although the worsening macro picture in Europe means that a further drop to the 0.9600-0.9650 supports cannot be excluded.”
-
08:38
NZD/USD: Recovery should only be a 2023 story – ING
The Reserve Bank of New Zealand (RBNZ) is not lifting the kiwi despite its hawkish stance. Economists at ING expect the NZD/USD pair to start its recovery next year.
Hawkish RBNZ not helping much
“A hawkish RBNZ is not preventing NZD from suffering from a rather unfavourable market environment for commodity FX.”
“Like AUD, the exposure to China’s sentiment remains another major question mark.”
“An NZD recovery should only be a 2023 story.”
-
08:35
EUR/GBP to keep retreating on the back of encouraging news on the UK policy response – ING
EUR/GBP drops to near 0.86. Economists at ING expect the pair to remain under downward pressure.
Truss announces massive plan to fix energy bills
“The new UK Prime Minister Liz Truss has drafted a GBP130 bn plan to fix energy bills. The news appears to partially ease the market’s concerns (that have weighed on GBP) that Truss’ promised tax cuts would ultimately worsen the inflation picture.”
“EUR/GBP is testing the 0.8600 support and may keep retreating on the back of encouraging news on the policy side.”
-
08:32
EUR/USD climbs to 2-day peaks near 0.9980
- EUR/USD regains poise and now retargets the parity zone.
- Germany Factory Orders contracted 1.1% MoM in July.
- US ISM Non-Manufacturing takes centre stage later in the NA session.
The buying interest around the European currency picks up pace and lifts EUR/USD to the 0.9980 region on Tuesday.
EUR/USD looks bid on USD-selling
The current knee-jerk in the dollar allows EUR/USD to rebound from Monday’s new cycle lows in the 0.9880/75 band and shifts the focus once again to another test of the parity region.
In addition, the improved sentiment in the risk complex also collaborates with the pair’s rebound, which also looks underpinned by the uptick in the German 10y Bund yields.
In the meantime, the cautious trade is expected to return to the single currency as markets gets closer to the ECB event on Thursday. It is worth recalling that consensus among market participants sees the central bank raising the policy rate by 75 bps.
In the domestic calendar, German Factory Orders contracted at a monthly 1.1% and the Construction PMI ticked lower to 41.4 in August (from 43.7). Across the pond, the attention will be on the services sector amidst the releases of the final S&P Global Services PMI and the ISM Non-Manufacturing, both prints for the month of August.
What to look for around EUR
EUR/USD regains upside traction following the increased appetite for the risk-associated assets.
So far, price action around the European currency is expected to closely follow dollar dynamics, geopolitical concerns, fragmentation worries and the Fed-ECB divergence. The latter, in the meantime, keeps closely following the prevailing debate around the size of the next interest rate hikes by both the ECB and the Federal Reserve.
On the negatives for the single currency emerge the so far increasing speculation of a potential recession in the region, which looks propped up by dwindling sentiment gauges as well as an incipient slowdown in some fundamentals.
Key events in the euro area this week: Germany Construction PMI (Tuesday) – Flash EMU Q2 GDP Growth Rate (Wednesday) – ECB Interest Rate Decision, Fed Powell (Thursday) – Eurogroup Meeting, Emergency Energy Meeting (Friday).
Eminent issues on the back boiler: Continuation of the ECB hiking cycle. Italian elections in late September. Fragmentation risks amidst the ECB’s normalization of its monetary conditions. Impact of the war in Ukraine and the persistent energy crunch on the region’s growth prospects and inflation outlook.
EUR/USD levels to watch
So far, the pair is gaining 0.46% at 0.9972 and faces the next up barrier at 1.0090 (weekly high August 26) ahead of 1.0182 (55-day SMA) and then 1.0202 (August 17 high). On the flip side, a breach of 0.9877 (2022 low September 5) would target 0.9859 (December 2002 low) en route to 0.9685 (October 2002 low).
-
08:31
Biden Administration releases plan for $50B investment in chips – NY Times
The New York Times is reporting this Tuesday morning that the US Department of Commerce announced its plan for investing $50 billion in the domestic semiconductor industry, in a bid to counter China.
Gina Raimondo, the Secretary of Commerce, said in an interview, “the department is aiming to begin soliciting applications for the funding from companies no later than February, and it could begin disbursing money by next spring.”
Over the weekend, Bloomberg reported that US President Joe Biden’s administration is considering restricting investment in Chinese technology companies.
Market reaction
The US dollar index is keeping its corrective downside intact around 109.50, despite the renewed buying seen around the Treasury yields across the curve.
-
08:11
NZD/USD: Downside pressure alleviated above 0.6145 – UOB
In the opinion of FX Strategists at UOB Group Lee Sue Ann and Quek Ser Leang, a break above 0.6145 should mitigate the selling pressure around NZD/USD in the near term.
Key Quotes
24-hour view: “We highlighted yesterday that ‘the current movement is part of a consolidation phase’ and we expected NZD to ‘trade sideways between 0.6065 and 0.6130’. Our view for sideway-trading was not wrong even though NZD traded within a narrower range than expected (0.6079/0.6102). Further consolidation would not be surprising, likely within a range of 0.6080/0.6140.”
Next 1-3 weeks: “Our latest narrative was from last Friday (02 Sep, spot at 0.6090) where further NZD weakness is likely and the next support is at 0.6030. NZD subsequently dropped to 0.6051 but has not been able to make further headway on the downside. Downward momentum is beginning to wane and a break of 0.6145 (no change in ‘strong resistance’ level from yesterday) would indicate that NZD is unlikely to head lower to 0.6030.”
-
08:10
USD/CAD to return to levels under 1.25 in the first quarter of 2023 – ING
USD/CAD is trading comfortably above the 1.30 level. Nonetheless, economists at ING expect the pair to turn back lower and fall to levels below 1.25 in the first quarter of the next year.
Basis for a CAD recovery still intact
“There is still some room for a hawkish repricing in the BoC rate expectations and that can support CAD.”
“The loonie remains the most attractive commodity currency in the medium-term thanks to limited exposure to Europe and China as well as attractive carry.”
“We expect USD/CAD to return to sub-1.25 levels in 1Q23.”
-
08:08
Gold Price Forecast: XAU/USD pares intraday gains to one-week high, back below $1,720 level
- Gold regains some positive traction on Tuesday and climbs to a one-week high.
- A modest USD weakness offers support to the dollar-denominated XAU/USD.
- A positive risk tone, aggressive central banks seem to cap gains for the metal.
Gold catches fresh bids on Tuesday and builds on last week's bounce from the $1,689-$1,688 area or the lowest level since July 21. The XAU/USD, however, trims a part of its intraday gains to a one-week high and retreats below the $1,720 level during the early European session.
The US dollar extends its retracement slide from a two-decade high for the second successive day and turns out to be a key factor offering some support to the dollar-denominated commodity. That said, a generally positive tone around the equity markets keeps a lid on any further gains for the safe-haven gold. The global risk sentiment got a lift after the Chinese government vowed more measures to support economic growth.
Apart from this, the prospects for more aggressive rate hikes by major central banks warrant caution before positioning for any meaningful upside for the non-yielding yellow metal. In fact, the Reserve Bank of Australia (RBA) announced a rate hike for the fifth time this year. The Bank of Canada (Boc) and the European Central Bank (ECB) are also expected to raise interest rates on Wednesday and Thursday, respectively.
Furthermore, the markets are betting on a supersized interest rate hike by the Bank of England and the Federal Reserve in September. This, along with a fresh leg up in the US Treasury bond yields, attracts some sellers around gold and leads to an intraday pullback from the $1,727 area, warranting caution for bullish traders.
Market participants now look forward to the US economic docket, featuring the ISM Services PMI later during the early North American session. This, along with the US bond yields, might influence the USD price dynamics and provide some impetus to gold. Traders will further take cues from the broader market risk sentiment to grab short-term opportunities around the XAU/USD.
Technical levels to watch
-
08:02
EUR/CHF to extend its grind lower towards the 0.95 mark – ING
EUR/CHF has remained reasonably offered since the Swiss National Bank (SNB) surprised with a 50 bps hike in June. Economists at ING expect the pair to extend its decline towards 0.95.
SNB looks set for a 75 bps hike in September
“SNB President Jordan is sounding quite hawkish at the moment – suggesting inflation is driven by much broader factors than Ukraine – e.g. energy transition, de-globalisation, demographics.”
“It seems fair to expect a 75 bps hike from the SNB in late Sep and a hawkish setting should mean it continues to guide EUR/CHF lower over coming months – to 0.95 – to keep the real CHF stable.”
-
07:59
GBP/USD could tumble to 1.10 over coming months – ING
It has been a tough summer for the pound. Economists at ING believe that the GBP/USD pair is at risk of falling to 1.10 over coming months.
GBP looks likely to stay pressured as Europe and the UK enter recession
“The sell-off in Gilts suggests international investors do not like either: i) the BoE’s plans to start selling Gilts or ii) the new PM’s, Liz Truss, likely plan to deliver large, unfunded government support.”
“As a growth sensitive currency, sterling looks likely to stay pressured as Europe and the UK enter recession.”
“1.10 is the risk for cable over coming months.”
-
07:55
EUR/USD to stay offered near parity into year-end – ING
EUR/USD remains soft below parity and there are still no signs of a significant low. Economists at ING expect the pair to remain under pressure for the rest of the year.
The dollar remains in the driving seat
“The energy crisis in Europe and the looming Eurozone recession means it is far too early to look for a sustainable EUR/USD turnaround this year.”
“We think the dollar stays strong all year as restrictive policies slow economies and hit asset prices.”
-
07:53
AUD/USD: Downside risks are still quite elevated amid external challenges – ING
The Reserve Bank of Australia (RBA) duly delivered the 50 bps rate hike expected. In the opinion of economists at ING, rates may now increase at a slower pace over the remainder of the year, and AUD may struggle to recover amid external challenges.
AUD remains vulnerable
“The RBA policy has not been a major driver of AUD moves since the start of the year and today’s quite muted reaction to the 50 bps rate hike is another case in point. Incidentally, a switch to 25 bps rate increases from now on may force some dovish re-pricing in the RBA rate expectation curve.”
“As external factors – in particular risk sentiment and China’s outlook – remain key for the AUD outlook in the near-term, downside risks are still quite elevated.”
“Our forecasts for AUD/USD still embed a small recovery by year-end but are mostly justified by USD seasonal weakness in December and any rally may still struggle to go far beyond the 0.70 mark.”
-
07:50
AUD/USD drops below 0.6800 despite RBA’s rate hike, firmer sentiment
- AUD/USD stays pressured around intraday low, reverses early-day gains.
- RBA meets market expectations as it announces the fourth consecutive rate hike of 50 bps.
- Stimulus hopes probe bears, RBA Rate Statement weigh on prices.
- US ISM Services PMI for August, Aussie Q2 GDP become important for fresh clues.
AUD/USD holds lower ground near the intraday low of 0.6783 even as the Reserve Bank of Australia (RBA) increased the benchmark rates early Tuesday. In doing so, the Aussie pair also ignores the market’s firmer sentiment, as well as a pullback in the US Dollar Index (DXY).
RBA announced the consecutive fourth increase in the benchmark rate worth 50 basis points, to 2.35%, while matching market forecasts. The RBA statement also mentioned that the board is committed to doing what is necessary to ensure inflation returns to target. However, the market players failed to buy the Australian dollar as the recently announced rate hike seems widely anticipated and already priced in. Also likely to challenge the AUD/USD buyers could be the sluggish moves in Aussie equity markets and fears of cooling household spending in Australia.
Also read: RBA: Board is committed to doing what is necessary to ensure inflation returns to target
That said, the US 10-year Treasury yields rise 5.2 basis points (bps) to 3.25% by the press time. In doing so, the US benchmark bond coupons reverse Friday’s losses. Also portraying the risk-on mood could be the 0.50% intraday gains of the S&P 500 Futures, as well as a pullback in the US Dollar Index (DXY) from a 20-year high marked the previous day.
The market’s firmer could be linked to the chatters surrounding more aid packages to propel economic recovery seem to have favored the optimists during the full markets. That said, the incoming UK PM Liz Truss is up for a £130 billion energy plan while the People’s Bank of China (PBOC) cuts the Reserve Requirement Ratio (RRR). Further, politicians from Germany/Eurozone are all in to battle with the recession woes with a heavy push to defend energy companies and stock for winters.
It should be noted that the easing covid woes in China also should have favored the AUD/USD buyers but did not. Talking about the covid conditions, per Reuters, “China's Shenzhen city eased a COVID-19 lockdown on Monday, while Chengdu - the capital of the southwestern province of Sichuan - extended its lockdown for most people to Wednesday.”
Elsewhere, the CME’s FedWatch Tool suggests an increase in the hawkish Fed bets, from 57% on Monday to 64% at the latest, concerning the 75 bps rate hike in September that seems to favor the AUD/USD bears.
Additionally, anxiety ahead of the key US Services PMI for August, expected 55.5 versus 56.7 prior, could also be held responsible for the AUD/USD pair’s weakness. Other than the US activity data, the Aussie Gross Domestic Product (GDP) for the second quarter (Q2), expected 1.0% QoQ versus 0.8% prior, will also be important for fresh impulse.
Technical analysis
Unless crossing the 0.6900 resistance confluence including the 50-DMA and the 23.6% Fibonacci retracement of the April-July downside, remains bearish inside a two-month-old horizontal support area that restricts short-term declines of the Aussie pair to around 0.6765-60.
-
07:49
Most EM currencies may still struggle even if the Fed ends its rate hikes early next year – HSBC
Economists at HSBC maintain their caution towards emerging markets (EM) currencies. In their view, even if the Federal Reserve (Fed) ends its rate hikes early next year, most EM currencies may still struggle.
The SGD is likely to remain more resilient than other EM currencies
“Importantly, the global and EM growth cycle needs to bottom and recover. This does not look likely in the near-term.”
“Inflation, whether headline or core, will remain uncomfortably high through next year. This is a critical challenge for the Fed, which we believe will not be pivoting soon, and so the USD should remain strong overall, including versus most EM currencies.”
“As the growth-inflation mix in emerging economies would be challenging, it is unlikely to see both nominal and real yields being relatively high for EM currencies. As such, EM portfolio inflows and currencies may struggle to improve.”
“From a fundamental perspective, we expect a very small group of EM currencies to show resilience. For example, the SGD is likely to remain more resilient than other EM currencies, because the market expects the Monetary Authority of Singapore to stay hawkish while Singapore’s core inflation is still rising. It will likely take a long while for a broader group of EM currencies to join the camp.”
-
07:43
Fed to air on the side of raising rates more to bring inflation down, supporting the USD – Morgan Stanley
There has been a lot of market movement in recent months, so as we exit the summer, what are the market stories and valuations that investors should be aware of? Economists at Morgan Stanley expect the US dollar to remain strong while the euro and the pound should continue weakening.
US economy is seeing elevated inflation and still strong growth
“The US economy is seeing elevated inflation and still strong growth. That makes it likely that the Federal Reserve will have to air on the side of raising rates more to bring inflation down, which would further invert the US yield curve and support the US dollar.”
“Europe is in the midst of a major energy crunch, that in our base case will push the economy into a mild recession. Markets expect that the European Central Bank will raise rates significantly more than the US Federal Reserve over the next 12 months, but given our risks to growth we disagree, a reason we forecast a weaker euro. The economic situation in the UK is also very challenged, leaving us cautious on gilts and the UK pound.”
-
07:41
Outgoing UK PM Johnson: Truss will do everything to get people through energy crisis
Outgoing UK PM Boris Johnson, in his farewell speech, provides assurance that his successor Liz truss will do everything to get people through the energy crisis.
Additional quotes
We have and will continue to have economic strength
That will allow us to help people through energy crisis
We will get through this crisis
I will offer my support to this government.
This is a tough time for economy.
We will come out stronger.
Time for politics to be over, we must get behind Truss.
Those trying to break up United Kingdom will never succeed.
Market reaction
GBP/USD is unimpressed by the above comments, maintaining its 0.50% gain on the day at around 1.1560.
-
07:36
FX option expiries for Sept 6 NY cut
FX option expiries for Sept 6 NY cut at 10:00 Eastern Time, via DTCC, can be found below.
- EUR/USD: EUR amounts
- 0.9900 792m
- 0.9925 415m
- 0.9995 1b
- 1.0040 604m
- 1.0100 658m
- GBP/USD: GBP amounts
- 1.1905 315m
- USD/JPY: USD amounts
- 137.00 495m
- 137.50 357m
- 138.00 306m
- 138.75 600m
- 139.00 310m
- 140.00 625m
- USD/CHF: USD amounts
- 0.9300 390m
- 0.9500 302m
- 0.9640 330m
- 0.9815 720m
- AUD/USD: AUD amounts
- 0.6800 732m
- 0.6875 1.1b
- USD/CAD: USD amounts
- 1.3025 746m
- 1.3300 650m
- 1.3325 400m
- NZD/USD: NZD amounts
- 0.6200 473m
- EUR/GBP: EUR amounts
- 0.8600 250m
-
07:36
AUD/USD: End-2022 forecast lowered to 0.65 from 0.71 – DBS Bank
The Australian dollar is unlikely to eclipse the US dollar. Therefore, economists at DBS Bank have lowered their AUD/USD year-end forecast to 0.65.
AUD will not be immune to risk aversion
“We have lowered our end-2022 forecast for AUD to 0.65 from 0.71.”
“For the rest of this year, the Fed’s unapologetic readiness to control inflation at the expense of growth should keep the USD strong against the currencies of East Asia, Australia’s largest export destination.”
“China, the country’s largest trading partner, is experiencing weaknesses in its economy and currency.”
“Like other commodity-led currencies such as the CAD and NZD, AUD will not be immune to risk aversion.”
-
07:31
USD/TRY: Inflation-FX fundamentals are disastrous for the lira – Commerzbank
Turkey’s CPI/PPI data for August featured 80% headline inflation rate, 66% core inflation rate and 144% PPI inflation rate. The outlook for the lira remains bleak, economists at Commerzbank report.
The benchmark rate cannot probably be raised
“What is so good about the data? Sure, more accurate statistics might have shown 90% inflation rate instead of 80% – and of course, we do not trivialise the need for honest statistics – but, why would anyone call the situation better if inflation were to moderate slightly (year-on-year) in coming quarters as lower commodity prices and base effect began to play a role?”
“If the lira needs defending, policymakers will probably only deploy ad hoc soft capital control measures – the benchmark rate cannot probably be raised.”
“How does an 80%, instead of 81%, inflation print vindicate policymakers?”
-
07:23
GBP/USD: Current strength unlikely to last – Commerzbank
Liz Truss is succeeding Boris Johnson as the new Prime Minister of Great Britain. What really matters for the GBP exchange rates is what happens next. Economists at Commerzbank stick to their pessimistic outlook.
There are still sufficient stumbling blocks for sterling
“It remains questionable though whether a more rapid rise in interest rates really would be positive for sterling even if it was to fight inflation as they would be likely to deepen a presumably long recession even further so that this would lead to doubts whether the BoE would be able to stick to its restrictive monetary policy for long.”
“There is speculation that Truss will trigger article 16 of the Northern Ireland Protocol thus negating part of the agreement with the EU. The EU might react with the imposition of tariffs on British goods which would severely damage UK exports, as the EU remains the most important trade partner. However, at least short-term this is likely to be the smallest risk for the GBP exchange rates. It can be assumed that a conflict of this nature would not escalate too quickly but that initially there would be extended negotiations.”
“Sterling strength seen this morning is unlikely to last.”
-
07:17
EUR/USD: Markets to punish any ECB hesitation with euro weakness – Commerzbank
After a short excursion below 0.99, EUR/USD is already trading almost one cent higher again on Tuesday. Economists at Commerzbank note that the European Central Bank must meet market expectations this week in order to underpin the shared currency.
EUR/USD to hold near parity if the ECB delivers this week
“The ECB will have to deliver this week so that EUR/USD can continue to hold near parity.”
“In addition to the extent of an interest rate hike, it will probably be important whether it signals that it will stick to an aggressive rate hike pace even in view of the current economic risks.”
“Any hesitation is likely to be quickly punished by the market with euro weakness.”
-
07:13
EUR/USD retreats to 0.9950 on softer German Factory Orders, focus on US PMI, ECB
- EUR/USD pares daily gains after downbeat German data.
- Germany’s Factory Orders growth dropped to -13.6% YoY in July.
- Risk-on mood, firmer yields add strength to pair’s recovery moves.
- Full markets, US ISM Services PMI can entertain traders ahead of Thursday’s ECB.
EUR/USD fades upside momentum after softer economics from the bloc’s powerhouse Germany. Even so, the major currency pair prints the biggest daily gains in a week amid risk-on mood. That said, the quote declines to 0.9950 heading into Tuesday’s European open, after refreshing intraday high to 0.9970 earlier in the day.
Germany’s Factory Orders for July marked a contraction of 13.6% YoY versus -6.1% expected and -9.0% prior on the non-seasonally adjusted basis.
It’s worth noting that the chatters surrounding more aid packages to propel economic recovery seem to have favored the optimists during the full markets. That said, the incoming UK PM Liz Truss is up for a £130 billion energy plan while the People’s Bank of China (PBOC) cuts the Reserve Requirement Ratio (RRR). Further, politicians from Germany/Eurozone are all in to battle with the recession woes with a heavy push to defend energy companies and stock for winters.
Also favoring the pair buyers could be the easing in the hawkish Fed bets. As per the latest read, the CME’s FedWatch Tool hints at the 60% chance of the Fed’s 0.75% rate hike in September, versus over 75% marked in the previous week.
While portraying the mood, the US 10-year Treasury yields rise 2.5 basis points (bps) to 3.21% by the press time. In doing so, the US benchmark bond coupons reverse Friday’s losses. Also portraying the risk-on mood could be the 0.50% intraday gains of the S&P 500 Futures, as well as a pullback in the US Dollar Index (DXY) from a 20-year high marked the previous day.
Moving on, EUR/USD traders may witness lackluster moves ahead of the ISM Services PMI for August, expected 55.5 versus 56.7 prior. However, major attention will be given to Thursday’s European Central Bank (ECB) Monetary Policy Meeting announcements as the bloc’s central bank is again up for 0.50% rate hike despite the recession fears and energy crisis.
Technical analysis
EUR/USD buyers need to cross the monthly resistance line, around the 1.0000 psychological magnet by the press time, for conviction. That said, the 10-DMA hurdle near 0.9980 restricts the immediate upside moves of the pair.
-
07:13
AUD/USD heads south as RBA keeps a low profile regarding further aggressive rate hikes – Commerzbank
The Reserve Bank of Australia (RBA) hiked rates by 50 bps but did not give the AUD a boost given the bank showed doubts when it comes to the exact hiking pace, economists at Commerzbank report.
RBA does not deliver enough
“On the one hand, the rate hike was expected by the majority, and on the other hand, the RBA is keeping a low profile regarding further aggressive rate hikes. Rather, it retains the flexibility to decide from meeting to meeting depending on incoming data.”
“In view of the globally increased inflation risks, this does not seem decisive enough for the market, which is why AUD/USD is heading south this morning.”
-
07:12
US Dollar Index treads water around 109.60 ahead of data
- The index alternates gains with losses around 109.60.
- US markets return to the normal activity after Monday’s holiday.
- US ISM Non-Manufacturing, Final Services PMI next on tap.
The greenback, in terms of the US Dollar Index (DXY), trades near to Monday’s close around the 109.60 region.
US Dollar Index focuses on data
The index navigates within a tight range around 109.60, as US markets slowly regain the normal activity following Monday’s Labor Day holiday.
In fact, the dollar keeps the trade in the upper end of the recent range and comes under some mild pressure following Monday’s new cycle highs past the 110.00 hurdle.
No changes to the main drivers behind the price action in the index, as investors continue to closely follow messages from Fed’s policy makers ahead of the key September meeting, where the central bank is so far expected to raise rates by 75 bps.
Later in the session, the US services sector will take centre stage in light of the release of the final S&P Global Services PMI and the ISM Non-Manufacturing, both readings for the month of August.
What to look for around USD
The index keeps the bullish outlook well in place despite coming under some pressure after hitting fresh peaks above 110.00, an area last seen nearly 20 year ago.
Bolstering the dollar’s strength appears the firmer conviction of the Federal Reserve to keep hiking rates until inflation looks well under control regardless of a likely slowdown in the economic activity and some loss of momentum in the labour market. This view was reinforced by Chair Powell’s speech at the Jackson Hole Symposium.
Extra volatility in the dollar, however, should not be ruled out considering the ongoing debate around the size of the September’s interest rate hike by the Federal Reserve amidst the ongoing data-dependent stance in the Fed.
Looking at the more macro scenario, the greenback appears propped up by the Fed’s divergence vs. most of its G10 peers in combination with bouts of geopolitical effervescence and occasional re-emergence of risk aversion.
Key events in the US this week: ISM Non-Manufacturing, Final Services PMI (Tuesday) – MBA Mortgage Applications, Balance of Trade, Fed Beige Book (Wednesday) – Initial Claims, Consumer Credit Change, Fed Powell (Thursday) – Wholesale Inventories (Friday).
Eminent issues on the back boiler: Hard/soft/softish? landing of the US economy. Prospects for further rate hikes by the Federal Reserve vs. speculation over a recession in the next months. Geopolitical effervescence vs. Russia and China. US-China persistent trade conflict.
US Dollar Index relevant levels
Now, the index is advancing 0.03% at 109.63 and a break above 110.27 (2022 high September 5) would aim for 111.90 (weekly high September 6 2002) and then 113.35 (weekly high May 24 2002). On the other hand, the next contention turns up at 107.58 (weekly low August 26) seconded by 106.88 (55-day SMA) and then 104.63 (monthly low August 10).
-
07:11
USD/CHF sets to recapture 0.9800, DXY gyrates wild ahead of US ISM Services PMI
- USD/CHF is hovering around 0.9800 as DXY has recovered a majority of its losses.
- Investors await the release of the US ISM Services PMI, seen at 55.5 vs. 56.7.
- Fed Powell’s speech will dictate the likely monetary policy action for the September meeting.
The USD/CHF pair has recovered firmly after correcting mildly to near 0.9787. The asset is expected to remain on the sidelines as investors are awaiting the release of the US ISM Services PMI data. As per the consensus, a decline is expected in the extent of Services PMI.
According to the estimates, the Services PMI will land at 55.5 lower than the prior release of 56.7. It says that corporate conferences during earnings season provide meaningful guidance for future prospects. Big tech boys considered a halt in recruitment processes in anticipation of subdued growth prospects.
The Federal Reserve (Fed) is squeezing liquidity from the market vigorously to combat the mounting price pressures. The velocity of hiking interest rates is extremely firm and the corporate is facing the repercussions. The unavailability of cheaper funds has forced them to postpone investment opportunities and expansion plans, which are resulting in a decline in the overall economic activities.
Meanwhile, the US dollar index (DXY) has recovered the majority of its morning losses and is likely to extend recovery ahead of the speech from Fed chair Jerome Powell on Thursday. Fed Powell is expected to sound hawkish on interest rate guidance as the inflation rate is extremely deviated from the desired rate despite showing exhaustion signals in the July report.
On the Swiss franc front, less-than-expected Real Retail Sales data have weakened the Swiss franc. The economic data landed at 2.6%, lower than the consensus of 3.3% but remained higher than the prior release of 0.7%. Also, the Consumer Price Index (CPI) has improved to 3.5% against expectations and the former print of 3.4% on an annual basis.
-
07:06
Gold Price Forecast: XAU/USD looks to extend its gains above 23.6% Fibo resistance
Gold price resumes recovery. Will XAU/USD find acceptance above 23.6% Fibo resistance? FXStreet’s Dhwani Mehta analyzes the pair’s technical picture.
XAU/USD extends gains above 23.6% Fibo level, will it last?
“Gold bulls are trying their luck once again, as they recapture the $1,716 barrier, which is the 23.6% Fibonacci Retracement level of the latest decline from the August 10 peak of $1,808. Failure to resist above the latter will reinforce selling interests, calling for a revisit to Monday’s low of $1,708. The next cushion is seen at the $1,700 mark, below which the six-week low of $1,689 could be put to test once again.”
“If the recovery momentum extends, then bulls will challenge the 38.2% Fib level at $1,734 on a sustained move above the daily high of $1,727 and the $1,730 round figure.”
-
07:02
German Factory Orders decline 1.1% MoM in July vs. -0.2% expected
- German Factory Orders dropped 1.1% MoM in July vs. -0.2% expected.
- German Factory output plunged -13.6% YoY in July vs. -6.1% expected.
- EUR/USD keeps its range below 1.0000 on the mixed German data.
The German Factory Orders dropped more than expected in July, suggesting that the manufacturing sector gloom in Europe’s economic powerhouse is extending.
Contracts for goods ‘Made in Germany’ fell by 1.1% on the month vs. -0.2% expected and -0.3% last, the latest data published by the Federal Statistics Office showed on Tuesday.
On an annualized basis, Germany’s Industrial Orders arrived at -13.6% in the reported month vs. -6.1% expected and -9.0% previous.
FX implications
The shared currency remains little moved by the mixed German factory data. At the time of writing, EUR/USD is adding 0.31% on the day, trading at 0.9955.
-
07:02
Germany Factory Orders n.s.a. (YoY) came in at -13.6% below forecasts (-6.1%) in July
-
07:00
Germany Factory Orders s.a. (MoM) below forecasts (-0.2%) in July: Actual (-1.1%)
-
06:50
USD/CNH prints four-day uptrend around 6.9500 on PBOC moves, stimulus hopes
- USD/CNH rises for the fourth consecutive day, stays around the highest levels since August 2020 marked the previous day.
- PBOC cuts RRR, policymakers show readiness for more aid measures.
- Receding hawkish Fed bets fail to tame bulls amid sluggish session.
- Full markets, US ISM Services PMI eyed for fresh impulse.
USD/CNH remains on the front foot at around 6.9480, up 0.10% intraday during the four-day uptrend heading into Tuesday’s European session. In doing so, the offshore Chinese Yuan (CNH) pair pokes the highest levels since August 2020.
While searching for the bullish catalysts, expectations of more economic measures to avoid recession join the easing covid woes in China to underpin the optimism surrounding the USD/CNH pair.
On a broader front, the chatters surrounding more aid packages to propel economic recovery seem to have favored the optimists during the full markets. That said, the incoming UK PM Liz Truss is up for a £130 billion energy plan while the People’s Bank of China (PBOC) cuts the Reserve Requirement Ratio (RRR). Further, politicians from Germany/Eurozone are all in to battle with the recession woes with a heavy push to defend energy companies and stock for winters.
“Chinese policymakers signaled a renewed sense of urgency on Monday for steps to shore up the flagging economy, saying this quarter was a critical time for policy action as evidence points to a further loss of economic momentum,” said Reuters.
Talking about the covid conditions, per Reutres, “China's Shenzhen city eased a COVID-19 lockdown on Monday, while Chengdu - the capital of the southwestern province of Sichuan - extended its lockdown for most people to Wednesday.”
Against this backdrop, the US 10-year Treasury yields rise 2.5 basis points (bps) to 3.21% by the press time. In doing so, the US benchmark bond coupons reverse Friday’s losses. Also portraying the risk-on mood could be the 0.50% intraday gains of the S&P 500 Futures, as well as a pullback in the US Dollar Index (DXY) from a 20-year high marked the previous day.
Additionally helping the pair is the CME’s FedWatch Tool that hints at the 60% chance of the Fed’s 0.75% rate hike in September, versus over 75% marked in the previous week. The easing in the hawkish Fed bets could be linked to the mixed US jobs report for August.
Looking forward, the ISM Services PMI for August, expected 55.5 versus 56.7 prior, should offer additional directions to the USD/CNH traders.
Technical analysis
Unless dropping below the previous monthly top surrounding 6.9325, the USD/CNH pair remains on the way to July 2020 low near 6.9645.
-
06:45
GBP/JPY crosses 163.00 as Truss wins UK PM elections, BOE Bailey’s speech eyed
- GBP/JPY has overstepped the crucial hurdle of 163.00 vigorously on novel UK leadership.
- Next UK PM Liz Truss announced a relief fund of 130 billion pounds to tame soaring energy bills.
- A downbeat Japan’s Overall Household Spending data has weakened the yen bulls.
The GBP/JPY pair has displayed a juggernaut rally in the Asian session and a similar performance is expected in the European session ahead. A perpendicular upside move has driven the pound bulls above the critical hurdle of 163.00. At the press time, the GBP/JPY cross is trading around 163.08, 0.73% above from its previous close. With a revival in the UK’s political instability after Liz Truss wins leadership of the Conservative party, pound bulls have got an adrenaline rush.
Broadly, the sterling has remained vulnerable after the resignation of ex-UK PM Boris Johnson. This brought political instability to the UK economy as the Cabinet Office was demolished. However, Liz Truss's win for the next UK PM has underpinned the pound bulls against the Japanese yen.
The UK economy is going through severe pain of higher energy prices, which have soared energy bills for households, inflation rate, and have deepened the energy crisis. To safeguard households from soaring energy bills, going to be UK PM has announced a fund of 130 billion pounds for freezing bills. The new cabinet will set a fixed unit price for energy suppliers to sell gas & electricity to households.
Going forward, the speech from Bank of England (BOE) Governor Andrew Bailey on Wednesday will be of utmost importance. BOE’s Bailey is expected to dictate the likely monetary policy action for September 15.
On the Tokyo front, vulnerable Overall Household Spending data has weakened the yen bulls. The economic data has landed at 3.4%, lower than the expectations of 4.2% and the prior release of 3.5%. This indicates households’ pessimism in the Japanese economy and also lower expenditure by the former may restrict the inflation rate.
-
06:36
USD/JPY bulls poke 141.00 to refresh 24-year high amid firmer yields ahead of US PMI
- USD/JPY rises for the eighth consecutive day as bulls cheer risk-on mood, firmer Treasury yields.
- Stimulus hopes, options expiries and no immediate challenges to BOJ’s easy money policy seem to favor buyers.
- Verbal intervention of Japanese policymakers, receding hawkish Fed bets test the upside momentum.
- Softer Japan data for Household Spending, Labor Cash Earnings also strengthened the pair.
USD/JPY bulls flourish during early Tuesday morning in Europe as they refresh the highest levels since 1998 during the eight-day uptrend. In doing so, the yen pair rose to 140.97 while cheering the firmer US Treasury yields and the market’s risk-on mood.
That said, the US 10-year Treasury yields rise 2.5 basis points (bps) to 3.21% by the press time. In doing so, the US benchmark bond coupons reverse Friday’s losses. Also portraying the risk-on mood could be the 0.50% intraday gains of the S&P 500 Futures, as well as a pullback in the US Dollar Index (DXY) from a 20-year high marked the previous day.
Chatters surrounding more aid packages to propel economic recovery seem to have favored the optimists during the full markets. That said, the incoming UK PM Liz Truss is up for a £130 billion energy plan while the People’s Bank of China (PBOC) cuts the Reserve Requirement Ratio (RRR). Further, politicians from Germany/Eurozone are all in to battle with the recession woes with a heavy push to defend energy companies and stock for winters.
Also, softer Japan data appears to propel the USD/JPY moves. Earlier in the day, Japan’s Overall Household Spending dropped to 3.4% YoY for July, from 4.2% expected and 3.5% prior. Further, the Labor Cash Earnings also eased to 1.8% on a yearly basis while compared to 2.5% market consensus and 2.2% prior.
It’s worth noting that the verbal intervention from Japanese policymakers seems to fail in defending the JPY bulls. Recently, Japanese Finance Minister Shunichi Suzuki said on Tuesday that “I have the impression that recent forex moves are becoming more significant.”
It should be noted that the multiple options expiries around 140.00, recently of around $626 million per Reuters, also keep the USD/JPY buyers hopeful. Additionally helping the pair is the CME’s FedWatch Tool that hints at the 60% chance of the Fed’s 0.75% rate hike in September, versus over 75% marked in the previous week. The easing in the hawkish Fed bets could be linked to the mixed US jobs report for August.
Moving on, the reaction of the traders from the US and Canada will be closely observed for clear directions. Also important will be the geopolitical headlines surrounding China, Russia and the US. Additionally, the ISM Services PMI for August, expected 55.5 versus 56.7 prior, should offer additional directions to the USD/JPY traders.
Technical analysis
USD/JPY bulls remain on the way to an upward sloping resistance line from late April, around 144.55, unless staying beyond July’s top near 139.40.
-
06:14
Asian Stock Market: Mix sentiment prevails on volatile DXY, oil fails to sustain above $90.00
- Asian markets are displaying a mixed response to volatile DXY.
- Japanese Overall household spending has declined to 3.4% vs. the forecast of 4.2%.
- Oil prices have corrected after failing to sustain above $90.00
Markets in the Asian domain are displaying a mixed performance as the US dollar index (DXY) has turned volatile ahead of the US ISM Services PMI data. The US markets will open after an extended weekend, therefore, wild gyrations are highly expected. The Services PMI is expected to land lower at 55.5 vs. 56.7 in the prior release.
At the press time, Japan’s Nikkei225 remained flat, China A50 added 0.16%, Hang Seng shed 0.52% and Nifty50 eased 0.34%.
Japanese markets have not reacted much to a decline in the Overall Household Spending data. The economic data has landed at 3.4%, lower than the expectations of 4.2% and the prior release of 3.5%. This indicates households’ pessimism in the Japanese economy and also lower expenditure by the former may restrict the inflation rate. It is highly likely that investors will have to wait more for a ‘neutral’ stance by the Bank of Japan (BOJ).
Outside Asia, the Reserve Bank of Australia (RBA) has announced a rate hike by 50 basis points (bps) consecutively for the fourth time. Officially, the RBA’s Official Cash Rate (OCR) has increased to 2.35%. As price pressures are accelerating dramatically in the Australian economy and households are facing the headwinds of higher payouts, a rate hike decision by the RBA was highly expected.
On the oil front, oil prices have failed to extend recovery after a vertical upside move to near $90.00. The black gold has witnessed a corrective move despite the announcement of production cuts by OPEC. In order to tame the recent decline in oil prices, the oil cartel has squeezed supply. To be noted, OPEC has announced production cuts by 100,000 barrels per day (bpd).
-
06:13
Malaysia: BNM expected to raise the policy rate – UOB
Economist at UOB Group Lee Sue Ann suggests the Bank Negara Malaysia could raise the policy rate at its meeting later in the week.
Key Quotes
“Given the robust GDP growth print in 2Q22, signs of further economic expansion in 2H22 albeit at a moderate pace, and broadening second-round effects on inflation, BNM will likely follow-through with a third 25bps rate hike at the coming meeting.”
“Besides internal factors, we believe the expected outsized Fed rate hikes in the coming months and global monetary conditions would also be taken into consideration by BNM at the Sep meeting.”
-
06:10
Copper price stays firmer on stimulus hopes, softer DXY
- Copper price prints three-day uptrend, extends bounce off six-week low.
- Cautious optimism weighs on the US dollar, underpins hopes of recovery in metal’s market.
- China, Europe and the UK are up for more stimulus to avoid recession fears.
Copper prices extend the latest recovery moves, picking up bids to 3.4578 during the three-day uptrend ahead of Tuesday’s European session.
Elsewhere, the three-month copper on the London Metal Exchange (LME) rose 0.3% to $7,678 a tonne by 02:59 GMT and the most-traded October copper contract on the Shanghai Futures Exchange (SFE) advanced 1.3% to 60,850 yuan ($8,773.45) a tonne, said Reuters.
In doing so, the red metal cheers the market’s firmer sentiment and expectations of more stimulus, especially from China. Also keeping the metal buyers hopeful is the softer performance of the US Dollar Index (DXY) after it refreshed the 20-year high the previous day.
While portraying the mood, the US 10-year Treasury yields rise 2.5 basis points (bps) to 3.21% whereas the S&P 500 Futures extend the week-start recovery to 3,943, up 0.50% intraday by the press time. Further, the market’s consolidation also allowed the DXY to retreat from the 20-year high to 109.37, before a recent rebound to 109.62.
Chatters surrounding more aid packages to propel economic recovery seem to have favored the optimists during the full markets. That said, the incoming UK PM Liz Truss is up for a £130 billion energy plan while the People’s Bank of China (PBOC) cuts the Reserve Requirement Ratio (RRR). Further, politicians from Germany/Eurozone are all in to battle with the recession woes with a heavy push to defend energy companies and stock for winters.
Tighter supply in China and a fall in the metal’s output in Peru also favor the prices. “The premium of LME cash copper over the three-month contract rose to $77.50 a tonne on Monday, the highest since December 2021, signaling tightening supply of immediately available material on the LME warehouses,” said Reuters. The news also added that in Peru, the world's second-largest copper producer, copper output in July fell 6.6% year-over-year to 195,234 tonnes after two of the country's largest mines underperformed.
Technical analysis
A clear downside break of 3.3780 becomes necessary for the copper future bears at the COMEX.
-
06:03
EUR/USD: Dwindling bets for a close below 0.9900 – UOB
The chances for EUR/USD to close below 0.9900 seem to have lost traction in past sessions, note FX Strategists at UOB Group Lee Sue Ann and Quek Ser Leang.
Key Quotes
24-hour view: “Yesterday, we expected EUR to break 0.9900 but we were of the view that ‘the next support at 0.9850 is unlikely to come under threat’. While our view was not wrong as EUR dropped to 0.9875, we did not expect the subsequent strong bounce from the low. The rebound has scope to extend but is unlikely to break the strong resistance at 1.0005 (there is another resistance at 0.9975). Support is at 0.9925 followed by 0.9890.”
Next 1-3 weeks: “Last Friday (02 Sep, spot at 0.9945), we highlighted that the risk for EUR has shifted to the downside. We added, EUR has to close below the major support at 0.9900 before a sustained decline is likely. Yesterday (05 Sep), EUR dropped to a fresh multi-year low of 0.9875 before rebounding to close at 0.9926 (-0.25%). There is no change in our view for now even though after the strong rebound in NY yesterday, the odds for EUR to close below 0.9900 have diminished. On the upside, a break of the ‘strong resistance’ at 1.0005 (no change in level from yesterday) would indicate that the next support at 0.9850 is not coming into the picture.”
-
05:56
AUD/NZD Price Analysis: Buyers approach 1.1200 inside bearish channel after RBA
- AUD/NZD picks up bids after the RBA’s 0.50% rate hike, extends the previous day’s bounce off two-week low.
- Impending bull cross on MACD, rebound from the 100-SMA also keep buyers hopeful.
- Sellers can aim for channel’s support, 61.8% Fibonacci retracement level during fresh entry.
AUD/NZD adds to the daily gains around 1.1155 after the Reserve Bank of Australia (RBA) announced the fourth rate increase of 0.50% heading into Tuesday’s European session.
Also read: RBA: Board is committed to doing what is necessary to ensure inflation returns to target
In doing so, the cross-currency pair bounces off the 100-SMA while staying inside a weekly bearish channel.
In addition to the rebound from the 100-SMA, at 1.1145 by the press time, the looming bull cross by the MACD line also signal the further upside of the quote.
However, the 20-SMA guards the pair’s immediate advances near the 1.1165 level before directing AUD/NZD buyers towards the stated channel’s upper line, at 1.1180 as we write.
Should the upside momentum cross the 1.1180 resistance, the odds of its run-up towards the previous monthly high near 1.1255 can’t be ignored.
Alternatively, a clear downside break of the 100-SMA surrounding 1.1145 could drag the quote to the 50% Fibonacci retracement of August 17-26 upside, near 1.1122.
Following that, the lower line of the aforementioned channel and the 61.8% Fibonacci retracement level could entertain the AUD/NZD bears respectively around 1.1110 and 1.1090.
Overall, AUD/NZD is likely to rise further but the upside break of 1.1180 appears necessary.
AUD/NZD: Four-hour chart

Trend: Limited upside expected
-
05:40
AUD/USD recovers after declining below 0.6800, RBA hikes rates by 50 bps fourth time
- AUD/USD has recovered from 0.6790 on the 50 bps rate hike announcement by the RBA.
- A fourth consecutive half-a-percent rate hike has pushed the OCR to 2.35%.
- The DXY is expected to remain volatile ahead of US ISM Service PMI data.
The AUD/USD pair has recovered sharply after slipping below the critical support of 0.6800. The Reserve Bank of Australia (RBA) has announced a rate hike by 50 basis points (bps) consecutively for the fourth time to combat soaring price pressures. Officially, the RBA’s Official Cash Rate (OCR) has increased to 2.35%.
As price pressures are accelerating dramatically in the Australian economy and households are facing the headwinds of higher payouts, a rate hike decision by the RBA was highly expected. The Australian inflation rate has been recorded at 6.1% for the second quarter of CY2022. This has squeezed the margins of corporate significantly. The corporate has failed to pass on the impact of inflated-input prices to the end consumers.
This week, more fireworks are expected from the Australian economic calendar as the Australian Bureau of Statistics will report the Gross Domestic Product (GDP) numbers. The Australian economy is expected to grow by 1% on a quarterly basis vs. 0.8% recorded in the prior quarter. Solid GDP data will strengthen the aussie bulls further.
Meanwhile, the US dollar index (DXY) has extended its gains after overstepping the immediate hurdle of 109.50. Earlier, the DXY printed a low of 109.40 amid lower consensus for the US ISM Services PMI data. The economic data is seen lower at 55.5 than the prior release of 56.7.
-
05:38
AUD/JPY retreats towards 95.00 despite RBA’s 50 bps rate hike, firmer yields
- AUD/JPY struggles to extend the four-day uptrend, eases from daily top of late.
- RBA matches market forecasts while announcing the fourth rate hikes worth 0.50%.
- US Treasury yields begin the week’s trading on a firmer footing amid easing hawkish Fed bets, stimulus hopes.
AUD/JPY takes offers to refresh the daily low near 95.50 after the Reserve Bank of Australia’s (RBA) monetary policy announcements on early Tuesday morning in Europe. The cross-currency pair’s latest declines ignore the RBA’s rate hike, as well as firmer Treasury yields.
That said, the RBA announces the consecutive fourth rate increase worth 50 basis points, to 2.35%, while matching market forecasts. The RBA statement also mentioned that the board is committed to doing what is necessary to ensure inflation returns to target.
Also read: RBA: Board is committed to doing what is necessary to ensure inflation returns to target
Even so, the market players failed to buy the Australian dollar as the recently announced rate hike seems widely anticipated and already priced in. Also likely to challenge the AUD/JPY buyers could be the sluggish moves in Aussie equity markets and fears of cooling household spending in Australia.
On the other hand, verbal intervention from Japanese policymakers seems to defend the yen buyers of late. Recently, Japanese Finance Minister Shunichi Suzuki said on Tuesday that “I have the impression that recent forex moves are becoming more significant.”
Furthermore, the risk-on mood also underpins the bullish bias on the AUD/JPY front. While portraying the mood, the US 10-year Treasury yields rise 2.5 basis points (bps) to 3.21% whereas the S&P 500 Futures extend the week-start recovery to 3,943, up 0.50% intraday by the press time. Further, the market’s consolidation also allowed the DXY to retreat from the 20-year high to 109.37, before a recent rebound to 109.62.
Market sentiment improved during the early Asian session after the return of full markets brought expectations of more measures to tame the energy crisis. That said, the incoming UK PM Liz Truss is up for a £130 billion energy plan while the People’s Bank of China (PBOC) cuts the Reserve Requirement Ratio (RRR). Further, politicians from Germany/Eurozone are all in to battle with the recession woes with a heavy push to defend energy companies and stock for winters.
Moving on, AUD/JPY traders should pay attention to the market sentiment and yields while closely observing the full markets’ reaction to the latest chatters surrounding stimulus, receding hawkish central bank bias.
Technical analysis
An upward sloping support line from the mid-August, around 95.30 by the press time, directs AUD/JPY bulls towards the resistance line of an 11-week-old bullish channel, close to 96.55.
-
05:33
RBA: Board is committed to doing what is necessary to ensure inflation returns to target
Following are the key headlines from the September RBA monetary policy statement, via Reuters, as presented by Governor Phillip Lowe.
Board is committed to doing what is necessary to ensure inflation returns to target.
Board is committed to returning inflation to the 2–3 per cent range over time. It is seeking to do this while keeping the economy on an even keel.
Board expects to increase rates further over the months ahead.
Board not on a pre-set path.
Size and timing of future increases will be guided by the data and outlook for inflation and labour market.
Inflation is expected to peak later this year and then decline back towards the 2–3 per cent range.
Medium-term inflation expectations remain well anchored.
An important source of uncertainty continues to be the behaviour of household spending.
Australian economy is continuing to grow solidly and national income is being boosted by a record level of the terms of trade.
The full effects of higher interest rates yet to be felt in mortgage payments.
An important source of uncertainty continues to be the behaviour of household spending.
See further decline in the unemployment rate over the months ahead.
Board will continue to pay close attention to both the evolution of labor costs and the price-setting behaviour of firms.
Expects CPI to moderate as supply-side issues are resolved.
The prospects for global economic development have deteriorated.
-
AUD/USD recovers after declining below 0.6800, RBA hikes rates by 50 bps fourth time
-
AUD/JPY retreats towards 95.00 despite RBA’s 50 bps rate hike, firmer yields
-
-
05:31
Breaking: RBA hikes OCR by 50 bps to 2.35%, AUD/USD slips
At its September 6 monetary policy meeting, the Reserve Bank of Australia (RBA) announced a 50 basis points (bps) rate hike, rasinig its official cash rate (OCR) from 1.85% to 2.35%.
The rate hike decision was widely anticipated and marked the fourth straight half percentage point increase by the central bank and the fifth rate hike since May.
According to RBAWatch, markets are wagering rates could peak around 3.85% next year given inflation is running at a 21-year high of 6.1% and likely to top 7% by Christmas.
AUD/USD reaction
In an immediate reaction to the RBA decision, the AUD/USD pair slipped about 10-pips to 0.6793 before recapturing 0.6800. At the time of writing, the aussie is up 0.13% on the day at 0.6804.
About RBA rate decision
RBA Interest Rate Decision is announced by the Reserve Bank of Australia. If the RBA is hawkish about the inflationary outlook of the economy and rises the interest rates it is positive, or bullish, for the AUD. Likewise, if the RBA has a dovish view on the Australian economy and keeps the ongoing interest rate, or cuts the interest rate it is seen as negative, or bearish.
-
05:30
Netherlands, The Consumer Price Index n.s.a (YoY): 12% (August) vs 10.3%
-
05:30
Australia RBA Interest Rate Decision in line with forecasts (2.35%)
-
05:22
GBP/USD Price Analysis: 100-HMA defends buyers around mid-1.1500s
- GBP/USD remains on the front foot on a day despite the latest pullback.
- Firmer RSI, bullish MACD signals join upside break of weekly resistance line to favor buyers.
- Sellers have a bumpy road to travel before visiting March 2020 low.
GBP/USD remains on the buyer’s radar even after paring the daily gains around 1.1565 during early Tuesday morning in Europe. That said, the 100-HMA defends the cable pair buyers amid firmer RSI and bullish MACD signals.
Also keeping the GBP/USD bulls hopeful is the sustained trading beyond a downward sloping resistance line from June 30, now support around 1.1510.
It should be noted that an upward sloping support line from the previous day, near 1.1545, precedes the 1.1500 threshold to also challenge the GBP/USD sellers.
In a case where the Cable pair drops below 1.1500, the latest trough and the March 2020 bottom, respectively near 1.1445 and 1.1410, will be in focus.
Alternatively, the GBP/USD pair’s recovery moves could aim for the 200-HMA level near 1.1655.
Following that, the 1.1700 round figure and the August-end swing high at 1.1760 could lure the GBP/USD bulls.
It should be noted that July’s low also strengthens the 1.1760 hurdle, a break of which could give control to the bull’s hands.
GBP/USD: Hourly chart
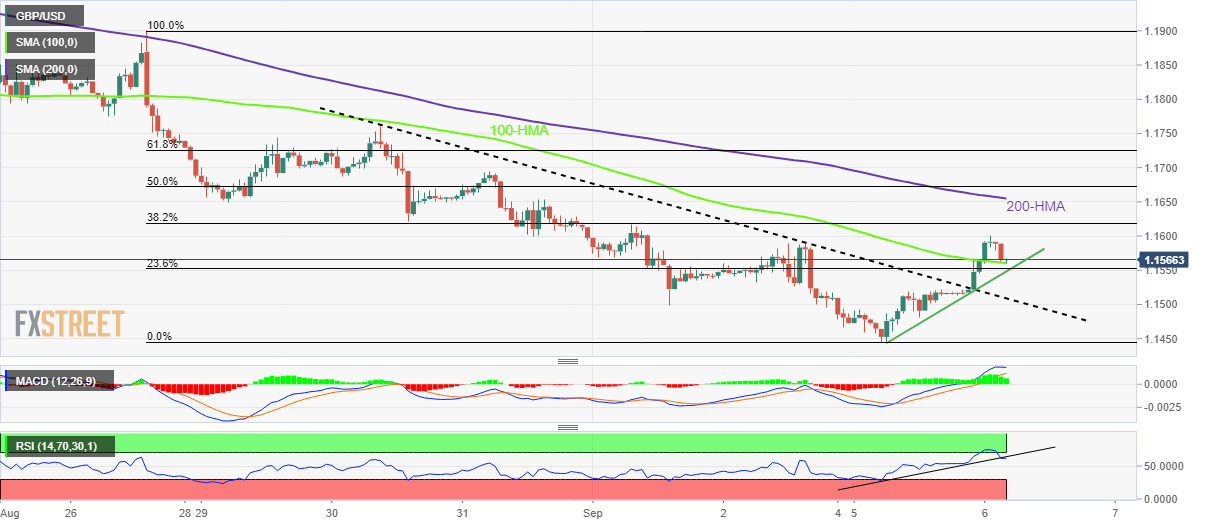
Trend: Further recovery expected
-
05:15
USD/CAD attempts a rebound to near 1.3100, BOC policy and US ISM Services PMI in focus
- USD/CAD has displayed a pullback move after printing a low of 1.3100.
- The BOC is expected to hike its interest rates by 75 bps to 3.25%.
- Weaker estimates for the US ISM Services PMI have turned the DXY volatile.
The USD/CAD pair has picked bids around the immediate support of 1.3100 after displaying a meaningful decline in the Asian session. A rebound attempt in the asset is highly needed to be on the watchlist as it could be a short-lived pullback. The asset is expected to remain volatile as investors are awaiting the release of the US ISM Services PMI after an extended weekend in the US markets.
As per the forecasts, the Services PMI will land at 55.5, lower than the prior release of 56.7. The corporate sector has postponed investment in potential opportunities and expansion plans led by the unavailability of cheap funds due to higher interest rates by the Federal Reserve (Fed). The consequences of higher interest rates have impacted economic activities, which are trimming PMI numbers dramatically.
On the loonie front, investors are awaiting the announcement of the interest rate decision by the Bank of Canada (BOC). BOC Governor Tiff Macklem is expected to escalate the interest rates by 75 basis points (bps). Earlier, the BOC announced a fill percentage rate hike to combat runaway inflation. Price pressures in the Canadian economy have displayed signs of exhaustion. To be noted, the Canadian Consumer Price Index (CPI) was last recorded at 7.6% for July vs. 8.1% print recorded for June.
Meanwhile, the oil prices have retraced after a decent upside move. The black gold is expected to extend gains as OPEC has announced production cuts to fix the recent decline in oil prices. It is worth noting that Canada is a leading exporter of oil to the US and higher oil prices will accelerate dollar inflows.
-
05:07
Australia Treasury bond yields slide, ASX 200 dribble ahead of RBA’s interest rate hike
- Markets in Australia remain cautiously optimistic as RBA’s fourth rate hike worth 0.50% eyed.
- Equities remain sidelined even as stimulus hopes help Asia-Pacific shares.
- Two-year, 10-year yields remain pressured around intraday low, reversing the week-start rebound.
Aussie traders remain cautious during early Tuesday, with eyes on the Reserve Bank of Australia’s (RBA) Interest Rate decision. While portraying the mood, the Australian Treasury Bond yields print losses while the equities remain depressed ahead of the fifth consecutive rate increase.
That said, Australia’s benchmark 10-year Treasury yields lose 1.70% to 3.636% while the two-year note yields 3.115%, down 2.35% intraday, by the press time. Also, Australia’s key equity index, S&P/ASX 200 fades the previous day’s rebound from a five-week low, retreating to 6,856 at the latest.
The reason for the market’s anxiety could be linked to the latest Aussie statistics. It’s worth noting that the latest statistics from Australia haven’t been so impressive to favor the fourth rate hike of the RBA. As per the broad readings, inflation jumped to the highest in three decades while the Unemployment Rate dropped to the lowest in 50 years. The problem, however, is with the housing market as Home Loans plunged by 8.5% in July, the second-largest fall in two decades. It should also be noted that the Participation Rate and net employment also cooled down recently, which in turn underpin the recession fears should the rate hike continues.
Also challenging the RBA hawks are the economic fears emanating from its largest consumer China, as well as from Europe, which in turn warrants caution on the part of the policymakers.
Even so, the AUD/USD prices remain firmer for the third consecutive day, up 0.13% intraday near 0.6800 as we write, amid cautious optimism in the market. In addition to the hawkish hopes from the RBA, the Aussie pair’s rebound could also be linked to the cautious optimism in the market.
Market sentiment improved during the early Asian session after the return of full markets brought expectations of more measures to tame the energy crisis. That said, the incoming UK PM Liz Truss is up for a £130 billion energy plan while the People’s Bank of China (PBOC) cuts the Reserve Requirement Ratio (RRR). Further, politicians from Germany/Eurozone are all in to battle with the recession woes with a heavy push to defend energy companies and stock for winters.
Moving on, the RBA’s rate hike will be crucial as a 0.50% lift is mostly priced-in and hence hawkish comments from the Rate Statement becomes necessary to defend Aussie bulls.
-
04:53
Gold Price Forecast: XAU/USD buyers eye $1,830 hurdle ahead of US ISM Services PMI
- Gold price remains mildly bid amid cautious optimism, hopes of more stimulus.
- Fortnight-old resistance line restricts immediate XAU/USD upside amid firmer RSI.
- Risk-on mood, full markets favor DXY pullback from 20-year high ahead of key PMI data.
Gold price (XAU/USD) portrays a corrective pullback as bulls retreat from intraday high to around $1,720 during early Tuesday morning in Europe. While technical hurdles and doubts over the early Asian session optimism probe the metal buyers of late, softer US Dollar Index (DXY) and hopes of more stimulus from Europe, China and the UK seem to keep XAU/USD buyers positive.
Market sentiment improved during the early Asian session after the return of full markets brought expectations of more measures to tame the energy crisis. That said, the incoming UK PM Liz Truss is up for a £130 billion energy plan while the People’s Bank of China (PBOC) cuts the Reserve Requirement Ratio (RRR). Further, politicians from Germany/Eurozone are all in to battle with the recession woes with a heavy push to defend energy companies and stock for winters.
Amid these plays, the US 10-year Treasury yields rise 2.5 basis points (bps) to 3.21% whereas the S&P 500 Futures extend the week-start recovery to 3,943, up 0.50% intraday by the press time. Further, the market’s consolidation also allowed the DXY to retreat from the 20-year high to 109.37, before a recent rebound to 109.62.
That said, the CME’s FedWatch Tool hints at the 60% chance of the Fed’s 0.75% rate hike in September, versus over 75% marked in the previous week. The easing in the hawkish Fed bets could be linked to the mixed US jobs report for August.
It should be noted that the reaction of the traders from the US and Canada will be closely observed for clear directions. Also important will be the geopolitical headlines surrounding China, Russia and the US. Additionally, the ISM Services PMI for August, expected 55.5 versus 56.7 prior, should offer additional directions to the XAU/USD bulls.
Technical analysis
The bullish RSI divergence needs validation from the 50-SMA, as well as a two-week-old resistance line, respectively around $11,724 and $1,730, to convince the gold buyers. Even so, the 200-SMA hurdle surrounding $1,753 could act as a tough challenge for the XAU/USD buyers before retaking control.
In a case where gold price remains firmer past $1,753, the late August swing high near $1,765, could act as the last defense for the bears.
Alternatively, pullback moves could aim for the $1,700 threshold before directing the bears towards the yearly low surrounding $1,680.
Overall, XAU/USD remains bearish unless crossing $1,765. However, an intermediate rebound of the metal can’t be ruled out.
Gold: Four-hour chart
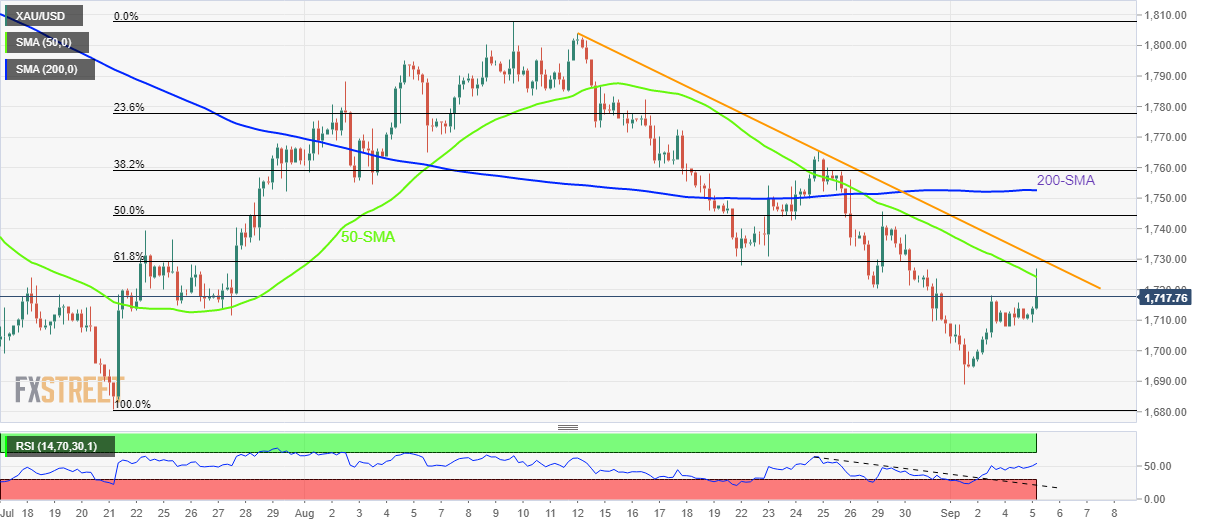
Trend: Limited recovery expected
-
04:31
EUR/USD aims to recapture 1.0000 magical figure as focus shifts to ECB policy
- EUR/USD is marching towards 1.0000 parity on soaring ECB hawkish bets.
- Russia has cut off the energy supply to Eurozone citing western sanctions.
- The DXY has turned volatile amid weaker estimates for US ISM Services PMI.
The EUR/USD pair is displaying a minor correction after printing an intraday high of 0.9970 in the Asian session. The corrective move does not resemble signs of bearish reversal but a healthy decline, which will be capitalized by the market participants for adding longs. On Monday, the asset displayed a firmer rebound after halting the crucial support of 0.9900. As investors considered the pair a value bet, the shared currency bulls got strengthened and recovered sharply.
The eurozone bulls are picking bids as odds are advancing for a hawkish stance by the European Central Bank (ECB) on interest rates. As price pressures are soaring in the trading bloc, ECB President Christine Lagarde may announce a rate hike by 50 basis points (bps). Eurozone Harmonized Index of Consumer Prices (HICP), ECB’s most preferred inflation indicator landed at 9.1%, which is highly needed to contain sooner.
Meanwhile, the energy crisis is deepening in eurozone as Russia has halted energy supplies through Nord Stream 1 pipeline due to western sanctions. Western leaders levied a price cap on Russian oil and in response to the same, Kremlin has cut off gas supply ahead of the winter season, which is known for higher energy demand.
On the dollar front, the US dollar index (DXY) has attempted a recovery after remaining volatile in the opening session. The DXY has picked bids around 109.40, however, the downside remains favored amid weaker estimates for The US ISM Services PMI data. The economic data is seen at 55.5, lower than the prior release of 56.7.
-
04:29
USD/INR Price Analysis: Indian rupee rebounds towards 200-SMA near 79.60
- USD/INR snaps three-day uptrend as it retreats towards the key SMA, Fibonacci retracement levels.
- Six-week-old descending trend line holds the key to buyer’s conviction.
- Multiple troughs could test the pair bears before the previous monthly low.
USD/INR retreats to 79.80, after a three-day uptrend, as buyers run out of steam during Tuesday’s Asian session. In doing so, the Indian rupee (INR) pair fades bounce off the 200-SMA, as well as the 61.8% Fibonacci retracement of July 21 to August 02 downside.
Given the steady RSI and the pair’s multiple failures to cross a downward sloping resistance line from late July, the USD/INR sellers are likely to be welcomed for the short-term.
During their stay, the 200-SMA and the 61.8% golden ratio, respectively near 79.60 and 79.45, will be crucial to watch for further dominance.
Also acting as the downside filter is the mid-August low and the 38.2% Fibonacci retracement level, close to 79.10 and the 79.00 round figure.
It should be noted, however, that a downside break of the 79.00 threshold, could make the pair vulnerable to drops towards the previous monthly low near 78.10.
On the flip side, a daily closing beyond the aforementioned resistance line, at 80.20 by the press time, becomes necessary for the USD/INR bulls.
Following that, the latest record high near 80.30 and 81.00 could quickly flash on the chart.
USD/INR: Four-hour chart
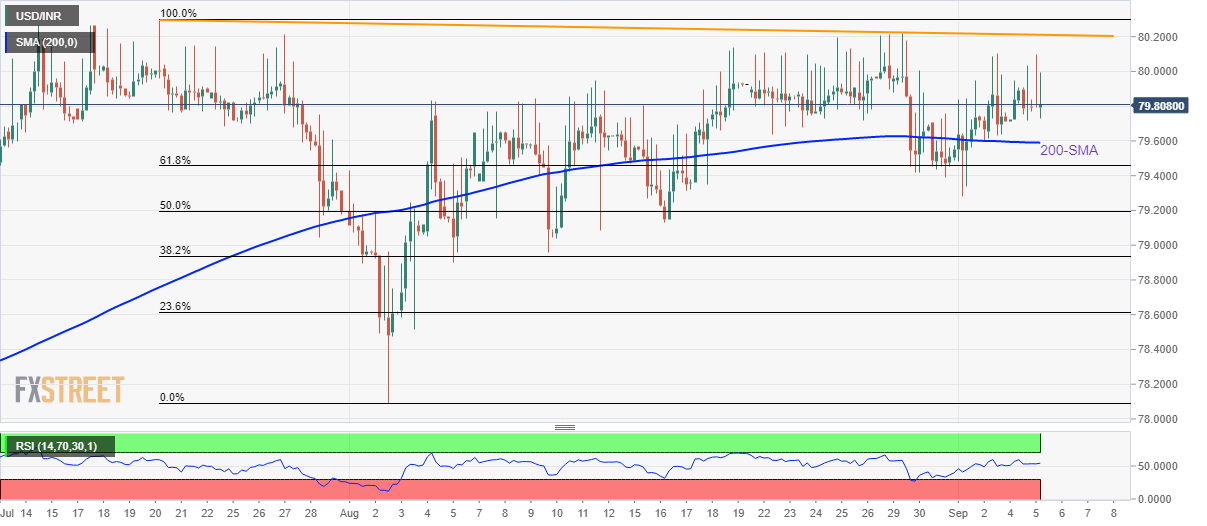
Trend: Further weakness expected
-
04:02
Steel prices see more downside as a bleak growth outlook warrants more production cuts
- Steel prices are facing the heat of a decline in global growth prospects.
- Soaring energy prices in Eurozone have forced leading steel producers to scale down operations.
- Steel prices will remain vulnerable until global demand gets revived.
Steel prices have remained vulnerable for the past few weeks as a slowdown phase in the world’s largest metal-consuming economy has trimmed growth prospects further. The Chinese economy is facing the headwinds of a resurgence in Covid-19. Lockdown curbs have been announced by the administration to contain the spread of the pandemic, which has forced restrictions on the movement of men, materials, and machines.
Apart from that, the Chinese economic activities indicator, Caixin Manufacturing PMI data slipped sharply last week. The economic data was trimmed to 49.5 against the consensus of 50.2 and the prior release of 50.4. This soared signs of de-growth in China and it is highly expected that steel numbers will tumble eventually.
The investing community is aware of the fact that the Eurozone and the UK economy are facing the heat of soaring energy prices. After Russia halted energy supplies citing western sanctions responsible for taking a difficult step, the energy crisis deepened in the trading bloc and pound zone. In response to volatile energy prices, the world’s second-largest steel producer in the world, ArcelorMittal, has decided to shut down operations in a factory in Europe. The decision of shutting down production capacity is also forced by bleak economic growth and higher expenses for tackling CO2 emissions.
As Europe has tapped the supply cut route due to lower demand and higher energy prices after China, it is highly likely that the supply-demand mechanism will get fixed to some extent. But unless and until the global demand gets revived, steel prices will remain vulnerable.
-
03:26
Gazprom: Nord Stream 1 will not be launched until Siemens energy replaces faulty equipment
Gazprom Deputy CEO Vitaly Markelov said in a statement on Tuesday, Nord Stream 1 pipeline will not be launched until Siemens energy replaces faulty equipment.
more to come ....
-
03:24
NZD/USD Price Analysis: Falling wedge confirmation teases bulls above 0.6100
- NZD/USD seesaws around intraday high after crossing the falling wedge resistance.
- MACD backs the bullish chart pattern breakout to suggest buyer’s another battle with the 200-SMA.
- 50-SMA guards immediate upside, seven-week-old horizontal support area restricts downside.
NZD/USD bulls approach the 50-SMA hurdle, after crossing the falling wedge’s resistance line, during Tuesday’s Asian session. In doing so, the Kiwi pair prints the biggest daily gains in over a week during the three-day uptrend, up 0.38% intraday near 0.6115 by the press time.
That said, an upside clearance of the 0.6100 hurdle, now support, confirms the falling wedge bullish chart pattern. Also keeping buyers hopeful are the bullish MACD signals.
However, the 50-SMA level surrounding 0.6135 challenges the immediate advances ahead of the key 200-SMA hurdle near 0.6250.
Following that, the early August swing high near 0.6355 will precede the previous monthly peak of 0.6470 to lure NZD/USD bulls.
Meanwhile, pullback moves remain elusive until staying beyond the resistance-turned-support line near 0.6100.
Even if the NZD/USD prices decline below the 0.6100 round figure, the horizontal area comprising levels marked since mid-July, near 0.6050-60, as well as the lower line of the stated wedge, close to 0.6030 at the latest, could challenge the bears targeting the 0.6000 mark.
NZD/USD: Four-hour chart

Trend: Further upside expected
-
03:12
PBOC moves early to curb rapid yuan decline – China Press
“The People's Bank of China's (PBOC) cut to the foreign exchange reserve requirement ratio on Monday is an early move to curb expectations of a rapid decline of yuan against the US dollar,” the 21st Century Business Herald reported on Tuesday, citing analysts.
Additional takeaways
“Some foreign investors have expected continued yuan depreciation as the US Dollar Index marches towards 110, and as the euro and yen hit their lowest levels in 20 years.”
“Speculators have also increased bets on a declining yuan, adding to bearish sentiment.”
“The onshore and offshore yuan quickly rebounded by about 200 basis points following the PBOC's move, as some overseas investors reduced indiscriminate short selling.”
Related reads
- USD/CNY: Forex RRR cut unlikely to stem the yuan's weakening trend – ING
- PBOC: Will cut FX reserve requirement ratio to help limit yuan weakness
-
03:06
When is the RBA Interest Rate Decision and how could it affect AUD/USD?
After announcing consecutive four rate increases in the last meetings, the Reserve Bank of Australia (RBA) is up for another hawkish monetary policy outcome during the scheduled Interest Rate Decision around 04:30 AM GMT on Tuesday.
The RBA is expected to lift the benchmark interest rate by 50 basis points (bps) to 2.35%, mainly to fight inflation and match the tune with other major central banks. However, the odds of disappointing markets with 0.25% interest rate lifts aren’t out of the table and hence the AUD/USD traders are on the edge ahead of the meeting announcements.
With the stated rate increases, the Aussie central bank could reach near the monetary policy hawks like the Fed and RBNZ, not to forget the BOE and BOC, even as the domestic numbers have been mixed of late, making today’s RBA rate hike interesting.
Ahead of the event Westpac said,
Westpac anticipates that the cash rate will rise to 3.10% by year-end and then peak at 3.35% in February 2023 - with moves of 25bps each meeting from October to February.
On the other hand, FXStreet’s Valeria Bednarik says,
If Australian policymakers maintain the aggressive pace of hikes, it may be found to be the cause of a recession.
How could the RBA decision affect AUD/USD?
AUD/USD grinds higher around the intraday top, positing the biggest daily gains in over a week, as risk-on mood joins a pullback in the US Dollar Index (DXY). Among the main catalysts, hopes of more stimulus and receding hawkish bias, as well as preparations for the 0.50% RBA rate hike, also seem to have underpinned the Aussie pair’s latest recovery. Even so, the pair bulls remain cautious amid mixed signals from home and abroad.
As per the latest Aussie data, inflation jumped to the highest in three decades while the Unemployment Rate dropped to the lowest in 50 years. The problem, however, is with the housing market as Home Loans plunged by 8.5% in July, the second-largest fall in two decades. It should also be noted that the Participation Rate and net employment also cooled down recently, which in turn underpin the recession fears should the rate hike continues.
Also challenging the RBA hawks are the economic fears emanating from its largest consumer China, as well as from Europe, which in turn warrants caution on the part of the policymakers.
That said, a 0.5% rate hike appears already priced in and may offer a knee-jerk reaction, which in turn highlights the pace of bond purchase as the key catalyst. Should the policymakers appear cautious and ease on bond purchases, the bears may concentrate more on the US dollar strength and rush towards the yearly low. On the contrary, an intact bond purchase and hawkish rate statement could tease the AUD/USD bulls.
Technically, a four-month-old descending trend channel signals the AUD/USD pair’s bearish bias. However, the RSI (14) approaches oversold territory and hence could challenge the further downside. Even so, the yearly low near 0.6680 and the channel’s support line around 0.6570 seem to lure the sellers. Alternatively, the 50-DMA hurdle surrounding 0.6900 appears an immediate key hurdle for the pair buyers to watch. Following that, the 38.2% Fibonacci retracement of the April-July downside and the stated channel’s resistance line, respectively near 0.7050 and 0.7100, could challenge the upside moves.
AUD/USD: Daily chart
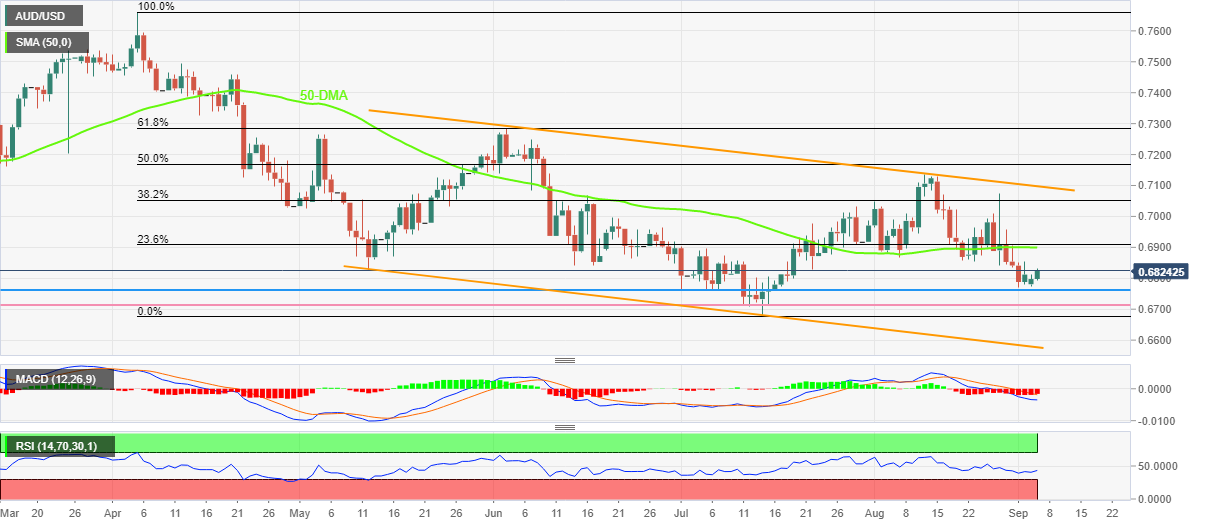
Key quotes
AUD/USD justifies cautious optimism above 0.6800 as RBA rate hike, US ISM PMI loom
Reserve Bank of Australia Preview: Is the central bank ready to slow the tightening pace?
AUD/USD Forecast: Eyes on RBA monetary policy decision
About the RBA interest rate decision
RBA Interest Rate Decision is announced by the Reserve Bank of Australia. If the RBA is hawkish about the inflationary outlook of the economy and rises the interest rates it is positive, or bullish, for the AUD. Likewise, if the RBA has a dovish view on the Australian economy and keeps the ongoing interest rate, or cuts the interest rate it is seen as negative, or bearish.
-
03:01
Japan’s Suzuki: Recent forex moves are becoming more significant
Japanese Finance Minister Shunichi Suzuki said on Tuesday that “I have the impression that recent forex moves are becoming more significant.”
Additional quotes
"We will decide whether to extend fuel subsidies based on prices, etc."
"We will consider exiting from fuel subsidies at some point."
"It is desirable for FX to move stably."
"It is not desirable for FX to move rapidly."
“Important for FX market to move stably reflecting econ fundamentals.”
“Watching FX moves with high sense of urgency.”
“Recent FX volatility is high.”
Market reaction
At the time of writing, USD/JPY is trading at 140.40, down 0.12% on the day, as traders shrug off the latest Japanese jawboning.
-
02:56
WTI struggles to praise OPEC+ output cut, Russia-led tension below $90.00
- WTI crude oil fades two-day rebound despite risk-on mood.
- OPEC+ announced ‘small’ output cut, Russia warns of selling more oil to Asia on price cap.
- China-linked headlines join central bank chatters and recession woes to weigh on energy prices.
- US ISM Services PMI, details of the stimulus from UK/Europe will be important too.
WTI crude oil buyers fail to cheer the OPEC+ output cut, nor the mildly positive sentiment, as the quote drops to $88.25 during Tuesday’s Asian session. In doing so, the black gold also ignores the stimulus hopes and the recent warning from Russia.
That said, the Organization of the Petroleum Exporting Countries and allies including Russia, known collectively as OPEC+, have agreed to lower oil output targets by 100,000 barrels per day in October. “The decision essentially maintains the status quo as OPEC has been observing wild fluctuations in oil prices,” stated Reuters after the release.
Elsewhere, fears of a blockade of Russian oil, due to the Western price cap, also receded after Russia Energy Minister Nikolai Shulginov stated, per Reuters, “Russia will respond to price caps on Russian oil by shipping more supply to Asia.”
It should be noted that the UK is up for £130 billion energy plan while Germany braces for a big move to help energy companies battle the latest jump in the oil prices due to the Russia-Ukraine tussles. Furthermore, Europe also eyes stimulus measures to overcome the energy crisis that hints at the economic recession in the bloc. “European Union governments are pushing through multi-billion euro packages to prevent utilities buckling under a liquidity squeeze and to protect households from soaring energy bills,” said Reuters.
It’s worth observing that the US-China tension, recession woes and the central bank aggression towards higher rates weigh on the black gold prices.
While portraying the mood, the US 10-year Treasury yields rise 2.1 basis points (bps) to 3.21% whereas the S&P 500 Futures extend the week-start recovery to 3,953, up 0.75% intraday by the press time.
Looking forward, chatters surrounding the stimulus and other risk catalysts could entertain the WTI traders ahead of the US ISM Services PMI for August, expected 55.5 versus 56.7 prior.
Technical analysis
WTI crude oil’s failure to cross the 10-day EMA hurdle surrounding $89.70 joins sluggish MACD to tease sellers targeting the $85.80-40 support zone comprising lows marked during August and so far during September.
-
02:55
US dollar Price Analysis: Bears take out critical support on H4 chart
- US dollar is pressured as the week gets going following the holidays.
- The bears have broken a key structure on the 4-hour chart.
As per the prior analysis from early in the day, the US dollar remains under pressure and has recently taken out a very key structure on the four-hour charts. The following illustrates the potential for a significant correction in the days ahead.
It was explained that the price was running into resistance but the bears needed to get below the 4-hour support if there were going to be prospects of a deeper correction for the sessions ahead.
DXY prior analysis

US dollar live update

The price broke below the 109.80s and is not headed towards a key area in the 108.90s for the day ahead if the bears can get below the trendline support.
A break here opens risk towards 108.50 and then a 38.2% Fibonacci retracement below there near 108.10. The neckline of the harmonic pattern is located all the way down at 106.93.
-
02:36
S&P 500 Futures, yields portray firmer sentiment amid full markets, US ISM PMI eyed
- Risk profile improves amid hopes of multiple stimulus, return of full markets.
- Receding hawkish Fed bets, a light calendar ahead of RBA also favor cautious optimism.
- S&P 500 Futures extend bounce off seven-week low, US 10-year Treasury yields stay firmer.
- US ISM Services PMI for August will decorate the calendar.
Market sentiment appears positive during Tuesday’s Asian session as the return of the US and Canadian traders after the long weekend joins hopes of stimulus to push back recession woes. Also keeping the traders positive were recently easing hawkish Fed bets, as well as a light calendar.
While portraying the mood, the US 10-year Treasury yields rise 2.1 basis points (bps) to 3.21% whereas the S&P 500 Futures extend the week-start recovery to 3,953, up 0.75% intraday by the press time.
Be it the incoming UK PM Liz Truss’ £130 billion energy plan or the People’s Bank of China’s (PBOC) cut in the Reserve Requirement Ratio (RRR), not to forget stimulus from Germany/Eurozone, policymakers are all in to battle with the recession woes. In addition to the stimulus hopes, recently mixed data also challenges the hawkish expectations from the major central banks, which in turn supports the latest optimism.
That said, the CME’s FedWatch Tool hints at the 60% chance of the Fed’s 0.75% rate hike in September, versus over 75% marked in the previous week. The easing in the hawkish Fed bets could be linked to the mixed US jobs report for August.
Alternatively, recession fears remain on the table amid the energy crisis while the US-China tussles and mixed data could keep the traders on their toes.
However, the pullback in the US Dollar Index (DXY) from the 20-year high and sluggish moves in oil prices suggests the further consolidation of the market sentiment.
For that matter, today’s US ISM Services PMI for August, expected 55.5 versus 56.7 prior, will be eyed closely.
Also read: ISM Services PMI Preview: High bar to help dollar bears pass through and take over
-
02:34
Energy Minister Shulginov: Moscow will respond to price caps on Russian oil by shipping more oil to Asia
Russian Energy Minister Nikolay Shulginov said on Tuesday that they will respond to price caps on Russian oil by shipping more oil to Asia.
Additional quotes
“Russia and partners are considering setting up own insurer to facilitate oil trade.”
“Nothing has been decided on Nord Stream 1 gas pipeline resumption.”
These comments come after members of the G7 agreed on Friday to impose a price cap on Russian oil in a bid to hit Moscow's ability to finance the war in Ukraine.
"We will continue to stand with Ukraine for as long as it takes," the G7 said.
Market reaction
Amidst these above comments and the OPEC+ output cut, WTI was last seen trading at $88.76, modestly flat on the day. The US oil is off the daily high of $89.09.
-
02:30
Australia Current Account Balance registered at 18.3B, below expectations (20.8B) in 2Q
-
02:24
USD/CNY fix: 6.9096 vs. the last close of 6.9330.
In recent trade today, the People’s Bank of China (PBOC) set the yuan (CNY) at 6.9096 vs. the last close of 6.9330.
About the fix
China maintains strict control of the yuan’s rate on the mainland.
The onshore yuan (CNY) differs from the offshore one (CNH) in trading restrictions, this last one is not as tightly controlled.
Each morning, the People’s Bank of China (PBOC) sets a so-called daily midpoint fix, based on the yuan’s previous day's closing level and quotations taken from the inter-bank dealer.
-
02:22
Gold Price Forecast: XAU/USD accelerates towards $1,730 as DXY tumbles ahead of US ISM Services PMI
- Gold price has witnessed a sheer upside to near $1,723.30 on lower consensus for US ISM Services PMI.
- The DXY has slipped below 109.50 as the market mood has turned positive.
- The US ISM Services PMI is seen lower at 55.5 vs. 56.7.
Gold price (XAU/USD) has displayed a vertical upside after overstepping the critical hurdle of $1,718.00 in the Asian session. The precious metal has delivered an upside break of the consolidation formed in a narrow range of $1,708.82-1,718.15 and is expected to display more upside ahead. The yellow metal has picked significant bids amid lower consensus for US ISM Services PMI data.
The US ISM Services PMI data is seen lower at 55.5 against the prior release of 56.7. Also, the forward-looking Services New Orders Index is also expected to remain subdued at 59.5 vs. 59.9. The consequences of adopting sheer pace in hiking interest rates by the Federal Reserve (Fed) are visible in the service sector. Also, the big tech boys have already halted their recruitment process ahead of a decline in economic activities.
Meanwhile, the US dollar index (DXY) has witnessed a steep fall at open as the risk-off market mood is fading away. Risk-perceived currencies are gaining a lot of traction after turning extremely oversold as the fundamentals are still fragile. It is worth noting that US markets will open today after an extended weekend, therefore, higher volatility cannot be ruled out.
Gold technical analysis
Gold prices have poked the 200-period Exponential Moving Average (EMA) at $1,723.60 after witnessing a perpendicular upside move. The precious metal has also broken a small Symmetrical Triangle placed in a narrow range of $1,707.74-1,717.76.
Adding to that, the Relative Strength Index (RSI) (14) has stepped into the bullish range of 60.00-80.00, which has activated bulls for upside momentum.
Gold hourly chart

-
02:11
USD/JPY Price Analysis: Bulls are throwing in the towel and H4 bear M-formation is in play
- USD/JPY's H4 M-formaition is a reversion pattern.
- Bears need to stay below the neckline for a move to test the recent lows near 140 the figure.
USD/JPY is crumbling away in Asia as the US dollar folds from the recently scored fresh highs in the monthly bull cycle. The price of the DXY has broken a key structure on the 4-hour charts and this could lead to a significant move to the downside for the week ahead. The following illustrates the market structure and price action on both the DXY and the USD/JPY charts.
DXY chart, H4
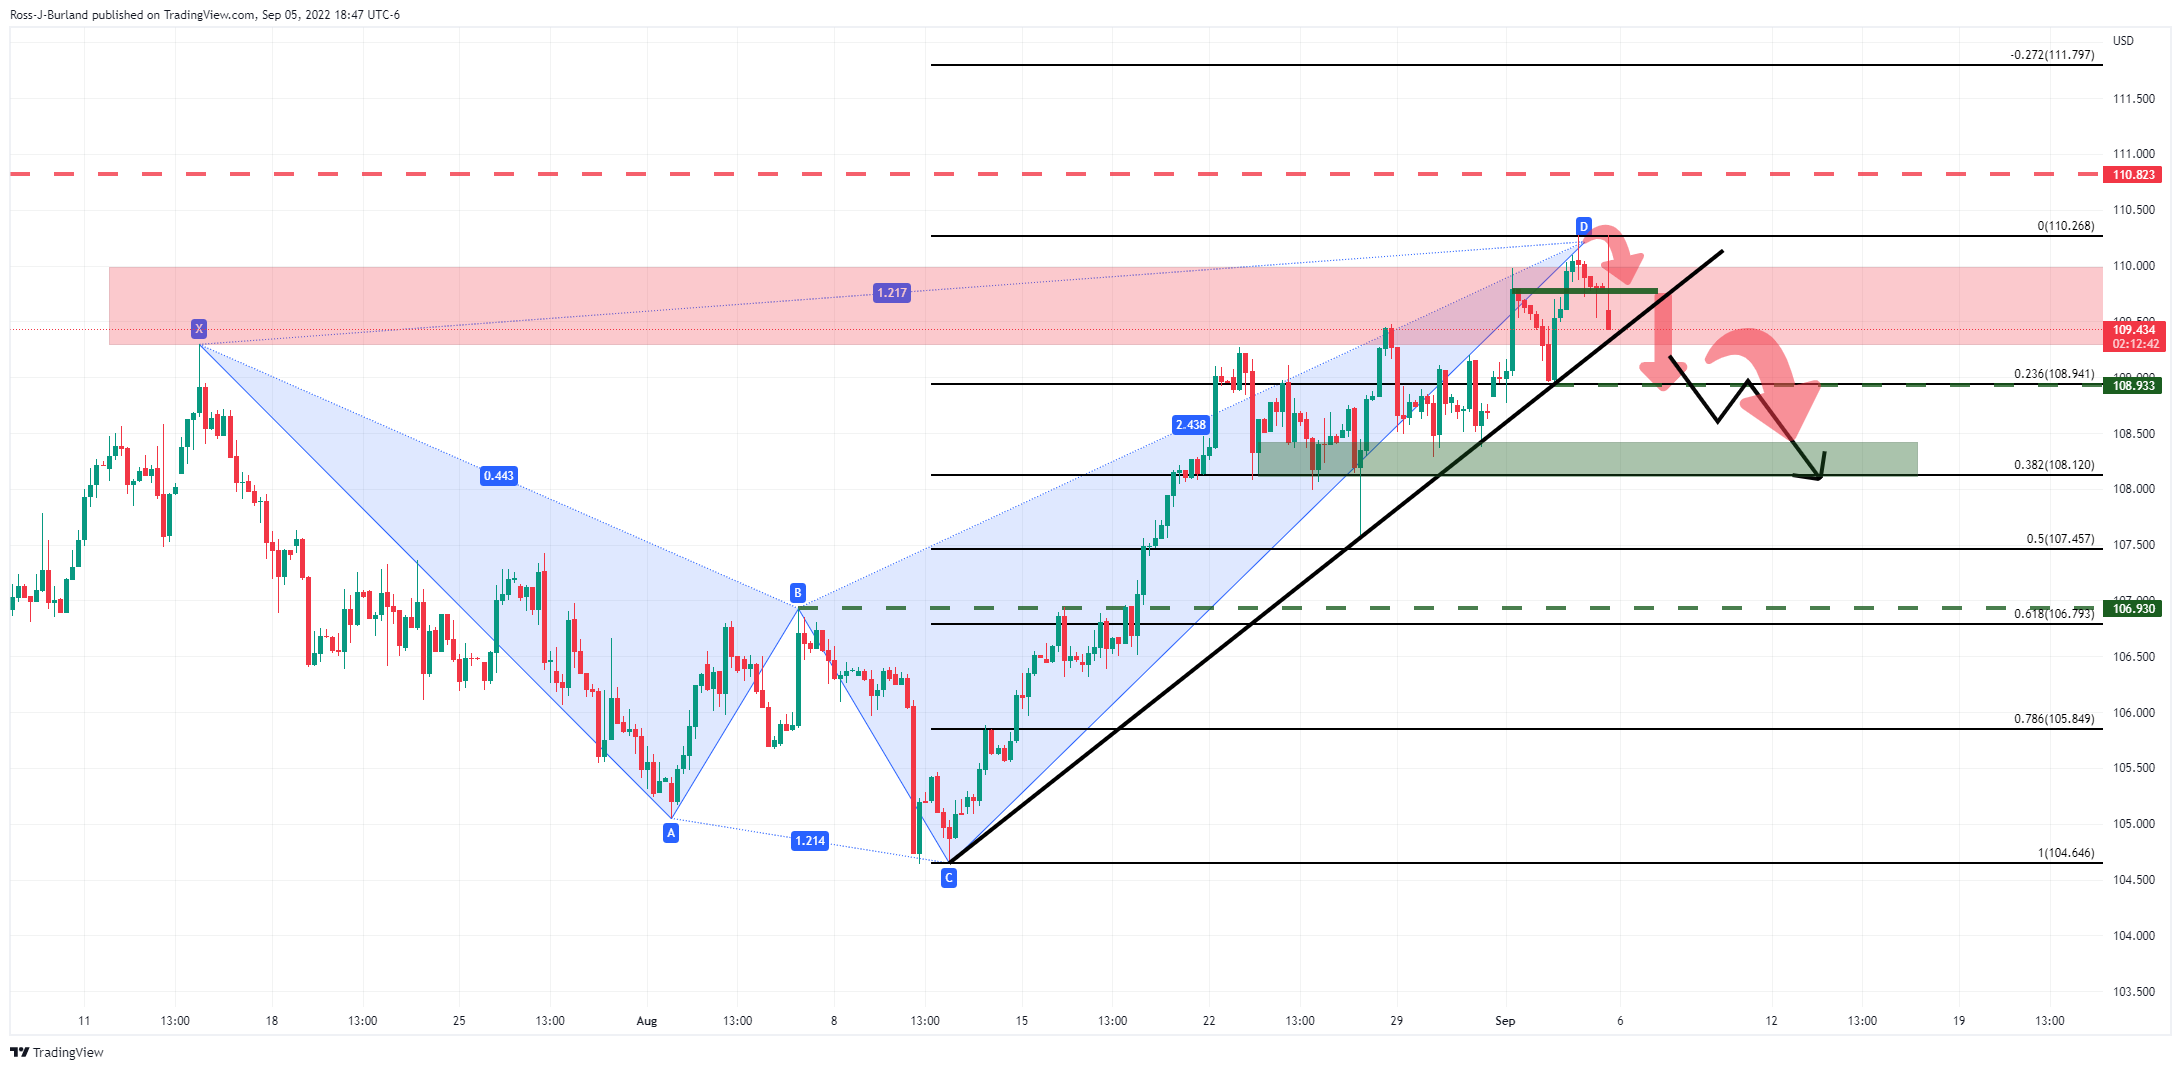
The price broke below the 109.80s and is not headed towards a key area in the 108.90s for the day ahead. If this were to break, it could act as a resistance and if so, then the gates will be open for an even deeper correction where a 38.2% Fibonacci retracement level is located down near 108.12.
USD/JPY daily chart

The yen is benefitting from the move in the greenback. There is a harmonic pattern that could be about to play out. A peak at this juncture could lead to a significant sell-off towards the prior highs and through the Fibo scale for the days ahead. If this were to hold, however, in the area highlighted above, then there will be prospects of a continuation thereafter.
USD/JPY H4 chart

The M-formaition is a reversion pattern. The recent bearish impulse will eventually run out of steam and that makes for a move back towards the neckline before further supply that would then tackle the recent lows near 140 the figure.
-
02:10
GBP/USD approaches 1.1600 on hopes of fiscal boost from Truss, higher BOE rates
- GBP/USD leads the G10 currency pairs amid broad US dollar pullback, cautious optimism.
- UK Tory Leadership winner Lizz Truss readies £130 billion energy plan, talks of BOE review also gain momentum.
- US ISM Services PMI for August, risk catalysts will be important for fresh impulse.
GBP/USD takes the bids to refresh intraday high around 1.1590 as bulls welcome Lizz Truss's leadership amid hopes of heavy stimulus and a push to the Bank of England (BOE). With this, the Cable pair leads the G10 currency pairs while posing 0.65% intraday gains during Tuesday’s Asian session.
“Incoming Prime Minister Liz Truss has drafted plans to fix annual electricity and gas bills for a typical UK household at or below the current level of £1,971 ($2,300),” said Bloomberg after Truss won a contest to become the next UK Prime Minister. The news also mentioned that She’s under pressure to come up with a solution to surging energy prices that are crushing families and businesses in the UK as Russia shuts off gas supplies to Europe in response to the sanctions imposed following its invasion of Ukraine.
"I will deliver a bold plan to cut taxes and grow our economy," Truss said after the result was announced. "I will deliver on the energy crisis, dealing with people's energy bills, but also dealing with the long-term issues we have on energy supply," stated UK PM candidate Truss per Reuters.
Elsewhere, her criticism of the BOE’s slow response to the inflation fight is well-known, which in turn hints at faster rate increases from the “Old Lady”, as the UK central bank is often termed.
It should be noted that the US dollar’s pullback also plays a role in the GBP/USD rebound. That said, the US Dollar Index (DXY) fails to justify firmer US Treasury yields while dropping 0.35% to 109.43 by the press time. In doing so, the greenback’s gauge versus the six major currencies extended its pullback from the 20-year high marked the previous day.
The DXY pullback could also be linked to the market’s cautious optimism, as portrayed by mildly positive stock futures, amid expectations that global policymakers will be able to tackle the energy crisis. The recent retreat in the hawkish Fed bets, especially after Friday’s mixed US jobs report, also adds strength to the GBP/USD rebound.
Alternatively, a fall in the UK’s Consumer Spending, as per the data released on Tuesday by payments company Barclaycard probe the bears. “UK consumers cut spending on clothing, DIY and beauty products in August, while business activity contracted, in a sign of “collapsing” demand owing to the intensifying cost of living crisis,” said the Financial Times (FT).
Moving on, risk catalysts are likely to entertain the pair traders amid full markets. Also important will be the ISM Services PMI for August, expected 55.5 versus 56.7 prior.
Technical analysis
Unless crossing a monthly resistance line, around 1.1675 by the press time, GBP/USD remains on the bear’s radar.
-
01:52
EUR/USD Price Analysis: Bulls have a bumpy road ahead, 0.9980 appears immediate hurdle
- EUR/USD picks up bids to refresh intraday high, extends bounce off seven-week-old support line.
- RSI, MACD also tease buyers but 10-DMA probes recovery moves.
- Monthly resistance line, 50-DMA adds to the upside filters.
EUR/USD holds onto the previous day’s corrective bounce off the short-term key support line around 0.9960 during Tuesday’s Asian session.
In doing so, the major currency pair also takes clues from the impending bull cross on the MACD, as well as the rebound, to underpin the recovery moves towards the 10-DMA hurdle surrounding 0.9980.
Following that, the 1.0000 parity level and a downward sloping resistance line from August 17, close to 1.0030, could test the recovery moves. It’s worth noting that the 50-DMA level surrounding 1.0150 appears the last defense of the EUR/USD bears before giving control to the buyers.
Alternatively, a descending support line from mid-July, near 0.9880, restricts the immediate downside of the pair.
Following that, the 61.8% and 78.6% Fibonacci Expansion (FE) of the EUR/USD pair’s moves between late May and early August, respectively around 0.9845 and 0.9700, could challenge the pair’s downside.
It’s worth noting that the RSI (14) is nearly oversold and hence further downside has limited room.
EUR/USD: Daily chart
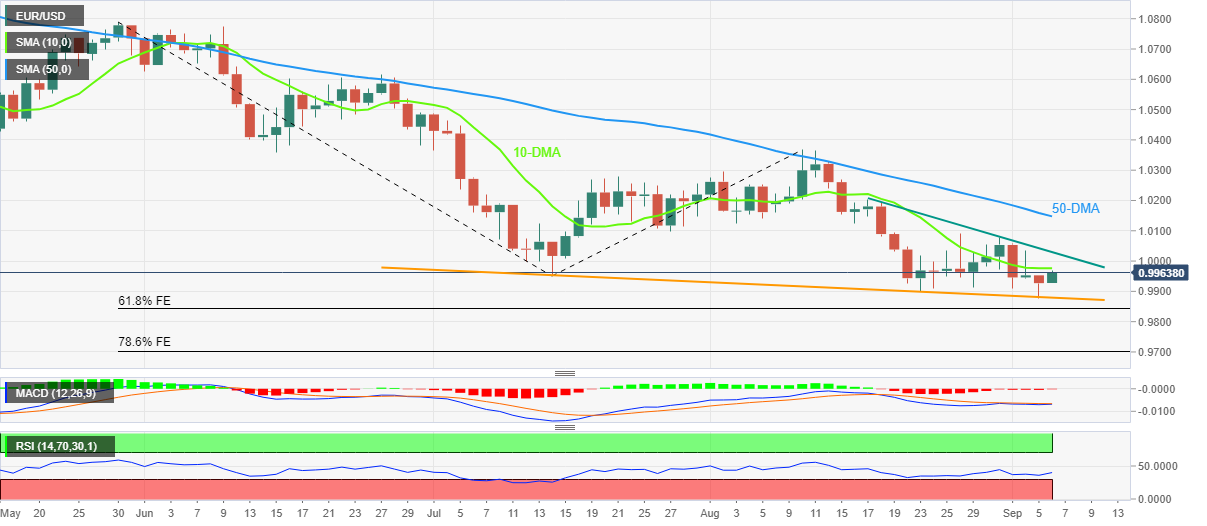
Trend: Limited recovery expected
-
01:41
Silver Price Analysis: XAG/USD breaks above $18.23-18.30 demand zone, $18.50 eyed
- A cross above the $18.23-18.30 demand zone has triggered a fresh rally ahead.
- An upside break of volatility contraction has unleashed bulls for hitting the hurdle of $18.50.
- The RSI (14) has stepped into the bullish range of 60.00-80.00.
Silver price (XAG/USD) is hovering around four-day’s high at $18.29 after a firmer upside move in the Asian session. The precious metal is advancing higher right from the initial tick of the intraday trading session and has extended its gains above the critical hurdle of $18.25. The asset is displaying signs of a bullish open-drive session ahead in which every pullback will generate a bargain buy opportunity for the market participants.
The white metal is attempting to break above the demand zone placed in a narrow range of $18.23-18.30 on an hourly scale. Also, the asset is displaying a breakout of the volatility contraction phase, which will result in wider ticks and heavy volume.
A bull cross, represented by the 20-and 50-period Exponential Moving Averages (EMAs) at $18.00, is indicating more upside ahead.
Adding to that, the Relative Strength Index (RSI) (14) has stepped into the bullish range of 60.00-80.00, which has activated bulls for upside momentum.
Sustainability above the $18.23-18.30 demand zone will send the asset towards August 29 low near $18.50, followed by August 29 high at $18.83.
On the flip side, the asset will witness a steep fall to near Thursday’s low at $17.56 and the round-level support of $17.00 after dropping below Wednesday’s low at $17.90.
XAG/USD hourly chart
-637980216200336912.png)
-
01:25
AUD/USD justifies cautious optimism above 0.6800 as RBA rate hike, US ISM PMI loom
- AUD/USD picks up bids to extend the week-start rebound from seven-week low.
- Market sentiment improves amid hopes of more stimulus.
- Easing fears of recession, hawkish Fed bets underpin bullish bias as full markets return.
- RBA is expected to announce a fourth rate of 0.50% but the rate statement is crucial for bulls to watch.
AUD/USD flourishes on the bull’s radar as it refreshes the intraday low around 0.6820, close to 0.6815 by the press time, amid the market’s mildly positive outlook during Tuesday’s Asian session. The Aussie pair’s latest run-up could also be linked to the hawkish hopes from the Reserve Bank of Australia’s (RBA) anticipated fourth rate hike.
Be it the UK’s energy bill freeze or the People’s Bank of China’s (PBOC) cut in the Reserve Requirement Ratio (RRR), not to forget stimulus from Germany/Eurozone, policymakers are all in to battle with the recession woes, which in turn favored the sentiment. Also likely to have favored the AUD/USD buyers are the market’s reaction to the recent retreat in the hawkish Fed bets, especially after Friday’s mixed US jobs report. Above all, preparations for the RBA’s likely 0.50% rate hike and the full markets seemed to have played the role of late.
While portraying the mood, the US 10-year Treasury yields rise three basis points to 3.22% while the S&P 500 Futures rise 0.30% 3,938 at the latest.
Alternatively, the impending recession woes in the Eurozone, the firmer odds of the US Federal Reserve’s (Fed) faster rate hikes despite the recently mixed data and the Sino-American tussles weighing on the prices. It should also be noted that the RBA’s rate hike appears mostly priced-in and hence the AUD/USD traders seem to brace for a bearish move.
Russia’s halting of energy supplies to European worsened the situation for the old continent after it joined the other Group of Seven (G7) leaders to announce a price cap on Moscow’s oil. Also adding to the European energy crisis were dimming hopes of the US-Iran oil deal and the output cut from the Organization of the Petroleum Exporting Countries and allies including Russia, known collectively as OPEC+.
Further, the US-China tussles over the trade deal and Taiwan escalated on Monday as the Biden Administration announced its intention to continue with the Trump-era tariffs for now. These tariffs were examined for removal and signaled the likely improvement in the relations previously. Further, the US readiness to sell arms to Taiwan and Taipei’s no-visa entry for some of its friendly country residents, including the US, teased Beijing to utter harsh words about the US-Taiwan ties and increases the tension.
Looking forward, the RBA’s 0.50% rate hike might not be able to convince the AUD/USD bulls unless the rate statement sounds hawkish. That said, a smaller-than-expected rate move or dovish comments from the Aussie central bank could renew the pair’s selling. Following that, the ISM Services PMI for August, expected 55.5 versus 56.7 prior, will be eyed closely for fresh impulse.
Also read: Reserve Bank of Australia Preview: Is the central bank ready to slow the tightening pace?
Technical analysis
AUD/USD rebound takes clues from the recently firmer RSI (14) to direct buyers toward the 0.6900 resistance confluence including the 50-DMA and the 23.6% Fibonacci retracement of the April-July downside. Meanwhile, a two-month-old horizontal support area restricts short-term declines of the Aussie pair to around 0.6765-60.
-
01:15
Currencies. Daily history for Monday, September 5, 2022
Pare Closed Change, % AUDUSD 0.67961 0.13 EURJPY 139.57 0.28 EURUSD 0.99286 0.01 GBPJPY 161.948 0.56 GBPUSD 1.15202 0.28 NZDUSD 0.60889 0 USDCAD 1.31431 0.02 USDCHF 0.97971 -0.2 USDJPY 140.577 0.27 -
01:03
EUR/GBP drops to near 0.8600 as Truss sets to become next UK PM, ECB policy buzz
- EUR/GBP has declined to near 0.8600 on novel UK leadership.
- Eurozone energy crisis has deepened as Russia has cut-off energy supplies amid western sanctions.
- The ECB is set to announce one more rate hike this week as HICP has been recorded at 9.1%.
The EUR/GBP pair has slipped to near the critical support of 0.8600 in the early Asian session. The asset is declining at a decent pace after facing barricades around Thursday’s high at 0.8670. The cross has surrendered the crucial support of 0.8610 and has triggered a bearish reversal.
Investors should brace for more downside in the asset as Liz Truss’s win in the Conservative Party leadership election has infused an adrenaline rush into the pound bulls. The sterling was facing the headwinds of soaring energy prices, runaway inflation rate, and political instability after the resignation of ex-UK Prime Minister Boris Johnson. Well, energy prices are still volatile, however, a novel UK leadership in the selection of Liz Truss as the next UK PM has trimmed the political risk.
As energy prices have turned extremely volatile amid Russia’s supply cuts, Britain's largest energy supplier Centrica Plc is in talks to secure billions of pounds in extra credit from banks to meet soaring collateral demands, as per Financial Times. Soaring energy prices are a major concern for the UK economy as it is highly responsible for accelerating inflationary pressures.
The Eurozone economy is also a victim of wild gyrates in energy prices. Russia has cut off the energy supply to Germany from the Baltic Sea after citing leakage issues. However, a follow-up statement by Kremlin, citing western sanctions responsible for supply cuts from Nord Stream 1 pipeline has deepened the energy crisis in the trading bloc. Winter is coming and demand for energy will accelerate sharply, which will weigh more pressure on energy stockpiles and eventually will increase energy rates.
Apart from the energy issues, investors are keeping an eye interest rate decision by the European Central Bank (ECB), which is due on Thursday. ECB President Christine Lagarde is expected to step up its interest rates by 50 basis points (bps). ECB’s preferred inflation measure, Harmonized Index of Consumer Prices (HICP) has crossed the whooping figure of 9% and it is required to get tamed sooner.
-
01:00
Colombia Consumer Price Index (MoM) came in at 1.02%, above forecasts (0.6%) in August
-
01:00
Colombia Consumer Price Index (YoY) came in at 10.84%, above forecasts (10.37%) in August
-
00:59
NZD/USD ignores downbeat options market signals to print three-day uptrend near 0.6100
NZD/USD picks up bids to 0.6105 as it extends Friday’s corrective pullback from the seven-week low to print a three-day uptrend during Tuesday’s Asian session. In doing so, the Loonie pair cheers a pullback in the US Dollar Index (DXY) while ignoring downbeat signals from the options market.
That said, the one-month NZD/USD risk reversal (RR), a difference between the call options and the put options, not only printed the first daily fall after a two-week rebound but also reversed Friday’s upbeat RR print while flashing a -0.040 figure for Monday. However, the US market holiday at the week’s start and the monetary policy meeting of the Reserve Bank of Australia (RBA) probe the Kiwi pair buyers of late.
Also read: Reserve Bank of Australia Preview: Is the central bank ready to slow the tightening pace?
Moving on, updates surrounding the US-China relations, the energy crisis in Europe and the ISM Services PMI for August, expected 55.5 versus 56.7 prior, will be crucial for the pair traders to watch for fresh impulse.
Given the full markets’ return, the NZD/USD prices may witness more volatility and hence traders should remain cautious.
Also read: ISM Services PMI Preview: High bar to help dollar bears pass through and take over
-
00:48
USD/CHF Price Analysis: Sellers need to break 0.9780 support for entry
- USD/CHF prints three-day downtrend to extend pullback from monthly peak.
- Three-week-old ascending support line holds the gate for bears.
- Downside break of 20-SMA, bearish MACD signals hint at further downside.
- Buyers need to cross immediate resistance line to retake control.
USD/CHF remains pressured near the intraday low of 0.9785 as bears approach the short-term key support line during Tuesday’s initial Asian session. In doing so, the Swiss currency (CHF) pair portrays a three-day downtrend while extending Friday’s pullback from the highest levels since mid-July.
That said, the quote’s latest weakness takes clues from the bearish MACD signals, downbeat RSI (14) and its break of the 20-SMA support, now resistance around 0.9810.
However, the sellers need validation from an upward slopping support line from early August, at 0.9780 by the press time, to welcome USD/CHF bears.
Following that, a downward trajectory towards the 38.2% Fibonacci retracement level of the pair’s upside from August 11 to September 01 can’t be ruled out.
Meanwhile, the 20-SMA hurdle surrounding 0.9810 precedes the immediate resistance line from the last Thursday, close to 0.9830 at the latest, to restrict the short-term recovery of the USD/CHF pair. Also acting as an upside filter is the monthly peak surrounding 0.9860.
Overall, USD/CHF remains on the bear’s radar but the 0.9780 could work as a trigger for the fresh selling.
USD/CHF: Four-hour chart
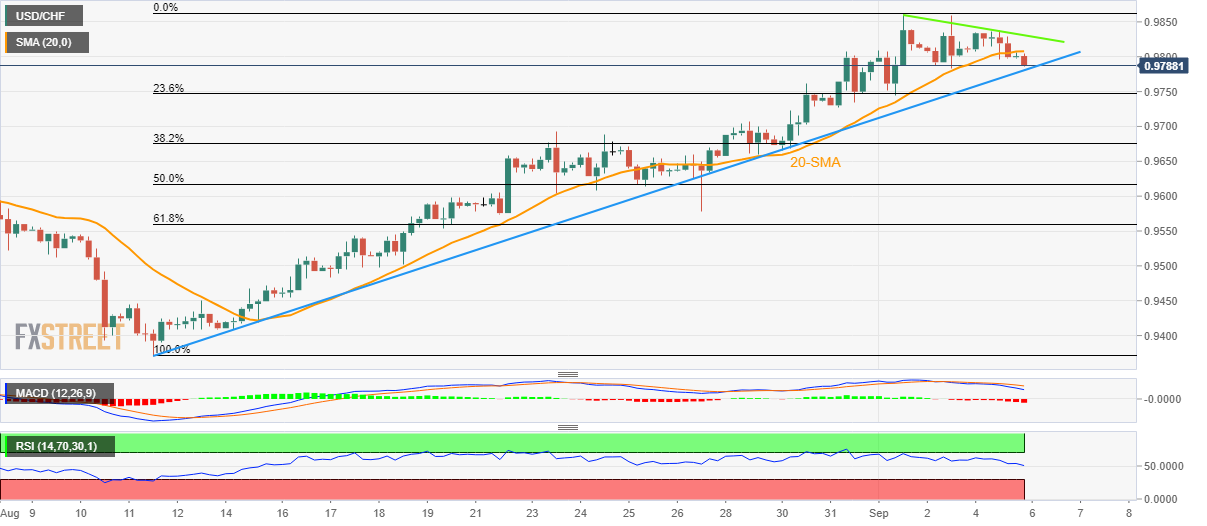
Trend: Further weakness expected
-
00:38
US dollar traders hitting the bid, 109.80 is key support
- The US dollar has been pressured in Asia ahead of the Tokyo open.
- Bears need to break below 4-hour support at around 109.80 with a firm bearish close.
The US dollar has since been faded from the highs which gave some relief to the forex space. At the time of writing, DXY is trading at 109.789. It's early days on Tuesday following holiday-thin markets and the US dollar has run into a cohort of bears hitting the bid which is taking the DXY down below 109.80.
The greenback hit a 20-year high against a basket of peers at the start of the week with the euro under pressure due to Russia halting gas supply down its main pipeline to Europe. The news has dented risk appetite in markets and sparked concerns over energy prices and growth, taking the single currency, which is a major component of the DXY index, down to blow 0.9880 this week so far.
Additionally, a drop in the Chinese yuan that struggles in the face of a resurgence of COVID-19 infections across the country as propped up the US dollar. However, Monday's fixing was 155 pips firmer than the Reuters estimate of 6.9153, marking the ninth straight trading day that the PBOC set firmer-than-expected official guidance in what is presumed to be an effort to rein in excess yuan weakness. The latest concerns stem from fresh lockdowns for China's southern tech hub of Shenzhen that started on Monday, the same time that the southwestern metropolis of Chengdu announced an extension of lockdown-related curbs.
Besides the European and China-induced risk-off pulses, the greenback continued to be driven higher on the coattails of Fed Chair Jerome Powell's recent remarks made at the Jackson Hole symposium in Wyoming, explaining that rates would need to be high "for some time" to combat stubbornly high inflation.
Markets will be looking to the US August ISM services PMI Tuesday and all ears to the ground for Fed speakers. The Services data's headline is expected at 55.4 vs. 56.7 in July. Traders will be taking note of the employment and prices paid data, which stood at 49.1 and 72.3 in July, respectively.
Fed speakers will also be key. Chair Powell, Vice-Chair Brainard, and Governor Waller will make public appearances to talk about the economic outlook and markets will be looking for them to build on Powell's Jackson Hole remarks.
''They will stress that inflation is still too high and bringing it down is priority number 1, which requires further rate hikes as well as keeping the policy rate high for "some time" once the terminal is reached,'' analysts at TD Securities said.
DXY technical analysis
The price is running into resistance but the bears need to get below the 4-hour support around the current levels if there are going to be prospects of a deeper correction for the sessions ahead. A break here opens risk towards 108.50 and then a 38.25 Fibonacci retracement below there near 108.10. The neckline of the harmonic pattern is located all the way down at 106.93.
-
00:36
AUD/JPY oversteps 95.60 ahead of RBA’s interest rate decision
- AUD/JPY has given a breakout of the 95.50-95.60 range on the expectation of a hawkish stance by the RBA.
- A fourth consecutive 50 bps rate hike by the RBA will step up the OCR to 2.35%.
- Lower spending by Japanese households indicates lower consumer confidence in the economy.
The AUD/JPY pair has witnessed an upside break of the rangebound auction formed in a narrow territory of 95.50-95.60 in the early Tokyo session. The asset is aiming to recapture the immediate hurdle of 96.00 as the Reserve Bank of Australia (RBA) is expected to continue its ‘hawkish’ stance on interest rates. This may deepen the RBA-Bank of Japan (BOJ) policy further.
As per the estimates, RBA Governor Philip Lowe will announce a fourth consecutive 50 basis points (bps) interest rate hike. This may step up the Official Cash Rate (OCR) to 2.35%. Price pressures in the Australian economy have not displayed any sign of exhaustion yet. Therefore, the RBA is bound to keep up the hiking momentum to combat the soaring inflation. The Australian inflation rate has been recorded at 6.1% for the second quarter of CY2022.
This week, investors will also focus on the Australian Gross Domestic Product (GDP) numbers. The Australian economy is expected to grow by 1% on a quarterly basis vs. 0.8% recorded in the prior quarter. Solid GDP data will strengthen the aussie bulls further.
On the Tokyo front, the release of the Overall Households Spending data has not much influenced the yen bulls. The economic data has landed at 3.4%, lower than the expectations of 4.2% and the prior release of 3.5%. This indicates households’ pessimism in the Japanese economy and also lower expenditure by the former may restrict the inflation rate.
-
00:32
Japan Labor Cash Earnings (YoY) registered at 1.8%, below expectations (2.5%) in July
-
00:30
Japan Overall Household Spending (YoY) came in at 3.4%, below expectations (4.2%) in July
-
00:27
AUD/NZD marches towards 1.1200 with eyes on RBA Interest Rate announcement
- AUD/NZD extends the previous day’s rebound from a fortnight low.
- Hawkish hopes from the RBA favor bulls ahead of the event.
- RBA is expected to announce 0.50% rate hike, focus will be on rate statement.
AUD/NZD defends bulls around 1.1160 ahead of the key Reserve Bank of Australia (RBA) monetary policy announcements during Tuesday’s Asian session. In doing so, the cross-currency pair takes clues from the hawkish hopes of the Aussie central bank, as well as the market’s cautious optimism.
While portraying the mood, the S&P 500 Futures rise 0.40% to 3,940 at the latest while the US 10-year Treasury yields seesaw around 3.20% after the softer end to the week’s trading, considering the week-start holiday in the US.
It should be noted that downbeat figures from Australia’s largest customer China and at home fail to push back the buyers amid expectations of stronger rate hikes by the RBA.
That said, China’s Caixin Services PMI dropped to 55.0 in August, versus 55.5 in prior readings. In doing so, the private activity gauge traced the major PMIs from the dragon nation that recently signaled pessimism for the world’s largest industrial player.
At home, the AiG Performance of Construction Index and S&P Global Services PMI for August improved in August while TD Securities Inflation dropped to -0.5% during the stated monthly, versus 1.2% prior. Further, Australia’s ANZ Job Advertisements improved to 2.0% compared to -1.1% prior whereas the Company Gross Operating Profits for the second quarter (Q2) rose past 4.0% market forecast to 7.0%, compared to 10.2% previous readings.
Elsewhere, the energy crisis in Europe and the escalating US-China tussles seem to have probed the AUD/NZD prices ahead of the RBA’s verdict. Market forecasts favor the fourth 0.50% rate hike, which is mostly priced in and may gain fewer accolades if announced.
Also read: Reserve Bank of Australia Preview: Is the central bank ready to slow the tightening pace?
Technical analysis
A one-week-old resistance line, around 1.1185 by the press time, challenges the AUD/NZD pair’s rebound from the 21-DMA support, close to 1.1130 at the latest.
-
00:11
USD/CAD Price Analysis: Justifies Monday’s Gravestone Doji to drop towards 1.3100
- USD/CAD takes offers to refresh intraday low after posting a bearish candlestick the previous day.
- RSI inaction around the overbought territory also favor the pullback moves.
- 10-DMA, three-week-old support line lure sellers during further downside.
- Bulls need to cross July’s top for conviction, 1.3200 guards immediate rebound.
USD/CAD returns to the bear’s table, after an effort to leave the place the previous day, as it drops to 1.3130 during Tuesday’s Asian session. In doing so, the Loonie pair justifies the bearish candlestick formation, as well as a pause in the further bullish bias, during the inaction session.
With this, the quote is likely declining towards the 1.3100 threshold. It should, however, be noted that the 10-DMA near 1.3070 could restrict the short-term downside of the pair afterward.
In a case where the USD/CAD bears dominate past 1.3070, the convergence of an upward sloping support line from August 11 and the 61.8% Fibonacci retracement of the July-August fall, near 1.3030, may limit the further declines ahead of the 1.3000 psychological magnet.
Alternatively, recovery moves need to cross the previous day’s top surrounding 1.3175 to reject the bearish candlestick formation.
Even so, the yearly peak marked in July, around 1.3225 appears a tough nut to crack for the USD/CAD bulls to crack to keep the reins.
USD/CAD: Daily chart
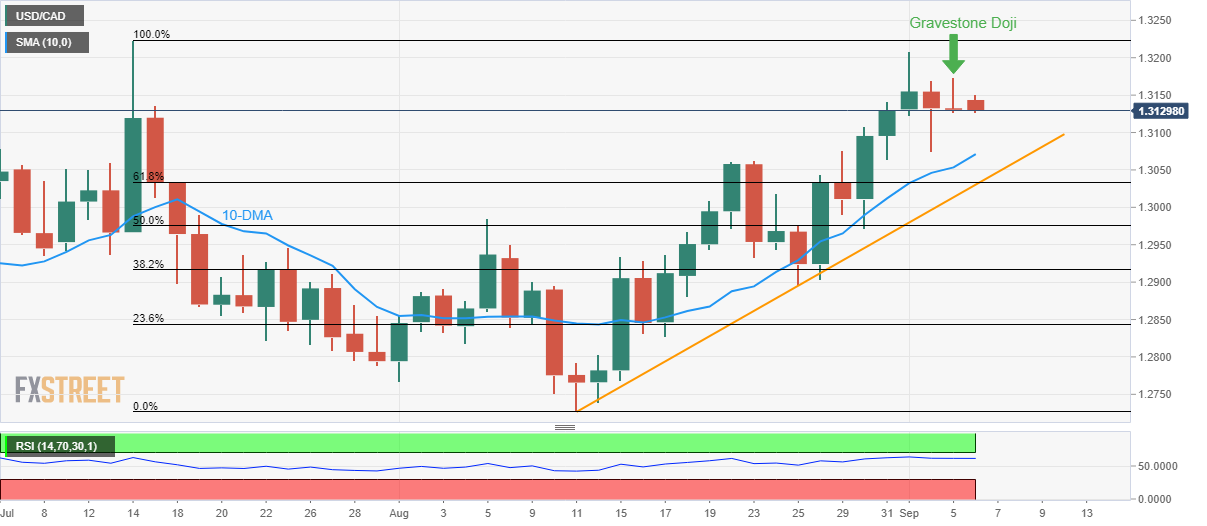
Trend: Further downside expected
-
00:01
United Kingdom BRC Like-For-Like Retail Sales (YoY) dipped from previous 1.6% to 0.5% in August
-