Notícias do Mercado
-
23:48
Silver Price News: XAG/USD treads water near $25.00 amid mixed options market signals
Silver price (XAG/USD) remains sidelined around $24.90-95 during the early hours of Friday, following a volatile day that allowed the bright metal to have a positive close despite an initial fall.
In doing so, the Silver price tracks mixed signals from the options markets as the latest data suggests a bullish bias of the market players even as the longer range figures keep teasing the XAG/USD bears.
That said, a one-month risk reversal (RR) of the Silver price, a gauge of the spread between the call and put options, printed a mild daily gain to +0.020 by the end of Thursday’s North American session. With that, the daily RR marked the first daily positive print in five.
However, the weekly RR braces for the second consecutive negative numbers, with the latest figures being -0.230, whereas the monthly options market signals also print the downbeat numbers of -0.635, versus the previous +2.660.
Not only the mixed options market signals but the cautious mood ahead of the US Core PCE Price Index for March, the Fed’s preferred inflation gauge, limit prod the Silver price.
Also read: Silver Price Analysis: XAG/USD falls but remains capped by the 20-DMA at $24.70
-
23:40
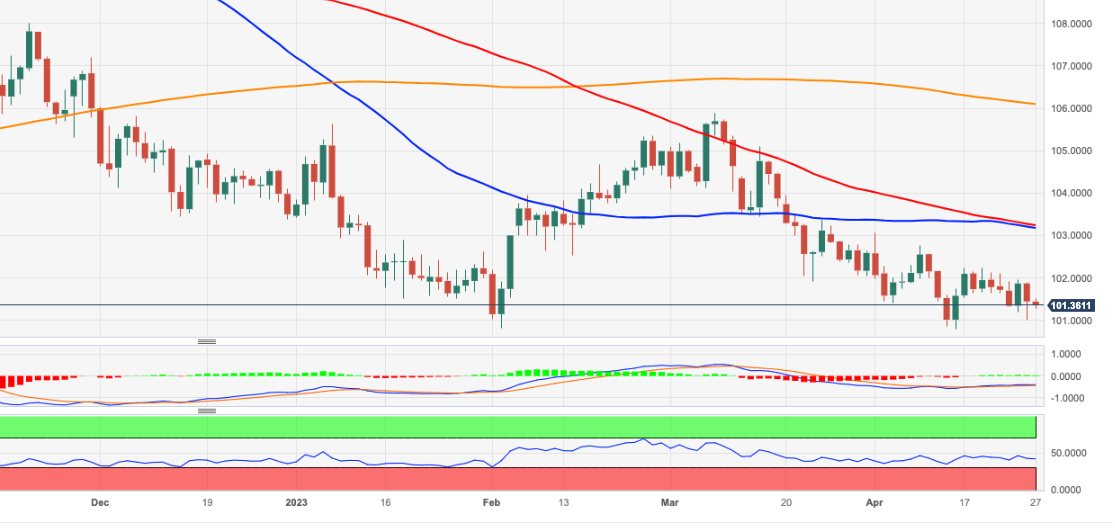
USD/CAD attempts recovery from below 1.3600 ahead of Canadian GDP and US PCE Price Index
- USD/CAD has shown some recovery after building a base below 1.3600.
- S&P500 ended Thursday with immense gains amid upbeat quarterly earnings from US tech stocks, portraying a risk-on mood.
- Monthly Canadian GDP (Feb) might show a growth rate of 0.2% vs. 0.5% released earlier.
The USD/CAD pair has made efforts for a rebound after building a base around 1.3590 in the Asian session. The Loonie asset has shown a recovery move, however, the US Dollar Index (DXY) is still in corrective action and has not shown any sign of recovery yet.
The USD Index is gradually correcting after a strong upside move on Thursday to near 101.80. A significant decline in United States Gross Domestic Product (GDP) data has propelled fears of economic slowdown. The US GDP (Q1) data landed at 1.1% while the street was anticipating a decline in the pace of growth rate to 2.0% from the former expansion of 2.6%.
According to the US GDP report, utilization of entire inventory by businesses amid fears of economic slowdown indicates that firms are losing confidence in the US economy due to higher interest rates from the Federal Reserve (Fed).
S&P500 ended Thursday’s session with significant gains as investors focused on upbeat quarterly performance from US tech-savvy stocks and ignored recession fears, portraying a solid risk appetite of the market participants. Tech stocks beat earnings estimates and revenue guidance, indicating that consumer spending is extremely solid.
Going forward, the US Dollar will dance to the tunes of core Personal Consumption Expenditure (PCE) Price Index data (March). As per the consensus, monthly data is expected to sustain at a pace of 0.3% while annual data would soften to 4.5% from the former release of 4.6%.
The Canadian Dollar is expected to show sheer volatility amid the release of the GDP data. Monthly GDP data (Feb) might show a growth rate of 0.2% vs. 0.5% released earlier.
-
23:37
GBP/USD Price Analysis: Cable buyers approach 1.2520 hurdle amid three-day uptrend
- GBP/USD grinds higher after two-day uptrend, defends bounce off 100-SMA.
- Firmer RSI (14), sustained trading beyond the key SMAs allow buyers to aim for three-week-old horizontal resistance.
- Fortnight-old ascending trend line adds to the downside support.
GBP/USD gradually marches towards the key upside hurdle as it grinds higher following a two-day winning streak, floating near 1.2500 during the initial hours of Friday’s Asian session.
In doing so, the Cable pair defends the previous day’s rebound from the 100-bar Simple Moving Average (SMA) while also justifying the firmer Relative Strength Index (RSI), placed at 14, not overbought.
With this, the quote’s further upside towards a horizontal area comprising multiple levels marked since April 04, around 1.2505-20, can’t be ruled out. However, the pair’s additional run-up will depend upon how well it can stay beyond the stated hurdle as the Year-To-Date (YTD) peak surrounding 1.2550 could challenge GBP/USD buyers afterward.
In a case where the Cable pair remains firmer past 1.2550, a run-up towards the May 2022 peak of around 1.2665 becomes appealing.
Meanwhile, pullback moves need to break the 100-SMA support of 1.2440 to convince intraday sellers.
Following that, a fortnight-old ascending support line and the 200-SMA, respectively near 1.2410 and 1.2360, may prod the GBP/USD bears.
It’s worth noting, however, that the GBP/USD pair’s weakness past 1.2360 will make it vulnerable to visiting the monthly low of around 1.2275.
GBP/USD: Four-hour chart
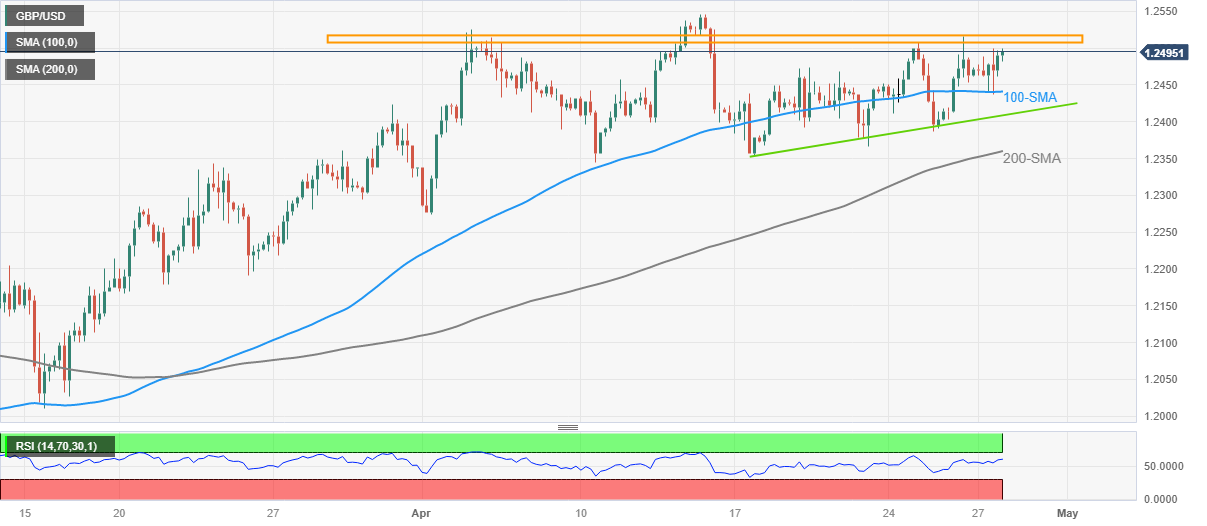
Trend: Further upside expected
-
23:20
Gold Price Forecast: XAU/USD bears eye downside breakout of tight structure
- Gold price bearish while below $2,000 and the 61.8% around $1,992.
- Despite poor data, US Dollar stronger, making gold more expensive for international buyers.
Gold price was ending flat on the day in choppy trade while the US Dollar and bond yields climbed a touch following the weaker-than-expected first-quarter Gross Domestic Product
At the time of writing, the Gold price is trading around $1,987.80 and has traveled between a low of $1,974.11 and $2,003.41 following data that showed inflation was stronger than anticipated helping the US 10-yr Treasury note to rally 8bp to 3.53%, bearish for gold since it offers no interest. The US two-year note was last seen paying 4.080%, up 14.4 basis points.
The US Dollar was also stronger, making gold more expensive for international buyers. The ICE dollar index was last seen up 0.06 points to 101.53.
In the data, the United States on Thursday reported its GDP rising by 1.1% in the first quarter, the third-straight quarterly rise but under the consensus estimate for a 2% rise. However, the core inflation measure lifted 4.9%.
Meanwhile, the Federal Reserve´s policy committee is expected to raise interest rates by 25 basis points when its two-meeting ends next Wednesday. ´´WIRP suggests nearly 80% odds of 25 bp hike at the May 2-3 meeting, down from 90% at the start of this week and back to the 80% at the start of last week. We continue to believe that a 25 bp hike next week is a done deal,´´ analysts at Brown Brothers Harriman explained.
´´Between the May 2-3 and June 13-14 meetings, the Fed will have digested two more job reports, two CPI/PPI reports, and one retail sales report. At this point, a pause in June might just be the most likely outcome but it really will depend on how all that data come in,´´ the analysts explained.
Meanwhile, analysts at TD Securities argued that ´´discretionary traders are still sitting on the sidelines, which suggests cuts pricing is still not feeding through to interest. In the near term, weaker longs still remain vulnerable, but we don't expect the first selling meaningful program to kick in until prices break $1,964 in gold.´´
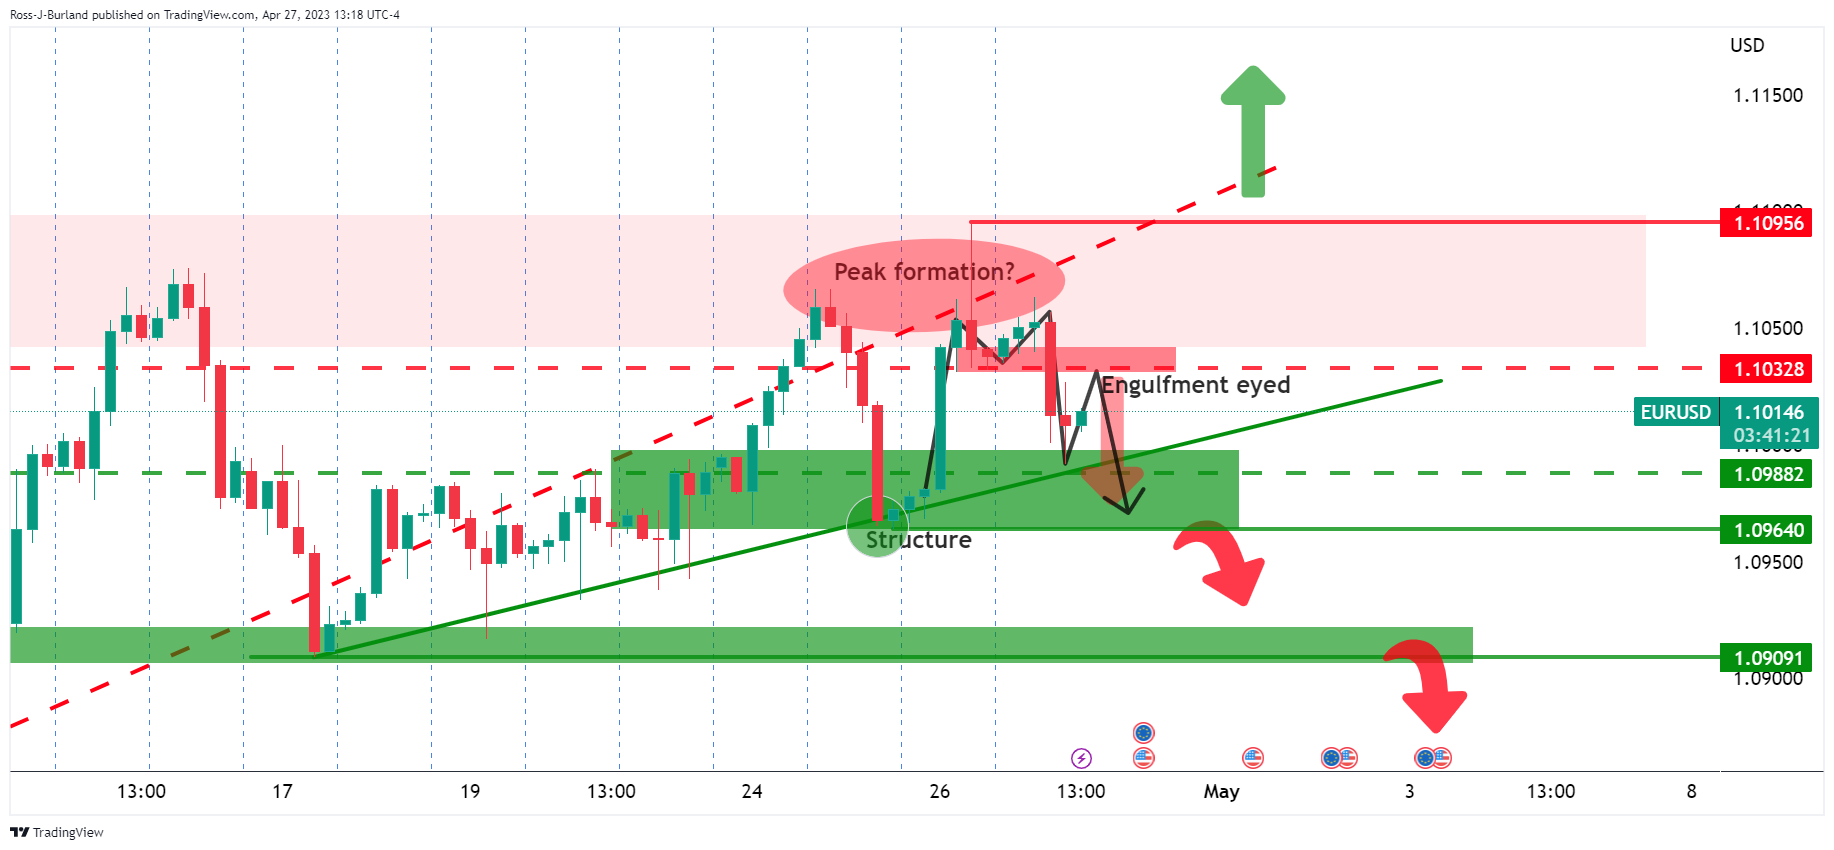
Gold technical analysis
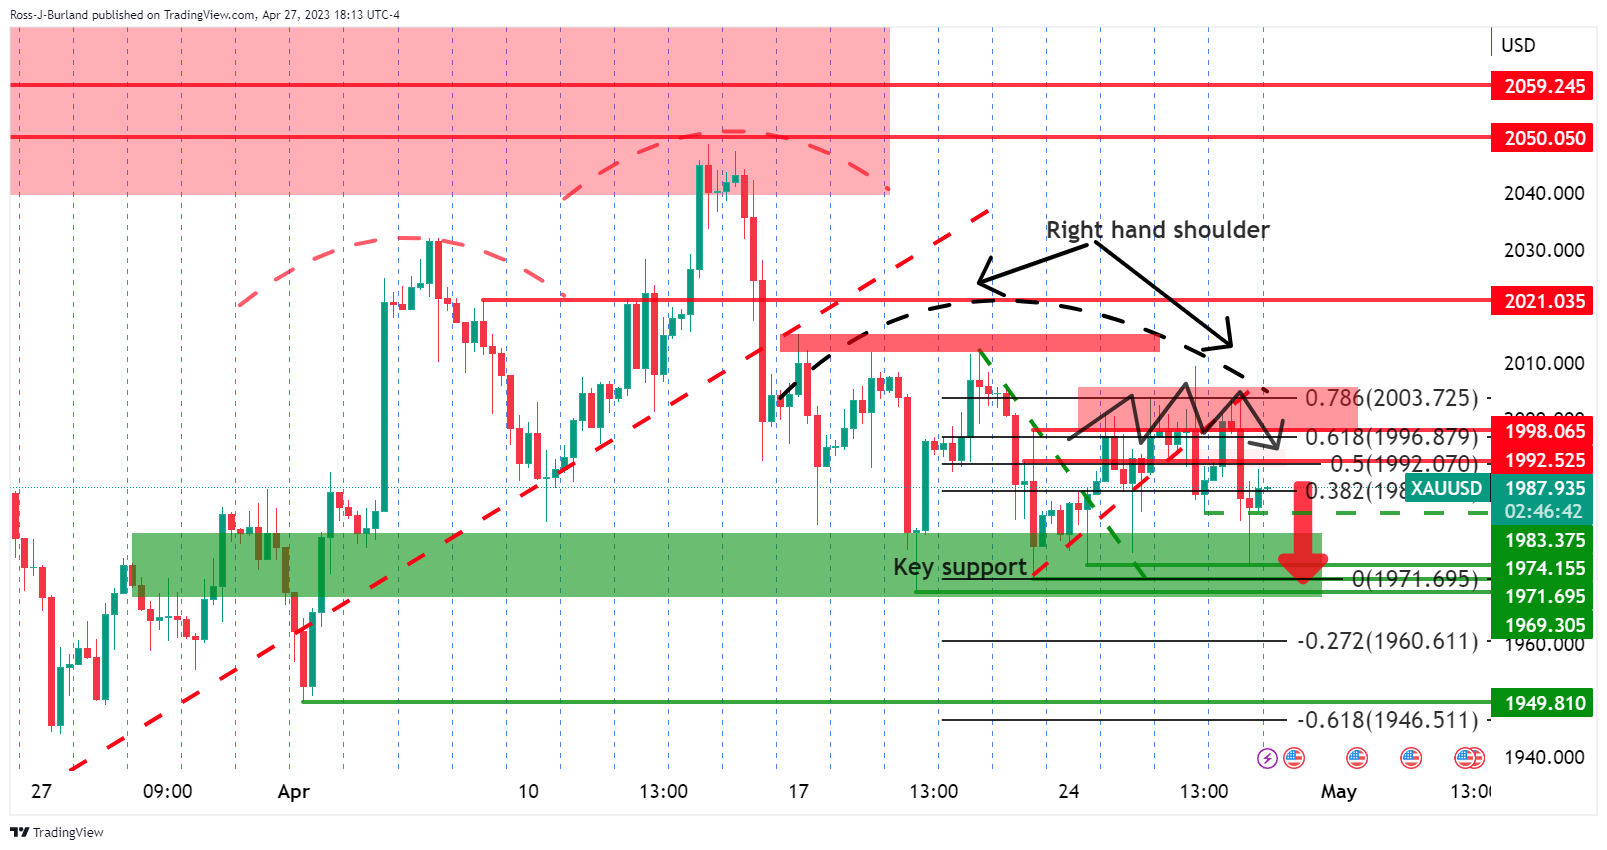
Gold price has been topping out on a number of attempts to stay above $2,000 but bears keep showing up. We now have a potential peak formation here on the 4-hour chart within the right-hand shoulder. Zooming in, we have another head and shoulders:
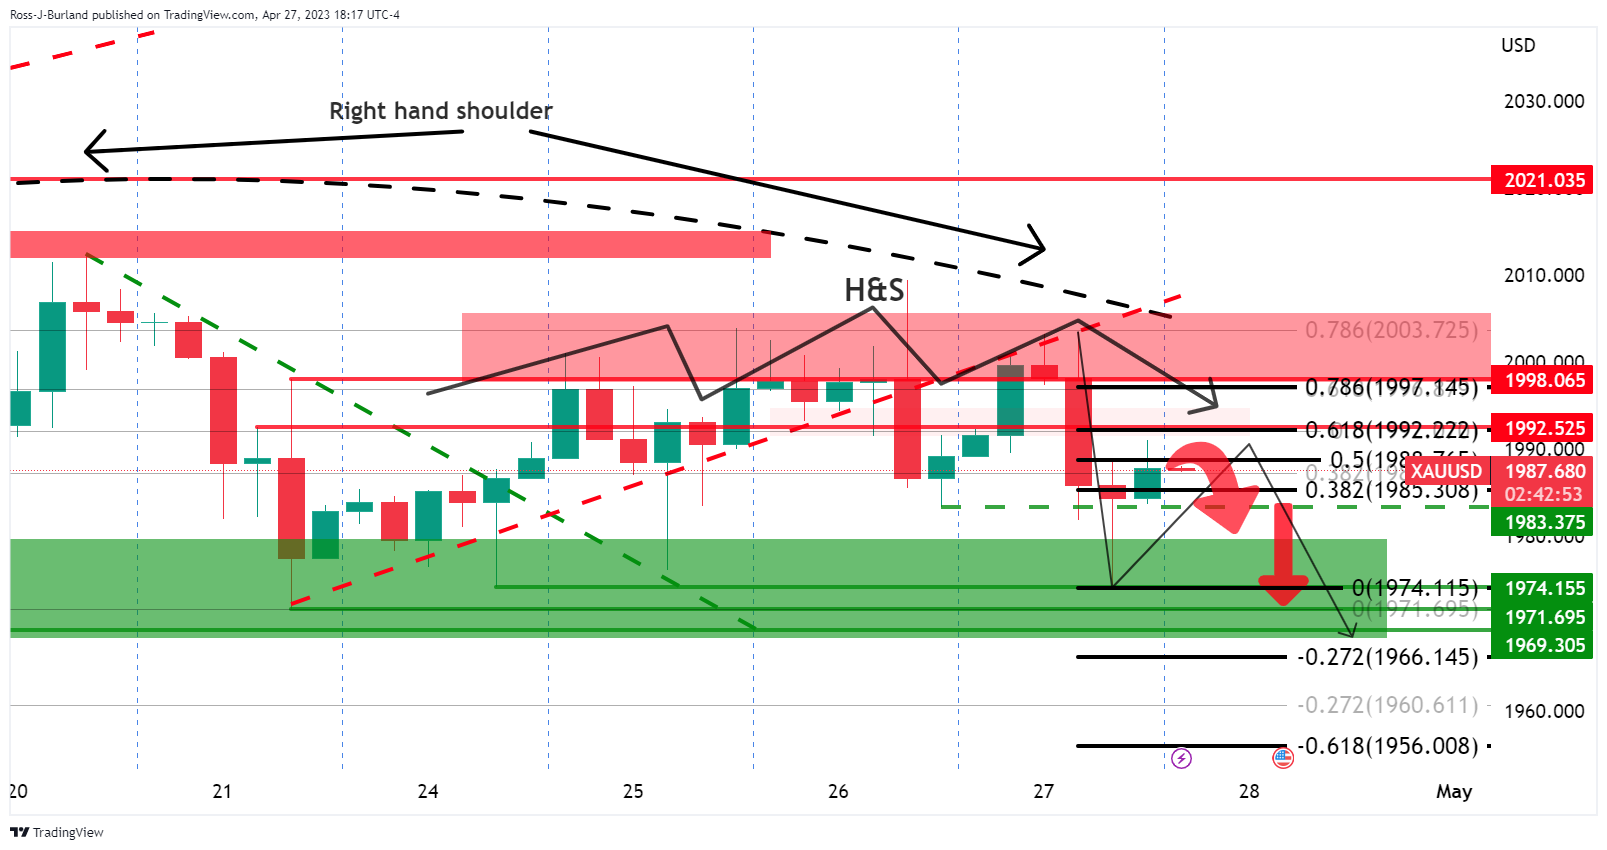
The bias is very much bearish while below $2,000 and the 61.8% around $1,992.
-
23:09
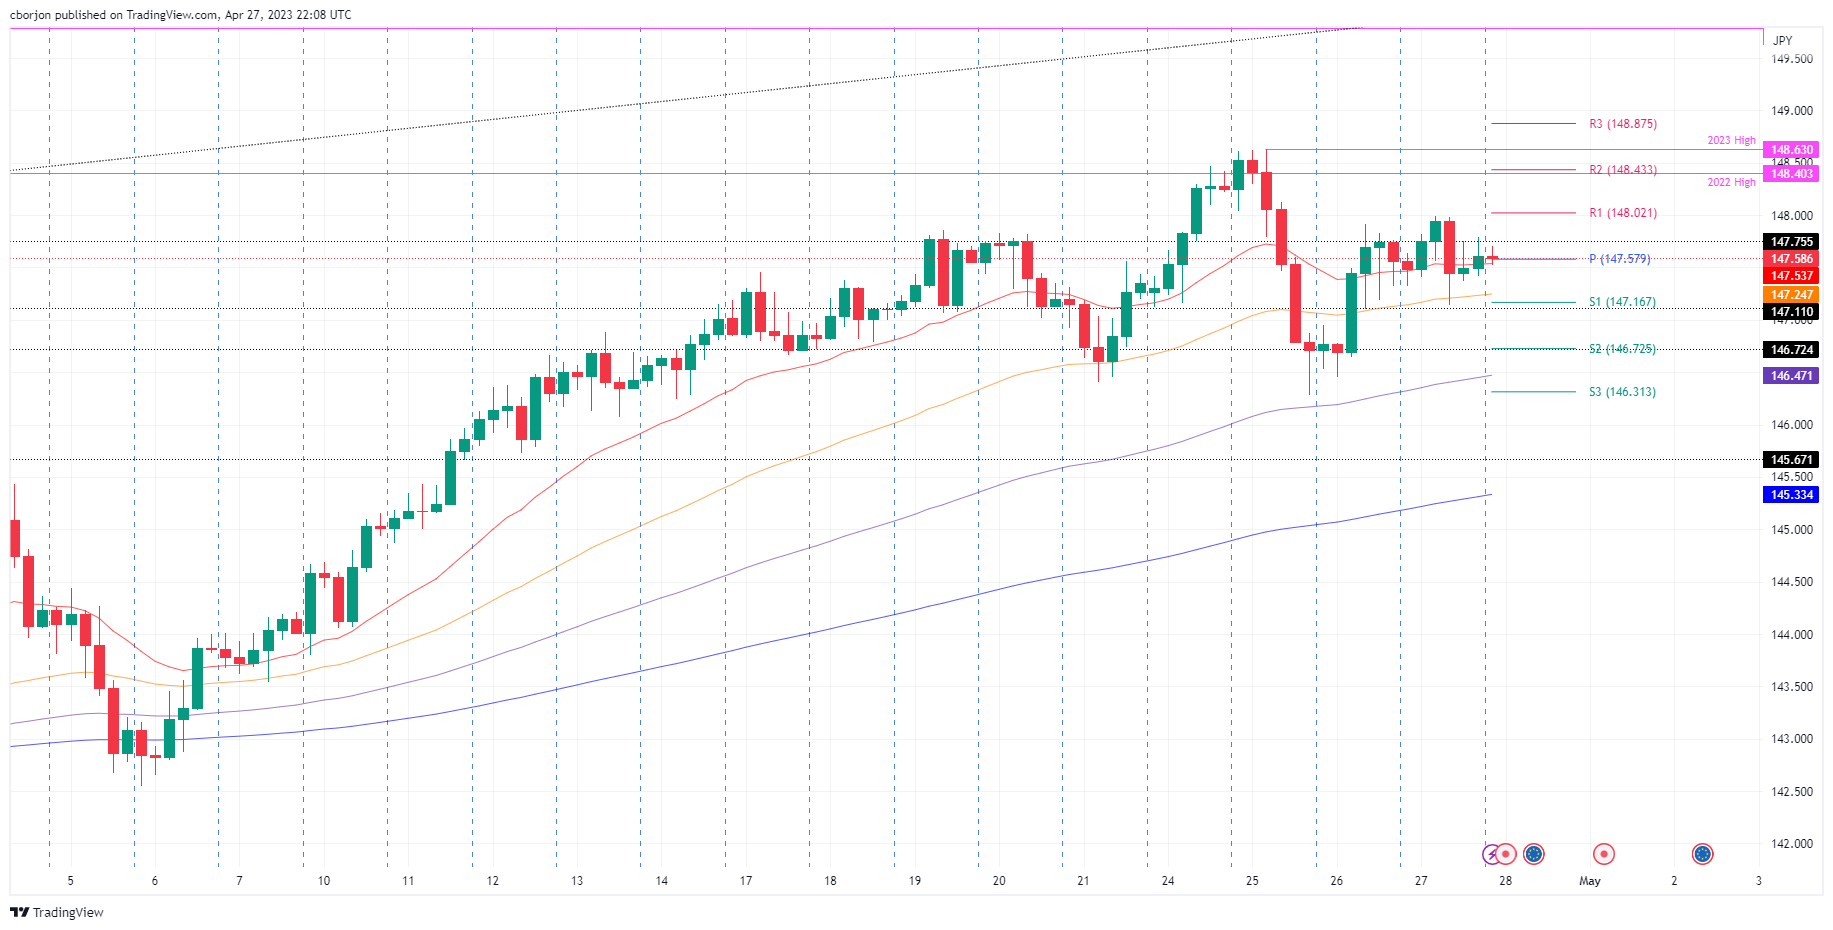
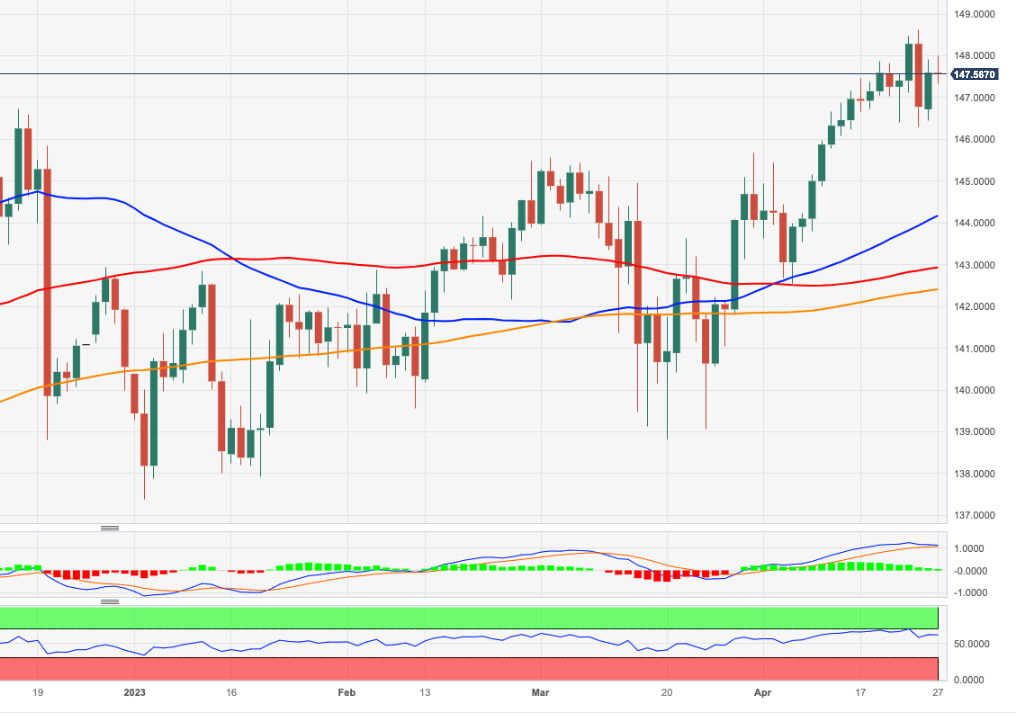
EUR/JPY Price Analysis: Holds steady at around 147.60s as a doji emerges
- EUR/JPY is set to finish the week with minimal gains of 0.18%.
- EUR/JPY Price Analysis: Trades sideways, with buyers unable to crack 148.00, which, once broken, could pave the way for further upside.
The EUR/JPY prints back-to-back positive sessions but stays at around 147.62, almost unchanged, as Thursday’s price action formed a doji. Once the EUR/JPY reached a multi-year high at around 148.63, it was followed by a mean reversion move, ahead of the BoJ’s monetary policy decision, later in the day. At the time of writing, the EUR/JPY is trading at 147.64, gains 0.03%, as the Asian session starts.
EUR/JPY Price Action
From a daily chart perspective, price action looks headed upward. However, sellers stepped in as the RSI indicator exited from overbought conditions, dragging the EUR/JPY’s price toward its weekly low of 146.28. Since then, the EUR/JPY reclaimed 147.00, though the pair is trading sideways within the 147.10-90s area.
Near-term, the EUR/JPY 4-hour chart suggests the pair is consolidating at around the 50 and 20-EMAs. After dropping to its weekly low, the EUR/JPY recovered some ground and aimed toward 147.49, clearing the 50 and 20-EMA. Since then, the EUR/JPY has faced solid resistance at around 147.90-147.99, unable to reclaim 148.00. If EUR/JPY cannot crack 148.00, expect further downside, with the pair testing support at the confluence of the 50-EMA and the S1 pivot at 147.16-24, followed by the S2 pivot at 146.72. additional downside risks are expected at 146.47, followed by the S3 pivot at146.31.
EUR/JPY 4-Hour Chart
-
23:08
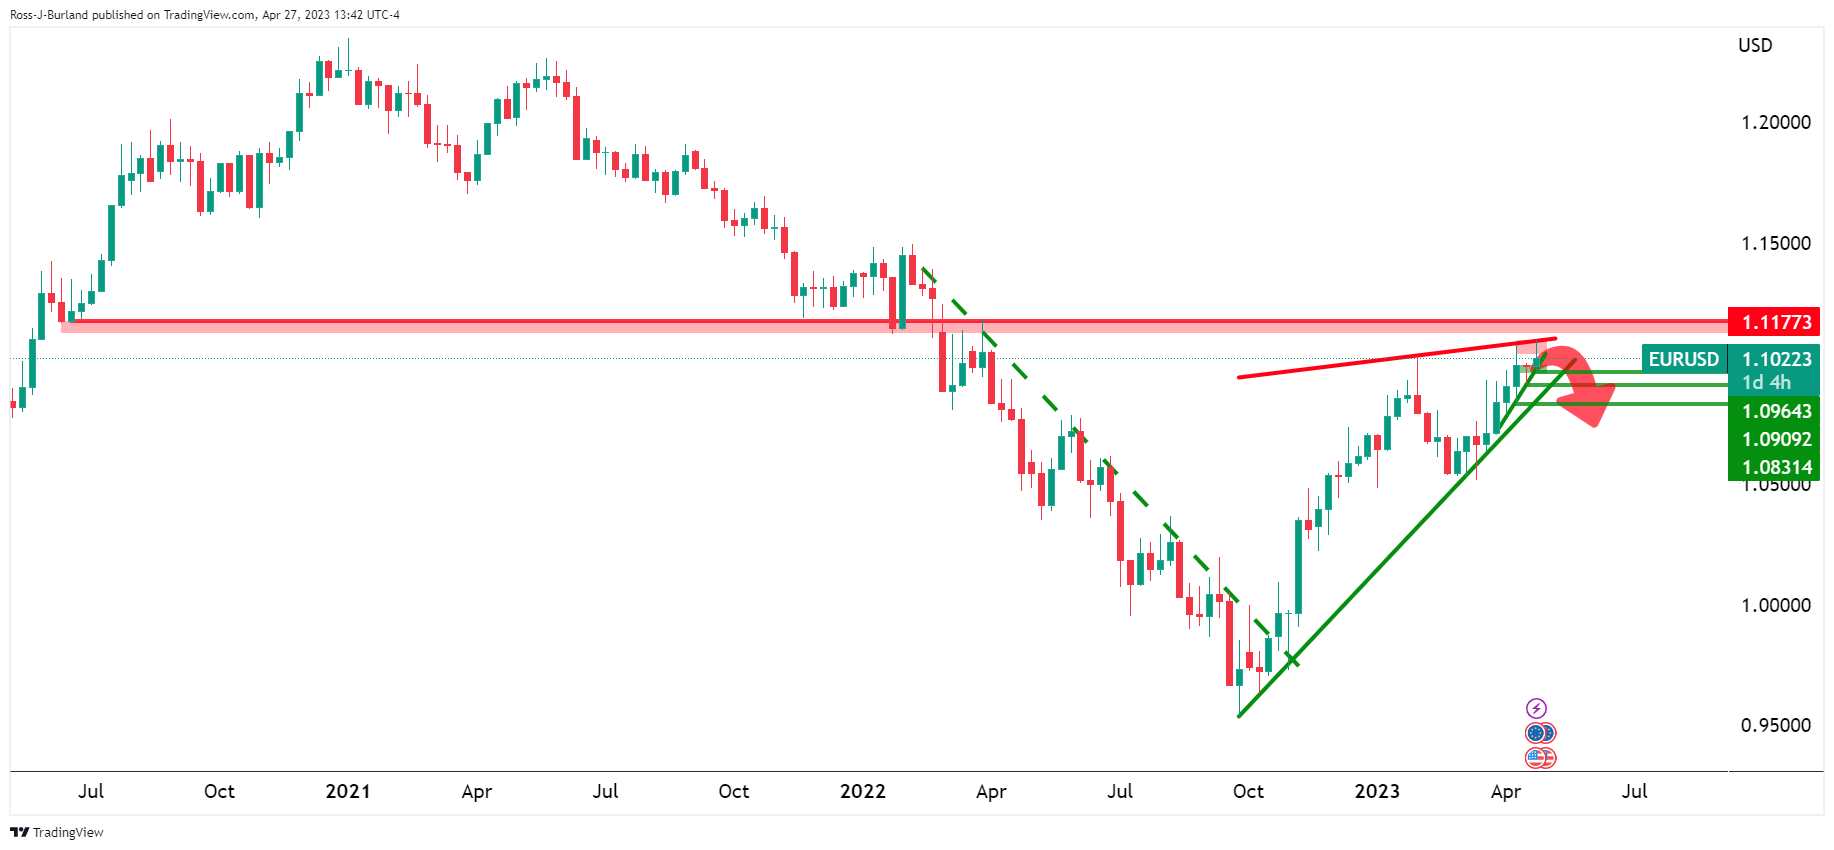
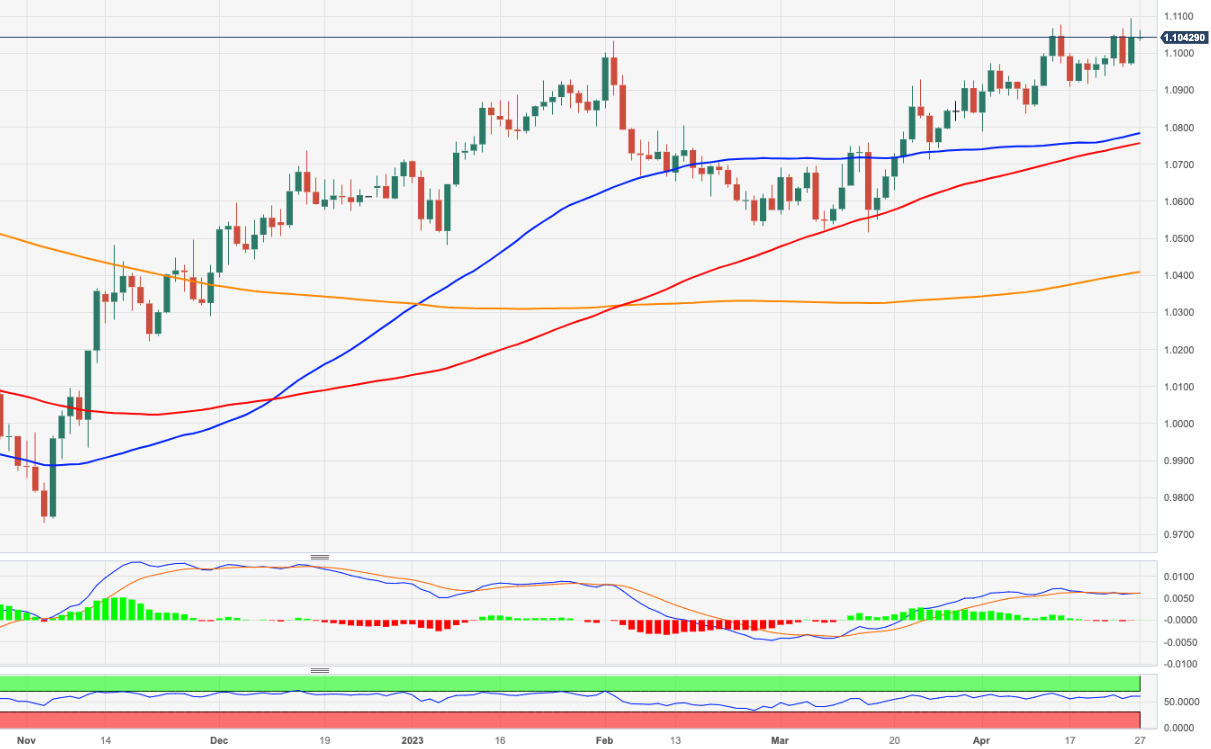
EUR/USD stays defensive above 1.1000 as Eurozone GDP, Fed’s favorite inflation loom
- EUR/USD struggles to defend late Thursday’s corrective bounce after a volatile day.
- US Real GDP came in softer but details bolstered hawkish Fed concerns and allowed US Dollar to initially rise.
- Risk catalysts, key growth and inflation data can offer another active day ahead of next week’s ECB, Fed meeting.
EUR/USD seesaws around 1.1030 after a whippy day that initially convinced bears before paring some of the losses during the American session. While the US data could be held responsible for Thursday’s volatility, the Euro pair’s latest inaction is logical ahead of the Eurozone Gross Domestic Product (GDP) for the first quarter (Q1), as well as the US Core Personal Consumption Expenditure (PCE) Price Index details for March.
On Thursday, the first readings of the US Gross Domestic Product (GDP) for the first quarter (Q1) of 2023, also known as Advance readings, marked mixed outcomes. That said, the headline US GDP Annualized eased to 1.1% from 2.0% expected and 2.6% prior but the GDP Price Index inched higher to 4.0% on an annualized basis from 3.9% prior and 3.8% market consensus. Further, the Personal Consumption Expenditure (PCE) Prices for Q1 rallied to 4.2% from 3.7% in previous readouts whereas the Core PCE figures also crossed 4.8% market forecasts and 4.4% prior with 4.9% mark for the said period.
With this, a stronger-than-expected increase in the inflation component of the GDP renewed hawkish concerns about the Federal Reserve (Fed) and helped the US Dollar to pick up bids after the release. However, the downbeat prints of headline GDP allowed markets to turn optimistic and favored the EUR/USD pair buyers.
It’s worth noting that the banking fallout risks also prod the Euro bulls previously while the mixed EU data defended the buyers. That said, US banking fallout fears regain momentum amid reports that the First Republic Bank (FRB) plans to sell half its loan book to fill a $100B deposit flight gap. That said, Eurozone Consumer Confidence improved for April but Business Climate eased for the said month.
Amid these plays, Wall Street closed positive and yields rose but the US Dollar retreated during the later part of the day and ended Thursday with mild gains.
Looking forward, the first readings of the Q1 GDP growth figures from the old continent will be crucial to watch ahead of the US Core PCE Price Index for March, the Fed’s preferred inflation gauge. These figures are likely to print softer data but any positive surprise will be helpful to determine the next week’s monetary policy decision from the European Central Bank (ECB) and the Federal Reserve (Fed) monetary policy meeting
Also read: US Core PCE Preview: Why this is a lose-lose situation for the US Dollar
Technical analysis
EUR/USD buyers appear to run out of steam as they battle with an upward-sloping resistance line from early February, close to 1.1075 by the press time.
-
23:08
AUD/USD faces barricades above 0.6630 as focus shifts to RBA monetary policy
- AUD/USD has failed to sustain above 0.6630 as investors are shifting their focus toward the RBA policy.
- S&P500 settled Thursday’s session with bumper gains as upbeat performance from US tech stocks outweighed fears of slowdown.
- US businesses unwind their inventories and offset solid consumer spending amid dismal economic outlook.
The AUD/USD pair has sensed mild selling pressure after failing to sustain above the crucial resistance of 0.6630 in the early Asian session. The Aussie asset is expected to remain on the tenterhooks as investors are shifting their focus toward the interest rate decision by the Reserve Bank of Australia (RBA), which is scheduled for Tuesday.
S&P500 settled Thursday’s session with bumper gains as upbeat quarterly earnings performance from United States technology stocks outweighed fears of economic slowdown. After solid performances from Google, Microsoft, and Meta Platforms, Amazon reported higher-than-expected earnings with strong revenue guidance, which indicates that consumer spending would remain upbeat ahead. Overall cheerful market mood has strengthened the appeal for risk-sensitive assets.
The US Dollar Index (DXY) has corrected to near 101.48 after an upside move to near 101.80 posts the release of downbeat United States Gross Domestic Product (GDP) data. Scrutiny of the US GDP (Q1) report showed that businesses unwind their inventories and offset solid consumer spending amid a dismal economic outlook as fears of a recession are deepening due to higher interest rates from the Federal Reserve (Fed).
Meanwhile, weekly jobless claims dropped to 230K from the consensus of 248K for the week ending April 21, which indicates that the labor market conditions are still solid.
On the Australian Dollar front, consistently softening Australian inflation would allow the Reserve Bank of Australia (RBA) to keep the interest rate policy unchanged on Tuesday. RBA Governor Philip Lowe would keep rates steady at 3.60%.
-
23:03
New Zealand ANZ – Roy Morgan Consumer Confidence climbed from previous 77.7 to 79.3 in April
-
22:14
NZD/USD bulls have stepped in trying to correct with eyes on 0.62s
- NZD/USD bulls in the market eyeing continued correction.
- Still bearish while below weekly trendline resistance.
NZD/USD has been trying to make its way higher on Thursday and is up by some 0.5% into the close in the New York FX session. The pair traveled from a low of 0.6114 to a high of 0.6161 on the day in what was choppy trading.
´´The Kiwi is a touch higher this morning after a whippy night that saw it recover, then slide, then bounce through mixed US data, and a rebound in equities and commodities,´´ analysts at ANZ Bank explained.
´´Yesterday’s comments by the PM suggesting we’re in for a no-frills Budget, with the estimated $9-14.5bn cyclone rebuild costs met by a mix of savings, reprioritization, and debt may have cooled the nerves of those worried about a debt blowout,´´ the analysts said. ´´But the current account deficit remains a key concern, and may weigh on NZD sentiment for some time.´´
´´AUD price action has been a key driver (by correlation) for the Kiwi, and on that score, we are mindful of the RBA decision next week. We expect a pause, but if we are surprised, it’ll only be one way, and that’s a hike (which could boost the AUD),´´ their note concluded.
Meanwhile, the Reserve Bank of New Zealand is around the corner. The analysts at ANZ Bank said that they forecast a follow-up 25bp OCR hike at the May MPS, taking the OCR to 5.5%, ´´which appears to be the Committee’s ‘happy place’, where they can ‘watch, worry and wait’.´´
In US data, economic growth in the first quarter of this year was weaker than what markets had been built up to expect. The advance estimate of Q1 Gross Domestic Product increased just 1.1%, well below the 1.9% forecast.
NZD/USD technical analysis

NZD/USD is on the front side of the downtrend still and submerged below horizontal resistance as well as per the weekly chart above.
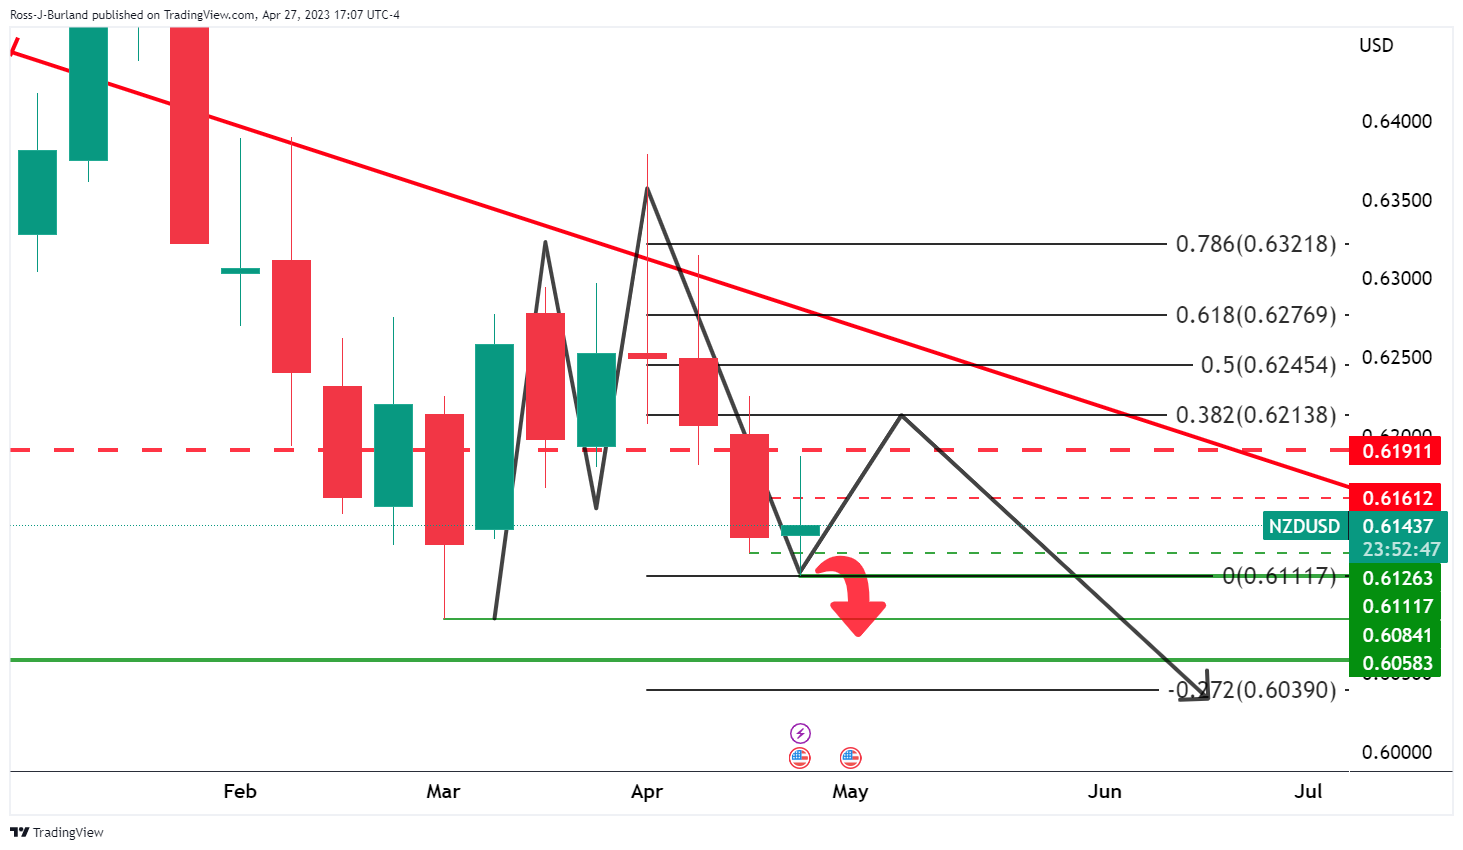
The 38.2% Fibonacci comes in near 0.6215 for the bulls to target.
-
22:07
USD/JPY rallies to a two-day high above 134.00 amidst mixed US data ahead of BoJ’s decision
- USD/JPY pierced the 134.00 figure, though it still hovers below the former.
- US economic growth slowed in Q1, while core inflation soared nearly 5%.
- BoJ expected to hold rates and keep the YCC intact amidst Ueda’s first decision.
The USD?JPY snaps two days of losses after falling to two-week lows around 133.01 and rises toward the 133.90s area as the New York session wanes. Mixed US economic data propelled the USD/JPY towards daily highs above 134.00, ahead of the BoJ’s monetary policy decision. The USD/JPY is trading at 133.96 and gains 0.23%.
USD/JPY edge higher ahead of the Bank of Japan’s policy decision
Wall Street finished with substantial gains. The US Bureau of Economic Analysis (BEA) revealed that the US economy slowed to 1.1% in the first quarter of 2023, below estimates of 2%. Although the reading remained positive, it trailed the 2.6% rise in Q4 2022; we should remember that the Federal Reserve (Fed) projections estimate growth at 0.4%.
The same report showed that inflation in the first three months of 2023 rose by 4.9% QoQ, exceeded estimates of 4.8%, and smashed the 4.4% reported in Q4 2022. Given the backdrop, odds for an interest rate increase recovered from 72.1% registered on Wednesday to 87.4% as of writing.
As a reaction, the USD/JPY edged higher, printing a two-day high of 134.19, before retracing some gains. The US 10-year Treasury bond yield, which correlates closely to the USD/JPY pair, climbs 7.5 bps, at 3.524%, a tailwind for the major.
On the Japanese front, its economic agenda will be busy, with the main stage being the Bank of Japan (BoJ) monetary decision, the first for the new Governor, Kazuo Ueda. Analysts estimate some tweak to the message about Covid-19, though they’re not estimating a change in the Yield Curve Control (YCC).
The BoJ will update its economic projections, with investors estimating upward revisions in inflation. However, economic growth is estimated to take a hit amidst the ongoing global economic slowdown.
Further data will be revealed, with Job / Applicants Ration for March, alongside the Tokyo CPI and core CPI readings. Additionally, Industrial Production and Retail Sales would keep USD/JPY entertained ahead of the US inflation data release on Friday.
USD/JPY Technical Levels
-
21:33
Forex Today: Market sentiment improves; Ueda's first BOJ meeting
The Bank of Japan will announce its decision at Ueda's first meeting; market participants will pay close attention to the details. In addition, Australia will release its report on wholesale inflation, and Japan will publish several reports. Later in the day, the focus will shift to the Eurozone, where GDP and inflation figures will be released.
Here is what you need to know on Friday, May 5:
On Thursday, Wall Street had its best day in a week, with the Dow Jones gaining 1.57% and the Nasdaq 2.43% boosted by earnings reports. Meta Platforms surprised and jumped almost 14% on Thursday. More earnings are coming on Friday from companies such as Exxon Mobil, Chevron, PetroChina, China Construction Bank, Sony and Mercedes-Benz.
The improvement in market sentiment favored currencies like AUD, NZD and CAD, while weakening CHF, JPY and the US Dollar. US yields rose sharply, driven more by risk sentiment than by monetary policy expectations.
US real GDP increased by 1.1% during the first quarter, below the 2% of markets consensus. On the positive side, Jobless Claims dropped more than expected. Pending Home Sales tumbled 5.2% in March. On Friday, the US will report Fed’s preferred inflation measure: the Core Personal Consumption Expenditures Price Index.
We continue to forecast that the U.S. economy to slip into recession, which we expect will be of moderate severity, in the second half of the year.
The Japanese Yen was among the worst performers on Thursday amid higher yields. USD/JPY rose to 134.15 and then pulled back.
The Bank of Japan (BoJ) will announce its monetary policy decision, the first under Kazuo Ueda. No change is expected; however, comments or signs about the future path can have a significant impact. The BoJ will release new macro forecasts. Japan will report Unemployment, Tokyo inflation, Retail Trade, Industrial Production and Housing Starts.
Bank of Japan Preview: New governor but old policy
EUR/USD fell modestly on Thursday, closing above 1.1000. The trend is up but gains remain limited by 1.1050. On Friday, Spain, France and Germany will release inflation figures (April preliminary) and also Eurozone growth numbers are due. Those reports are critical ahead of next week’s European Central Bank (ECB) meeting, which is seen rising rates by 25 basis points, but a 50 bps is not ruled out.
GBP/USD rose for the second day, staying below the recent high and slightly below 1.2500. The Pound outperformed on Thursday with EUR/GBP having the biggest daily loss in a month, falling from 0.8875 to 0.8825.
USD/CAD had the worst day in two weeks, pulling back under 1.3600 on risk sentiment and steady crude oil prices. Canada will report monthly GDP growth, with the economy expected to have expanded at a 0.2% rate in February and flash estimates for March are expected to show slowing activity.
NZD/USD advanced, finding resistance around the 200-day Simple Moving Average at 0.6160. AUD/USD also recovered after being able to defend 0.6600. Both pairs are moving with a bearish bias. Australia will report Q1 Producer Price Index (PPI) on Friday.
The Central Bank of the Republic of Turkey (CBRT) kept the policy rate unchanged at 8.5%, as expected, ahead of May 14 elections. USD/TRY posted a new record high close above 19.43.
The Colombian peso is the worst performer so far this week as political risk picked up in Colombia. President Petro ousted a moderate finance minister, replacing him with a key leftist ally, raising concerns about the economic policies from now on. USD/COP rose to 4,670, the highest level in four weeks. If the depreciation of the Peso continues it could force the central bank to raise rates further.
Crude oil prices recovered moderately after days of sharp declines, closing the gap created after the OPEC+ production cut announcement at the beginning of April. WTI surpassed $75.00 but failed to hold above. Crude remains under pressure, even amid larger inventory draws, reflecting concerns about the global economic outlook.
Gold and Silver continued to move sideways, ending unchanged at $1,987 and $24.90, respectively.
Like this article? Help us with some feedback by answering this survey:
Rate this content -
21:00
USD/CHF Price Analysis: Bulls trying to take back control, building up for short squeeze to 0.9000 eyed
- USD/CHF bulls are in the market and broke the 4-hour structure at 0.8926.
- Meanwhile, a bearish 61.8% Fibonacci retracement aligns with the potential support structure.
USD/CHF is higher by some 0.4% and has rallied from a low of 0.8900 to a high of 0.8976 in a market that is trying to break higher in a short squeeze. The following illustrates the corrective bias for the meanwhile within a bearish trending market.
USD/CHF weekly charts
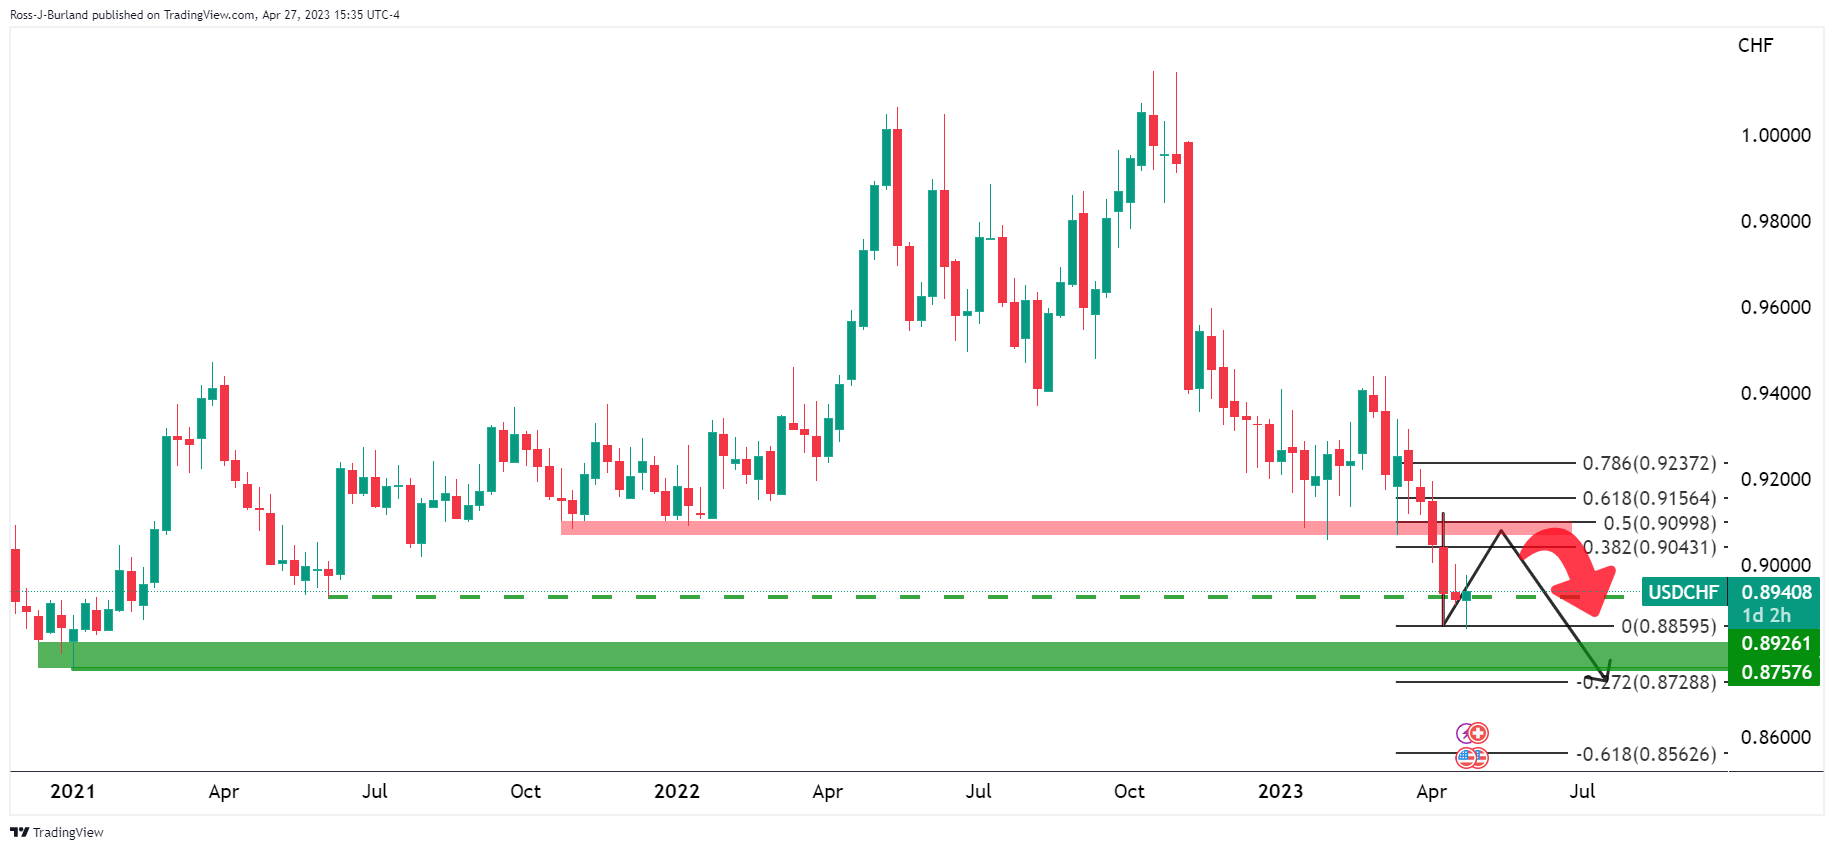
USD/CHF is offered and on the way to test the monthly support. However, the price is stalling and a correction could be on the cards for the coming days. A 50% mean reversion comes in at 0.9100.
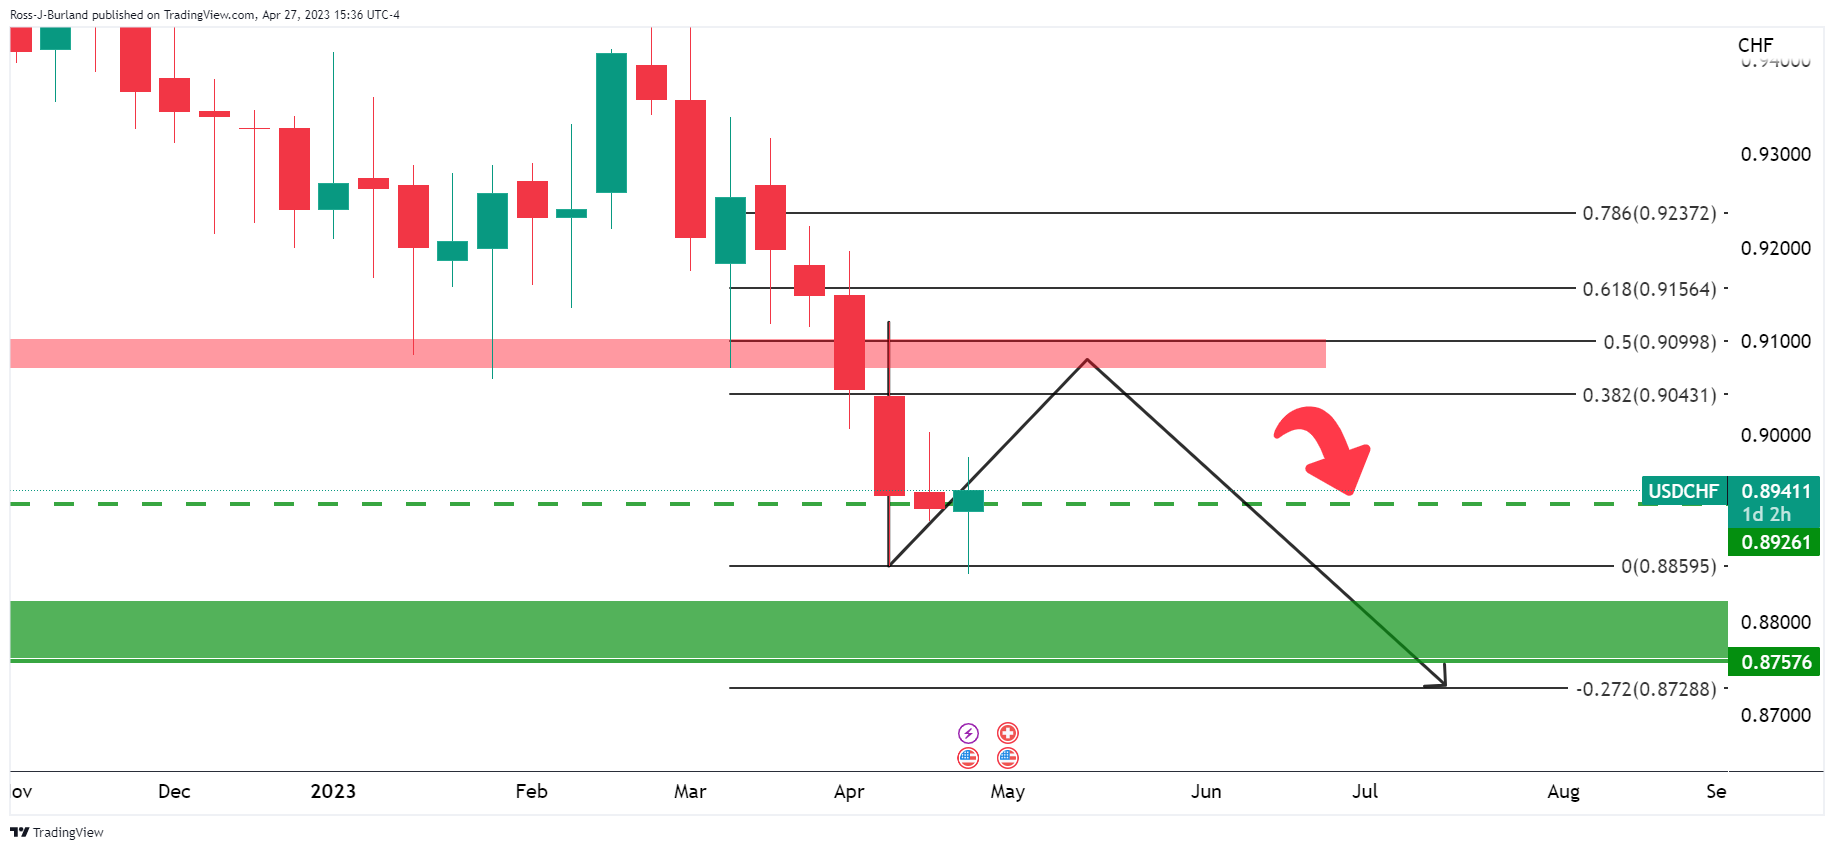
USD/CHF daily chart
However, we are yet to see a bullish schematic playout on the daily chart with the price submerged below the trendline resistance without closing on the back side of it yet. The horizontal structure is located at 0.9003.
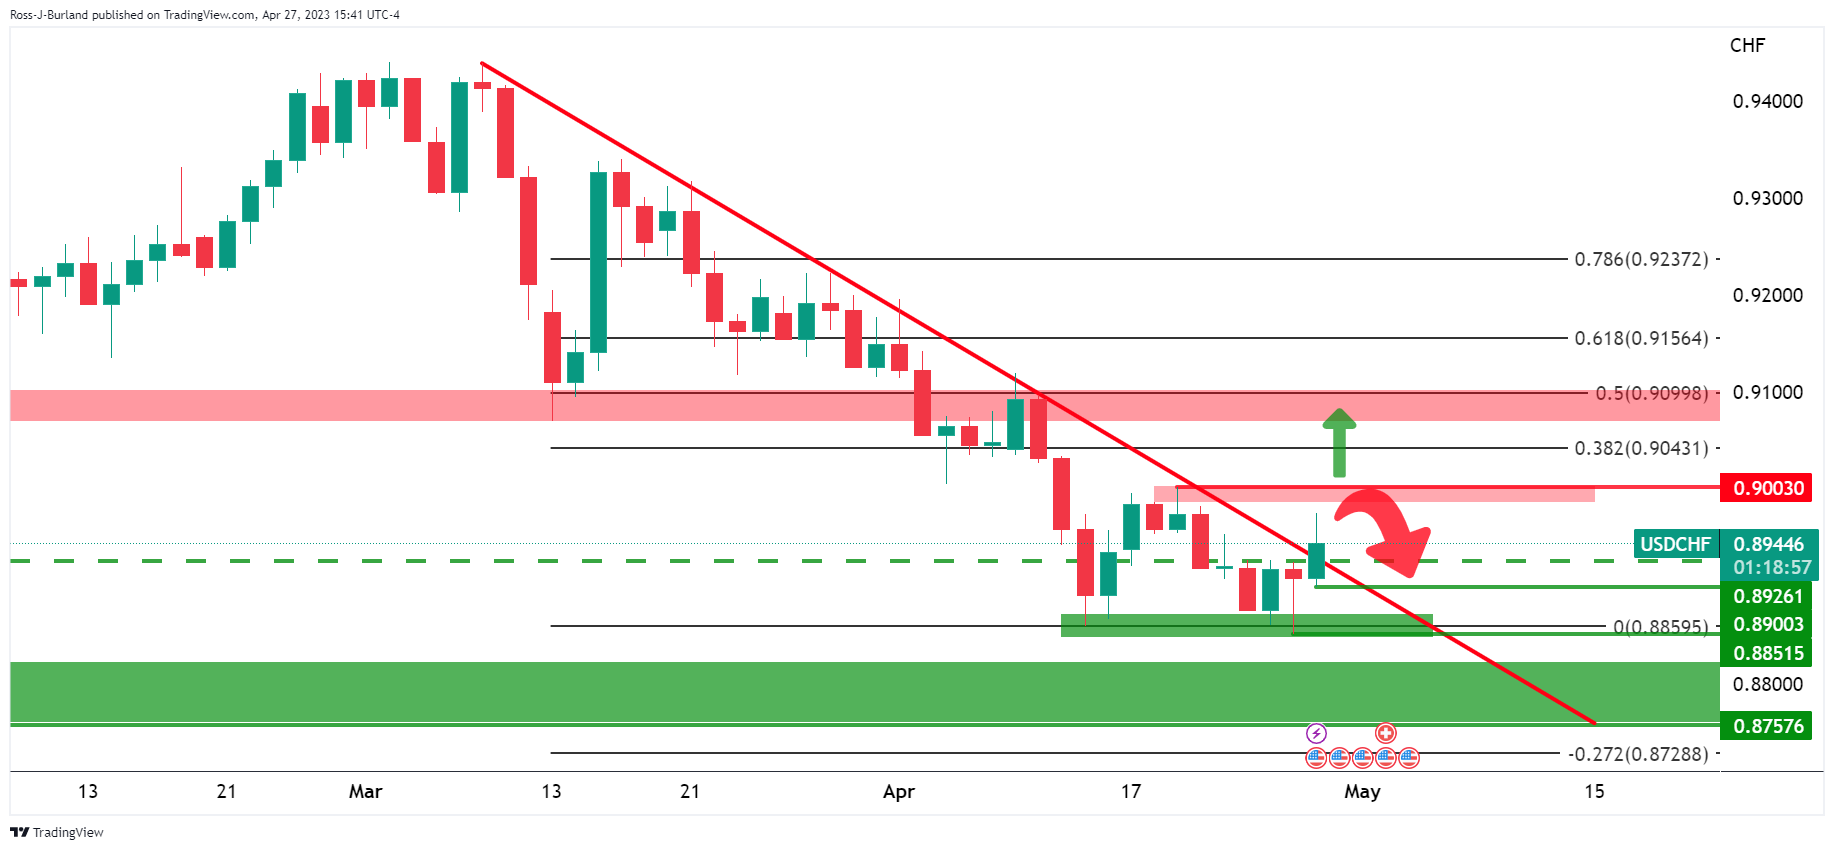
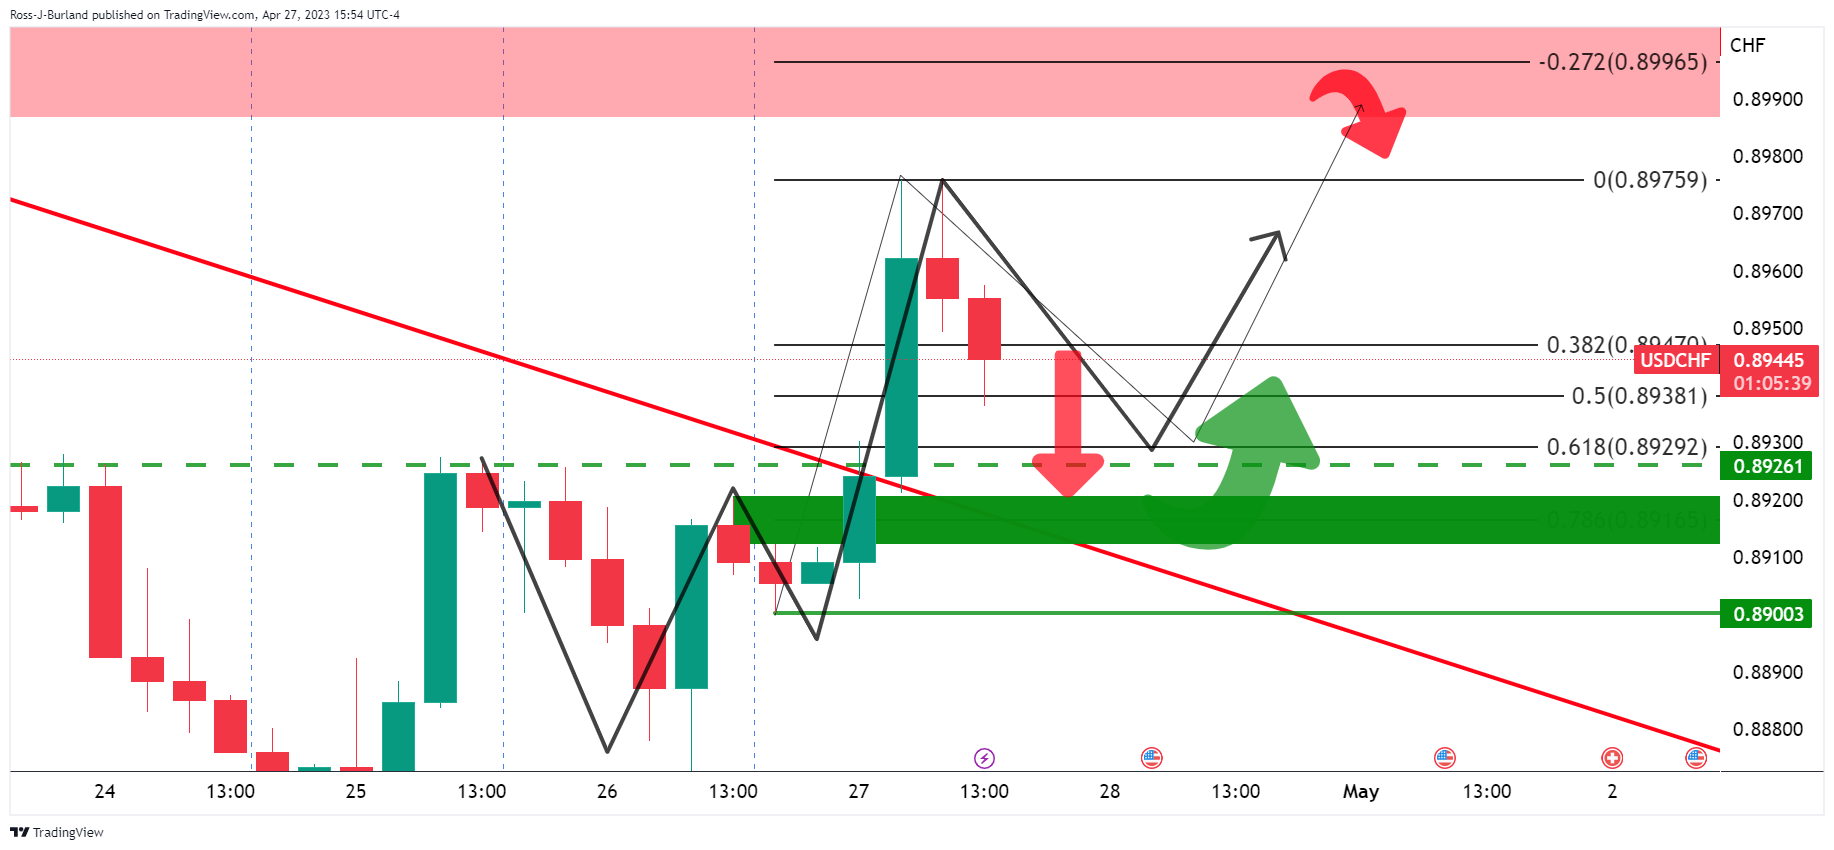
USD/CHF H4 charts
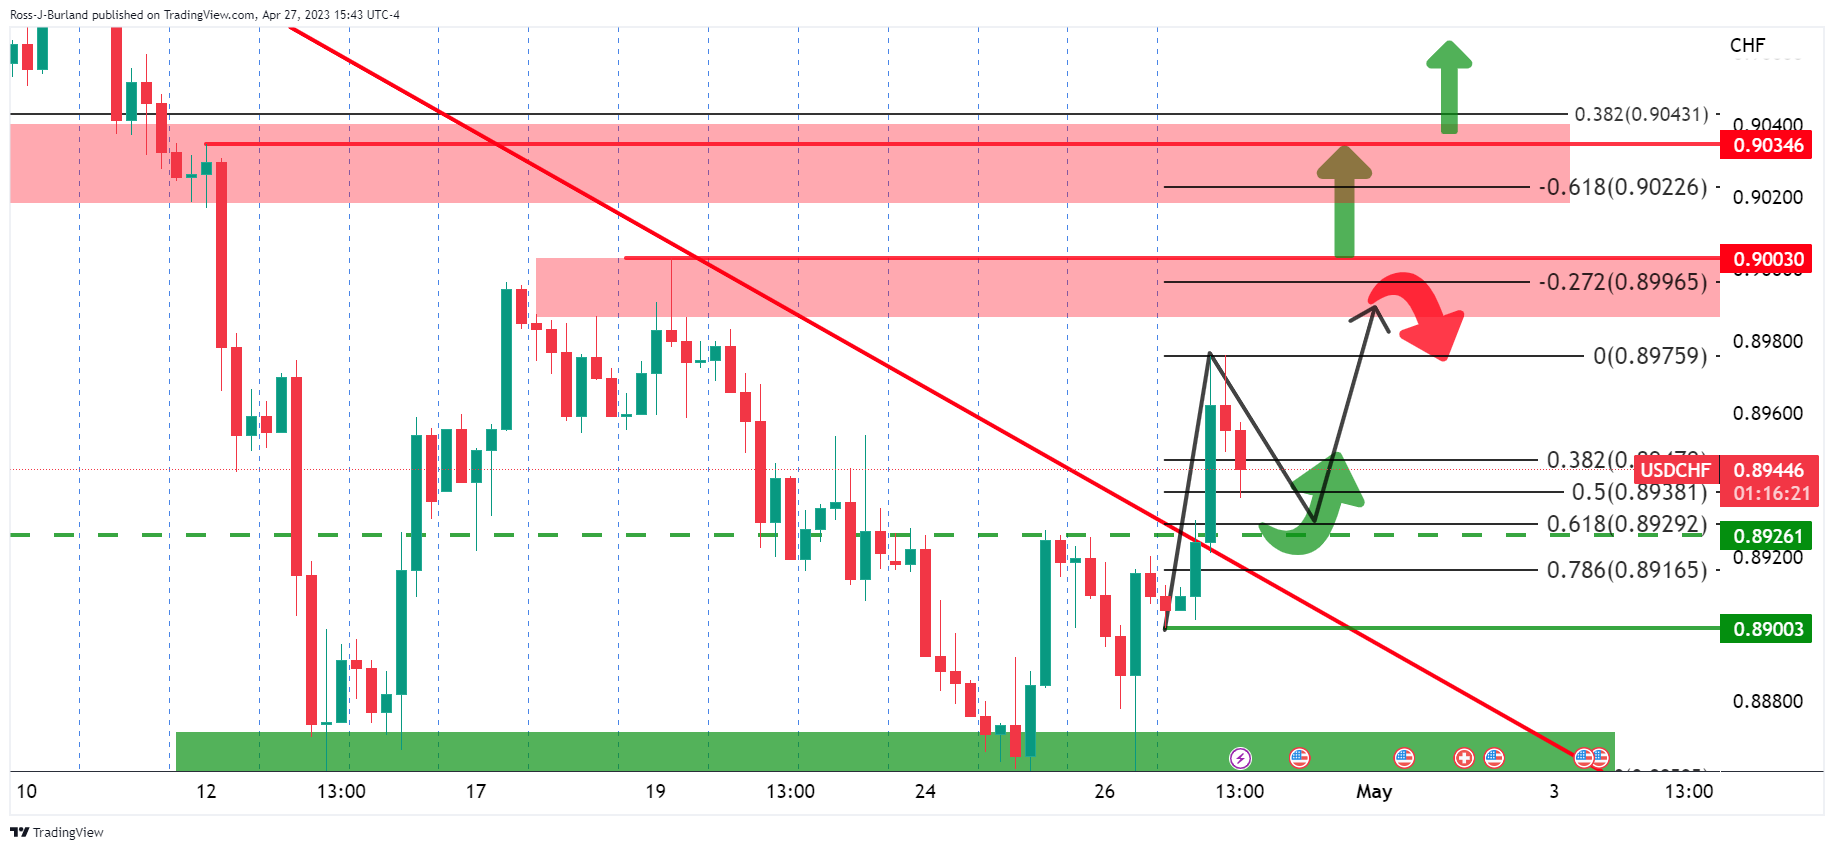
Then again, the bulls are in the market and broke the 4-hour structure at 0.8926. So long as the bulls commit, then a pullback into test the structure could be met with demand and a subsequent bullish structure will be put in. A 61.8% Fibonacci retracement aligns with the potential support structure. Below there, we have the 78.6% Fibo aligning with the neckline of the W-formation:
-
20:21
WTI bears taking control below the gap on demand concerns
- WTI bears are in the market below the gap.
- Demand concerns are driving the oil price lower.
West Texas Intermediate, WTI, is up by some 0.6% and has traveled within a range of between $75.24 and $74.08 so far. Following two days of losses that cut prices to the lowest since late March, the black gold is back on the mend in a mini short squeeze.
WTi has closed the gap that was put on the charts after OPEC+'s surprise 1.1-million barrel per day production cut. However, demand fears played in on Thursday after the United States reported its first-quarter Gross Domestic Product rose less than expected.
Real Gross Domestic Product advanced at a slower 1.1% QoQ AR clip in the first quarter with activity posting its first below-trend expansion since the second quarter of 2022, analysts at TD Securities noted. ´´First-quarter growth fell below consensus expectations at 1.9%, but it was largely in line with our 1.2% forecast. Under a context of rising uncertainty, we continue to look for activity to advance at a below-trend pace through the end of the year, with a recession likely starting in Q4 2023.´´
´´Still,´´ the analysts explained, ´´strong consumer-price data continue to underscore the stickiness of underlying inflation.´´
Nevertheless, the weak economic data continues to raise demand concerns and a recession in the United States could spark demand worries in other OECD nations. Meanwhile, the OPEC+ cuts will take effect on May 1. Today OPEC Secretary-General Haitham al-Ghais said the group was not looking to manage prices but is focusing on market fundamentals, according to reports.
Next up will be a weekly Baker Hughes rig-count report tomorrow at 1 pm ET.
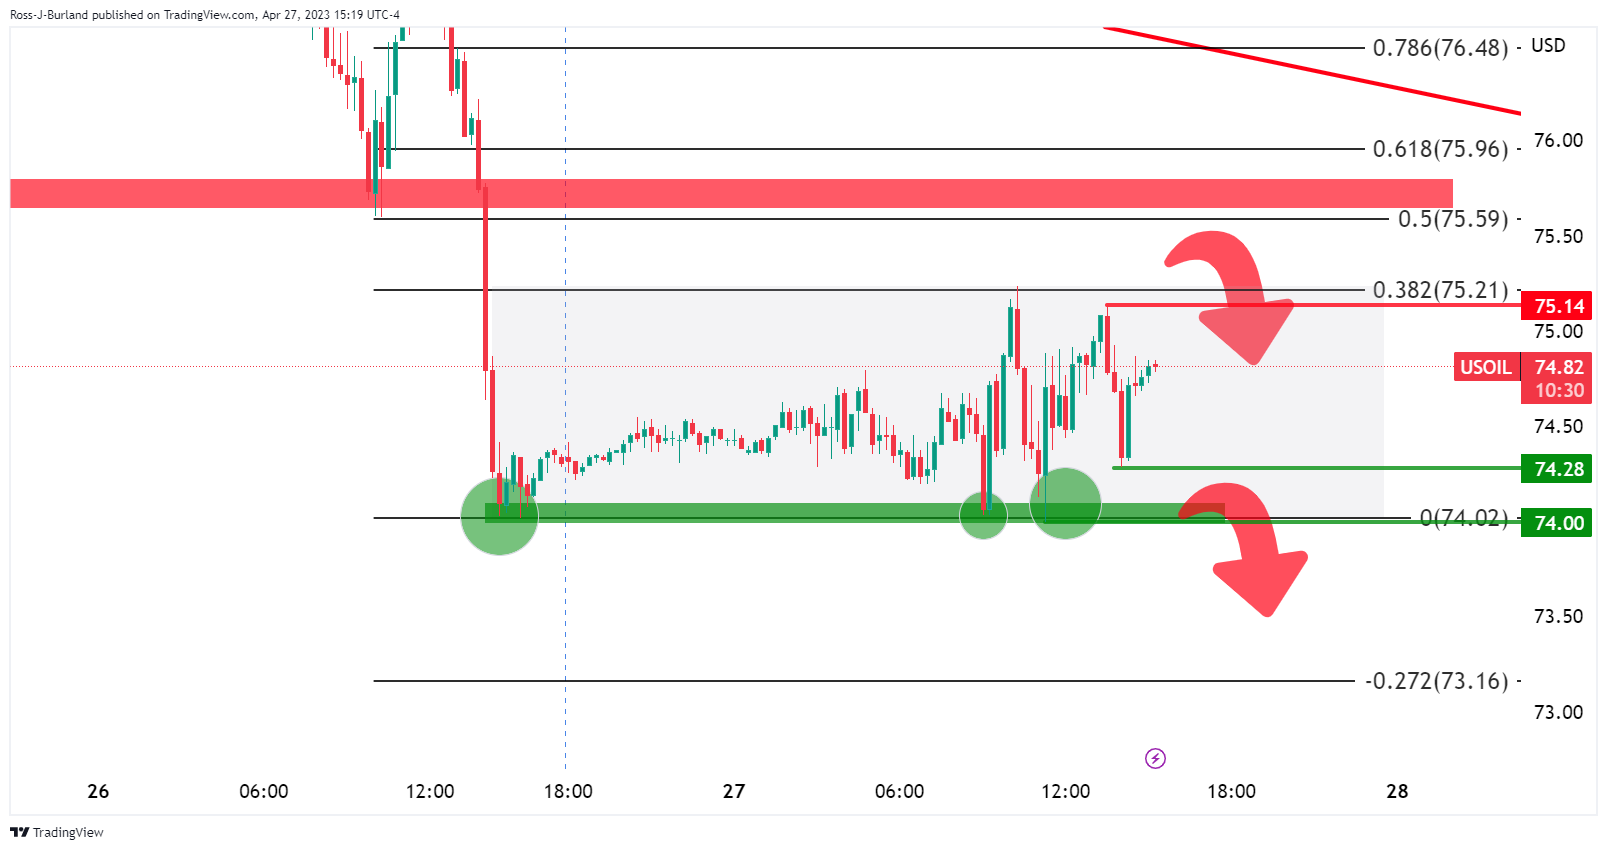
WTI technical analysis
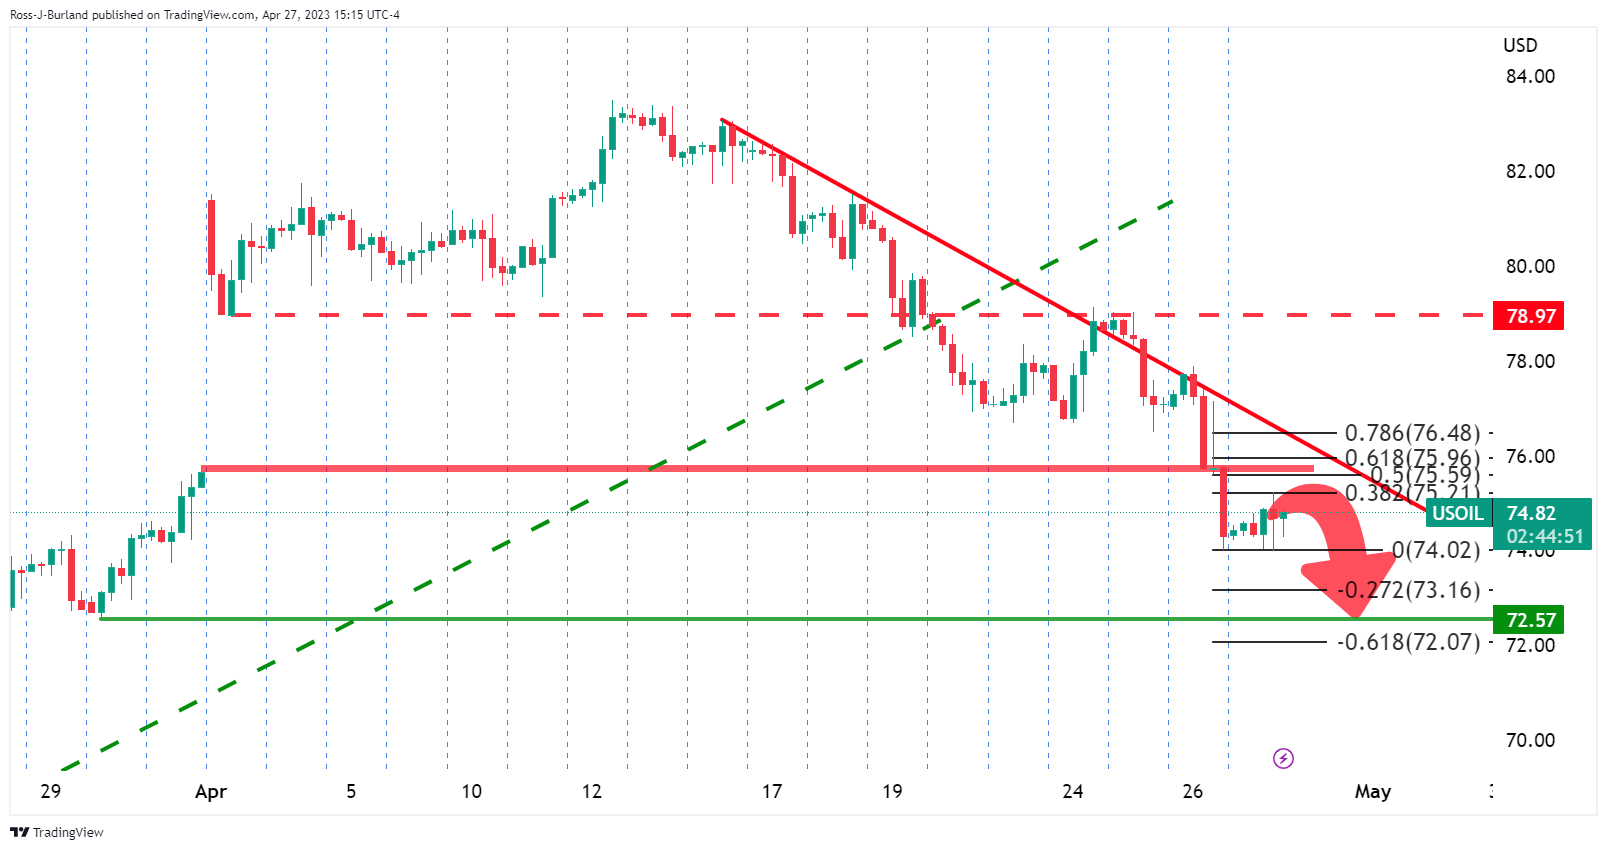
While below the gap resistance, the price is bearish on the front side of the trendline. A correction to the 38.2% Fibonacci has taken place already- on the 4-hour charts. However, there is plenty of support coming in which leaves the market in a sideways chop:
-
19:46
USD/MXN falls below key technical levels amidst US growth slowdown, Mexican record exports
- US Q1 2023 GDP Advances by 1.1% QoQ, falls short of 2% estimates as inflation surges to 4.9%.
- Fed May meeting: CME FedWatch tool predicts 87.1% chance of rate hike; stagflation looms.
- Mexico’s exports hit a record high of $53.6 billion, boasting a surplus.
The USD/MXN erased its Wednesday’s gains, dropping below crucial technical levels, after growth in the United States (US) decelerated, via a report for the Commerce Department. That, alongside a tranche of US economic data, softened the greenback. At the time of writing, the USD/MXN is trading at 18.0548, down 0.50%.
USD/MXN at two-day lows, eyeing 18.0000
The Mexican Peso (MXN) regained its strength, underpinned by lower-than-estimated growth in the US. The US Department of Commerce revealed the GDP Advance for Q1 2023 rose by 1.1% QoQ, below estimates of 2%. In the same report, quarterly core inflation aimed towards 5%, at 4.9%, exceeded forecasts and justified the Fed’s May rate rise increase.
The CME FedWatch Tool predicts there’s a chance of 87.1% for a 25 bps at the May meeting by the Fed. That paints a possible scenario of stagflation: the US economy decelerates while inflation continues to be sticky above the Fed’s target twice and a half.
On another data, the US Department of Labor (DoL) revealed that Initial Jobless Claims were lower than estimated, snapping three consecutive reports that flashed signs that the labor market was easing.
Aside from this, Mexico’s exports reached a record $53.6 billion, with the country printing a surplus, due to the arrival of investments and factories across the US border.
USD/MXN Technical Analysis
After hitting a weekly high of 18.1968, the USD/MXN tumbled below the 20-day EMA at 18.1106 and accelerated towards 18.0500. An upslope trendline drawn from March lows that passes around the 18.0450-18.0500 area capped the USD/MXN fall. Though a bearish continuation remains in play, the RSI indicator accelerated its downward trajectory, while the Rate of Change (RoC) portrays buying pressure waning. IF USD/MXN breaks below 18.0500 in the coming days, the pair could head toward the 17.9505 area. Once broken, the YTD low is up for grabs at 17.8968. Conversely, USD/MXN is climbing above the 20-day EMA, but upside risks remain.
-
19:11
EUR/USD Price Analysis: Bears are moving in and eye a run on length
- EUR/USD bulls ready to throw in the towel?
- EUR/USD bearish technical analysis points to a test and break of key structures.
The Euro hovered near a one-year high vs. the US Dollar on Thursday. At the time of writing, EUR/USD is trading at 1.1020 as the market rallies in a short squeeze in the New York session. The following illustrates a bearish bias in a multi-timeframe analysis.
EUR/USD weekly chart
The rising wedge is a compelling feature on the longer-term charts. This is a bearish geometrical pattern and we can see the market has been driven back into shorts taken out in late March in a short squeeze. Perhaps we will see a long squeeze in the coming days?
EUR/USD daily charts
We have the first layer of structure in the 1.0960s and this would be breaking the micro trendline to tip the bias further to the downside.
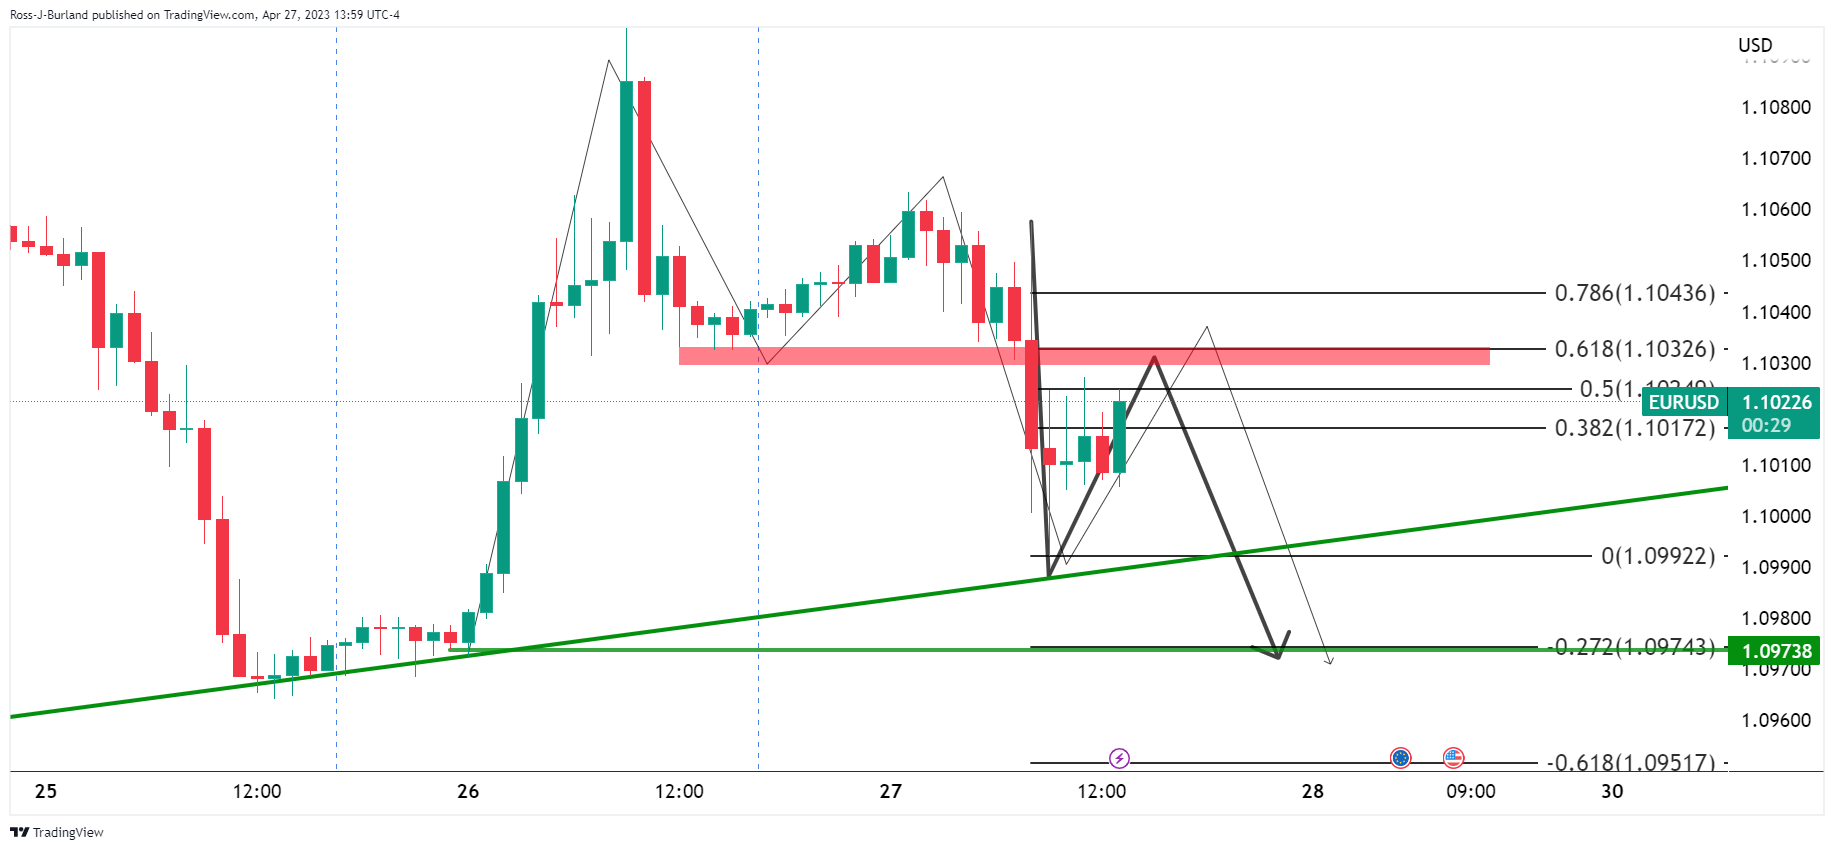
EUR/USD H4 charts
Zooming into the 4-hour charts, we have the M-formation which could mean that we will see a test of the neckline resistance near the 1.1030s before a strong test of the trendline support. An engulfment would be an encouraging feature for the bears in that regard.
EUR/USD H1 chart
On the hourly chart, we can see the thesis playing out in faster motion with the current bid in play. A 61.8% Fibonacci retracement meets the neckline resistance. Everything above is trapped volume, so the long squeeze thesis is a reasonable one into 1.0950s stops and the week´s lows.
EUR/USD week template, M15 chart
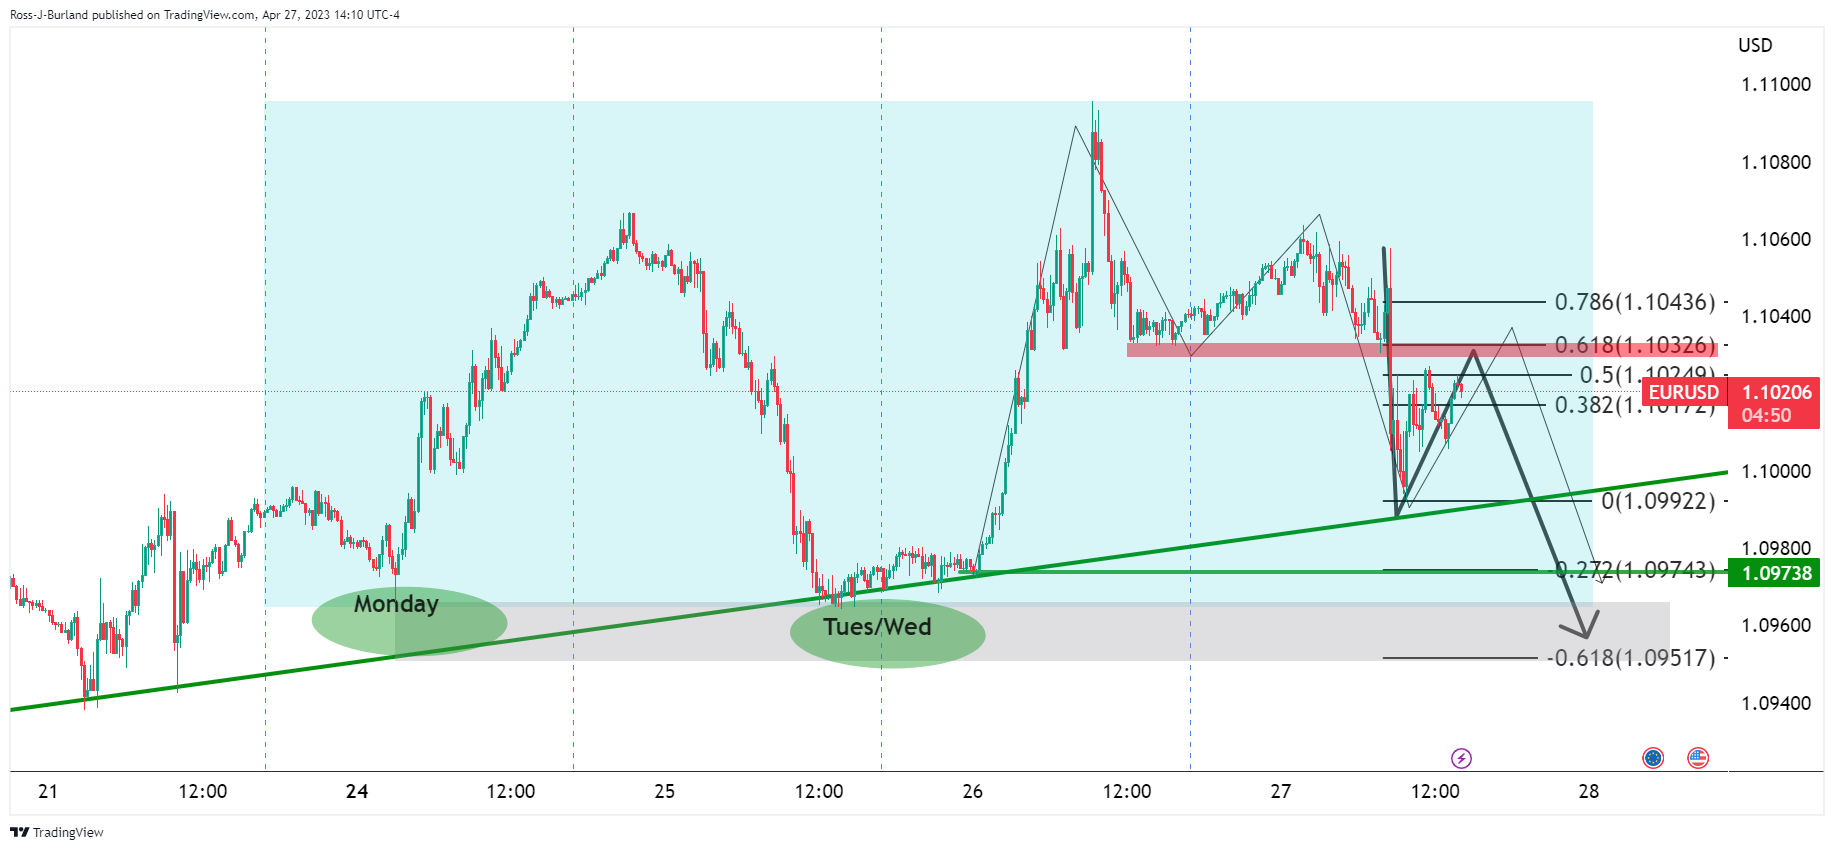
Monday and mid week longs are still in the money with stop losses below eyed.
-
18:50
USD/CAD breaks losing streak, poised for a dip below 1.3600 on mixed US data
- USD/CAD snaps six days of losses, eyeing a drop below 1.3600.
- The Gross Domestic Product in the US expanded less than estimates, while unemployment claims rose less than forecast.
- USD/CAD Price Analysis: An evening star candlestick pattern warrants further downside; otherwise, a re-test of 1.3650 is likely.
The USD/CAD retraces after hitting a daily high of 1.3645 after the release of the United States (US) Gross Domestic Product (GDP) triggered fears of an upcoming recession in the United States (US). Consequently, the US Dollar (USD) advanced, but also the Canadian Dollar. Therefore, the USD/CAD is trading at 1.3619, below its opening price by 0.13%.
USD/CAD ignored the data and fell despite the US Dollar strength
As mentioned above, the US Department of Commerce revealed the Advance GDP for Q1 2023, which came at 1.1% QoQ, missing estimates of 2.0%. The print is the preliminary reading, though it’s the most market-moving. In addition, the US Department of Labor (DoL) revealed that Initial Jobless Claims were lower than estimated, snapping three consecutive reports that flashed signs that the labor market was easing.
Of note, on the GDP report, the core Personal Consumption Expenditure (PCE) for the first quarter rose by 4.9%, above estimates, justifying the Fed’s intention to raise rates by 25 bps next week. The CME FedWatch Tool shows that the swaps markets depict that odds for a quarter of a percentage hike lie at 87.1%, above yesterday’s intentions.
After the data release, the USD/CAD edged toward 1.3640 before falling toward the daily low of 1.3591, correcting upwards and exceeding 1.3600. OF late, the rise in crude oil prices of more than 1% underpins the Canadian Dollar (CAD), with the USD/CAD threatening to break below the 1.3600 mark.
On the Canadian front, Payrolls rose 62.5K in February, and Weekly Earnings increased by 1.8% YoY.
USD/CAD Technical Analysis
From a technical stance, the USD/CAD is upward biased. However, an evening star three-candlestick pattern is emerging, which could pave the way for a pullback before resuming the uptrend. Hence, if USD/CAD drops below 1.3600, a dip towards the confluence of the 20 and 50-day EMAs at 1.3526/35 is on the cards. Once cleared up next is the 100-day EMA at 1.3509. Conversely, if USD/CAD holds the spot price above 1.3600, upside risks lie at April 26, high at 1.3651.
-
18:02
United States 7-Year Note Auction: 3.563% vs previous 3.626%
-
17:26
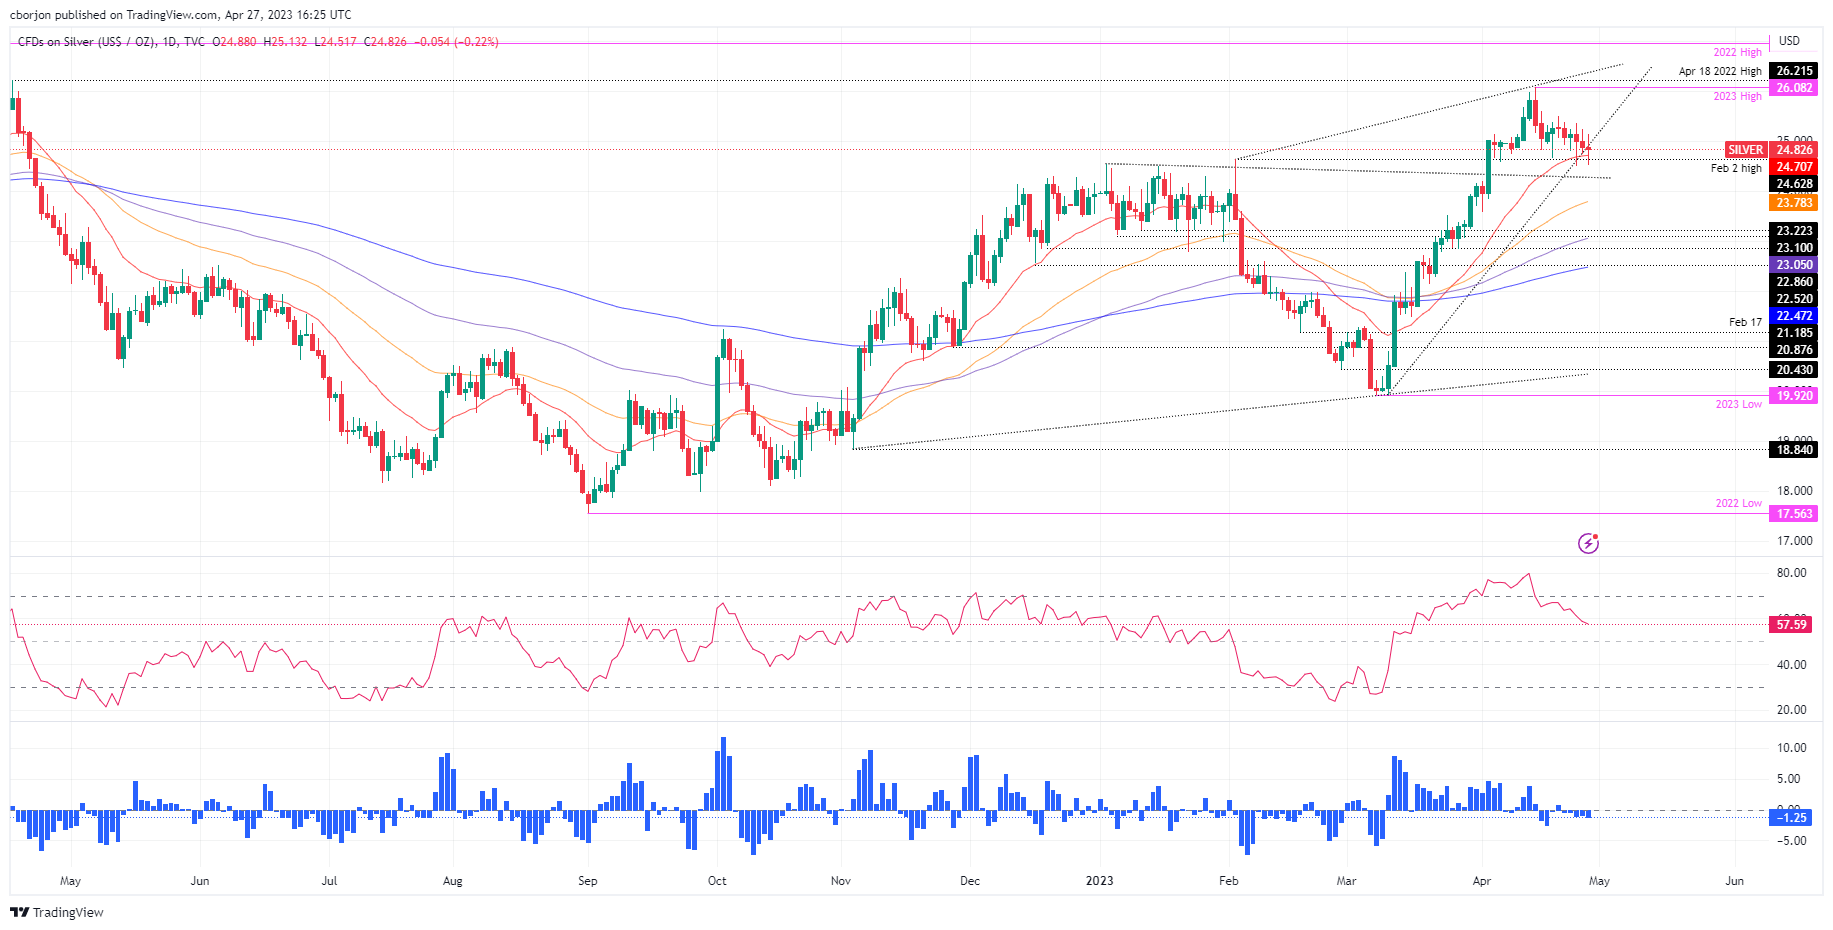
Silver Price Analysis: XAG/USD falls but remains capped by the 20-DMA at $24.70
- Silver price continues to trade below the $25.00 figure as support takes hold around $24.80.
- XAG/USD has been trading sideways, bracing around the 20-day EMA at $24.70 for the last three days.
Silver price trends downwards for the third straight day, though it stays above the 20-day Exponential Moving Average (EMA) after dipping to a daily low of $24.51. At the time of writing, the XAG/USD is trading at $24.81, below its opening price by 0.25%.
XAG/USD Price Action
The XAG/USD is trading sideways, as it has been since April 18. Also, the Relative Strength Index (RSI), after bolstering the XAG/USD towards its YTD high of $26.08, has retreated, aiming towards the neutral area, as sellers continue to enter the market, as XAG/USD so far had failed to crack the 20-day EMA at $24.70. if XAG/USD sellers break below the latter, the next support would be a downslope resistance trendline, turned support, drawn from January highs, that passes around $24.20-30, ahead of posing a challenge to the $24.00 figure.
On the flip side, the XAG/USD first resistance would be the April 25 daily high at $25.23, followed by the April 20 cycle high at $25.49. The next resistance remains the YTD high at $26.08, followed by the last year’s high at $26.94.
XAG/USD Daily Chart
-
16:55
ECB Preview: Another hike next week, likely 50 bps – Danske
The European Central Bank (ECB) will have its monetary policy meeting next week. Another rate hike is widely expected. Analysts at Danske Bank point out that the question is whether it will slow the hiking pace to 25 basis points or continue to hike once more by 50bp. They see a 50bp more likely, with no specific forward guidance but repeating a data-dependent approach to future policy decisions.
Key quotes:
“This time, the question is whether it will slow the hiking pace to 25bp or continue to hike once more by 50bp. We believe it will be a 50bp compromise deal with no specific forward guidance (nor guidance on balance sheet normalisation in H2 yet), but repeating a data-dependent approach to future policy decisions.”
“Economic developments since the ECB meeting, coinciding with the banking turmoil, have shown resilient economic activity and another record-high core inflation print. Headline inflation has declined on the back of base effects, but the stickiness of core inflation and wages should pave the way for another 50bp rate hike, in our view.”
“A 50bp rate hike would implicitly also be a signal for a July hike in our reading. Hence, the risk for lower medium-to long-term rates, irrespective of the hiking, is prominent, in a bearish flattening move of the curves.”
“With a 25bp rate hike, we find it difficult for Lagarde to communicate a rate hike beyond June, which could take around 15bp out of the peak policy rate pricing, and in this case we see further lowering on the real rates and as such easing of the monetary policy stance.”
-
16:32
United States 4-Week Bill Auction: 3.83% vs 3.19%
-
16:29
NZD/USD stays firm amidst mixed US economic data, sparks recession concerns
- NZD/USD is firm after the release of mixed US economic data.
- US Q1 2023 GDP grows but misses estimates, while unemployment claims fell to 230K, below forecasts.
- NZD/USD faces the threat of reaching the YTD low at 0.6084 if support at 0.6100 is breached, though upside risks remain.
NZD/USD advances in the North American session after hitting a daily low of 0.6114 though recession fears sparked by US economic data augmented appetite for the US Dollar (USD). The NZD/USD is trading at 0.6131, down by a minuscule 0.09%.
NZD/USD climbs even though the US Dollar rises
Wall Street is not reflecting a dampened economic outlook in the United States (US). However, in the FX space, the antipodeans are erasing previous losses after the US Department of Commerce revealed the Advanced Gross Domestic Product (GDP) for Q1 in 2023 rose by 1.1% QoQ, below estimates of 2%, and trailed 2022 last quarter at 2.6%. Delving into the report, the US Core Personal Consumption Expenditure (PCE) rose by 4.9% QoQ vs. estimates of 4.8%. That would keep the US Federal Reserve (Fed) tightening monetary policy as inflation continues to edge h
Meanwhile, the US Department of Labor revealed that Initial Jobless Claims snapped three straight weeks of beating estimates, rose by 230K for the week ending April 22, less than forecasts of 248K.
After the data release, the NZD/USD seesawed between the day’s high and 0.6130 before dropping toward the 0.6120 area. Then, the pair recovered some ground and is sitting at around 0.6130s. The US Dollar Index, a measure of the buck’s value vs. a basket of peers, rises 0.20%, at 101.650.
US Treasury bond yields advanced as data justified Fed’s May rate hikes. Odds for a 25 bps interest rate increase for the May meeting climbed to 84.8%, higher than April 26 at 72.2%, according to the CME Fed WatchTool.
On the New Zealand front, April’s ANZ Activity and Business Confidence report showed mixed readings, with the former improving. However, it remained in negative territory, while the latter plummeted below the prior’s reading.
NZD/USD Technical Analysis
After bottoming around 0.6114 nearby the weekly low, the NZD/USD snapped two days of losses and bounced toward the 0.6130s area. Nevertheless, the top wick of today’s candlestick suggests that sellers are in control. If NZD/USD buyers want to get in control, they must reclaim the 20-day Exponential Moving Average (EMA) At 0.6188. Once broken, they could pose a threat toward 0.6200. Conversely, the NZD/USD first support would be 0.6100. A breach of the latter will expose the YTD low at 0.6084.
-
16:02
United States Kansas Fed Manufacturing Activity came in at -21, below expectations (3) in April
-
15:54
AUD/USD erases gains after US data, slides toward 0.6600
- US growth data comes in below expectations.
- US Dolla rises across the board boosted by US yields.
- AUD/USD up marginally, off highs after losing ground for four days in a row.
The AUD/USD is rising marginally on Thursday after it trimmed gains on the back of US economic data. The pair peaked on Asian hours at 0.6635 and recently fell to 0.6594. It is hovering around 0.6610, with a bearish bias amid a stronger US Dollar.
Dollar and Wall Street up despite US growth numbers
The US Dollar strengthened following the US Q1 GDP report. The economy grew at an annualized rate of 1.1%, below expectations. Personal Consumption Expenditures Prices rose by more than anticipated by 4.2%. Initial Jobless Claims for the week ended April 21 resulted in 230K, better than the expected 248K. Pending Home Sales declined by 5.2% on a monthly basis in March.
The numbers pointed to slower growth and somewhat persistent inflation pressures. US yields are sharply higher, boosting the US Dollar across the board. The 10-year yield is at 3.52% and the 2-year at 4.06%.
More US data is due on Friday with the Core Personal Consumption Expenditures Price Index and Income and Spending figures. Next week is the FOMC meeting. Market participants looks for a final 25 basis points rate hike.
The Reserve Bank of Australia will also have its monetary policy meeting next week. The RBA is expected to keep rates unchanged for the second meeting in a row.
The AUD/USD is moving sideways on Thursday, after posting the lowest daily close in a month around 0.6600. The pair has fallen during the last four days, and is attempting to stabilize.
A consolidation below 0.6600 would expose March lows at 0.6560/65; with a break lower likely to trigger a downside acceleration.
Technical levels
-
15:30
United States EIA Natural Gas Storage Change above forecasts (75B) in April 21: Actual (79B)
-
15:08
US: Pending Home Sales decline by 5.2% in March vs. +0.5% expected
- Pending Home Sales in the US fell sharply in March.
- US Dollar Index holds in positive territory above 101.50.
Pending Home Sales in the US declined by 5.2% on a monthly basis in March, the data published by the National Association of Realtors showed on Thursday. This reading followed February's no-change (revised from +0.8%) and came in much worse than the market expectation for an increase of 0.5%.
On a yearly basis, Pending Home Sales fell by 23.2%, compared to analysts' estimate for a decline of 22.8%.
Market reaction
The US Dollar Index showed no immediate reaction to these data and was last seen rising 0.2% on the day at 101.65.
-
15:05
USD Index returns to the positive territory near 101.70
- The index leaves behind the initial pessimism and moves to 101.70.
- Advanced US GDP surprised to the downside in Q1.
- Weekly Claims rose more than expected last week.
The greenback regained sudden upside traction and advanced to fresh daily highs near 101.80 when measured by the USD Index (DXY) on Thursday.
USD Index stronger on data, yields
The choppy trade around the index – and the rest of the global assets – remains well and sound on Thursday.
Indeed, the US Dollar manages to gather fresh steam after the US docket showed the flash GDP Growth Rate is expected to have expanded at an annualized 1.1% in Q1 vs. expectations for a 2.0% expansion.
However, the GDP Price Index came in hotter than estimated at 4.0% and the PCE Prices rose 4.2% QoQ and 4.9% when it comes to the Core PCE Prices, both prints also surpassing consensus.
In the meantime, the labour market continued to show signs of cooling after Initial Claims rose by 230K in the week to April 22.
Following the US data releases, US yields edge further up across the curve and underpin further the recovery in the Buck.
What to look for around USD
The dollar shrug off some of the initial selling pressure and now sets aside the strong pullback witnessed in the previous session.
Looking at the broader picture, the index continues to navigate in a consolidative phase against steady expectations of another rate increase in May by the Fed.
In favour of a pivot in the Fed’s hiking cycle following the May event appears the persevering disinflation and nascent weakness in some key fundamentals.
Key events in the US this week: Flash Q1 GDP Growth Rate, Initial Jobless Claims, Pending Home Sales (Thursday) – PCE/Core PCE, Employment Cost, Personal Income, Personal Spending, Final Michigan Consumer Sentiment (Friday).
Eminent issues on the back boiler: Persistent debate over a soft/hard landing of the US economy. Terminal Interest rate near the peak vs. speculation of rate cuts in 2024. Fed’s pivot. Geopolitical effervescence vs. Russia and China. US-China trade conflict.
USD Index relevant levels
Now, the index is up 0.19% at 101.63 and faces the next resistance level at 102.80 (weekly high April 10) followed by 103.05 (monthly high April 3) and then 103.17 (55-day SMA). On the flip side, the breach of 100.78 (2023 low April 14) would open the door to 100.00 (psychological level) and finally 99.81 (weekly low April 21 2022).
-
15:00
United States Pending Home Sales (YoY) below expectations (-22.8%) in March: Actual (-23.2%)
-
15:00
United States Pending Home Sales (MoM) below expectations (0.5%) in March: Actual (-5.2%)
-
14:58
Expect no changes in policy from the BoJ on Friday – TDS
The Global Strategy Team at TD Securities (TDS) offers a brief preview of the upcoming Bank of Japan (BoJ) monetary policy meeting, scheduled during the Asian session on Friday.
Key quotes:
“We expect no changes in policy from the BoJ at its 28 April meeting. Governor Ueda has maintained the BoJ's dovish stance, highlighting that the Bank will stay the course until 2% inflation is sustainably reached (which we deem as a positive output gap).”
“While we think Ueda's next move will be a further adjustment of the yield curve target band, he appears in no rush to make such an adjustment, saying it's appropriate to maintain YCC "for now". Recent reports suggest BoJ officials are also wary of adjusting policy so soon after recent banking stress overseas. That said, we think the BoJ will not provide advance warning of a change and think the risk of a YCC shift should not be fully ruled out at this meeting.”
“At a minimum, we would expect the BoJ to offer guidance on YCC and announce a review. This should not come as a surprise as this has been communicated recently, but this time Ueda will have more flexibility to nuance the messaging now that he is fully in charge. And with the Shunto wage negotiations revealing higher than expected salary increases, and a back-up in 10y yields to close to the 0.5% top end of the YCC band, it suggests that the BoJ may still act in the months ahead. We think a move by June appears likely, which may take the form of a further widening to 0.75% or even 1%.”
-
14:50
EUR/SEK: Swedish Krona with potential to soften versus the Euro – Wells Fargo
Sweden's central bank raised its key interest rate by 50 basis points to 3.50% as expected. Analysts at Wells Fargo point out that the Riksbank faces something of a dilemma in that while inflation has been extremely rapid, economic activity has been particularly weak. They see the potential for the Swedish Krona to soften versus the Euro over the medium term.
Key quotes:
“We believe the Riksbank will, despite elevated inflation, take a cautious approach to further rate hikes. To be sure, after this week's announcement, we do expect some further monetary tightening. However, much like the Riksbank, we expect that tightening to be modest, and see just one final 25 bps rate increase in June to 3.75%.”
“This cautious approach to monetary tightening, which will leave real policy interest rates still deeply in negative territory, along with the underwhelming performance of the economy, means we are also turning less constructive on the Swedish krona.”
“We now see potential for the Swedish krona to soften versus the euro over the medium-term, targeting a EUR/SEK exchange rate of SEK11.5500 by end-2023 and SEK11.7000 by Q3-2024. Given our outlook for euro strength versus the U.S. dollar, that should still equate to modest krona strength versus the greenback over time. We target a USD/SEK exchange rate of SEK10.1325 by end-2023 and SEK9.7500 by Q3-2024.”
-
14:40
US economy is losing steam – Commerzbank
Dr. Christoph Balz, Senior Economist at Commerzbank, offers his views on the Advance US GDP report released this Thursday, which showed that growth in the world's largest economy decelerated to a 1.1% annualized pace during the first quarter.
Key quotes:
“Private consumption, which accounts for two-thirds of GDP, still grew by 3.7% in the first quarter. Households benefited from the continued strength of the labor market as well as special effects such as the social security increase and income tax relief as the tax code was adjusted for inflation. Disposable income increased by a strong 12.5% in Q1.”
“It is striking that housing construction, after seven sharp negative quarters (most recently -25%), is showing signs of stabilization with a comparatively small decline of 4.2%. Home builders have obviously now largely adjusted to the higher level of mortgage rates.”
“Stronger GDP growth was prevented by companies restocking their inventories much less than before. This in fact depressed the GDP growth rate by a whopping 2.3 percentage points. This effect should not be repeated in the current quarter.”
“Measured against the difficult environment, the US economy has thus still held up reasonably well at the beginning of 2023. We still expect it to contract slightly in the second half of the year. This is because the full impact of the Fed's interest rate hikes will probably not be felt until then due to the usual lags. It also fits in with this that growth in the first quarter was mainly based on very good January figures. The data for February and March were already weaker. In addition, a number of survey-based indicators such as the ISM purchasing managers' indices are pointing clearly downward.”
-
14:34
GBP/USD hangs near daily low, around mid-1.2400s amid fresh USD buying
- GBP/USD meets with some supply on Thursday amid the emergence of some USD buying.
- A further rise in the US bond yields turns out to be a key factor lending support to the buck.
- The USD maintains its bid tone and moves little following the Advance US Q1 GDP report.
The GBP/USD pair attracts some sellers near the 1.2500 psychological mark during the early North American session and drops to a fresh daily low following the release of the US macro data. Spot prices, however, manage to rebound a few pips in the last hour and now trade with a mild negative bias, around the mid-1.2400s.
The US Bureau of Economic Analysis reported this Thursday that the economic growth decelerated from 2.6% annualized pace to 1.1% during the January-March period, missing estimates for a reading of 2.0%. Further details of the report revealed that the GDP Price Index edged higher to 4% in the same period from 3.9%, compared to estimates for a reading of 3.8%. On a quarterly basis, the Personal Consumption Expenditures (PCE) Prices rose to 4.2% from 3.7%, indicating an unexpected pickup in price pressures.
Furthermore, data published by the US Department of Labor (DOL) showed that Initial Jobless claims fell to 230K in the week ended April 22 as compared to the 246K previous and the 248K anticipated. This also marks the lowest level in three weeks. Nevertheless, the upbeat macro data reaffirms bets for another 25 bps lift-off at the next FOMC meeting in May and remains supportive of a further rise in the US Treasury bond yields, which underpins the US Dollar (USD) and exerts some pressure on the GBP/USD pair.
The downside, however, remains cushioned, at least for the time being, amid growing acceptance that the Bank of England (BoE) will also hike interest rates by 25 bps in May. This, in turn, warrants some caution before placing aggressive bearish bets around the GBP/USD pair and positioning for any meaningful downside. Traders also seem reluctant and now look forward to Friday's release of the US Core PCE Price Index, the Fed's preferred inflation gauge, which will play a key role in influencing the near-term USD price dynamics.
Technical levels to watch
-
14:01
EUR/USD challenges 1.1000 post-US GDP figures
- EUR/USD recedes to the vicinity of the key 1.1000 mark.
- EMU Consumer Confidence came in at -17.5 in April.
- US Flash GDP disappointed expectations in Q1.
EUR/USD fades the initial upbeat mood and retreats to the boundaries of 1.1000 the figure on the back of the marked bounce in the Greenback on Thursday.
EUR/USD weaker on USD-buying
EUR/USD now looks offered in the low-1.1000s against the backdrop of the strong bout of strength in the Dollar and the continuation of the march north in US yields across the curve.
The move lower in the pair came soon after advanced US GDP Growth Rate saw the economy expand less than estimated by 1.1% YoY and 4.0% inter-quarter in the January-March period. In addition, Initial Claims rose by 230K in the week to April 22.
Earlier in the session, the Consumer Confidence measured by the European Commission in the broader Euroland matched the preliminary reading at -17.5 in April.
What to look for around EUR
EUR/USD comes under pressure and threatens to breach the key 1.1000 support on Thursday.
Meanwhile, price action around the single currency should continue to closely follow dollar dynamics, as well as the incipient Fed-ECB divergence when it comes to the banks’ intentions regarding the potential next moves in interest rates.
Moving forward, hawkish ECB-speak continue to favour further rate hikes, although this view appears in contrast to some loss of momentum in economic fundamentals in the region.
Key events in the euro area this week: Final Consumer Confidence, Economic Sentiment (Thursday) – Euro group Meeting, Germany labour market report/ Advanced Inflation Rate/Flash Q1 GDP Growth Rate, EMU Flash Q1 GDP Growth Rate (Friday).
Eminent issues on the back boiler: Continuation (or not) of the ECB hiking cycle. Impact of the Russia-Ukraine war on the growth prospects and inflation outlook in the region. Risks of inflation becoming entrenched.
EUR/USD levels to watch
So far, the pair is losing 0.25% at 1.1010 and faces the initial support at 1.0909 (weekly low April 17) seconded by 1.0831 (monthly low April 10) and finally 1.0788 (monthly low April 3). On the other hand, the breakout of 1.1075 (2023 high April 14) would target 1.1100 (round level) en route to 1.1184 (weekly high March 21 2022).
-
14:01
Russia Central Bank Reserves $ dipped from previous $600.2B to $597.1B
-
13:58
Gold Price Forecast: XAU/USD tumbles toward $1,980 after US data
- US economy expanded less than expected during Q1.
- US Dollar and Treasury yields rise after data.
- XAU/USD drops from $2,000 to test $1,980; key support stands at $1,970.
Gold price dropped sharply following the release of US Q1 GDP growth data. XAU/USD hit levels above $2,000 and then lost almost $20, falling to the $1,980 area.
Economic data from the US showed the economy grew at an annualized rate of 1.1% during the first quarter, below the 2% of market consensus and under the 2.6% of the previous quarter. The Core PCE rose 4.9%, above the expected 4.7%. The GDP deflator also exceeded expectations at 4% versus 3.7%. A different report showed a decline in Jobless Claims.
The numbers showed slower growth and persistent inflation. US yields rose after the economic figures. The 2-year Treasury yield climbed above 4% to 4.03% while the 10-year spiked to 3.49% and then pulled back. The US Dollar Index turned positive for the day, rising above 101.60. Wall Street futures remained in positive territory.
XAU/USD reached a two-day low at $1,981 and rebounded modestly. It remains with a bearish bias. The critical support is located around $1,970 and a break lower could trigger an acceleration.
A rebound in XAU/USD could face resistance at $1,990 and $1,995. Gold bulls need price to consolidate above $2,005 in order to point to a sustainable extension.
Technical levels
-
13:50
USD/JPY spikes to 134.00 mark, fresh daily high post-US GDP report
- USD/JPY catches aggressive bids following the release of the Advance US Q1 GDP report.
- The US economic growth decelerated from 2.6% to 1.1% during the first quarter of 2023.
- Traders now look to the BoJ meeting and the US Core PCE Price Index for a fresh impetus.
The USD/JPY pair rebounds over 80 pips from the daily low touched during the early North American session and climbs to the 134.00 mark, a fresh daily high following the release of the US GDP report.
The US Bureau of Economic Analysis reported this Thursday that the economic growth decelerated from 2.6% annualized pace to 1.1% during the January-March period, missing estimates for a reading of 2.0%. That said, the price index component - the Core Personal Consumption Expenditure - rose more than expected, by 4.9% during the reported period and pointed to a further pickup in price pressures, reaffirming bets for another 25 bps lift-off at the next FOMC meeting in May. This remains supportive of a further rise in the US Treasury bond yields, which continues to act as a tailwind for the US Dollar (USD) and lends support to the USD/JPY pair.
The sharp intraday spike could also be attributed to a goodish recovery in the global risk sentiment, which tends to undermine the safe-haven Japanese Yen (JPY). Furthermore, the Bank of Japan's (BoJ) dovish stance is seen weighing on the JPY and contributing to the move up. It, however, remains to be seen if the USD/JPY pair can capitalize on the move or if bulls opt to move to the sidelines ahead of the crucial BoJ policy meeting on Friday. Apart from this, the Fed's preferred inflation gauge - the US Core PCE Price Index - will play a key role in influencing the USD and help investors to determine the near-term trajectory for the major.
Technical levels to watch
-
13:35
US: Weekly Initial Jobless Claims decline to 230K vs. 248K expected
- Initial Jobless Claims in the US decreased by 16,000 in the week ending April 22.
- Continuing Jobless Claims declined by 3,000 in the week ending April 15.
- US Dollar Index rises modestly after economic reports.
Initial Jobless claims totaled 230,000 in the week ending April 22, the weekly data published by the US Department of Labor (DOL) showed on Thursday. The print follows the previous week’s 246,000 (revised from 245,000) and came in below market expectations of 248,000. it is the lowest level in three weeks.
“The 4-week moving average was 236,000, a decrease of 4,000 from the previous week's revised average.”
Continuing Claims decreased by 3,000 in the week ended April 15 to 1.858 million, below the 1.878 million of market consensus.
“The 4-week moving average was 1,836,500, an increase of 10,250 from the previous week's revised average. This is the highest level for this average since December 18, 2021 when it was 1,838,000.”
Market reaction
At the same time, the US reported Q1 GDP that triggered a decline of the US Dollar. The DXY rose modestly after the numbers, erasing daily losses, toward 101.50.
-
13:31
United States Personal Consumption Expenditures Prices (QoQ) above expectations (0.5%) in 1Q: Actual (4.2%)
-
13:31
United States Core Personal Consumption Expenditures (QoQ) came in at 4.9%, above forecasts (4.8%) in 1Q
-
13:31
United States Gross Domestic Product Price Index came in at 4%, above forecasts (3.8%) in 1Q
-
13:30
United States Gross Domestic Product Annualized came in at 1.1% below forecasts (2%) in 1Q
-
13:30
United States Continuing Jobless Claims registered at 1.858M, below expectations (1.878M) in April 14
-
13:30
United States Initial Jobless Claims came in at 230K, below expectations (248K) in April 21
-
13:30
United States Initial Jobless Claims 4-week average: 236K (April 21) vs previous 239.75K
-
13:25
EUR/USD Price Analysis: A test of 1.1100 emerges on the horizon
- EUR/USD looks to extend the uptrend beyond 1.1000.
- Further gains could see the 1.1100 barrier retested near term.
EUR/USD adds to Wednesday’s strong upside and consolidates further the recent breakout of the key 1.1000 mark on Thursday.
The pair looks poised to extend the recovery further in the near term. That said, the immediate hurdle is expected at the 2023 high at 1.1095 (April 25) closely followed by the round level at 1.1100.
Looking at the longer run, the constructive view remains unchanged while above the 200-day SMA, today at 1.0408.
EUR/USD daily chart
-
13:06
US Dollar is treading water as markets await fresh drivers – BBH
Economists at BBH offer a brief preview of Thursday's key US macro data, the Advance first-quarter GDP report, due for release during the early North American session. The data will play will influence the US Dollar (DXY), which is trading flat near 101.48 amid ongoing concerns about First Republic, higher global equity markets and global bond yields.
Key quotes:
“Consensus currently is at 1.9% SAAR vs. 2.6% in Q4. Personal consumption is expected at 4.0% vs. 1.0% in Q4. The mix of Q1 growth will be important because in Q4, the bulk of growth came from inventories while personal consumption and net exports slowed. Of note, the Atlanta Fed’s GDPNow model is tracking Q1 growth at 1.1% SAAR, down from 2.5% before yesterday’s weak data. This is the final model update for Q1 and now the model will start tracking Q2, with the first estimate coming tomorrow.”
-
13:02
Mexico Trade Balance, $ came in at $1.169B, above expectations ($-1.189B) in March
-
13:01
Mexico Trade Balance s/a, $ registered at $0.081B above expectations ($-1.809B) in March
-
12:12
USD Index Price Analysis: Further losses not ruled out
- DXY extends the consolidative phase for yet another session.
- Extra retracements could see the 101.00 region breached near term.
DXY alternates gains with losses in the low-101.00s on Thursday.
In the meantime, the index is expected to keep the choppy performance unchanged. The loss of the 101.00 region should spark further bouts of weakness to, initially, the 2023 lows in the 100.80/75 band (April 14).
Looking at the broader picture, while below the 200-day SMA, today at 106.10, the outlook for the index is expected to remain negative.
DXY daily chart
-
12:00
Brazil Inflation Index/IGP-M came in at -0.95%, below expectations (-0.74%) in April
-
12:00
Turkey CBRT Interest Rate Decision remains at 8.5%
-
11:55
EUR/JPY Price Analysis: Next on the upside comes the YTD high
- EUR/JPY falters just ahead of the 148.00 mark on Thursday.
- The immediate target of note emerges the 2023 top at 148.63.
EUR/JPY looks to extend Wednesday’s uptick, although there seems to be a tough barrier around the 148.00 neighbourhood so far on Thursday.
The underlying strong upside momentum in the cross appears unchallenged for the time being. Against that, once the 148.00 hurdle is cleared, the cross could then attempt a move to the 2023 high at 148.63 (April 25).
So far, further upside looks favoured while the cross trades above the 200-day SMA, today at 142.38.
EUR/JPY daily chart
-
11:48
Singapore: Industrial sector remains healthy – UOB
Senior Economist Alvin Liew at UOB Group reviews the latest industrial production results in Singapore.
Key Takeaways
“Singapore’s industrial production (IP) rebounded with a 9.3% m/m SA expansion in Mar, from a downwardly revised -12.5% m/m decline in Feb. This translated to a markedly smaller decline of -4.2% y/y in Mar, from the -9.7% y/y contraction in Feb. Both measures were better than Bloomberg’s median forecast of +6.2% m/m, -6.1% y/y and much better than our forecasts of -12.6% m/m SA, -24.8% y/y. Despite the improvement, this was still the sixth consecutive month of y/y decline and the worst streak since 2015 (11 months of y/y declines). Excluding the volatile biomedical manufacturing, IP contracted by a larger -6.0% y/y in Mar (from -5.8% y/y in Feb).”
“Based on advance estimates released by Ministry of Trade and Industry on 14 Apr, Singapore’s economy grew by just 0.1% y/y in 1Q 2023 (from 2.1% in 4Q 2022) with growth being dragged down by the manufacturing sector (which contracted by -6.0% y/y) while services (+1.8% y/y) and construction activity (8.5% y/y) supported GDP. However, based on the Mar IP report, the manufacturing sector is likely to have contracted by a smaller -5.6% y/y in 1Q. Assuming no major changes to the other sectors, we now expect 1Q GDP growth to be revised slightly higher by 0.1 ppt to 0.2% y/y, taking into account the milder manufacturing contraction.”
“IP Outlook – Notwithstanding the uplift brought by the biomedical technology and transport engineering components, the latest Mar IP print continues to affirm our downbeat manufacturing outlook due to the worsening electronics downcycle and weaker external demand. We maintain our forecast for Singapore 2023 manufacturing to contract by 5.4%.”
-
11:32
USD/CHF recovers further from over two-year low, trades above 0.8900 ahead of US GDP
- USD/CHF attracts some buyers on Thursday and draws support from a combination of factors.
- A positive risk tone undermines the safe-haven CHF and lends support amid a modest USD uptick.
- Investors now look forward to the Advance US Q1 GDP report to grab short-term opportunities.
The USD/CHF pair gains some positive traction on Thursday and builds on the previous day's late recovery from the vicinity of mid-0.8800s, or its lowest level since January 2021. The pair sticks to its positive bias through the first half of the European session and is currently placed near the weekly high, around the 0.8930-0.8935 region.
A modest recovery in the global risk sentiment - as depicted by a generally positive tone around the equity markets - undermines the safe-haven Swiss Franc (CHF) and acts as a tailwind for the USD/CHF pair. The US Dollar, on the other hand, draws support from a further rise in the US Treasury bond yields, bolstered by bets for another 25 bps Fed rate-hike in May, and turns out to be another factor lending some support to the major.
That said, fresh concerns about banking contagion risks in the US, along with the debt ceiling standoff and looming recession risks, have been fueling speculations about an imminent rate cut by the Fed later this year. This might hold back the USD bulls from placing aggressive bets and keep a lid on any meaningful upside for the USD/CHF pair. Traders also seem reluctant ahead of the release of the Advance US Q1 GDP report.
The first estimate is anticipated to show that growth in the world's largest economy decelerated to a 2.0% annualized pace during the January-March period from the 2.6% recorded in the previous quarter. Any significant divergence from the expected reading could infuse some volatility around the USD and provide some impetus to the USD/CHF pair. Apart from this, the broader risk sentiment could produce short-term opportunities.
The market focus will then shift to the Fed's preferred inflation gauge - the US Core PCE Price Index - due on Friday, which will play a key role in influencing the USD price dynamics and help determine the near-term trajectory for the USD/CHF pair. This makes it prudent to wait for strong follow-through buying before confirming that spot prices have formed a bottom around the 0.8850 region and positioning for any further gains.
Technical levels to watch
-
11:11
Australia: Lower inflation justifies unchanged rates by the RBA – UOB
Economist at UOB Group Lee Sue Ann assesses the latest inflation figures in Australia and the prospects for a potential pause by the RBA of its hiking cycle.
Key Takeaways
“Australia’s headline CPI growth came in at 1.4% q/q for 1Q23, a tad higher than expectations of 1.3% q/q, but lower than the reading of 1.9% q/q in 4Q22. Compared to the same period a year ago, CPI advanced 7.0% y/y, also lower than the 7.8% y/y print in 4Q22, though still a tad higher than expectations of 6.9% y/y.”
“Underlying inflation also eased. Annual trimmed mean inflation was 6.6%, down from 6.9% in 4Q22.The trimmed mean measure rose at a slower pace of 1.2% q/q, compared to 1.7% q/q in 4Q22. The strength of the underlying inflation was also evident in the Reserve Bank of Australia (RBA)’s weighted median CPI, which was up 1.2% q/q, but down from the previous reading of 1.6% q/q.”
“Following today’s inflation figures, the RBA is likely to remain on the sidelines at the upcoming monetary policy meeting on 2 May. As such, we continue to see the current 3.60% cash rate as the likely peak. Focus will nonetheless continue to be on incoming economic data, including 1Q23 wage price index (17 May), followed by Apr employment (18 May).”
-
10:50
US: Q1 GDP growth to register a meaningful deceleration to 1.2% - TDS
The Global Strategy Team at TD Securities (TDS) offers a brief preview of Thursday's key release of the Advance first-quarter US GDP report, due later during the early North American session.
Key Quotes:
“We now expect the first estimate of Q1 GDP growth to register a meaningful deceleration to 1.2% q/q AR (consensus: 2.0%) following a solider, above-trend 2.6% expansion in Q4. We had initially projected output to have increased by 2.3% for Q1, but Wednesday's advanced indicators for March pointed to a larger-than-expected drag from inventories. We continue to expect the US consumer to have acted as a major positive driver of economic activity. However, recent downward revisions to Q1 retail sales data may temper the pace of spending.”
-
10:45
GBP/USD remains confined in a range, holds above mid-1.2400s ahead of US GDP
- GBP/USD lacks any firm intraday direction and seesaws between tepid gains/minor losses.
- A further rise in the US bond yields lends support to the USD and caps gains for the major.
- Rising bets for another 25 bps BoE rate hike in May continue to underpin the British Pound.
The GBP/USD pair struggles to gain any meaningful traction on Thursday and oscillates in a narrow trading band through the first half of the European session. The pair is currently placed just above mid-1.2400s, nearly unchanged for the day, though the downside seems cushioned amid subdued US Dollar (USD) price action.
The uncertainty over the Federal Reserve's rate-hike path, along with a slight recovery in the global risk sentiment, fail to assist the safe-haven buck to capitalize on the overnight bounce from a nearly two-week low and lend support to the GBP/USD pair. Fresh concerns about banking contagion risks in the United States (US), along with the debt ceiling standoff and looming recession fears, have been fueling speculations about an imminent rate cut by the Fed later this year.
The markets, however, have been pricing in a greater chance of another 25 bps lift-off at the next FOMC policy meeting in May. This remains supportive of a further rise in the US Treasury bond yields, which acts as a tailwind for the Greenback and seems to cap the upside for the GBP/USD pair, at least for the time being. Moreover, the recent repeated failures to find acceptance above the 1.2500 psychological mark warrants some caution before positioning for any further gains.
Traders also seem reluctant and wait on the sidelines ahead of the release of the Advance US Q1 GDP report, due later during the early North American session. The data, along with the US bond yields and the broader risk sentiment, might influence the USD price dynamics and produce short-term trading opportunities around the GBP/USD pair. The market attention will then shift to the release of the Fed's preferred inflation gauge - the US Core PCE Price Index on Friday.
In the meantime, expectations for another 25 bps interest rate hike by the Bank of England (BoE) in May could underpin the British Pound and further contribute to liming the downside for the GBP/USD pair. The bets were lifted by last week's release of stronger UK wage growth data and consumer inflation figures, which, in turn, favours bullish traders and supports prospects for some meaningful near-term appreciating move for the major.
Technical levels to watch
-
10:31
Italy 10-y Bond Auction fell from previous 4.12% to 3.77%
-
10:31
Italy 5-y Bond Auction rose from previous 3.59% to 4.42%
-
10:30
OPEC’s Al Ghais: OPEC and OPEC+ are not targeting oil prices
Haitham Al Ghais, the Secretary-General of the Organization of the Petroleum Exporting Countries (OPEC), said on Thursday, “OPEC and OPEC+ are not targeting oil prices.”
Additional quotes
The IEA should be very careful about "further undermining" oil industry investments.
OPEC and OPEC+ are focusing solely on market fundamentals and enabling "vital" investments.
Finger-pointing and misrepresenting OPEC and OPEC+ actions is counterproductive.
Blaming oil for inflation was erroneous and technically inaccurate, given that there were other reasons contributing to inflation.
The international energy agency's repeated demands to avoid investing in oil could contribute to future market turbulence.
Market reaction
WTI was last seen trading at $74.44, up 0.20% on the day. The US oil is retreating from intraday highs of $74.79.
-
10:30
Belgium Consumer Price Index (MoM): 0.67% (April) vs 0.57%
-
10:30
Belgium Consumer Price Index (YoY): 5.6% (April) vs previous 6.67%
-
10:06
European Monetary Union Business Climate dipped from previous 0.7 to 0.54 in April
-
10:01
European Monetary Union Services Sentiment came in at 10.5, above expectations (9.4) in April
-
10:01
European Monetary Union Industrial Confidence came in at -2.6, below expectations (0.1) in April
-
10:01
European Monetary Union Consumer Confidence in line with forecasts (-17.5) in April
-
10:01
European Monetary Union Economic Sentiment Indicator registered at 99.3, below expectations (99.9) in April
-
10:00
Belgium Gross Domestic Product (QoQ) above expectations (0.3%) in 1Q: Actual (0.4%)
-
09:55
Crude Oil: Recession fears weigh but no sustained rout in the cards – TDS
Bart Melek, Head of Commodity Strategy at TD Securities (TDS) beileves that there is no sustained downtrend in crude oil prices, despite the latest sell-off sparked by fears over a global economic recession.
Key quotes
“Despite unexpectedly large crude oil (5.05 MM bbls) and gasoline (2.48 MM bbls) inventory draws, concerns surrounding global economic weakness, diminishing crack spreads and a lackluster appetite for risk have kept crude oil prices from bouncing meaningfully higher following the EIA data.”
“A sharp rise in US product demand (+891k b/d) also did little to lift prices. With WTI crude trading near $76.50/b and Brent trending near $80/b, worried traders have largely erased all the gains from the OPEC+ production cut announcement.”
“Specs are no doubt aggressively cutting the recently acquired long exposure amid growing concerns that the petroleum complex will become oversupplied, as demand moderates in response to weakening economic conditions.”
-
09:42
AUD/USD sticks to modest intraday gains above 0.6600 mark, US GDP awaited
- AUD/USD gains some positive traction on Thursday, albeit lacks bullish conviction.
- A modest recovery in the risk sentiment undermines the USD and lends support.
- Traders now look to the Advance US Q1 GDP report for short-term opportunities.
The AUD/USD pair once again shows resilience below the 0.6600 mark and attracts some buying on Thursday, snapping a two-day losing streak to its lowest level since mid-March touched the previous day. The pair maintains its bid tone through the early part of the European session, albeit lacks bullish conviction.
The uncertainty over the Federal Reserve's rate-hike path fails to assist the US Dollar (USD) to capitalize on the overnight bounce from a nearly two-week low, which, in turn, is seen lending some support to the AUD/USD pair. Fresh concerns about banking contagion risks in the United States (US), along with the debt ceiling standoff and looming recession fears, have been fueling speculations about an imminent rate cut by the Fed later this year. Apart from this, a slight recovery in the global risk sentiment - as depicted by a stable performance around the equity markets - further undermines the safe-haven buck and benefits the risk-sensitive Aussie.
The markets, meanwhile, seem convinced that the US central bank will hike interest rates by another 25 bps at the next FOMC policy meeting in May. This remains supportive of a further rise in the US Treasury bond yields, which acts as a tailwind for the Greenback and keeps a lid on any further gains for the AUD/USD pair. Traders also seem reluctant and preferred to wait on the sidelines ahead of the release of the Advance US Q1 GDP report, due later during the early North American session. The growth in the world's largest economy is anticipated to slow to a 2% annualized pace during the January-March period from the 2.6% rise in the previous quarter.
Any significant divergence from the expected reading might infuse some volatility around the USD and provide a fresh impetus to the AUD/USD pair. The focus will then shift to the US Core PCE Price Index - the Fed's preferred inflation gauge - on Friday, which will play a key role in influencing the near-term USD price dynamics and help determine the near-term trajectory for the major.
Technical levels to watch
-
09:37
Russia’s Novak: OPEC+ sees no need for further oil output cuts
Russian Deputy Prime Minister Alexander Novak said on Wednesday, “OPEC and its allies (OPEC+) sees no need for further oil output cuts despite lower than expected Chinese demand.”
Additional takeaways
The global oil market is balanced.
OPEC+ is always able to adjust deal parameters.
We don't see oil market deficit after OPEC+ cuts starting from May.
Russia's oil tax revenue is higher thanks to lower uUals discount.
Russia's gas condensate output to decline in 2023.
Russia to cut oil and gas condensate output by 20 mln to 515 mln t in 2023.
Russia achieved the necessary oil output cut level in April.
Russia is to redirect 140 mln t of oil and oil products meant for Europe to Asia in 2023.
Market reaction
WTI is testing daily highs near $74.70 on the above comments. The US oil is adding 0.45% on the day, as of writing.
-
09:31
Portugal Business Confidence climbed from previous 2 to 2.3 in April
-
09:31
Portugal Consumer Confidence: -31.7 (April) vs -33.4
-
09:22
Euro trades in mid 1.10s ahead of US GDP release
- Euro vs US Dollar pulls back from highs just short of 1.11 to trade in the mid-10s on Thursday, ahead of US GDP data.
- US recession and banking crisis fears provided the backdrop, amidst reports of First Republic Bank teetering again.
- The trend remains bullish according to technical analysis with the 200-day SMA at circa 1.1190 as the next target.
The Euro (EUR) trades comfortably in the mid 1.10s against the US Dollar (USD) during the early European session, on Thursday. The pair has stabilized after recent volatility, caused by renewed recession fears and banking crisis deja vu in the US. From a technical standpoint, the overall trend is up and the probabilities favor long holders.
EUR/USD market movers
- First Republic Bank is mulling over selling half its loan book to plug a $100B deposit flight gap, renewing banking-crisis fears.
- Impact on the US Dollar is debatable. Some analysts see upside for the USD on increased safe-haven demand, whilst others focus on how it would dissuade the Fed from hiking – a Dollar-negative.
- US Consumer Confidence figures for April eclipsed higher-than-expected New Home Sales and were seen as warning of an impending US recession.
- JP Morgan’s CIO, Bob Michele, sees deposit flight in the US as more systematically linked to lower-income earners burning through savings to meet the rising cost of living, further raising banking/recession concerns.
- The Euro has been supported by overall hawkish comments from ECB officials such as Pierre Wunsch, president of Belgium’s Banque Nationale, who said, “We are waiting for wage growth and core inflation to go down... before we can arrive at the point where we can pause (hiking rates).”
- ECB’s chief economist Philip Lane went on record as saying interest rates will rise at the May 4 meeting but whether beyond that depends on the data.
- Previously, Lane had said a lot is riding on the state of Eurozone banks, as assessed by the ECB’s Bank Lending Survey out on May 2, as well as April flash HICP inflation data released on the same day.
- Strong first quarter earnings by European banks due to higher interest margins, however, suggest the bank survey may paint a favorable picture.
- ECB President Christine Lagarde recently said there is still “some way to go” before Frankfurt is done with hiking interest rates.
- The US Dollar is at a disadvantage since Federal Reserve (Fed) officials are in the two-week blackout period before the May 4 meeting, during which time they are not allowed to comment.
- Before the blackout, St. Louis Fed’s Bullard was hawkish, saying he expects more rate hikes due to persistent inflation and overblown recession fears.
- The key data release for the Euro on Thursday, is Eurozone Consumer Confidence in April, out at 9.00 GMT.
- The main release for the US Dollar is first quarter GDP data, out at 12:30 GMT.
EUR/USD technical analysis: New triangle potentially forming
EUR/USD reached a new 2023 high of 1.1095 and has rolled over to trade in the mid 1.10s, at the time of writing. The broader medium-term uptrend, however, remains intact – and will continue to – as long as the 1.0830 lows hold. Overall the odds favor a continuation of the dominant Euro bullish trend.
-638181802181531303.png)
EUR/USD: 4-hour ChartOn the 4-hour chart, EUR/USD looks like it may be forming a triangle pattern, with Wednesday’s highs representing a false breakout. If so, the triangle looks like it may have formed four distinct waves, labeled A-D on the chart above. Since triangles are usually composed of five waves it may be close to completing, with only wave E remaining before completion.
Triangles can breakout in either direction but, given the dominant trend is bullish, the odds partially favor a breakout higher. As such, a decisive break above the 1.1095 year-to-date highs would confirm such a bullish breakout from the triangle, and a continuation of the Euro’s uptrend to the next key resistance level at around 1.1190, where the 200-week Simple Moving Average (SMA) is located. If the triangle fulfills its full price potential, however, the Euro-US Dollar could even reach 1.1229.
For the sake of clarity, a ‘decisive break’ might be a ‘breakout candle’ – a long green bullish daily candle that extends above the 1.1075 highs and closes near its high – or three smaller bullish green candles in a row that break above the highs.
Alternatively, a break and daily close below the key 1.0909 lows would signify a bearish breakout from the triangle, with a target at 1.0805, which in itself could suggest a possible reversal of the dominant trend.
Euro FAQs
What is the Euro?
The Euro is the currency for the 20 European Union countries that belong to the Eurozone. It is the second most heavily traded currency in the world behind the US Dollar. In 2022, it accounted for 31% of all foreign exchange transactions, with an average daily turnover of over $2.2 trillion a day.
EUR/USD is the most heavily traded currency pair in the world, accounting for an estimated 30% off all transactions, followed by EUR/JPY (4%), EUR/GBP (3%) and EUR/AUD (2%).What is the ECB and how does it impact the Euro?
The European Central Bank (ECB) in Frankfurt, Germany, is the reserve bank for the Eurozone. The ECB sets interest rates and manages monetary policy.
The ECB’s primary mandate is to maintain price stability, which means either controlling inflation or stimulating growth. Its primary tool is the raising or lowering of interest rates. Relatively high interest rates – or the expectation of higher rates – will usually benefit the Euro and vice versa.
The ECB Governing Council makes monetary policy decisions at meetings held eight times a year. Decisions are made by heads of the Eurozone national banks and six permanent members, including the President of the ECB, Christine Lagarde.How does inflation data impact the value of the Euro?
Eurozone inflation data, measured by the Harmonized Index of Consumer Prices (HICP), is an important econometric for the Euro. If inflation rises more than expected, especially if above the ECB’s 2% target, it obliges the ECB to raise interest rates to bring it back under control.
Relatively high interest rates compared to its counterparts will usually benefit the Euro, as it makes the region more attractive as a place for global investors to park their money.How does economic data influence the value of the Euro?
Data releases gauge the health of the economy and can impact on the Euro. Indicators such as GDP, Manufacturing and Services PMIs, employment, and consumer sentiment surveys can all influence the direction of the single currency.
A strong economy is good for the Euro. Not only does it attract more foreign investment but it may encourage the ECB to put up interest rates, which will directly strengthen the Euro. Otherwise, if economic data is weak, the Euro is likely to fall.
Economic data for the four largest economies in the euro area (Germany, France, Italy and Spain) are especially significant, as they account for 75% of the Eurozone’s economy.How does the Trade Balance impact the Euro?
Another significant data release for the Euro is the Trade Balance. This indicator measures the difference between what a country earns from its exports and what it spends on imports over a given period.
If a country produces highly sought after exports then its currency will gain in value purely from the extra demand created from foreign buyers seeking to purchase these goods. Therefore, a positive net Trade Balance strengthens a currency and vice versa for a negative balance. -
09:21
USD/CNH: Upward momentum has improved – UOB
UOB Group’s Economist Lee Sue Ann and Markets Strategist Quek Ser Leang see the upside bias in USD/CNH unchanged while above the 6.8950 level in the next weeks.
Key Quotes
24-hour view: “Our expectations for USD to ‘rise above the NY high near 6.9510’ did not materialize as it traded sideways in a range of 6.9252/6.9460 before closing largely unchanged at 6.9430 (+0.05%). The underlying tone still appears to be firm and we continue to see chance for USD to rise above 6.9510. The major resistance at 6.9650 is unlikely to come under threat. Support is at 6.9350, followed by 6.9250.”
Next 1-3 weeks: “We have held a positive USD view since last Thursday (20 Apr, spot at 6.8920). After USD soared to a high of 6.9509, we highlighted yesterday (26 Apr, spot at 6.9370) that ‘while upward momentum has improved further, the rally appears to be running ahead of itself and the major resistance at 6.9650 might not come into view so soon’. We continue to hold the same view. Overall, USD is expected to stay underpinned in the coming days as long as it stays above 6.8950 (no change in ‘strong support’ level).”
-
09:15
Natural Gas Futures: Corrective decline in the offing?
In light of advanced figures from CME Group for natural gas futures markets, open interest rose by around 19.5K contracts on Wednesday after seven consecutive daily drops. Volume, in the same direction, went up for the third straight session, now by more than 38K contracts.
Natural Gas: A drop to $2.00 appears on the table
Wednesday’s marked retracement in prices of the natural gas was accompanied by increasing open interest and volume. Against that, further decline appears favoured in the very near term and another visit to the $2.00 region per MMBtu should not be discarded for the time being.
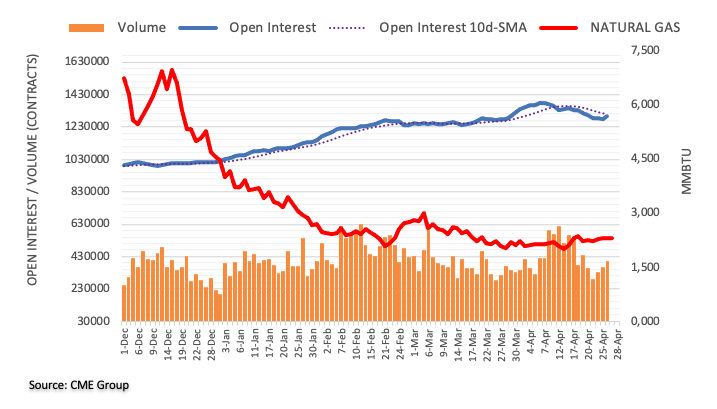
-
09:09
EUR/USD extends the recovery to the 1.1060 region ahead of data
- EUR/USD adds to Wednesday’s uptick near 1.1060.
- EMU Consumer Confidence, Economic Sentiment next on tap.
- US Flash Q1 GDP figures take centre stage across the pond.
The optimism among market participants remains firm and pushes EUR/USD back to the 1.1060/65 band on Thursday.
EUR/USD now focuses on data, US GDP
EUR/USD so far advances for the second session in a row and maintains the multi-week rally well and sound and with the immediate target now at the 1.1100 round level. It is worth noting that the pair closed with gains in 8 out of the last 9 weeks, having gained more than 5 cents since late February.
In the meantime, hawkish ECB-speak and prospects for extra interest rate hikes following the May gathering continue to underpin the bullish stance in the European currency for the time being.
Later in the euro docket, the final Consumer Confidence gauge is due seconded by Economic and Industrial Sentiment. In the US, advanced Q1 GDP Growth Rate will be in the limelight seconded by usual weekly Initial Claims and Pending Home Sales.
What to look for around EUR
EUR/USD keeps the positive performance and continues to consolidate the recent breakout of the psychological 1.1000 barrier.
Meanwhile, price action around the single currency should continue to closely follow dollar dynamics, as well as the incipient Fed-ECB divergence when it comes to the banks’ intentions regarding the potential next moves in interest rates.
Moving forward, hawkish ECB-speak continue to favour further rate hikes, although this view appears in contrast to some loss of momentum in economic fundamentals in the region.
Key events in the euro area this week: Final Consumer Confidence, Economic Sentiment (Thursday) – Euro group Meeting, Germany labour market report/ Advanced Inflation Rate/Flash Q1 GDP Growth Rate, EMU Flash Q1 GDP Growth Rate (Friday).
Eminent issues on the back boiler: Continuation (or not) of the ECB hiking cycle. Impact of the Russia-Ukraine war on the growth prospects and inflation outlook in the region. Risks of inflation becoming entrenched.
EUR/USD levels to watch
So far, the pair is gaining 0.06% at 1.1045 and the breakout of 1.1075 (2023 high April 14) would target 1.1100 (round level) en route to 1.1184 (weekly high March 21 2022). On the other hand, the initial support aligns at 1.0909 (weekly low April 17) seconded by 1.0831 (monthly low April 10) and finally 1.0788 (monthly low April 3).
-
09:00
Italy Consumer Confidence meets expectations (105.5) in April
-
09:00
Italy Business Confidence came in at 103 below forecasts (104) in April
-
08:59
USD/CAD remains on the defensive below one-month peak, downside seems cushioned
- USD/CAD edges lower on Thursday, though the downside lacks follow-through selling.
- Rebounding Oil prices underpins the Loonie and acts as a headwind amid a softer USD.
- Traders now look forward to the Advance US GDP report for short-term opportunities.
The USD/CAD pair struggles to capitalize on its recent strong recovery move from the 1.3300 mark, or a two-month low touched on April 14 and edges lower during the first half of trading on Thursday. The pair, however, manages to hold above the 1.3600 mark through the early European session and is currently placed just below a nearly one-month high touched on Wednesday.
A modest recovery in Crude Oil prices underpins the commodity-linked Loonie and acts as a headwind for the USD/CAD pair amid subdued US Dollar (USD) price action. The uptick in Oil prices, meanwhile, could be attributed to some technical buying following the recent slump to a fresh monthly low, led by looming recession fears and an increase in Russian oil exports, which offset the impact of OPEC+ production cuts.
The USD, on the other hand, continues to be weighed down by speculations about an imminent rate cut by the Federal Reserve (Fed) later this year. The expectations are being fueled by fresh concerns about banking contagion risks in the US, the debt ceiling standoff and slowing economic growth. Hence, the market focus will remain glued to the release of the Advance US Q1 GDP report, due later during the early North American session.
The growth in the world's largest economy is anticipated to have slowed to a 2.0% annualized pace during the January-March period from 2.6% in the previous quarter. Any meaningful divergence from the expected reading will be enough to infuse some volatility around the Greenback and influence the USD/CAD pair. Apart from this, Oil price dynamics should contribute to producing short-term opportunities around the major.
In the meantime, bets for another 25 bps lift-off at the next FOMC policy meeting in May remain supportive of a further rise in the US Treasury bond yields. This, in turn, acts as a tailwind for the buck and lends some support to the USD/CAD pair, warranting some caution for bearish traders and before positioning for any meaningful intraday corrective pullback.
Technical levels to watch
-
08:58
USD/JPY clings to the side-lined trading – UOB
USD/JPY is still seen navigating the 132.85-134.70 range for the time being, note UOB Group’s Economist Lee Sue Ann and Markets Strategist Quek Ser Leang.
Key Quotes
24-hour view: “Yesterday, we noted that ‘downward momentum is building’ and we expected USD to weaken. However, we held the view that ‘the major support at 132.85 is likely out of reach’. Our view was not wrong as USD dropped to 133.00 and then rebounded to close little changed at 133.66 (-0.04%). Downward pressure has faded and today, USD is likely to consolidate in a range of 133.00/134.00.”
Next 1-3 weeks: “There is not much to add to our update from yesterday (26 Apr, spot at 133.60). As highlighted, USD appeared to have entered a consolidation phase and for the time being, it is likely to trade in a range of 132.85/134.70.”
-
08:46
Crude Oil Futures: Door open to extra decline
Open interest in crude oil prices increased for the first time since April 18, now by around 36.5K contracts, on Wednesday according to preliminary readings from CME Group. In the same line, volume rose for the second consecutive session, this time by around 300K contracts, the largest single day build since April 3.
WTI filled the gap and targets $70.00
Wednesday’s sharp sell-off in prices of the WTI was on the back of rising open interest and volume, suggesting that extra losses remain on the cards in the very near term. Against that, the commodity could slip back to the $70.00 region in the relatively near future.

-
08:44
Forex Today: All eyes on US first-quarter GDP report
Here is what you need to know on Thursday, April 27:
Ahead of the US Bureau of Economic Analysis' first estimate of the first quarter Gross Domestic Product (GDP) reading, which is forecast to show an annualized expansion of 2%, the US Dollar stays relatively quiet early Thursday. The European Commission will release the business and consumer sentiment data for April and the US economic docket will also feature mid-tier data releases, including weekly Initial Jobless Claims and Pending Home Sales for March.
US GDP Q1 Preview: First estimate effect on EUR/USD.
The positive shift seen in risk sentiment mid-week following upbeat earnings reports from US tech giants made it difficult for the US Dollar (USD) to find demand. With US Treasury bond yields gaining traction in the American session and other major sectors in Wall Street struggling to attracting investors, however, the USD's losses remained limited. Meanwhile, the US House of Representatives passed a bill to raise the government's $31.4 trillion debt ceiling on Wednesday. The bill, however, is not expected to get enough votes in the Senate.
EUR/USD touched its highest level in over a year near 1.1100 on Wednesday but erased a portion of its daily gains in the late American session. The pair fluctuates in a tight channel at around 1.1050 early Thursday.
The data from New Zealand revealed that the ANZ Business Confidence Index edged lower to -43.8 in April from -43.4 in March. In the same period, the ANZ Activity Outlook Index improved slightly to -7.6% from -8.5%. Despite the mixed data, NZD/USD trades in positive territory near 0.6150 in the European morning.
GBP/USD gathered bullish momentum amid renewed USD weakness and climbed above 1.2500 for the first time in nearly two weeks on Wednesday. The pair stays in a consolidation phase below that level in the European session on Thursday.
USD/JPY tested 133.00 on Wednesday but retraced its daily decline to close above 133.50. The pair moves sideways below 134.00 on Thursday. The Bank of Japan (BoJ) is widely expected to leave its monetary policy settings unchanged on Friday.
Gold price failed to stabilize above $2,000 despite USD weakness on Wednesday as the rising US T-bond yields limited the upside. XAU/USD trades in positive territory early Thursday but is yet to make a convincing move beyond $2,000.
Bitcoin rose sharply on Wednesday but retraced the majority of its daily rally after having met resistance at $30,000. At the time of press, BTC/USD was trading modestly higher on the day slightly below $29,000. Ethereum fluctuated wildly on Wednesday but ended up closing the day flat. ETH/USD is already up more than 1% on the day on Thursday, closing in on $1,900.
-
08:34
NZD/USD: Rising odds for a move below 0.6085 – UOB
In the view of UOB Group’s Economist Lee Sue Ann and Markets Strategist Quek Ser Leang, NZD/USD risks a drop below 0.6085 in the short-term horizon.
Key Quotes
24-hour view: “We expected NZD to edge lower yesterday but we were of the view that ‘any decline is likely part of a lower range of 0.6115/0.6165’. We added, ‘a sustained decline below 0.6115 is unlikely’. Our view was not wrong as NZD edged to a low of 0.6112 before closing at 0.6115 (-0.38%). Downward momentum has waned and this coupled with oversold conditions suggests NZD is likely to weaken much further. Today, NZD is more likely to trade in a range between 0.6105 and 0.6145.”
Next 1-3 weeks: “We have held a slightly negative NZD view since early last week. In our latest narrative from three days ago (24 Apr, spot at 0.6140), we indicated that ‘While downward momentum has not increased much, NZD is likely to trade with a downward bias’. We added, ‘It remains to be seen if there is enough momentum for NZD to drop to the major support at 0.6085’. NZD dropped to a low of 0.6112 yesterday and downward momentum has increased, albeit not much. The likelihood of NZD breaking below 0.6085 has increased but it has to remain below this level before further decline to 0.6035 is likely. On the upside, a break of 0.6175 (‘strong support’ level was at 0.6200 yesterday) would indicate the current downward bias in NZD has eased.”
-
08:07
Gold Price Forecast: XAU/USD retakes $2,000 amid softer US Dollar, focus remains on US GDP
- Gold price attracts some dip-buying on Thursday amid subdued US Dollar price action.
- Rising US bond yields could limit the USD losses and act as a headwind for the XAU/USD.
- The prospects for further rate hikes by major central banks might contribute to cap gains.
Gold price regains some positive traction on Wednesday and builds on its steady intraday ascent through the early European session. The XAU/USD retakes the $2,000 psychological mark in the last hour and moves well within the striking distance of the weekly high touched the previous day.
Softer US Dollar lends some support to Gold price
The US Dollar (USD) struggles to capitalize on the overnight bounce from a nearly two-week low and remains on the defensive for the second successive day, which, in turn, is seen lending support to the Gold price. Concerns about banking contagion risks in the United States (US) resurfaced after the First Republic Bank reported more than $100 billion in customer withdrawals during the first quarter. This, along with the debt ceiling standoff and fears that the US economy is heading towards recession, fuel speculations about an imminent rate cut by the Federal Reserve (Fed) later this year and continue to weigh on the buck.
Bets for more rate hikes by major central banks could cap gains
The US central bank, however, is still expected to hike interest rates by 25 basis points (bps) at the next Federal Open Market Committee (FOMC) policy meeting in May. This remains supportive of a further rise in the US Treasury bond yields, which acts as a tailwind for the Greenback. Furthermore, the markets have been betting for more rate hikes by the European Central Bank (ECB) in the coming months and another 25 bps lift-off by the Bank of England (BoE) in May. This, in turn, might hold back traders from placing aggressive bullish bets around the non-yielding Gold price and keep a lid on any meaningful upside.
Traders now look to the US Q1 GDP report for a fresh impetus
Apart from this, a slight recovery in the global risk sentiment - as depicted by a stable performance around the equity markets - could further contribute to capping gains for the safe-haven precious metal, at least for the time being. Traders also seem reluctant and move to the sidelines ahead of the release of the Advance first-quarter US Gross domestic product (GDP) report, due later during the early North American session. The data, along with the US bond yields, will play a key role in influencing the USD price dynamics and allow traders to grab short-term opportunities around the US Dollar-denominated Gold price.
Gold price technical outlook
From a technical perspective, any subsequent move up is likely to confront some resistance near the $2,010 supply zone ahead of the $2,020 horizontal level. A sustained strength beyond the latter might trigger a short-covering move towards the $2,040 area, above which Gold price could climb to challenge the YTD peak, around the $2,047-$2,049 region touched earlier this month.
On the flip side, weakness below the $1,990-$1,988 immediate support could attract some buyers near the $1,980 level, which should help limit the downside near the $1,969 horizontal zone. Some follow-through selling will be seen as a fresh trigger for bearish traders and make the Gold price vulnerable to test the next relevant support near the $1,956-$1,955 area. The XAU/USD could eventually drop to the monthly low around the $1,950 region.
Key levels to watch
-
08:01
Spain Retail Sales (YoY): 9.5% (March) vs 4%
-
08:01
Sweden Consumer Confidence (MoM) below expectations (72.4) in April: Actual (65.1)
-
08:01
Spain Unemployment Survey came in at 13.26%, above forecasts (12.9%) in 1Q
-
08:00
Turkey Economic Confidence Index rose from previous 98.8 to 102.2 in April
-
07:57
GBP/JPY Price Analysis: Mildly bid near 167.00 within 12-day-old trading range
- GBP/JPY clings to minor gains, defends the previous day’s rebound from two-week low.
- Steady RSI, short-term trend continuation pattern suggest further grinding of prices.
- Key SMAs add to the downside filters; bulls can aim for late 2022 top on crossing 168.00.
GBP/JPY grinds higher around 167.00, near 166.85 heading into Thursday’s London open, amid sluggish markets. In doing so, the cross-currency pair remains sidelined within a fortnight-old trading range.
However, the steady RSI (14) line and the quote’s successful trading above the 100-bar Simple Moving Average (SMA), as well as the 200-SMA, keep the GBP/JPY buyers hopeful.
That said, the aforementioned trading range’s top surrounding 168.00 appears a tough nut to crack for the pair buyers to restore the market’s confidence. Following that, a run-up toward the late 2022 peak of around 169.30 can be quickly witnessed on the chart.
Though, the 170.00 round figure and the previous yearly high surrounding 172.15 cab prod the GBP/JPY buyers afterward.
On the contrary, the 100-bar SMA level of 165.95 limits intraday fall of the GBP/JPY pair ahead of the 165.50-40 support zone forming part of the previously stated range.
In a case where the cross-currency pair remains bearish past 165.40, the 200-SMA level surrounding 164.00 can act as the last defense of the GBP/JPY buyers.
It’s worth noting that the monthly low of around 162.80 and March’s bottom of near 158.30 can lure the pair bears past 164.00.
GBP/JPY: Four-hour chart
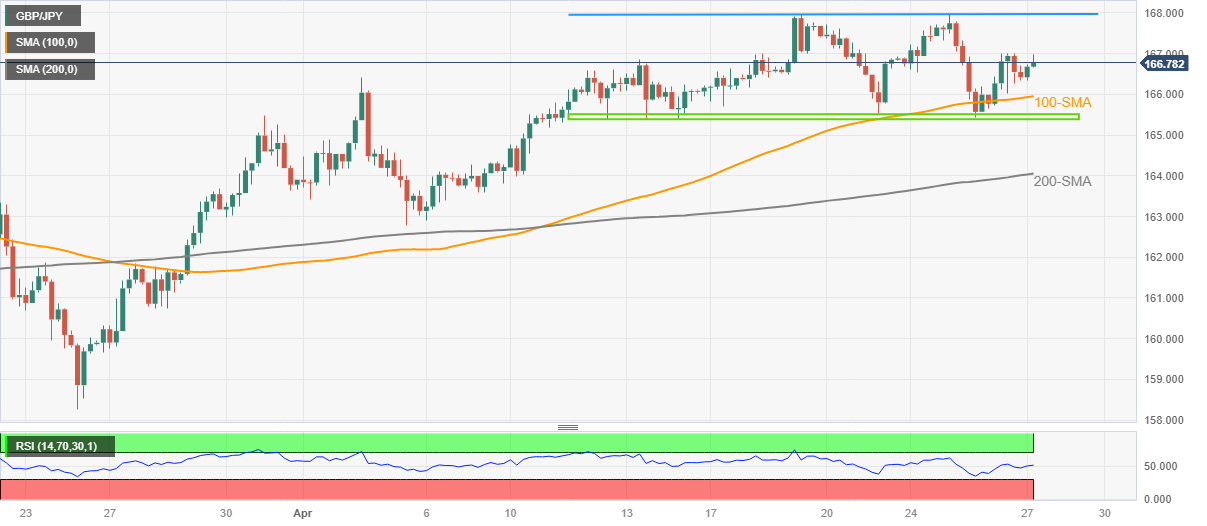
Trend: Limited upside expected
-
07:34
BoC Minutes shine light on discussion of rate hikes in April – TDS
Analysts at TD Securities (TDS) express their afterthoughts on Wednesday’s Minutes of the Bank of Canada’s (BoC) April monetary policy meeting.
Key quotes
“The Bank of Canada's Summary of Deliberations from April built on its hawkish message by outlining the argument for (and against) a rate hike in April and acknowledging that the economy was proving to be stronger than expected in January.”
“The argument to keep rates unchanged boiled down to a desire for more evidence that rates were not restrictive enough, given a similar outlook for growth and inflation. However, the Bank cited several upside risks to its outlook and also pushed back against market pricing for rate cuts in 2023.”
“We continue to look for the Bank to hold rates at 4.50% into 2024, but today's minutes should reinforce that risks are skewed towards more hikes in the near-term.”
-
07:22
USD/TRY Price News: Turkish Lira drops towards 19.50 ahead of CBRT Interest Rate Decision, US GDP
- USD/TRY picks up bids to reverse the previous day’s corrective bounce from weekly high.
- CBRT is expected to keep rates unchanged before fueling it to 24.0% in Q3 2023.
- US Q1 GDP Annualized may teases recession woes and prod the Turkish Lira bears.
USD/TRY prints mild gains around 19.42 as it consolidates the previous day’s losses amid early Thursday morning in Europe. In doing so, the Turkish Lira (TRY) pair portrays the typical contra moves ahead of the Central Bank of the Republic of Türkiye (CBRT) Interest Rate Decision and the US first quarter (Q1) Gross Domestic Product (GDP).
The Turkish Lira (TRY) cheered broad US Dollar weakness the previous day amid mixed sentiment. However, concerns about the CBRT’s status quo and geopolitical fears in the nation, mainly due to the earthquake and the next month’s general election.
As per the latest Reuters poll, “All 21 economists in the poll expect the central bank (CBRT) to keep its benchmark rate steady at 8.5% this week, its last monetary policy committee meeting before the vote.” The survey also quotes the median estimate while stating that Turkey's policy rate was seen rising to 24.0% in the third quarter.
On the other hand, Turkish President Recep Tayyip Erdogan appears to have interesting election days ahead as the earthquake raised challenges for the ruling party amid public dissent in the key province.
Elsewhere, the passage of a bill that enables the US policymakers to negotiate the extension of the debt ceiling joins the mixed US data and upbeat technology companies’ earnings to underpin cautious optimism in the market. That said, the US Durable Goods Orders rose for March but couldn’t overcome the fishy details of Consumer Confidence released previously.
However, a slump in the First Republic Bank (FRB) price and the US-China tension, as well as the Western ire over Russia, prods the sentiment and puts a floor under the USD/TRY prices.
While portraying the mood, the US stock futures print mild gains and the US Dollar Index, as well as the US Treasury bond yields, grind lower.
Moving on, the CBRT announcement is less likely to entertain the USD/TRY traders unless offering any surprise, which is less anticipated considering the recent easing in inflation and the Turkish outlook. As a result, the US Q1 GDP, expected to ease to 2.0% on an annualized basis versus 2.6% prior, will be crucial to watch for clear direction.
Technical analysis
A six-week-old bullish trend channel, currently between 19.50 and 19.20, keeps USD/TRY buyers hopeful even as RSI conditions suggest that the pair buyers are running out of fuel.
-
07:20
Gold Futures: Extra losses in the pipeline
CME Group’s flash data for gold futures markets noted traders added around 5.4K contracts to their open interest positions on Wednesday, maintaining the recent choppiness well in place. Volume followed suit and increased by the second session in a row, now by nearly 108K contracts.
Gold faces further consolidation
Gold prices dropped modestly on Wednesday on the back of rising open interest and volume. That said, while further weakness should not be ruled out in the very near term, the consolidative mood is seen prevailing for the time being.
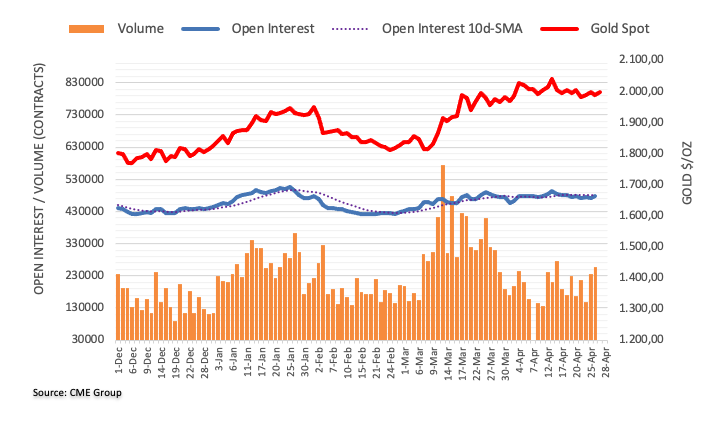
-
07:14
FOMC to hike 25 bps, future policy decisions “adaptive” – ANZ
Analysts at Australia and New Zealand (ANZ) Banking Group offer their expectations on the US Federal Reserve (Fed) monetary policy decision due to be announced next Wednesday.
Key quotes
“We expect the FOMC will raise rates by 25bp when it meets next week. That would leave the target ceiling for fed funds at 5.25% and effective fed funds in line with the median (and end 2023) dot plot of 5.10%.”
“Our baseline forecast is for one more 25bp rate rise to 5.50%. With respect to the bigger picture, however, the tightening cycle may be nearing its conclusion. We expect future rate decisions to be determined meeting-by-meeting.”
“Our GDP estimates expect the lagged effects of last year’s rate rises to bite more deeply in Q2. We expect consumption and labour market growth to moderate. However, core services inflation ex-shelter may take time to ease.”
“Bank solvency is an issue that the FOMC will factor into its deliberations. It is imperative that inflation is brought under control to protect the value of bank assets. We expect fed funds to hold steady in H2 2023 to squeeze inflation.”
-
07:14
GBP/USD: Extra gains look likely above 1.2550 – UOB
GBP/USD could advance on a more sustainable fashion once 1.2550 is cleared, suggest UOB Group’s Economist Lee Sue Ann and Markets Strategist Quek Ser Leang.
Key Quotes
24-hour view: “Our view for GBP to drop further was incorrect as it rebounded strongly and retraced more than Tuesday’s entire drop (to a high of 1.2516). Despite the advance, there is no significant increase in momentum and instead of strengthening much further, GBP is more likely to trade sideways in 1.2420/1.2520 range.”
Next 1-3 weeks: “Yesterday (26 Apr, spot at 1.2415), we highlighted that ‘while the downward risk is beginning to build, GBP has to break and stay below 1.2345 before a sustained decline is likely’. We added, ‘the chance of GBP breaking clearly below 1.2345 will increase as long as it stays below 1.2490 in the next few days’. We did not expect the strong bounce that took out our ‘strong resistance’ level of 1.2490 (high of 1.2516). Despite the advance, upward momentum has not improved much. In order to advance in a sustained manner, GBP has to break and stay above 1.2550. The likelihood of GBP breaking clearly above 1.2550 will remain intact as long as it does move below 1.2370. Looking ahead, the next resistance level above 1.2550 is at 1.2665.”
-
07:12
GBP/USD Price Analysis: Needs acceptance above 1.2500 for a fresh rally
- GBP/USD has rebounded firmly amid an absence of recovery signs in the auction of the USD Index.
- Investors are ignoring US banking woes and are cheering upbeat quarterly results from the US tech firms, portraying a risk-on mood.
- UK’s new-home buyers market is declining as higher interest rates are making interest obligations less affordable.
The GBP/USD pair has delivered a breakout of the consolidation formed in a range of 1.2453-1.2477 in the early London session. The Cable has rebounded firmly amid further correction by the US Dollar Index (DXY).
S&P500 futures have added significant gains in the Asian session as investors are ignoring fears of US banking and are cheering upbeat quarterly results from United States technology companies. Market mood is improving as the Federal Reserve (Fed) is expected to sound neutral on interest rate guidance after an interest rate hike of 25 basis points (bps).
On the Pound Sterling front, higher interest rates by the Bank of England (BoE) are creating more trouble for households. Persimmon, United Kingdom’s largest domestic property developer, said on Wednesday, the new-home buyers market is declining as higher interest rates are making interest obligations less affordable.
GBP/USD is gyrating in the 200-pip range for more than two weeks. The upside of the Cable is restricted by resistance plotted from April 14 high at 1.2545 while the downside is being supported near April 10 low at 1.2344. The asset is auctioning above the 20-period Exponential Moving Average (EMA) at 1.2463, however, the lack of upside momentum indicates that the upside bias is not strong enough.
Meanwhile, the Relative Strength Index (RSI) (14) has dropped into the 40.00-60.00 range, which conveys that investors are awaiting a critical trigger for further moves.
A decisive move above April 14 high at 1.2545 will drive the asset towards a fresh 10-month high at 1.2597, which is 08 June 2022 high. A breach of the latter will expose the asset to May 27 high at 1.2667.
On the flip side, a slippage below April 10 low at 1.2345 will expose the asset to March 30 low at 1.2294 followed by March 27 low at 1.2219.
GBP/USD two-hour chart
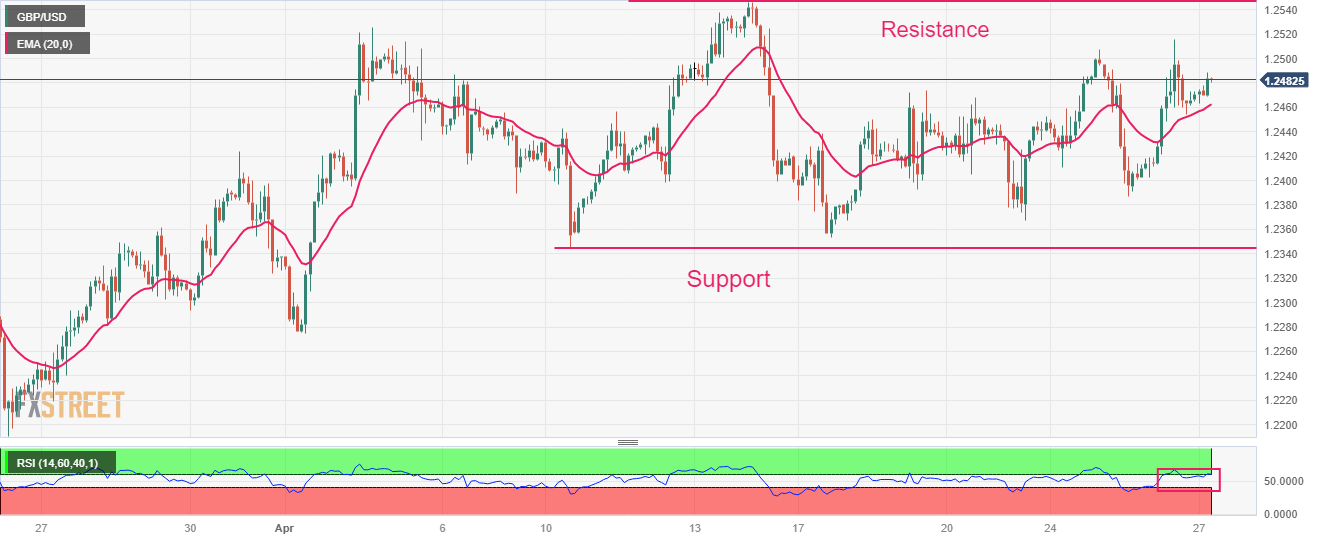
-
07:02
Norway Credit Indicator below forecasts (5.4%) in March: Actual (5.2%)
-
07:02
Norway Retail Sales came in at 0%, below expectations (0.3%) in March
-
07:00
US GDP Q1 Preview: First estimate effect on EUR/USD
- US GDP is forecast to grow at an annual rate of 2.0% in the first quarter of 2023.
- The US Dollar value will probably continue to be determined by risk perception.
- After data released by the US Bureau of Economic Analysis, markets will pay close attention to Q1 earnings reports.
The Gross Domestic Product (GDP) report for the first quarter of 2023, as released by the US Bureau of Economic Analysis (BEA) on April 27th, is expected to show an expansion of the US economy at an annualized rate of 2.0%, after the 2.6% growth recorded in the GDP report for the fourth quarter of 2022.
The US Dollar (USD) has been weakening against its major rivals since early March after the collapse of the Silicon Valley Bank reminded markets of the negative impact of the Federal Reserve’s (Fed) tight monetary policy on the financing conditions. The GDP report will provide fresh clues regarding the state of the United States economy in early 2023 and drive the US Dollar’s action by influencing the market pricing of the Fed’s policy outlook.
US Gross Domestic Product forecast: What numbers could tell us
Thursday's US economic docket highlights the release of the preliminary GDP print for the first quarter, scheduled at 12:30 GMT. The first estimate is expected to show that the world's largest economy expanded by 2.0% at an annualized pace during the January-March period.
Yohay Elam, FXStreet Senior Analyst, thinks markets will pay close attention to the severity of the slowdown in the first quarter’s economic activity.
“There is no doubt that the US economy is slowing, but the pace matters. A deceleration to 2% would be the sweet spot for markets – ongoing expansion without fears of an imminent recession,” Elam explains. “It would represent a return to the "new normal" GDP growth figures that characterized the post-financial crisis era. Conversely, a faster clip would stoke fears of further rate hikes by the Fed, while slower growth would raise recession angst. The middle 2% would be Goldilocks for markets and adverse for the US Dollar.”
When is GDP report released and how can it affect EUR/USD?
The GDP report is scheduled for release at 12:30 GMT on Thursday. The US Dollar stays dangerously close to multi-month lows against the Euro ahead of this data amid diverging policy outlooks between the European Central Bank (ECB) and the Fed.
Although the backward-looking data might do little to influence market expectations about the Fed's next policy move, it could revive fears over the US economy tipping into recession later in the year. In that scenario, the Fed “policy pivot” narrative could gain traction and force the USD to stay on the back foot. That said, an upward surprise of the US GDP print could revive expectations about the Fed staying focused on battling inflation and help the Greenback stage a rebound, at least with the initial reaction.
According to the CME Group FedWatch Tool, markets are nearly fully pricing in one more 25 basis points (bps) Fed rate hike at the May 2-3 policy meeting but seeing a more than 80% probability that there will be an at least one 25 bps rate cut by September policy meeting.
Eren Sengezer, Senior Analyst at FXStreet, shares his technical outlook for EUR/USD: “The Relative Strength Index (RSI) indicator on the daily chart stays near 60, suggesting that EUR/USD has more room on the upside before turning technically overbought. Additionally, the gap between 20-day Simple Moving Average (SMA) and the 50-day SMA continues to widen following the bullish cross seen in early April, supporting the bullish view.”
Eren also points out the key technical levels for the pair: “1.1100 (psychological level) aligns as next resistance for the pair ahead of 1.1160 (static level from March 2022). With a daily close above the latter, the pair could face interim resistance at 1.1200 (psychological level, static level) before targeting 1.1300 (psychological level, static level). On the downside, 1.1000 (20-day SMA, psychological level) forms first support ahead of 1.0900 (static level) and 1.780/1.0760 area (50-day SMA, 100-day SMA).
US GDP-related content
- EUR/USD Outlook: Ascending trend-channel favours bulls, US GDP awaited
- Gold Price Forecast: XAU/USD awaits a range breakout and US Q1 GDP
- Meta beats forecasts as focus shifts to US Q1 GDP
About US Gross Domestic Product
The Gross Domestic Product Annualized, released by the US Bureau of Economic Analysis, shows the monetary value of all the goods, services and structures produced within the United States in a quarter. GDP Annualized is a gross measure of market activity because it indicates the pace at which a country's economy is growing or decreasing. Generally speaking, a high reading or a better-than-expected number is seen as positive for equities, while a low reading is negative.
-
06:51
WTI crude oil pares the biggest daily loss in six weeks above $74.00 with eyes on US GDP
- WTI crude oil portrays corrective bounce at four-week low.
- US Dollar rebound, recession woes drowned the black gold previously despite higher inventory draw.
- US GDP, risk catalysts eyed for clear directions amid bearish concerns about energy benchmark.
WTI crude oil licks its wounds at a monthly low surrounding $74.00, mildly bid near $74.45 heading into Thursday’s European session, as markets brace for the US first quarter (Q1) Gross Domestic Product (GDP). In doing so, the black gold snaps a two-day downtrend while consolidating the biggest daily loss in 1.5 months.
That said, the energy benchmark’s latest rebound could be linked to the downbeat US Dollar and cautious optimism in the market. However, anxiety ahead of the key US data prods the Oil buyers.
The energy benchmark’s previous day’s fall could be linked to the US Dollar’s corrective bounce off the lowest levels in two weeks, as well as the risk-off mood in the market. It’s worth noting that the quote’s weakness ignored price-positive stockpile data from the US Energy Information Administration (EIA), as well as from the industry source American Petroleum Institute (API).
It should be noted that the recent concerns surrounding the US-China tussle and Russia’s hard stand appear challenging the Oil bears. Earlier in the day, China’s Industrial Profits also improved and allowed WTI to pause the previous downside.
That said, comments from US Commerce Secretary Gina Raimondo renewed fears about the geopolitical tension among the world’s top two economies. “Chinese cloud computing companies like Huawei Cloud and Alibaba Cloud could pose a threat to US security,’ Said US Commerce Secretary Raimondo per Reuters. The policymaker also vowed to review a request to add them to an export control list reported the news.
Elsewhere, Russian Deputy Prime Minister Alexander Novak shrugged off challenges to Moscow due to Western sanctions and energy price caps on Wednesday. The policymaker also praised OPEC+ as he said, “Without OPEC and its allies (OPEC+), there are risks to energy security.”
On a different page, upbeat earnings from Microsoft and Google’s parent Alphabet Inc. allowed Nasdaq to remain firmer. However, the escalating fears from the First Republic Bank (FRB), due to another 20% share price fall on Wednesday following a 50% slump the previous day, weigh on the sentiment and prod the Oil buyers.
Against this backdrop, the US stock futures print mild gains and the US Dollar Index, as well as the US Treasury bond yields, grind lower.
Looking forward, recession woes highlight today’s US Q1 GDP figures and hence any negative surprise could weigh on the WTI crude oil price.
Technical analysis
A clear downside break of 100-DMA keeps WTI crude oil bears hopeful of revisiting February’s low of $72.50.
-
06:51
FX option expiries for Apr 27 NY cut
FX option expiries for Apr 27 NY cut at 10:00 Eastern Time, via DTCC, can be found below.
- EUR/USD: EUR amounts
- 1.0900-10 1b
- 1.0975 600m
- 1.1000 1b
- 1.1040 1b
- 1.1125 878m
- GBP/USD: GBP amounts
- 1.2390 396m
- 1.2410 246m
- 1.24250-40 671m
- USD/JPY: USD amounts
- 133.00 786m
- 133.20-35 1.1b
- 133.50 304m
- 134.00 618m
- 135.00 1.4b
- USD/CHF: USD amounts
- 0.8900 400m
- 0.9000 684m
- USD/CAD: USD amounts
- 1.3565-75 921m
- 1.3625 232m
-
06:47
EUR/USD Price Analysis: Aims to capture 1.1100 as USD Index eyes more downside
- EUR/USD has demonstrated a decent recovery after building a base around 1.1040 as USD Index corrects further.
- German income expectations returning to pre-pandemic levels are improving consumer sentiment.
- Persistent Eurozone core inflation will create more troubles for the ECB.
The EUR/USD pair has rebounded after building a base around 1.1040 in the early European session. The major currency pair is aiming to capture the critical resistance of 1.1100 for the first time in the past year. The upside bias for the shared currency pair is getting strengthened as the US Dollar index (DXY) is expected to correct further.
The USD Index has reported some losses in the Asian session as investors are worried that approval of a higher debt ceiling proposal would downgrade the long-term rating of the United States.
On the Eurozone front, income expectations returning to pre-pandemic levels due to higher wages and lower energy prices is improving German consumer sentiment, said GfK consumer expert Rolf Buerklas reported by Reuters.
This may create more troubles for the European Central Bank (ECB) as core inflation will continue to remain persistent.
EUR/USD is trading in the critical supply zone placed in a narrow range of 1.1033-1.1074 on a four-hour scale. The Euro has driven the shared currency pair to the supply zone in the Rising Channel chart pattern in which every pullback is capitalized by investors as a buying opportunity.
Upward-sloping 20-period Exponential Moving Average (EMA) at 1.1020 indicates that the short-term trend is extremely solid.
Also, the Relative Strength Index (RSI) (14) is on the verge of shifting into the bullish range of 60.00-80.00.
The major currency pair is in the driving seat and will capture more gains after decisively surpassing the round-level resistance of 1.1100. An occurrence of the same will drive the asset towards a fresh 13-month high at 11.85, which is 31 March 2022 high followed by 28 February 2022 high at 1.1246.
On the flip side, a downside move below April 12 low at 1.0915 will drag the asset toward April 10 low at 1.0837 and April 03 low at 1.0788.
EUR/USD four-hour chart
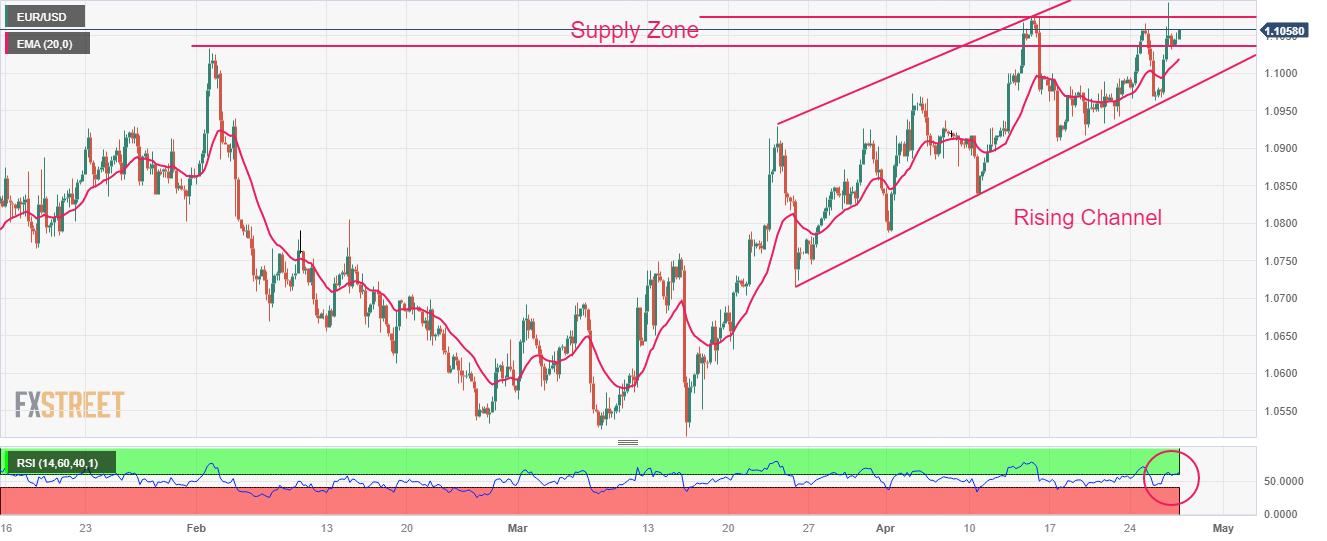
-
06:39
USD Index treads water near 101.30 ahead of key data
- The index trades within a narrow range around 101.30.
- Further weakness is expected to meet support at the 101.00 region.
- Flash Q1 GDP figures, weekly Claims take centre stage later.
The greenback, when tracked by the USD Index (DXY), alternates gains with losses around the 101.30 on Thursday.
USD Index looks at data, risk appetite
The weekly decline in the index seems to have met some initial contention around the 101.00 neighbourhood amidst persistent bias towards the risk complex and a tepid bounce in US yields across the curve.
In the meantime, the Dollar attempts to stabilize in the lower end of the weekly range against the backdrop of a strong improvement in the sentiment around the risk-associated assets and a broad consolidation in place since the beginning of April.
Data wise in the US, the release of advanced Q1 GDP Growth Rate will be in the centre of the debate along with usual Initial Claims and Pending Home Sales.
What to look for around USD
The dollar remains under pressure and trades close to the weekly support in the 101.00 zone.
Looking at the broader picture, the index continues to navigate in a consolidative phase against steady expectations of another rate increase in May by the Fed.
In favour of a pivot in the Fed’s hiking cycle following the May event appears the persevering disinflation and nascent weakness in some key fundamentals.
Key events in the US this week: Flash Q1 GDP Growth Rate, Initial Jobless Claims, Pending Home Sales (Thursday) – PCE/Core PCE, Employment Cost, Personal Income, Personal Spending, Final Michigan Consumer Sentiment (Friday).
Eminent issues on the back boiler: Persistent debate over a soft/hard landing of the US economy. Terminal Interest rate near the peak vs. speculation of rate cuts in 2024. Fed’s pivot. Geopolitical effervescence vs. Russia and China. US-China trade conflict.
USD Index relevant levels
Now, the index is losing 0.13% at 101.30 and the breach of 100.78 (2023 low April 14) would open the door to 100.00 (psychological level) and finally 99.81 (weekly low April 21 2022). On the other hand, the next hurdle emerges at 102.80 (weekly high April 10) followed by 103.05 (monthly high April 3) and then 103.17 (55-day SMA).
-
06:26
USD/JPY Price Analysis: Yen pair stays defensive below 134.00 within bullish channel
- USD/JPY struggles to defend the bounce off 100-SMA around one-week low.
- Convergence of one-week-old resistance line and ascending trend line from early April appears crucial resistance.
- Sellers need to defy five-week-old rising channel to retake control.
- Sluggish oscillators, failure to rebound keeps Yen pair sellers hopeful.
USD/JPY treads water around 133.70 as it fades late Wednesday’s corrective bounce from a fortnight’s low during early Thursday in Europe. In doing so, the Yen pair fades rebound from the 100-SMA while justifying the early-week break of an upward-sloping trend line from April 05, now immediate resistance.
Apart from the trend line break, downbeat MACD signals and steady RSI also keeps Yen pair sellers hopeful.
However, a clear downside break of the 100-SMA level of 133.40 becomes necessary to convince sellers. Even so, the bottom line of the five-week-old ascending trend channel, close to 132.40 as we write, challenges the USD/JPY bears.
In a case where the Yen pair remains bearish past 132.40, the odds of witnessing a gradual downturn towards the monthly bottom of 130.63 and then to the late March swing low of near 129.65 can’t be ruled out.
Meanwhile, recovery moves need to cross the 134.45-50 resistance confluence to convince short-term buyers of the USD/JPY pair. A downward-sloping trend line from April 19 joins the three-week-long previous support line to highlight the stated hurdle.
Should the pair buyers keep the reins past 134.50, the previously mentioned channel’s top line, close to 135.55 at the latest, can act as the last defense of the USD/JPY bears.
USD/JPY: Four-hour chart
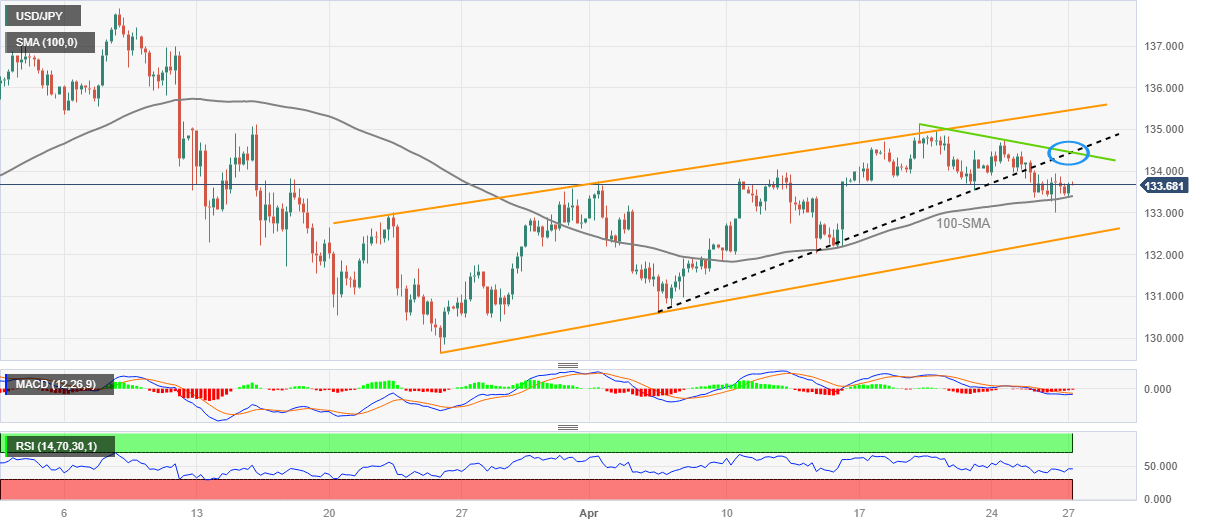
Trend: Further downside expected
-
06:22
EUR/USD: Dwindling bets for a sustained move above 1.1120 – UOB
A move beyond 1.1120 in EUR/USD appears not favoured for the time being according to UOB Group’s Economist Lee Sue Ann and Markets Strategist Quek Ser Leang.
Key Quotes
24-hour view: “We did not anticipate EUR to strengthen yesterday as it popped to a fresh 2-year high of 1.1095 before easing off to close at 1.1040 (+0.62%). The rapid rise appears to be overdone and EUR is unlikely to advance much further. Today, EUR is more likely to trade in a range, likely between 1.1000 and 1.1100.”
Next 1-3 weeks: “Yesterday (26 Apr, spot at 1.0975), we highlighted that ‘instead of advancing, EUR is more likely to trade in a range for now, expected to be between 1.0900 and 1.1050’. However, EUR lifted off and soared above 1.1050 (high of 1.1095) before closing on a firm note at 1.1040 (+0.62%). Despite the relatively strong advance, upward momentum has not improved much. That said, EUR could ratchet higher upwards 1.1120. At this stage, the odds for a sustained rise above this level are not high. In order to keep the momentum going, EUR should not break below 1.0950 (‘strong support’ level).”
-
06:11
Asian Stock Market: Moderately positive as market sentiment improves, oil juggles, BoJ policy in focus
- Asian stocks are moderately positive supported by bumper earnings from US technology stocks.
- Investors are keenly awaiting more developments on US debt-ceiling proposal for further guidance.
- Chinese stocks are showing some strength despite the US said that Chinese cloud computing companies could pose a threat to US security.
Markets in the Asian domain are moderately positive driven by bumper quarterly earnings data from United States technology stocks. A recovery move in the S&P500 futures after a sell-off on Wednesday has improved the risk appetite of the market participants. US equities basket ended Wednesday’s session on a negative note as fears of banking woes after a statement from the First Republic Bank that the US government was reluctant to provide advances despite declining deposits outweighed solid tech earnings.
Investors are keenly awaiting more developments on US debt-ceiling proposal for further guidance. A higher debt-ceiling proposal would force credit rating agencies to downgrade United States’ long-term credit rating, which could have a negative impact on the US Dollar and US equities.
At the press time, Japan’s Nikkei 225 and Hang Seng remains flat, ChinaA50 gained 0.17% and Nifty50 added 0.12%.
Chinese stocks are showing some strength despite U.S. Commerce Secretary Gina Raimondo saying on Wednesday that Chinese cloud computing companies like Huawei Cloud and Alibaba Cloud could pose a threat to U.S. security and vowed to review a request to add them to an export control list, as reported by Reuters. This may impact the revenue guidance of some Chinese tech companies ahead.
Meanwhile, Japanese equities are choppy ahead of the interest rate decision by the Bank of Japan (BoJ), which is scheduled for Friday. A continuation of ultra-loose monetary policy is expected from BoJ Governor Kazuo Ueda who is making efforts for keeping the inflation rate steadily above 2%.
On the oil front, oil prices failed to capitalize on the higher-than-anticipated drawdown in oil inventories reported by the US Energy Information Administration (EIA) for the week ending April 21. Deepening fears of a global slowdown ahead of a fresh leg of the rate hike cycle from Western central banks have weighed heavily on the oil price.
-
06:02
Japan Coincident Index below forecasts (99.2) in February: Actual (98.6)
-
06:01
Japan Leading Economic Index came in at 98, above expectations (97.7) in February
-
05:56
NZD/USD rebound approaches 0.6150 on mixed NZ data and PM Hipkins’ comments, US GDP eyed
- NZD/USD picks up bids to refresh intraday high, snaps two-day downtrend at six-week low.
- ANZ sentiment figures for April came in mixed, NZ PM Hipkins promises no extra tax in upcoming budget.
- Chatters about US debt ceiling, First Republic Bank and US-China tension prod bulls.
- US Q1 GDP needs to print downbeat figures to defend Kiwi pair’s latest recovery.
NZD/USD marches to 0.6140 heading into Thursday’s European session, extending the previous rebound from a six-week low to snap a two-day downtrend. In doing so, the Kiwi pair cheers the broad US Dollar weak amid mixed catalysts at home.
Earlier in the day, the Australia and New Zealand Banking Group (ANZ) released monthly figures for New Zealand’s (NZ) Activity Outlook and Business Confidence for April. While the former improved to -7.6% from -8.5%, versus -8.9% prior, the latter plummets to -43.8 compared to analysts’ estimation and previous readings of -43.4.
On the other hand, NZ Prime Minister Chris Hipkins said, “There will be no new tax everyone would have had to pay, like a cyclone levy, to fund the recovery,” per Stuff New Zealand.
It should be noted that the passage of a bill that enables the US policymakers to negotiate the extension of the debt ceiling joins the mixed US data and upbeat technology companies’ earnings to underpin cautious optimism in the market. That said, the US Durable Goods Orders rose for March but couldn’t overcome the fishy details of Consumer Confidence released previously.
Alternatively, fears of the US recession, banking sector fallout and the Sino-American tension prod the NZD/USD buyers. While the recently mixed US data and the odds of the Fed’s higher for longer rates keep the economic slowdown fears on the table, a slump in the First Republic Bank (FRB) price roils the mood. Further, comments from US Commerce Secretary Gina Raimondo renewed fears surrounding the US-China tussle. “Chinese cloud computing companies like Huawei Cloud and Alibaba Cloud could pose a threat to US security,’ Said US Commerce Secretary Raimondo per Reuters. The policymaker also vowed to review a request to add them to an export control list reported the news.
While portraying the mood, US Treasury bond yields remain directionless, grinding lower of late, whereas the S&P 500 Futures print mild gains around 4,080 by the press time, following a mixed close of Wall Street
Looking forward, the US first quarter (Q1) Gross Domestic Product (GDP), expected to ease to 2.0% on an annualized basis versus 2.6% prior, becomes crucial for the NZD/USD traders to watch amid receding hawkish concerns about the Reserve Bank of New Zealand (RBNZ).
Technical analysis
A three-week-old descending resistance line, around 0.6160 by the press time, restricts the short-term upside of the Kiwi pair amid bearish MACD signals. That said, an upward-sloping support line from mid-November 2022, close to 0.6095, becomes crucial for the NZD/USD bears to watch for tightening the grip.
-
05:31
Gold Price Forecast: XAU/USD surpasses $2,000 firmly as US debt talks and Fed policy come into limelight
- Gold price has extended its solid recovery above $2,000.00 amid US debt-ceiling talks.
- A higher debt-ceiling proposal would force credit rating agencies to downgrade US’ long-term credit rating.
- US annualized GDP data is expected to slow down to 2.0% from the prior pace of 2.6%.
Gold price (XAU/USD) has stretched its recovery strongly above the psychological resistance of $2,000.00 in the Asian session. The precious metal is getting acceptance above $2,000.00 as investors are anticipating a neutral stance on interest rate guidance from the Federal Reserve (Fed) in its May monetary policy meeting after a consecutive 25 basis point (bp) interest rate hike.
Apart from that, the catalyst that is strengthening the gold price is the debt ceiling talks. Political drama for the US debt ceiling is escalating for raising it. A higher debt-ceiling proposal would force credit rating agencies to downgrade United States’ long-term credit rating, which could have a negative impact on the US Dollar and US equities. This is why the appeal for the Gold is gaining strength.
The US Dollar Index (DXY) has witnessed some buying interest after a gradual correction to near 101.35. Investors are expecting sheer volatility in the USD Index ahead of the Gross Domestic Product (GDP) (Q1) data. As per the consensus, annualized GDP data is expected to slow down to 2.0% from the prior pace of 2.6%.
On Wednesday, weak core capital goods orders due to higher interest rates from the Federal Reserve (Fed) deepened fears of an economic slowdown. Firms have postponed their expansion plans due to higher interest obligations. This might force Fed chair Jerome Powell to consider neutral guidance.
Gold technical analysis
Gold price is auctioning in a neutral triangle pattern, which indicates a sheer decline in volatility. The upward-sloping trendline plotted from March 22 low at $1,934.34 is providing cushion while the upside is capped from the trendline placed from April 17 high at $2,012.92.
The 20-period Exponential Moving Average (EMA) at $1,994.17 is overlapping the Gold price, indicating a consolidation.
Also, the Relative Strength Index (RSI) (14) is oscillating in the 40.00-60.00, conveying that the release of the US GDP might conclude the lackluster performance.
Gold two-hour chart
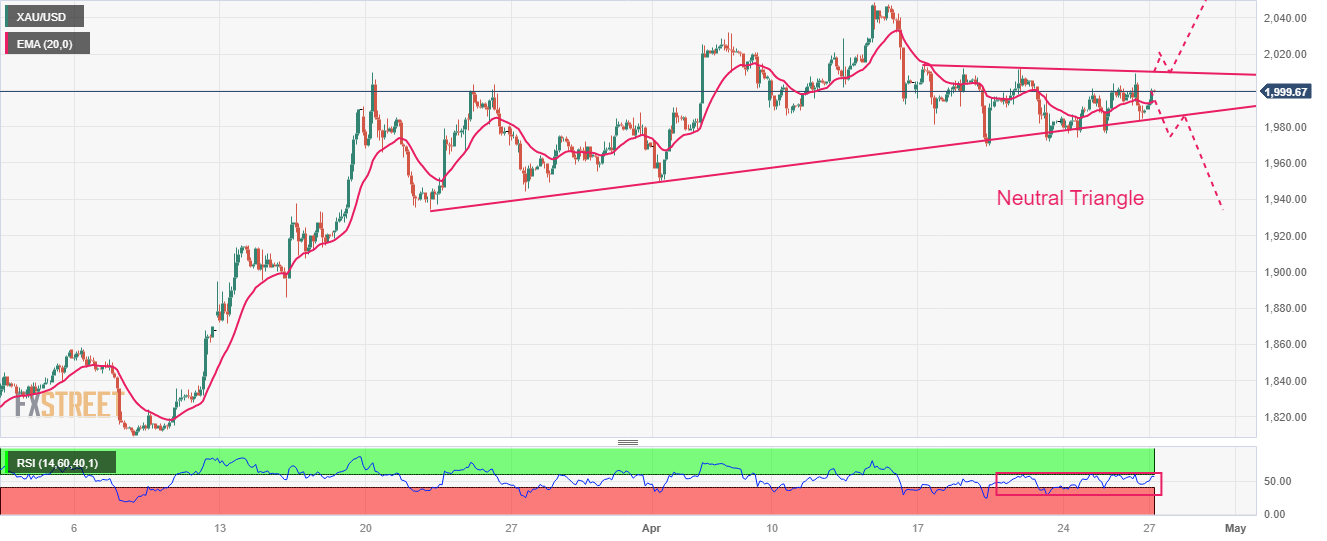
-
05:24
AUD/USD clings to mild gains around 0.6600 amid banking fears, anxiety ahead of US GDP
- AUD/USD struggles to extend recovery from six-week low amid indecisive markets ahead of the key US data.
- Mixed sentiment and Australia inflation clues also challenge momentum traders of the Aussie pair.
- Headlines surrounding US debt ceiling, First Republic Bank will join US Q1 GDP release to direct intraday AUD/USD moves.
AUD/USD remains mildly bid around 0.6610, defensive of late, as buyers struggle to extend the previous rebound from the 1.5-month low amid cautious mood heading into Thursday’s European session. In doing so, the Aussie pair justifies mixed sentiment in the market, as well as mixed inflation clues at home, as traders await the US first quarter (Q1) Gross Domestic Product (GDP), expected to ease to 2.0% on an annualized basis versus 2.6% prior.
Earlier in the day, Australian Bureau of Statistics (ABS) released the Q1 Export and Import Price Index figures and failed to ward off the dovish bias surrounding the Reserve Bank of Australia’s (RBA), amplified after the previous day’s softer Aussie Consumer Price Index (CPI) releases. That said, the Export Price Index rose to 1.6% QoQ in Q1 2023 from -0.9% prior but eased beneath the 1.9% forecasts whereas the Import Price Index slumped by -4.2% versus 3.6% market expectations and 1.8% prior.
Elsewhere, market sentiment remains dicey amid mixed feelings about the US default, banking sector health and for the Q1 GDP.
Late on Wednesday, the US House of Representatives passed a bill that enables the government to negotiate the extension of the debt ceiling. However, the policymakers are likely to remain at loggerheads amid the wide difference between the Republicans' and Democrats’ demands. With this, the cautious optimism surrounding the US debt ceiling discussions keeps the Aussie pair firmer. Furthermore, the latest tax receipt numbers from the US allow Goldman Sachs (GS) to expect that the US Treasury Department can avoid the risk of a federal payments default till late July, which in turn puts a floor under the prices.
On a different page, upbeat earnings from Microsoft and Google’s parent Alphabet Inc. allowed Nasdaq to remain firmer. However, the escalating fears from the First Republic Bank (FRB), due to another 20% share price fall on Wednesday following a 50% slump the previous day, weigh on the sentiment.
It should be noted that comments from US Commerce Secretary Gina Raimondo renewed fears surrounding the US-China tussle. “Chinese cloud computing companies like Huawei Cloud and Alibaba Cloud could pose a threat to US security,’ Said US Commerce Secretary Raimondo per Reuters. The policymaker also vowed to review a request to add them to an export control list reported the news.
Looking forward, the US GDP numbers will be crucial for market players to watch for clear directions amid recession woes. Following that, Friday’s Core PCE Price Index details, the Fed’s preferred inflation gauge, could entertain traders ahead of the next week’s Federal Open Market Committee (FOMC).
Technical analysis
Sustained upside break of the seven-week-old previous support line, around 0.6655 by the press time, becomes necessary for the AUD/USD pair traders to push back the odds favoring a downside targeting the Year-To-Date (YTD) low, currently around 0.6565.
-
05:10
NZ PM Hipkins: Budget will be “no frills” and ‘orthodox’
Prime Minister Chris Hipkins has ruled out a special levy to pay for the cyclone rebuild in what he says will be a “no frills” and “orthodox” Budget handed down on May 18, containing “no major new tax changes”, reported New Zealand media early Thursday.
NZ PM spoke at the Employers and Manufacturers Association per the Stuff New Zealand.
Additional comments
There will be no new tax everyone would have had to pay, like a cyclone levy, to fund the recovery.
This will be an orthodox no-frills Budget focused on funding the things most important to New Zealanders like support with the cost of living and cyclone recovery.
There will also not be any major new tax changes like a wealth tax or CGT.
Treasury estimates of the cost of the rebuild form the Auckland floods and cyclone Gabrielle between $9 billion and $14.5 billion of asset damage.
A key message of this Budget is restraint.
In a cost-of-living crisis, now is not the time to be asking Kiwis to pay more though a levy for cyclone repair costs.
The reality is the Government was previously doing too much, too fast, and the effect of that was being tied up with issues taking time and money away from where our primary focus needed to be.
Times are tough for many people right now.
Family budgets are tight and many are going without.
I know that business is doing what it can to absorb increasing costs and not pass these onto your customers.
But with increasing input costs, supply chains under pressure, and an unstable global picture, there comes a point at which you have no choice but to increase your prices.
Also read: NZD/USD Price Analysis: Time for a bumpy ride ahead below 0.6100 ahead of US GDP
-
04:47
USD/INR Price News: Defends downside near 81.70, investors brace volatility ahead of US GDP
- USD/INR is hovering near a 10-day low of 81.65 as weaker oil prices have supported the Indian rupee.
- The USD Index has gradually corrected amid an improvement in market sentiment.
- Lower US GDP data will strengthen the case for neutral interest rate guidance from the Fed.
The USD/INR pair is auctioning near a 10-day low of 81.65 in the Asian session. The major is expected to remain on the tenterhooks as investors are shifting their focus towards the release of the United States Gross Domestic Product (GDP) (Q1). The pace in contraction or expansion of growth rate will guide investors about the likely monetary policy action by the Federal Reserve (Fed) for the meeting scheduled next week.
S&P500 futures have added gains in the Tokyo session despite a sell-off on Wednesday. Investors should be aware of the fact that the 500-US stock basket was also positive after a bearish Tuesday’s session, which indicates that the upside is critically capped. This also, indicates that investors are utilizing pullbacks as a bargain-selling opportunity.
The US Dollar Index (DXY) has corrected gradually to near 101.36 after failing to extend the rally. It seems that a mild improvement in the risk appetite of the market participants is barricading the USD Index from resuming the upside move. Also demand for US government bonds has dropped which has fueled yields. The 10-year US Treasury yields have climbed above 3.44%.
On the economic data front, the US GDP data is expected to land at 2.0% lower than the former release of 2.6%. The anticipated landing of US GDP will bolster the case of neutral interest rate guidance from the Fed for its May monetary policy meeting as a rate hike of 25 basis points (bps) is widely expected.
Meanwhile, the Indian Rupee will show a power-pack action on Friday amid the release of the Fiscal Deficit data. For now, weaker oil prices have strengthened the Indian rupee. It s worth noting that India is one of the leading importers of oil in the world and lower oil prices will strengthen India’s current account and henceforth will strengthen the Indian rupee.
-
04:15
USD/MXN aims to extend rally above 18.20 as focus shifts to US GDP
- USD/MXN is looking to extend its rally above 18.20 despite the further correction in the USD Index.
- Scrutiny of the US Durable Goods Orders data shows that the majority of orders were for commercial aircraft.
- The annualized US GDP data is expected to land lower at 2.0% from the former release of 2.6%.
The USD/MXN pair is hovering near a two-week high of 18.19 in the Asian session. The major is showing strength despite further correction in the US Dollar Index (DXY). The USD Index has extended its correction to near 101.35 as investors’ risk appetite is displaying some recovery.
S&P500 futures have added some decent gains in the Asian session. US equities were a mixed bag on Wednesday as technology stocks outperformance other sectors. Upbeat earnings from Microsoft and Mea platforms strengthened NASDAQ while weak earnings performance from the manufacturing and capital goods sector capped the upside of the S&P500.
Blame from the First Republic Bank on the US government for being reluctant in providing liquidity support despite knowing about declining deposits impacted the confidence of consumers.
Poor demand for S&P500 companies due to overall weak quarterly performance strengthened the appeal for the USD Index. The US Dollar showed a V-shape recovery from 101.00 after upbeat Durable Goods Orders data. However, scrutiny of the economic data shows that the majority of orders were for commercial aircraft and what matters most is the demand for core capital goods which remained weak. It seems that firms have postponed their expansion plans due to higher interest rates from the Federal Reserve (Fed).
Going forward, the release of the US Gross Domestic Product (GDP) (Q1) data will remain in the spotlight. As per the consensus, the annualized GDP data is expected to land lower at 2.0% from the former release of 2.6%.
On the Mexican Peso front, investors are awaiting the release of the Trade Balance data. Upbeat economic data would improve the appeal for the Mexican Peso.
-
04:11
USD/CAD Price Analysis: Bulls run out of steam at one-month high around 1.3650
- USD/CAD struggles to defend upside momentum at the highest levels in a month.
- Overbought RSI (14) line challenges Loonie pair buyers inside two-week-old bullish channel.
- Descending trend line from early March, 200-SMA are extra trading filters to watch amid likely pullback in price.
USD/CAD treads water around the highest levels since late March, making rounds to 1.3640 amid early Thursday morning in Europe. In doing so, the Loonie pair justifies overbought conditions of the RSI (14) line. However, a fortnight-long bullish channel and sustained trading beyond the 200-SMA keeps the Canadian Dollar (CAD) bears hopeful.
With this, the quote’s pullback towards the 1.3600 round figure appears imminent. However, the aforementioned channel’s bottom line, close to 1.3595, could challenge the pair sellers afterward.
Even if the USD/CAD bears manage to defy the bullish chart formation by a downside break of 1.3595 support, the 200-SMA level of 1.3560 puts a floor under the prices.
On the flip side, a six-week-long descending resistance line, close to 1.3675 at the latest, restricts the immediate upside of the USD/CAD.
Following that, the short-term rising channel’s top line, near 1.3690 by the press time, can check the Loonie pair buyers before directing them to the late March high surrounding 1.3800.
In a case where the USD/CAD bulls occupy the driver’s seat beyond 1.3800, the yearly top marked in the last month around 1.3860 will be in the spotlight.
Overall, USD/CAD is likely to remain firmer but a short-term pullback can’t be ruled out.
USD/CAD: Four-hour chart
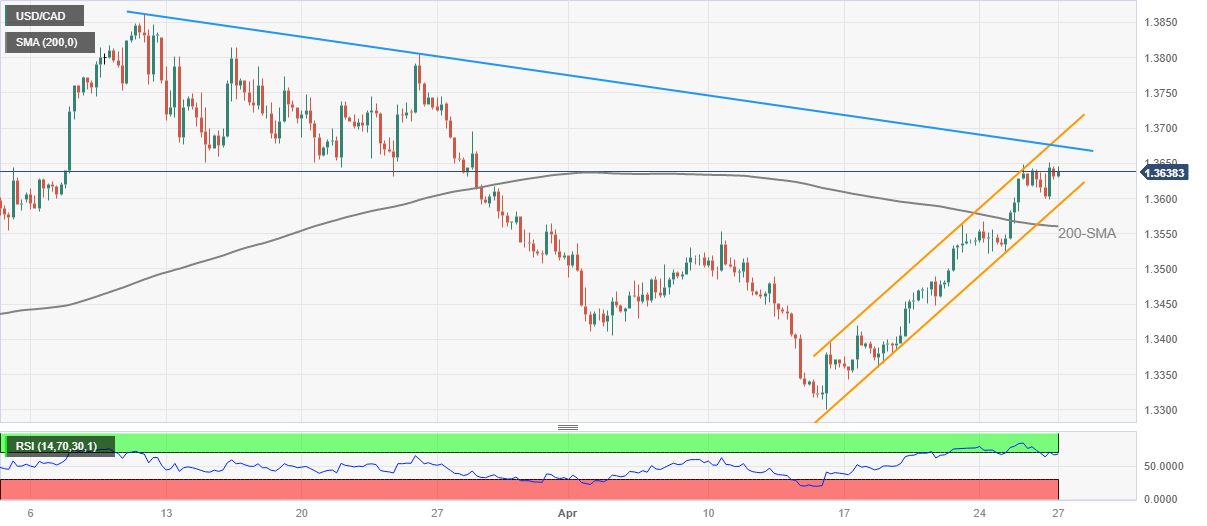
Trend: Pullback expected
-
03:51
EUR/USD marches towards 13-month high near 1.1100 amid hawkish ECB bets ahead of US GDP
- EUR/USD picks up bids to refresh intraday high, reverses late Wednesday’s retreat from multi-month peak.
- Gradually escalating odds of the ECB’s 0.50% rate hike, mixed US data allow Euro buyers to keep the reins.
- Cautious optimism amid US debt ceiling concerns, fears emanating from First Republic Bank propel EUR/USD bulls.
- US Q1 GDP Annualized can bolster Euro’s bullish power on negative surprise.
EUR/USD stays on the front foot around the mid-1.1000s as buyers resume a run-up targeting the highest levels since March 2022, following the previous day’s retreat from 1.1095, amid early Thursday morning in Europe. In doing so, the Euro pair cheers broad US Dollar weakness, as well as the hawkish concerns about the European Central Bank (ECB), ahead of the first quarter (Q1) Gross Domestic Product (GDP), expected to ease to 2.0% on an annualized basis versus 2.6% prior.
Also read: EUR/USD Forecast: Fresh highs but the Euro is running out of time
Interest rate futures suggest a recent pick-up in the market’s bets for the ECB’s 0.50% rate hike in May monetary policy meeting. Although the odds are minor at the latest, the mostly certain 25 basis points (bps) of Fed rate hike and calls of the policy pivot afterward keep the bloc’s central bank more lucrative than its US counterpart, which in turn underpin the EUR/USD run-up despite mixed US data.
As per the latest release, the US Durable Goods Orders rose for March but couldn’t overcome the fishy details of Consumer Confidence released previously. It’s worth noting that the US PMIs were comparatively less firm than their European and German counterparts and hence suggest more economic optimism surrounding the old continent.
On a different page, the US House of Representatives recently passed a bill that enables the government to negotiate the extension of the debt ceiling. However, the policymakers are likely to remain at loggerheads amid the wide difference between the Republicans' and Democrats’ demands. With this, the cautious optimism surrounding the US debt ceiling discussions keeps the Euro pair firmer. Furthermore, the latest tax receipt numbers from the US allow Goldman Sachs (GS) to expect that the US Treasury Department can avoid the risk of a federal payments default till late July, which in turn adds strength to the Euro pair.
Elsewhere, upbeat earnings from Microsoft and Google’s parent Alphabet Inc. allowed Nasdaq to remain firmer. However, the escalating fears from the First Republic Bank (FRB), due to another 20% share price fall on Wednesday following a 50% slump the previous day, weigh on the sentiment and prod the EUR/USD bulls.
Looking forward, US Q1 GDP Annualized will be key to watch for intraday traders of the EUR/USD pair. Also important will be the headlines surrounding US debt ceiling discussions and banking sector news.
Technical analysis
Bearish RSI divergence on the Daily chart joins the EUR/USD pair’s failures to provide a daily closing beyond an upward-sloping resistance line from May 2022, around 1.1090 by the press time, to lure the sellers.
Also read: EUR/USD Price Analysis: Bearish RSI divergence prods Euro bulls, US GDP, 1.1090 eyed
-
03:17
USD/CNH Price Analysis: Upbeat China Industrial Profits fail to inspire Yuan bulls above 6.9400
- USD/CNH picks up bids to reverse the previous day’s pullback from six-week high.
- China Industrial Profits YTD improved to -21.4% through March versus -22.9% prior.
- RSI, MACD conditions challenge the offshore Chinese Yuan buyers but fortnight-old bullish channel keeps them hopeful.
USD/CNH grinds higher past 6.9400, around 6.9430 by the press time, as the pair traders struggle to justify improvement in China’s Industrial Profits during early Thursday.
In doing so, the offshore Chinese Yuan (CNH) pair might be taking clues from the cautious markets ahead of the US first quarter (Q1) Gross Domestic Product (GDP), expected to ease to 2.0% on an annualized basis versus 2.6% prior
That said, China’s Industrial Profits during the January-March period improved to -21.4% YoY versus -22.9% prior.
Technically, USD/CNH remains inside a two-week-old ascending trend channel, currently between 6.9650 and 6.9180.
The quote’s latest rebound from the 61.8% Fibonacci retracement level of March 08-23 downside, near 6.9250 by the press time, appears to keep the offshore Chinese Yuan bears hopeful.
However, nearly overbought RSI and a looming bear cross on the MACD suggest limited upside room for the USD/CNH pair.
It’s worth noting that multiple levels around 6.9100 and the 6.9000 round figure can challenge the USD/CNH bears past 6.9180.
On the contrary, an upside break of 6.9650 won’t hesitate to challenge the yearly high marked in March at around 6.9970.
USD/CNH: Four-hour chart
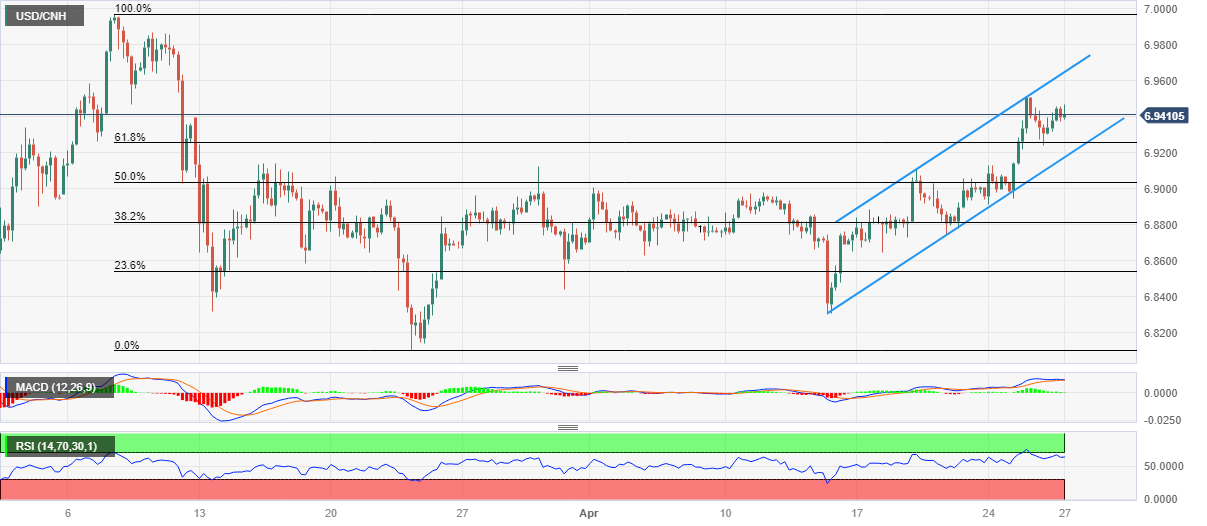
Trend: Gradual upside expected
-
02:58
S&P 500 Futures, yields stabilize ahead of US GDP, First Republic Bank, tech shares eyed
- Market sentiment remains mildly positive amid upbeat earnings from tech majors, progress on US debt ceiling issue.
- First Republican Bank slumps another 20.0% and propels banking fears.
- S&P 500 Futures rebound from one-month low, snaps two-day downtrend.
- US Treasury bond yields turn dicey ahead of first reading of US Q1 GDP.
Risk profile improves during early Thursday as positive developments surrounding the US debt ceiling evolve. Adding strength to the cautious optimism is the upbeat performance of the technology giants and hopes of a pause in the major central bank’s rate hike trajectory.
With this, S&P 500 Futures print mild gains of 0.18% around 4,083 whereas the US Treasury bond yields remain directionless by the press time. It’s worth noting that Wall Street closed mixed.
Upbeat earnings from Microsoft and Google’s parent Alphabet Inc. allowed Nasdaq to remain firmer. However, the escalating fears from the First Republic Bank (FRB), due to another 20% share price fall on Wednesday following a 50% slump the previous day, weigh on the sentiment.
Elsewhere, the US House of Representatives recently passed a bill that enables the government to negotiate the extension of the debt ceiling. However, the policymakers are likely to remain at loggerheads amid the wide difference between the Republicans' and Democrats’ demands.
It’s worth mentioning that the latest tax receipt numbers from the US allow Goldman Sachs (GS) to expect that the US Treasury Department can avoid the risk of a federal payments default till late July.
Above all, hopes of policy pivot at major central banks and mixed US data seem to keep the traders optimistic but the anxiety ahead of the key US first quarter (Q1) Gross Domestic Product (GDP), expected to ease to 2.0% on an annualized basis versus 2.6% prior, prod the positivity. That said, the US Durable Goods Orders rose but couldn’t overcome the fishy details of Consumer Confidence released previously.
Amid these plays, the US Dollar Index (DXY) struggles near the lowest levels in two weeks while commodities and Antipodeans are mildly bid of late.
Moving on, the US GDP numbers will be crucial for market players to watch for clear directions amid recession woes. Following that, Friday’s Core PCE Price Index details, the Fed’s preferred inflation gauge, could entertain traders ahead of the next week’s Federal Open Market Committee (FOMC).
Also read: S&P 500 bears in control following break of structure amid banking sector woes
-
02:56
Nat Gas Price Analysis: Bulls headed to test prior support, focus is on the gap thereafter
- Nat Gas is heading towards a 38.2% Fibonacci level.
- A downside continuation to close the gap is eyed.
Natural Gas is playing out in a long drawn-out phase of what could be an accumulation albeit within a downtrend. The commodity is basing, for now, on the front side of the bearish trend but is sliding out of the micro bear trend which gives a meanwhile bias to the upside on the charts. The following illustrates this on the daily and 4-hour time frames.
Nat Gas daily charts
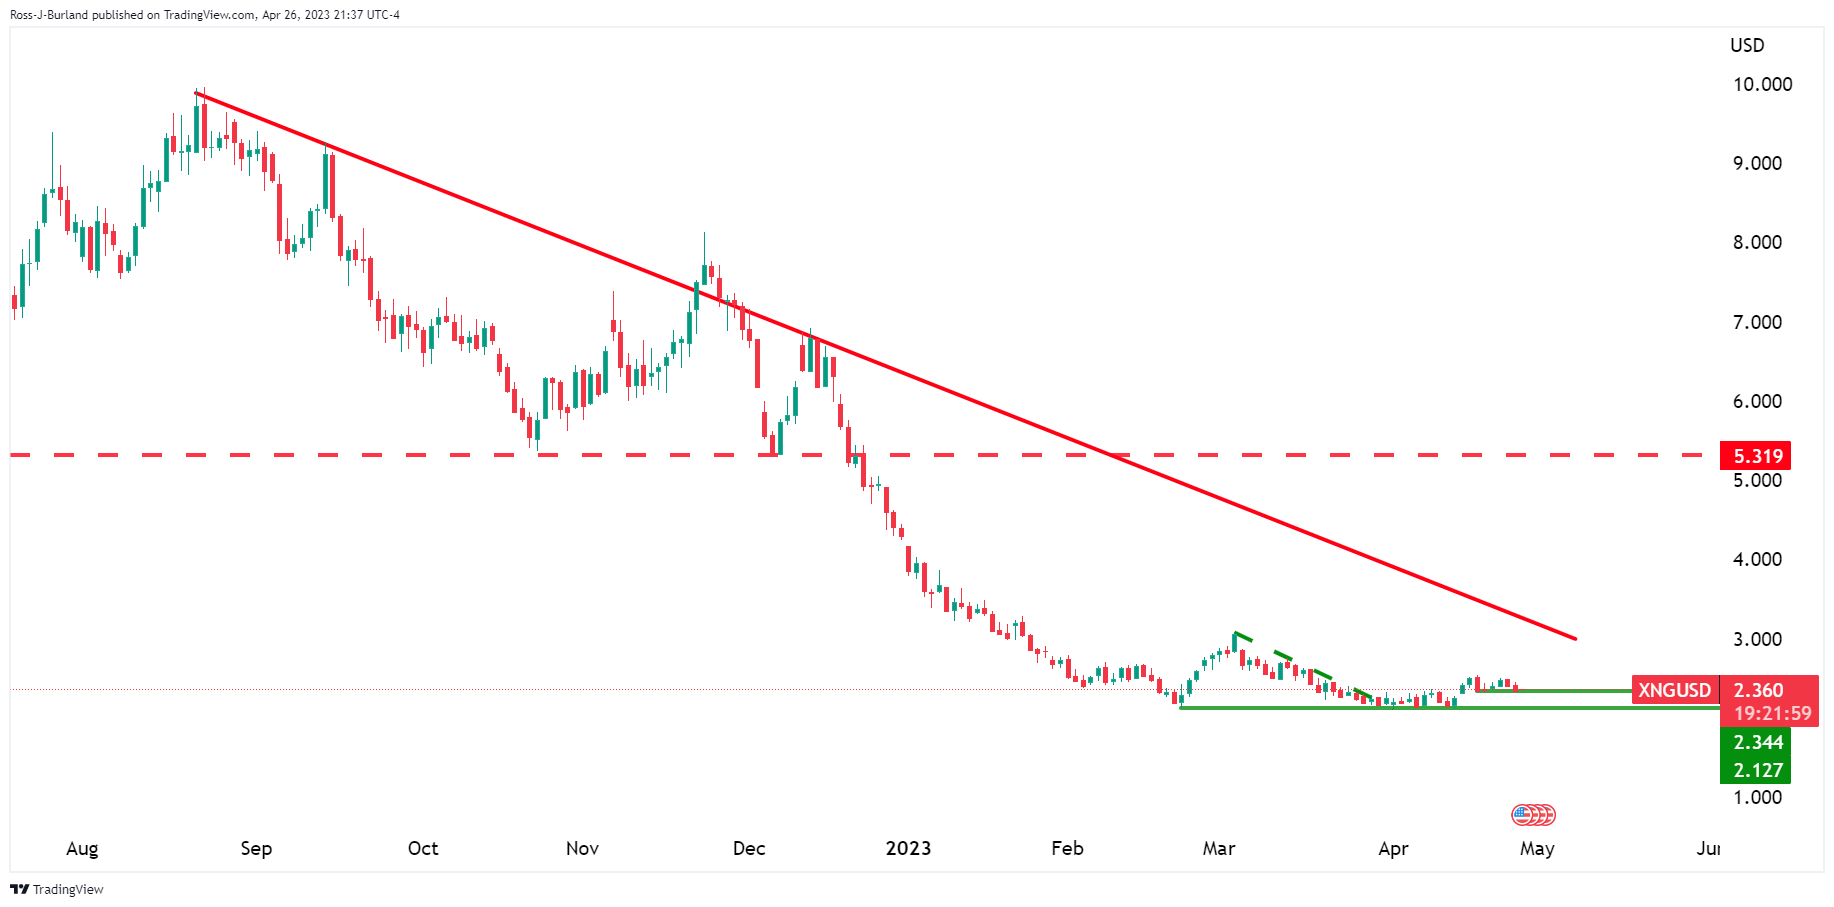
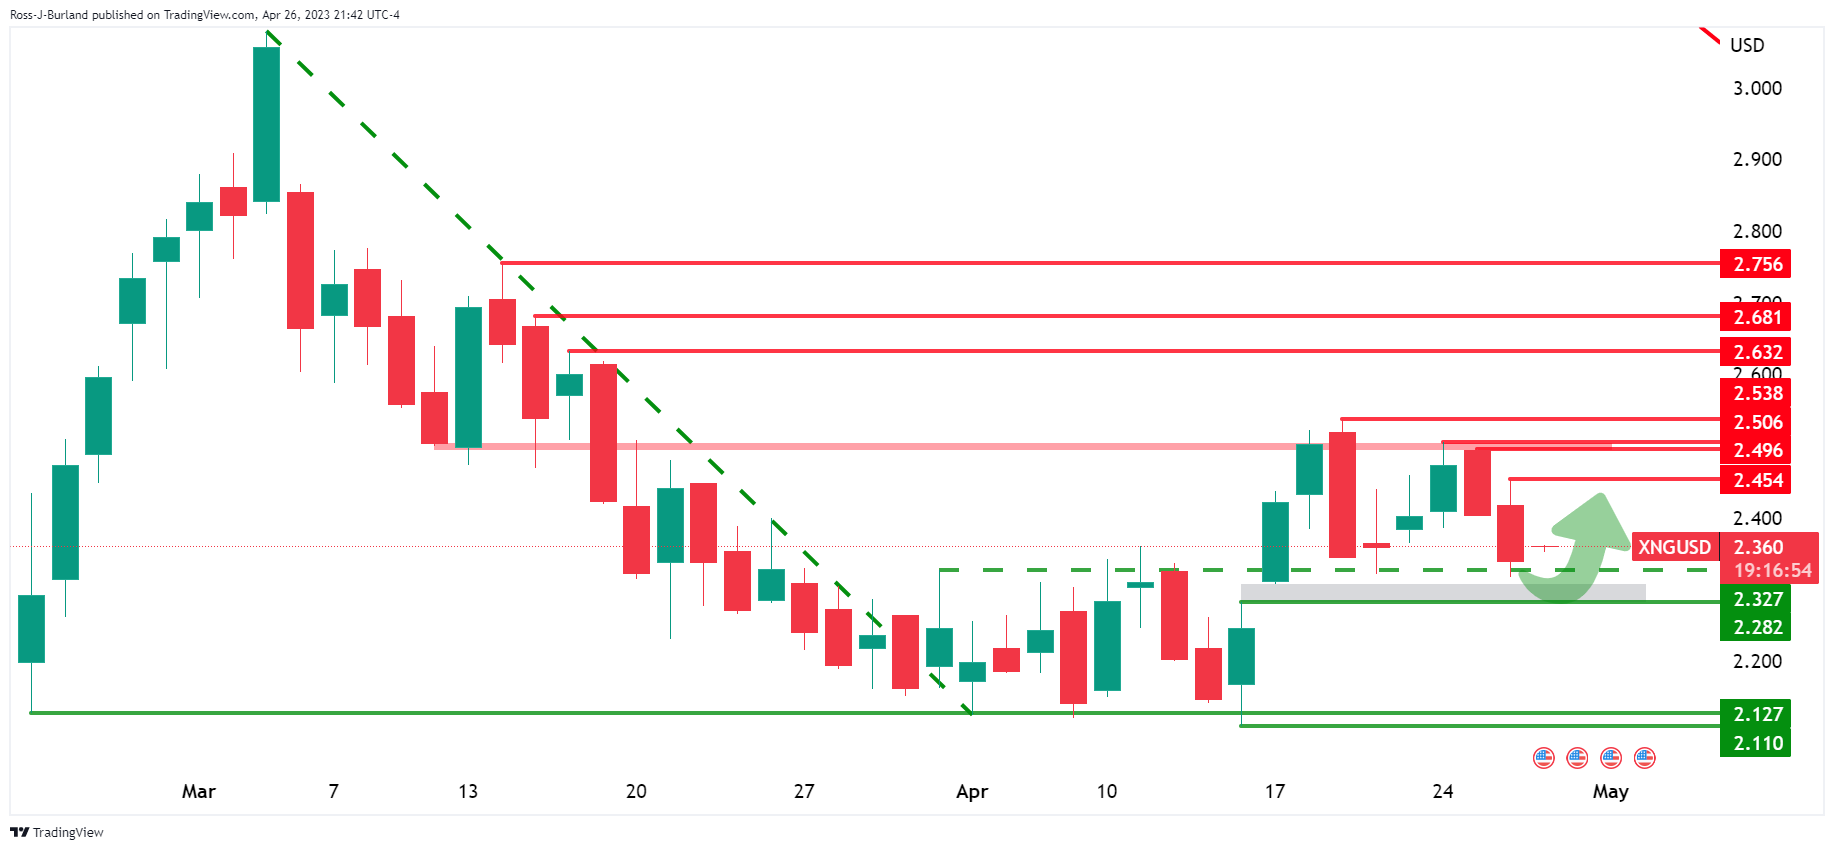
Zoomed in on the daily chart, we can see the accumulation taking place following the breakout of the downtrend, and then horizontal structure around 2.327. The price is meeting resistance but that is not to say there will not be an upside continuation after a restest of support. There is a gap to 2.282 that could be filled in due course.
Nat Gas H4 chart
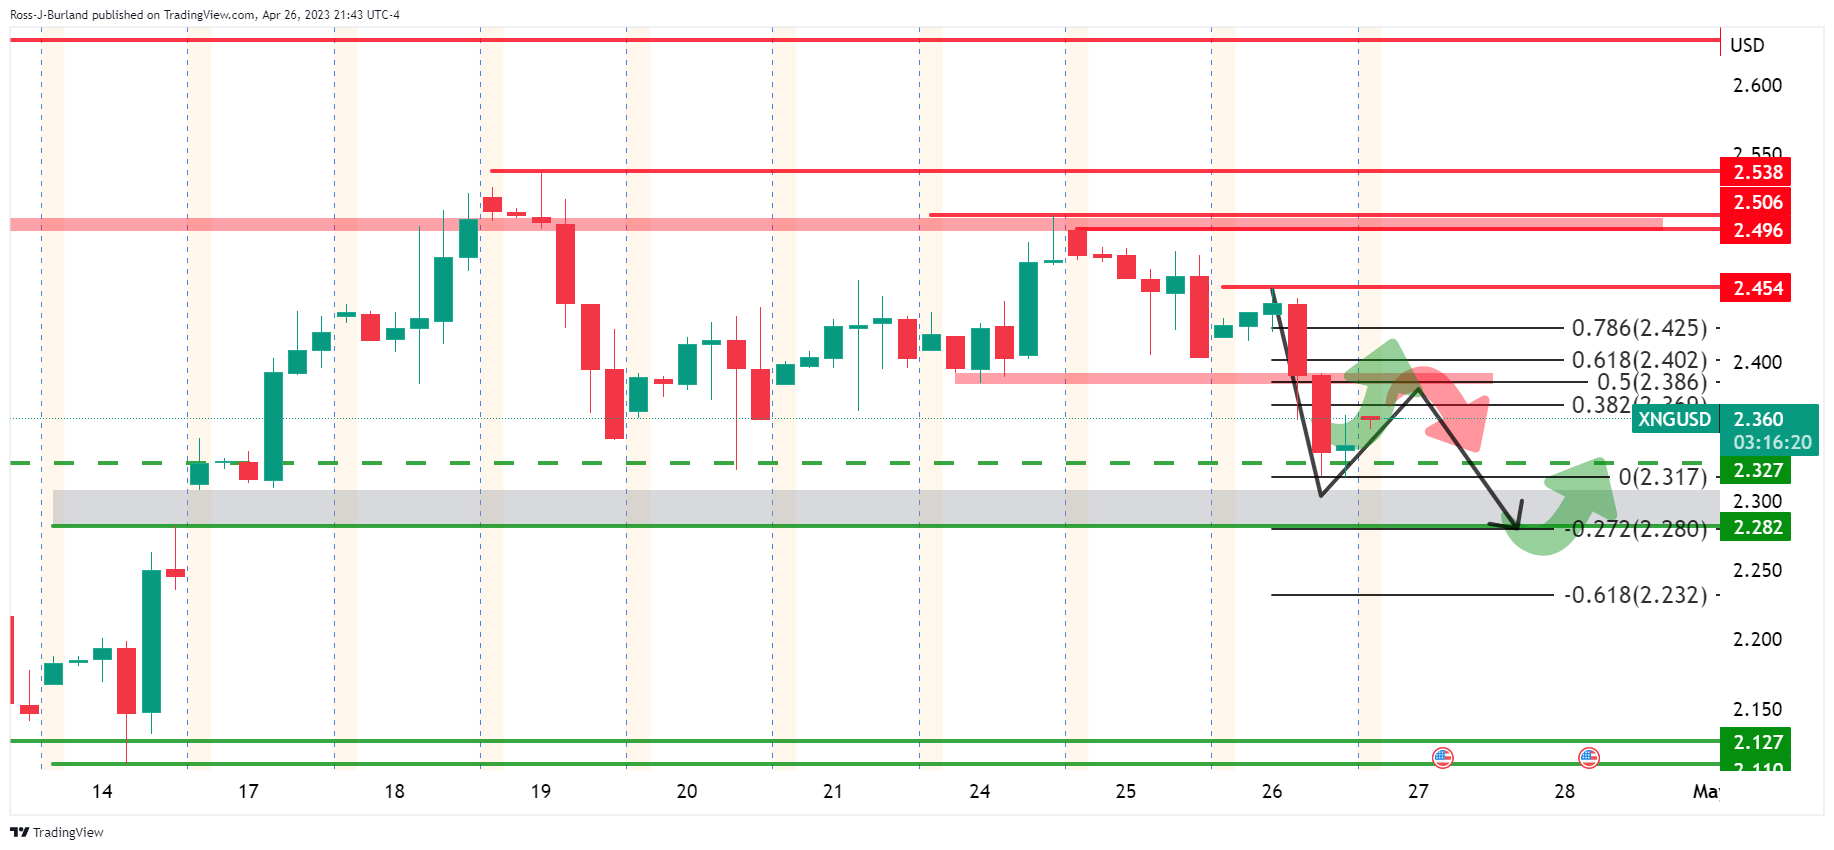
Zooming down to the 4-hour chart, we can see that the price is heading toward a 38.2% Fibonacci level and the 50% thereafter aligns with prior support, so this could act as resistance. Subsequently, a downside continuation to close the gap is a reasonable thesis for the sessions ahead.
-
02:40
EUR/GBP rebounds from 0.8850 as ECB rate policy comes into picture
- EUR/GBP has made a recovery move from 0.8850 as the ECB is set to raise rates next week.
- Lower energy prices have decelerated Eurozone’s headline inflation while the core inflation is sticky due to labor shortage.
- UK’s new-home buyers market is getting vulnerable as interest obligations have become less affordable.
The EUR/GBP pair has witnessed some buying interest after a sideways move around 0.8850 in the Asian session. The cross is expected to remain extremely volatile as investors are shifting their focus towards the interest rate policy by the European Central Bank (ECB), which is due next week.
Investors are divided over the pace of the interest rate hike that ECB President Christine Lagarde will choose to arrest stubborn inflation. The ECB is hiking interest rates by 50 basis points (bps) and further big rate hikes could propel fears of a recession in the Eurozone. Therefore, the ECB could slow down the pace of raising interest rates.
The ECB is not expected to consider a pause in the policy-tightening spell as the tight labor market is not consistent with the mission of softening inflation to 2%. Lower energy prices have decelerated headline inflation, however, the core inflation is extremely persistent due to labor shortage.
Reuters reported that according to a Gfk Survey German consumer sentiment is set to pick up in May as moderating energy prices and expected wage increases help to dissipate households' initial fears about a loss in purchasing power.
On the Pound Sterling front, rising interest rates by the Bank of England (BoE) are creating more troubles for households. Persimmon, United Kingdom’s largest domestic property developer, said on Wednesday, the new-home buyers market is declining as higher interest rates are making interest obligations less affordable. Troubles for households are expected to expand further as BoE Governor Andrew Bailey looks set to hiking interest rates further by 25 bps to 4.5% as UK’s inflation is still stuck to the double-digit inflation range.
-
02:36
GBP/USD bulls take a breather below 1.2500 as US Q1 GDP looms
- GBP/USD takes offers to pare the biggest daily gain in three weeks, prints minor losses of late.
- Mixed sentiment, concerns about US default and mostly upbeat US data allow Cable to retreat.
- US Dollar struggles for clear direction amid cautious mood ahead of US Q1 GDP, dicey market elsewhere.
GBP/USD struggles to defend the previous day’s gains, the heaviest in three weeks, as the US Dollar buyers turn cautious ahead of the key US Q1 GDP. That said, the Pound Sterling remains mildly offered around 1.2465 amid early Thursday.
Markets turn dicey as traders take a breather after a volatile day, especially amid mixed updates and a cautious mood before important US growth data.
Talking about the key risk catalysts, the US House of Representatives passes a bill that enables the government to negotiate the extension of the debt ceiling. However, the policymakers are likely to remain at loggerheads amid the wide difference between the Republicans' and Democrats’ demands. On the same line, the latest tax receipt numbers from the US allow Goldman Sachs (GS) to expect that the US Treasury Department can avoid the risk of a federal payments default till late July.
On a different page, the UK policymakers criticize the passages of the illegal migration bill, as well as the Tory government’s Brexit move. Additionally challenging the GBP/USD pair could be the political turmoil challenging UK Prime Minister (PM) Rishi Sunak on an ethical basis.
It’s worth noting that mixed US data and equity market performance also trouble the GBP/USD pair as the US Durable Goods Orders rose but the details of Consumer Confidence eased. Furthermore, the tech giants allowed Nasdaq to remain firmer but the escalating fears from the First Republic Bank (FRB), due to another 20% share price fall on Wednesday following a 50% slump the previous day weigh on the sentiment.
Amid these plays, US Treasury bond yields remain directionless while the S&P 500 Futures print mild gains of 0.20% around 4,083 by the press time, following a mixed close of Wall Street.
Moving on, GBP/USD may witness further grinding as markets turn dicey ahead of the key US first quarter (Q1) Gross Domestic Product (GDP), expected to ease to 2.0% on an annualized basis versus 2.6% prior. However, the Cable buyers are likely running out of steam and hence any positive surprise from the US data can allow the bears to sneak in.
Technical analysis
A three-week-old bearish triangle formation, currently between 1.2525 and 1.2415, keeps the GBP/USD sellers hopeful.
-
02:30
Australia Import Price Index (QoQ) below forecasts (3.6%) in 1Q: Actual (-4.2%)
-
02:30
Australia Export Price Index (QoQ) came in at 1.6% below forecasts (1.9%) in 1Q
-
02:22
Gold Price Forecast: XAU/USD bears eye a downside continuation
- Gold price is pressured in a broken-down market.
- Gold price is on the backside of the micro trendline and the Gold price is being resisted near a 38.2% Fibonacci.
- The Fed sentiment is weighing on the precious metal.
Gold price is trading a tough higher by some 0.1% in Tokyo after rallying from a low of $1,989.15 to a high of $1,992.29 the high so far but remains on thin ice while below the psychological $2,000 mark on Wednesday.
The US Dollar and bond yields have been rising ahead of next week's expected hike from the Federal Reserve which is leaving an air of bearishness around the yellow metal. The Fed's policy committee is expected to end with a 25-basis point increase in interest rates.
´´We expect the FOMC will raise rates by 25bp when it meets next week. That would leave the target ceiling for fed funds at 5.25% and effective fed funds in line with the median (and end 2023) dot plot of 5.10%,´´ analysts at ANZ Bank said.
´´Our baseline forecast is for one more 25bp rate rise to 5.50%. With respect to the bigger picture, however, the tightening cycle may be nearing its conclusion. We expect future rate decisions to be determined meeting-by-meeting,´´ the analysts added.
´´Our Gross Domestic Product estimates expect the lagged effects of last year’s rate rises to bite more deeply in Q2. We expect consumption and labour market growth to moderate. However, core services inflation ex-shelter may take time to ease.´´
´´Bank solvency is an issue that the FOMC will factor into its deliberations. It is imperative that inflation is brought under control to protect the value of bank assets. We expect fed funds to hold steady in H2 2023 to squeeze inflation,´´ the analyst's note concluded.
Meanwhile, Fed tightening expectations have eased up bit and the WIRP suggests over 80% odds of 25 bp hike at the May 2-3 meeting, down from 90% at the start of this week and back to the 80% seen at the start of last week and 70% at the start of the week before that.
Analysts at Brown Brothers Harriman said that there are no longer any odds of another 25 bp hike in June, down from about 15% at the start of this week.
´´Between the May 2-3 and June 13-14 meetings, the Fed will have digested two more job reports, two CPI/PPI reports, and one retail sales report. At this point, a pause in June might just be the most likely outcome but it really will depend on how all that data come in.,´´ the analysts said. ´´After all that, two cuts are now priced in by year-end vs. one at the start of this week and back to two seen at the start of last week. In that regard, Powell has said that Fed officials “just don’t see” any rate cuts this year. We concur.´´
Meanwhile, in Gold price, analysts at TD Securities have stated that discretionary traders are still sitting on the sidelines, which suggests cuts pricing is still not feeding through to interest.
´´In the near term, weaker longs still remain vulnerable, but we don't expect the first selling meaningful program to kick in until prices break $1964/oz in gold or $24.00/oz in silver.´´
Gold technical analysis
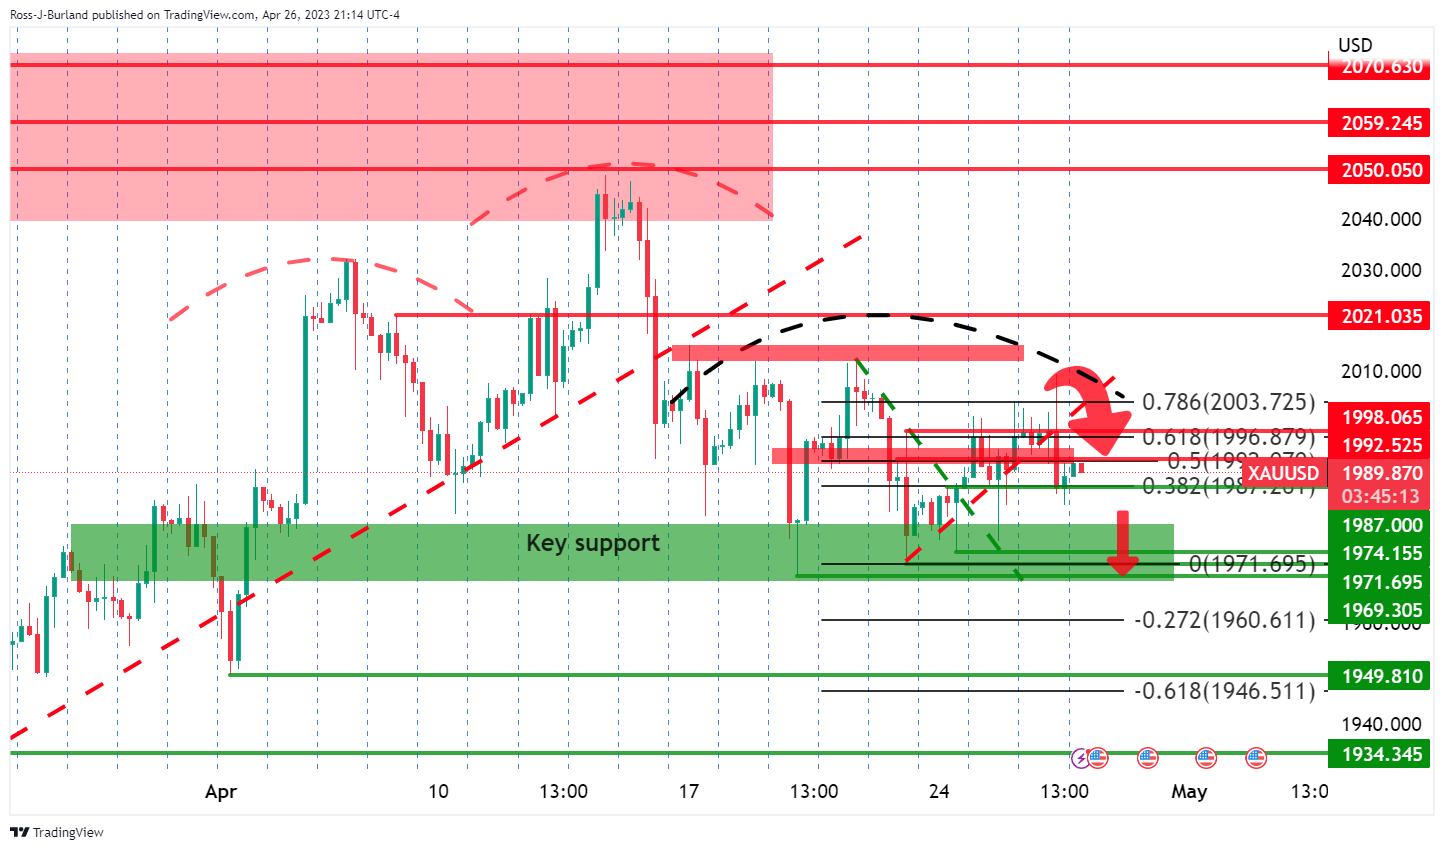
Gold price is weighed technically by the fact that it is on the backside of the trend and pressured within the right-hand shoulder of the head and shoulders in a broken-down market.
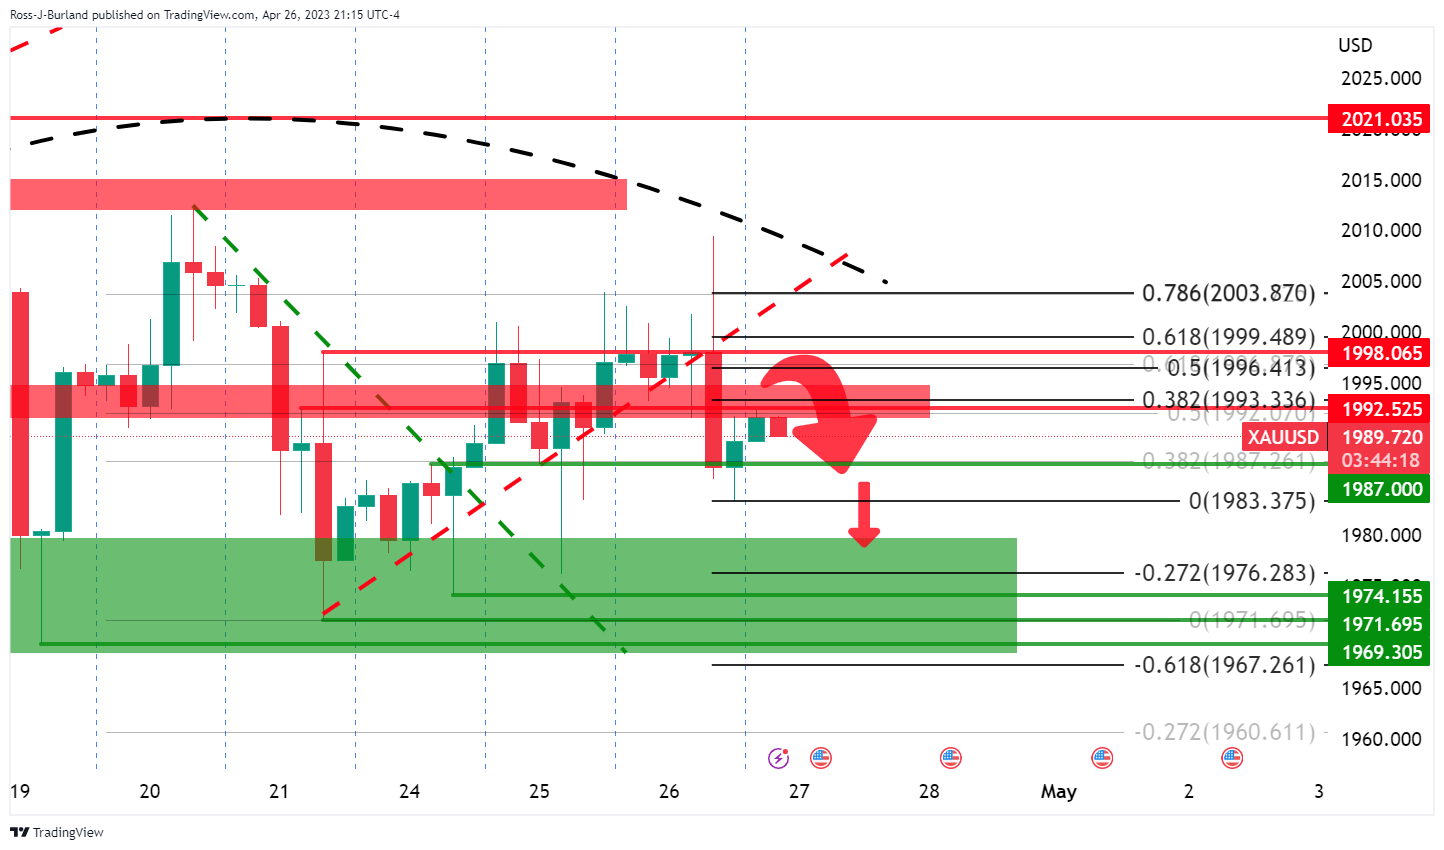
Zooming in, we can see that the bears are moving in on the backside of the micro trendline and the Gold price is being resisted near a 38.2% Fibonacci.
-
02:20
USD/CNY fix: 6.9207 vs. the prior close of 6.9270
In recent trade today, the People’s Bank of China (PBOC) set the yuan at 6.9207 vs. the prior close of 6.9270.
About the fix
China maintains strict control of the yuan’s rate on the mainland.
The onshore yuan (CNY) differs from the offshore one (CNH) in trading restrictions, this last one is not as tightly controlled.
Each morning, the People’s Bank of China (PBOC) sets a so-called daily midpoint fix, based on the yuan’s previous day's closing level and quotations taken from the inter-bank dealer.
-
02:09
US tax inflows hint that Treasury Department can avoid default till late July – Goldman Sachs
With the latest tax receipt numbers from the US being impressive, Goldman Sachs (GS) raises expectations that the US Treasury Department can avoid the risk of a federal payments default until late June.
Bloomberg quotes Alec Phillips, a Goldman Sachs economist while suggesting a positive development, especially after the passage of the "Limit, Save, Grow Act" in the US House of Representatives.
Also read: White House: The President has made clear this bill has no chance of becoming law
Key quotes
If the remaining receipts stay on this trend, the Treasury should be able to continue to make all scheduled payments until the end of July without an increase in the debt limit.
Goldman now sees the department getting within $50 billion to $60 billion of exhausting its resources in the second week of June.
The bill’s passage is likely to put weight behind Republican insistence that the White House and congressional Democrats engage in negotiations on policy changes to accompany a debt limit increase.
Assuming a late July deadline, those negotiations might not begin for a few weeks, if not longer.
In our view, the most likely policy to accompany a debt limit increase is a cap on discretionary spending that’s less than the House GOP plan.
-
02:02
AUD/USD Price Analysis: Retreats to 0.6600 as RBA to retain neutral policy stance
- AUD/USD is facing hurdles after a less-confident pullback move ahead of US GDP.
- Consistently declining Australian CPI indicates that the RBA will keep interest rates steady further.
- AUD/USD is in a bearish trajectory after a breakdown of the Inverted Flag chart pattern.
The AUD/USD pair has sensed selling pressure after a less-confident pullback to near 0.6611 in the Tokyo session. The Aussie asset has resumed its downside journey as the USD Dollar Index (DXY) is concluding its marginal corrective move.
Investors are expected to shift their funds into the US Dollar amid anxiety ahead of the United States Gross Domestic Product (GDP) (Q1) data. A decline is expected to 2.0% from the former print of 2.6%. The street is anticipating a decline in GDP numbers as firms have postponed their expansion plans to avoid higher interest obligations.
The Australian Dollar witnessed an extreme sell-off on Wednesday after the soft landing of inflation data. The consistently declining Australian Consumer Price Index (CPI) indicates that the Reserve Bank of Australia (RBA) will keep interest rates steady further.
AUD/USD is in a bearish trajectory after a breakdown of the Inverted Flag chart pattern formed on the daily scale. The aforementioned chart pattern is a trend continuation pattern in which a long consolidation is followed by a breakdown.
The 20-period Exponential Moving Average (EMA) around 0.6680 is acting as a barricade for the Aussie bulls.
The Relative Strength Index (RSI) (14) has slipped into the bearish range of 20.00-40.00, which indicates an activation of downside momentum.
US Dollar bulls will flex their muscles if the Aussie asset will drop below March 15 low at 0.6590. An occurrence of the same will expose the asset to March 08 low at 0.6568 followed by 02 November 2022 high around 0.6500.
In an alternate scenario, only a decisive move above the round-level resistance of 0.6800 will drive the asset toward February 23 high at 0.6872 and February 20 high at 0.6920.
AUD/USD daily chart
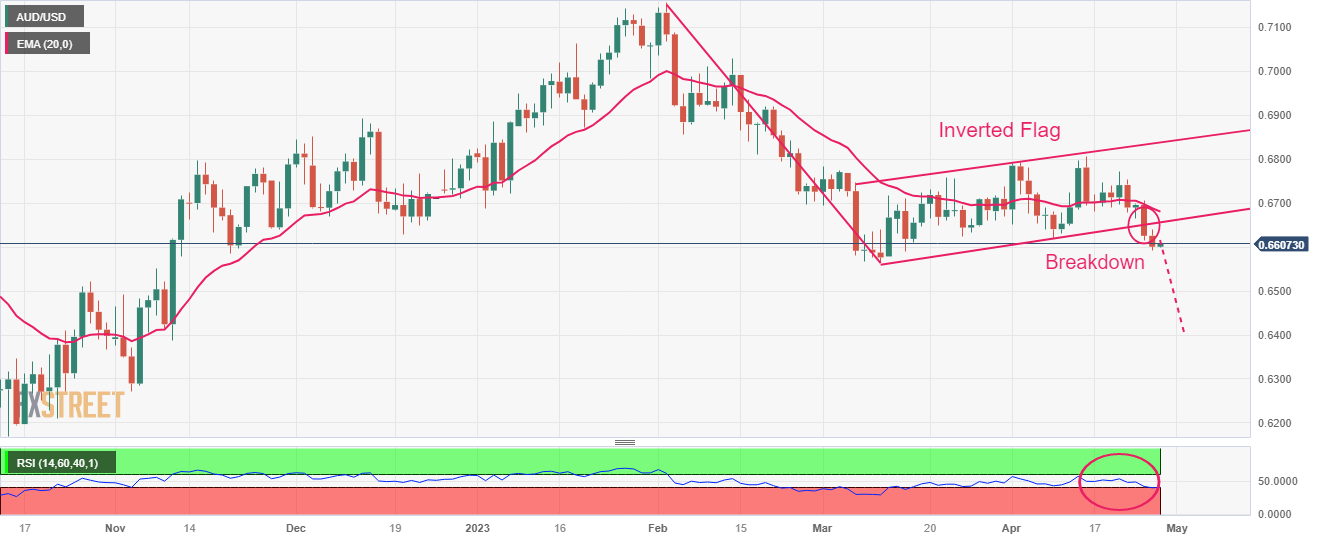
-
02:00
New Zealand ANZ Business Confidence below expectations (-43.4) in April: Actual (-43.8)
-
02:00
New Zealand ANZ Activity Outlook above forecasts (-8.9%) in April: Actual (-7.6%)
-
01:57
USD/CHF Price Analysis: Fades bounce off 27-month low within bullish triangle
- USD/CHF takes offers to refresh intraday low, retreats from top line of a two-week-old descending triangle.
- Sluggish oscillators suggest continuation of lower grind, multiple levels surrounding 0.8860 challenge Swiss Franc pair sellers.
- Bulls need validation from 200-HMA to retake control.
USD/CHF refreshes intraday low near 0.8705 as it drops back towards the lowest levels since January 2021 marked the previous day amid Thursday’s sluggish Asian session. In doing so, the Swiss Franc (CHF) pair retreats from the resistance line of a two-week-old bullish triangle, recently slipping beneath the 100-Hour Moving Average (HMA).
Given the unimpressive prints of the MACD signals and RSI (14), the USD/CHF is likely to continue declining.
However, multiple supports around 0.8860 appear a tough nut to crack for the Swiss Franc pair sellers to break.
Following that, the pair’s gradual south run towards the year 2021 low of around 0.8755 can’t be ruled out.
Meanwhile, the 100-HMA and the top line of the aforementioned triangle, respectively near 0.8910 and 0.8915, guard the short-term recovery of the USD/CHF pair.
It’s worth noting that the confirmation of the bullish triangle breakout, via a sustained break of 0.8915, isn’t an open invitation to the USD/CHF buyers as they need validation from the 200-HMA hurdle of 0.8935.
Also acting as an upside filter is the previous weekly high around the 0.9000 psychological magnet, a break of which could propel the quote towards the monthly top surrounding 0.9200.
USD/CHF: Hourly chart
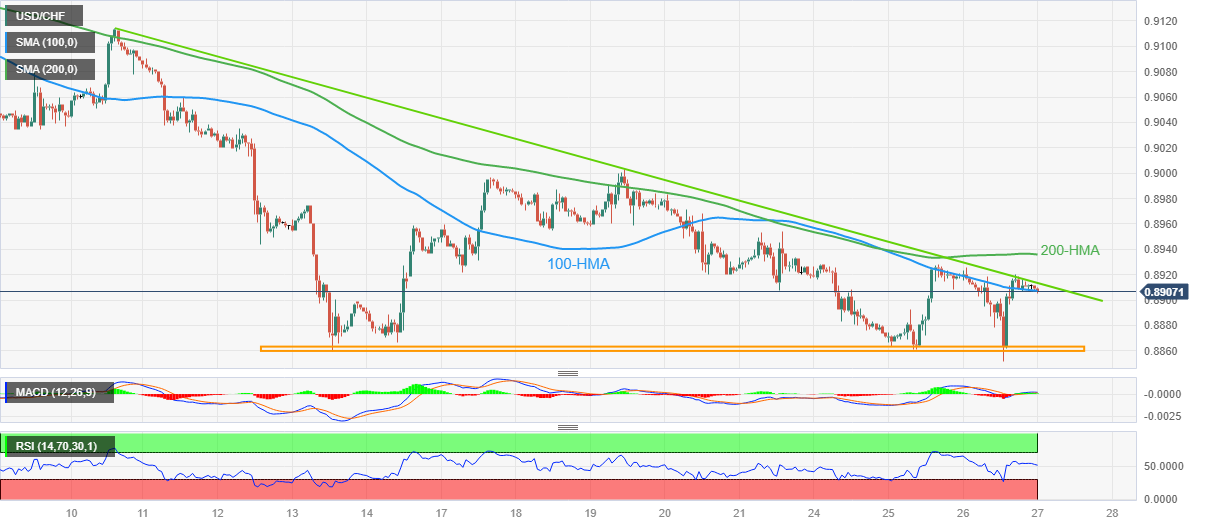
Trend: Limited downside expected
-
01:32
USD/JPY trims losses near 133.50 amid dicey yields, defensive BoJ talks, US GDP eyed
- USD/JPY bounces off intraday low to pare recent losses during three-day downtrend.
- BoJ Officials keep favoring easy money policy, push back the need to alter YCC.
- US House of Representatives passed a bill to kick-start debt ceiling negotiations.
- Market fears due to First Republic Bank’s performance can weigh on Yen pair ahead of US Q1 GDP.
USD/JPY picks up bids to consolidate recent losses around mid-133.00s as markets brace for the US Q1 GDP during early Thursday. Adding strength to the corrective bounce could be the cautious optimism surrounding the US debt ceiling extension and the Bank of Japan (BoJ) Officials’ defense of the current ultra-easy monetary policy.
Following the passages of the "Limit, Save, Grow Act", the White House spokesperson said that President Joe Biden has made clear this bill has no chance of becoming law. The same challenges the initial optimism surrounding the bill amid fears of long and difficult discussion on the key matter. Even so, Reuters said that the US House of Representatives on Wednesday narrowly passed a bill to raise the nation's $31.4 trillion debt ceiling, defying President Joe Biden by attaching sweeping spending cuts for the next decade.
It should be noted that former BoJ Deputy Governor Masazumi Wakatabe recently mentioned that he will be surprised if the BoJ changes Yield Curve Control (YCC) on Friday. Previously, Bank of Japan´s (BoJ) Governor Kazuo Ueda spoke in the Japanese Parliament, known as Diet, while saying that the risk of a rise in inflation driven by lost of market trust in Japan's finances low for now. The policymaker also tried to tame talks of inflation woes and indirectly suggests no change in this week’s monetary policy meeting, not even surrounding the YCC.
Elsewhere, mixed US data and equity market performance also trouble the USD/JPY pair as the US Durable Goods Orders rose but the details of the Consumer Confidence eased. Furthermore, the tech giants allowed Nasdaq to remain firmer but the escalating fears from the First Republic Bank (FRB), due to another 20% share price fall on Wednesday following a 50% slump the previous day weigh on the sentiment.
Against this backdrop, US Treasury bond yields remain directionless while the S&P 500 Futures print mild gains of 0.20% around 4,083 by the press time, following a mixed close of Wall Street.
Looking forward, USD/JPY traders should pay attention to the risk catalysts, mainly surrounding the banks and US debt ceiling, while waiting for the US first quarter (Q1) Gross Domestic Product (GDP), expected to ease to 2.0% on an annualized basis versus 2.6% prior.
Technical analysis
A convergence of the previous support line from early April and a one-week-old resistance line, around 134.15, restricts the short-term recovery of the USD/JPY pair. The downside moves, however, remain elusive beyond a one-month-old ascending trend line, close to 132.65.
-
01:24
USD/CAD approaches 1.3630 despite BoC denies for rate cuts this year, US GDP in focus
- USD/CAD is marching towards 1.3630 as the USD Index has resumed its upside journey.
- Overall market mood is full of caution as investors are shifting their focus toward the US GDP (Q1) data.
- The BoC won’t hesitate in hiking interest rates further if needed to arrest the sticky inflation.
The USD/CAD pair is marching towards the crucial resistance of 1.3630 in the Asian session. The Loonie asset is driving higher after a volatility contraction move as the US Dollar Index (DXY) is looking to conclude its nominal correction. The USD Index dropped marginally to near 101.40 after a V-Shape recovery influenced by volatility in S&P500.
S&P500 futures are showing some decent gains in the Asian session. The 500-US stock basket acted as a mixed bag as technology stocks were exclusively in demand while First Republic Bank dived further. Investors saw a loss of confidence in the United States administration after the First Republic Bank stated that the administration was reluctant to provide investment support amid deteriorating deposits by customers.
Overall market mood is full of caution as investors are shifting their focus toward the US Gross Domestic Product (GDP) (Q1) data. The annualized GDP is seen at 2.0% lower than the former release of 2.6%. A decline in consumer spending, higher interest rates by the Federal Reserve (Fed), and tight credit conditions by US commercial banks could have a negative impact on economic growth.
The release of the Bank of Canada's (BoC) Summary of Deliberations showed that the Canadian economy is a little stronger than anticipated earlier. Also, the tight labor market is not consistent with the agenda of bringing stubborn inflation to 2%. Therefore, BoC Governor Tiff Macklem won’t hesitate in hiking interest rates further if needed to arrest the sticky inflation. BoC’s minutes confirmed that rate cuts are not expected this year.
-
01:15
Currencies. Daily history for Wednesday, April 26, 2023
Pare Closed Change, % AUDUSD 0.66036 -0.35 EURJPY 147.488 0.46 EURUSD 1.10403 0.59 GBPJPY 166.559 0.33 GBPUSD 1.24665 0.46 NZDUSD 0.61162 -0.4 USDCAD 1.36308 0.05 USDCHF 0.8908 -0.11 USDJPY 133.63 -0.11 -
01:07
EUR/USD Price Analysis: Bearish RSI divergence prods Euro bulls, US GDP, 1.1090 eyed
- EUR/USD struggles around 13-month high amid bearish RSI divergence on daily chart.
- Higher high on Euro prices fail to gain support from RSI (14), suggesting a pullback in EUR/USD.
- Failure to cross 11-month-old ascending resistance line adds strength to the bearish bias.
- One-month-old ascending trend line restricts immediate downside, 1.0765-55 appears a tough nut to crack for Euro bears.
EUR/USD stays defensive at the highest levels since March 2022, marked the previous day, as bulls run out of steam ahead of the key US first quarter (Q1) Gross Domestic Product (GDP) during early Thursday. That said, the Euro pair picks up bids to pare the late Wednesday’s retreat from the multi-day high to around 1.1045 by the press time.
The Euro pair refreshed a 13-month high but failed to provide a daily closing beyond an upward-sloping resistance line from May 2022, around 1.1090 by the press time.
Apart from the failure to cross the crucial resistance line, the bearish RSI divergence with the latest run-up in the EUR/USD price also teases the Euro pair sellers on an important data release day.
The EUR/USD pair’s tops marked since early February fail to gain support from the RSI (14) line as the higher high in prices commensurate the lower low of the oscillator, which in turn suggests a pullback in the quote before the next leg of the uptrend.
However, a one-month-old ascending support line, close to 1.0970 by the press time, could challenge the intraday sellers of the pair.
Following that, a convergence of the 100-DMA and an upward-sloping trend line from September 2022, close to 1.0765-55, will be in the spotlight as a break of which could reverse the pair’s upward trajectory from late 2022.
Alternatively, a daily closing beyond the 1.1090 resistance line won’t hesitate to challenge the March 2022 high of around 1.1185.
EUR/USD: Daily chart
-27042023-638181507863161258.png)
Trend: Pullback expected
-
01:02
Ex-BoJ dep gov Wakatabe: Will be surprised if BoJ changes YCC Friday
The ex-Bank of Japan deputy gov Masazumi Wakatabe said he will be surprised if the BoJ changes Yield Curve Control on Friday.
Bank of Japan officials have been vocally wary of tweaking or scrapping their yield control stimulus at the policy meeting this week that concludes tomorrow so soon after the banking crisis overseas. BOJ officials instead see a need to keep their cap on government bond yields in place for now to support the economy.
The two-day meeting will be the first under Governor Kazuo Ueda who is forecast to keep policy settings unchanged. The bigger news will come in his press conference and the extent to which he hints at an overhaul to come.
USD/JPY update
USD/JPY Price Analysis: Bulls taking a rein check as bears eye 132.80s
USD/JPY H4 chart
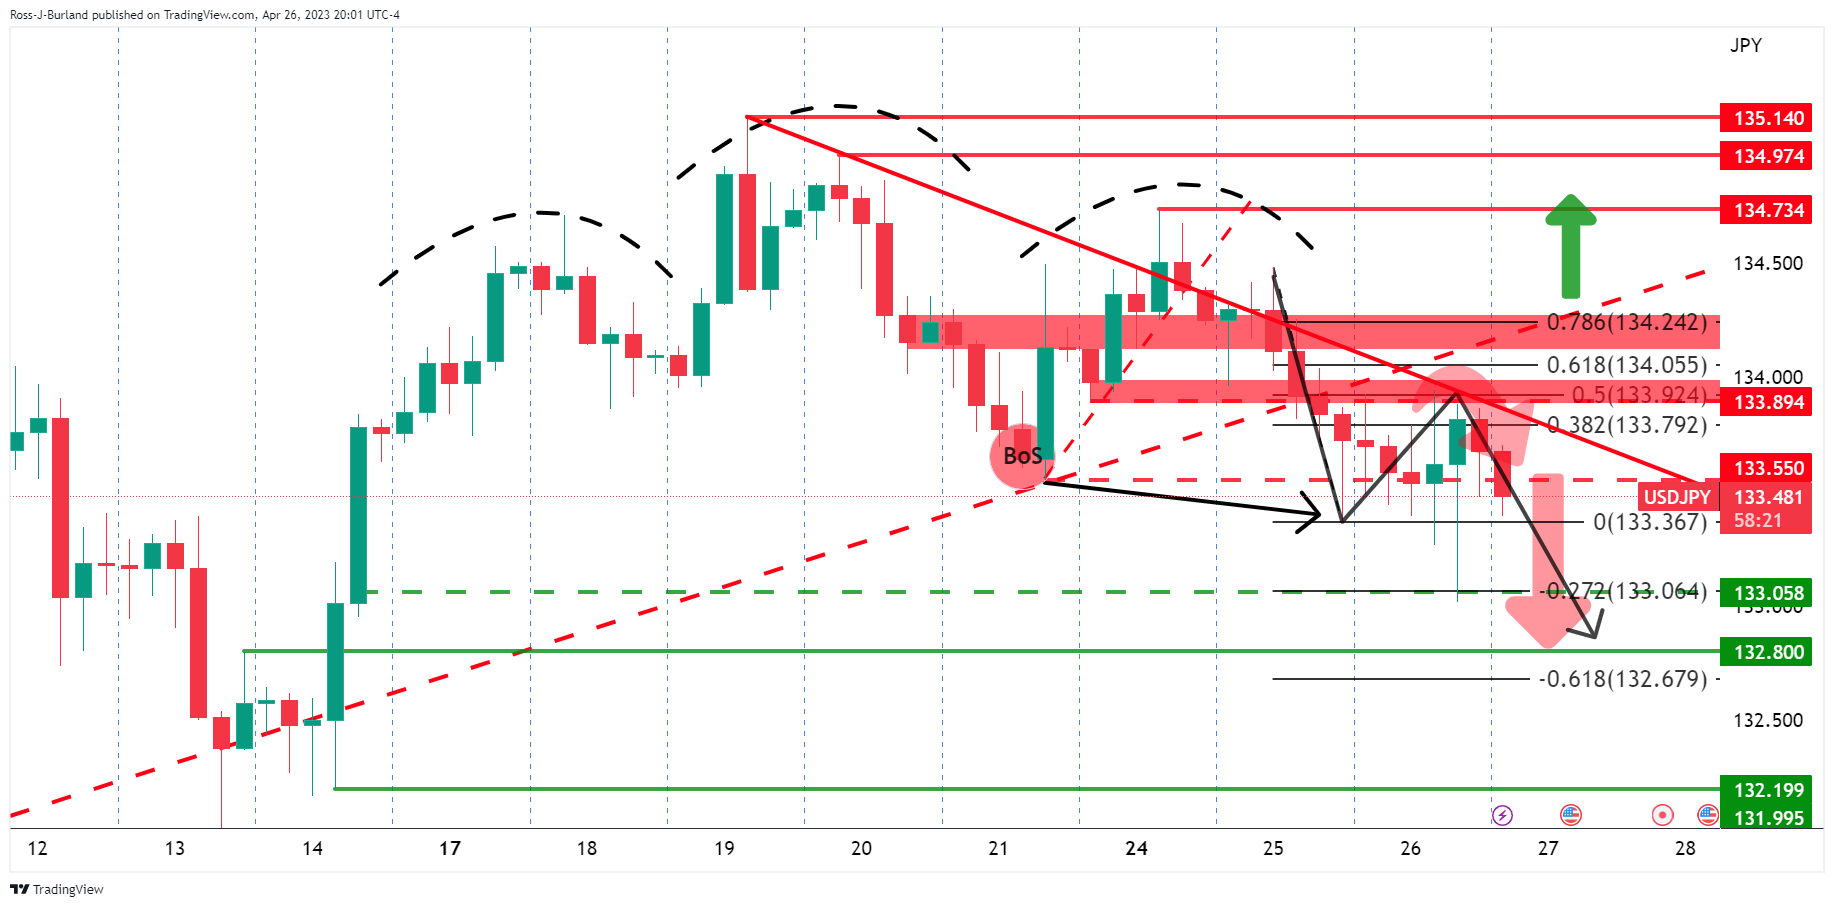
We have the head and shoulders formed with the price on the back side of the prior rising trendline support that is now expected to act as a counter-trendline. We also have seen a break of the 4-hour structure and a correction into the bearish trendline resistance meeting the 38.2% ratio. Bears are engaged here which will possibly result in a downside continuation with 132.80 eyed.
-
00:51
NZD/USD Price Analysis: Time for a bumpy ride ahead below 0.6100 ahead of US GDP
- NZD/USD has shown a less-confident recovery after a fresh six-week low of 0.6112, however, the downside seems favored.
- Soaring risk of investment in the S&P500 improved the appeal for the US Dollar Index as safe-haven.
- NZD/USD is making a Head and Shoulder chart pattern and a breakdown of the same results in a bearish reversal.
The NZD/USD pair has shown a mild recovery after printing a fresh six-week low of 0.6112 in the early Tokyo session. The Kiwi asset witnessed a steep fall on Wednesday after a V-shape recovery from the US Dollar Index (DXY) and a sell-off in the New Zealand Dollar over a headline that the Reserve Bank of New Zealand (RBNZ) has considered the qualitative easing proposal citing that current restrictions may be unnecessarily reducing efficiency as risks to financial stability are lower.
The USD Index recovered sharply after dropping to near 101.00 as the soaring risk of investment in the S&P500 improved the appeal for the former as a safe-haven.
Going forward, the United States annualized Gross Domestic Product (GDP) (Q1) data will remain in the spotlight. The street is anticipating a decline in the growth rate to 2.0% from the former pace of 2.6%.
NZD/USD is making a Head and Shoulder chart pattern on a daily scale, which signals a long consolidation, and a breakdown of the same results in a bearish reversal. Broadly, the New Zealand Dollar will remain safe if it manages to sustain above the horizontal resistance plotted from March 08 low at 0.6084.
Declining 10-and 20-period Exponential Moving Averages (EMAs) at 0.6162 and 0.6190 respectively indicate more weakness ahead.
Meanwhile, the Relative Strength Index (RSI) (14) is on the edge of the bearish range of 20.00-40.00. A slippage inside the same will activate the downside momentum.
Going ahead, a breakdown of April 26 low at 0.6110 will drag the asset toward March 08 low at 0.6088 followed by the 15 Nov 2022 low at 0.6058.
Alternatively, an upside move above April 24 high at 0.6168 will drive the Kiwi asset toward the round-level resistance at 0.6200. A breach of the latter will allow the Kiwi to report a fresh weekly high above April 19 high at 0.6227.
NZD/USD daily chart
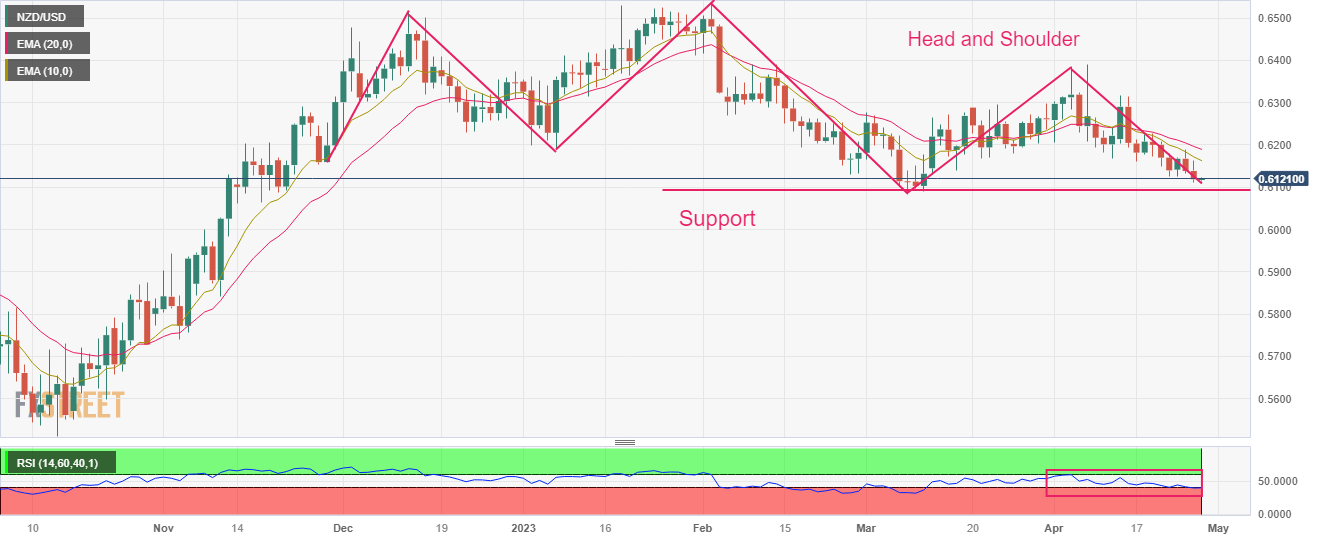
-
00:50
Japan Foreign Investment in Japan Stocks declined to ¥342.9B in April 21 from previous ¥1876.4B
-
00:50
Japan Foreign Bond Investment: ¥-1059.5B (April 21) vs previous ¥500.2B
-
00:40
US Dollar Index: DXY retreats towards 101.00 despite banking sector fears, focus on US Q1 GDP
- US Dollar Index fades late Wednesday’s corrective bounce off the lowest level in a fortnight.
- Passage of initial hurdle for US debt ceiling extension, First Republic Bank-induced banking sector woes fail to impress DXY bulls.
- Greenback braces for softer US Q1 GDP, positive surprise can join risk aversion to recall US Dollar Index buyers.
US Dollar Index (DXY) remains pressured around 101.40 as it fails to extend the previous corrective bounce from a two-week low amid cautious optimism during Thursday’s Asian session. In doing so, the greenback’s gauge versus the six major currencies fails to cheer the banking fears emanating from the First Republic Bank (FRB), as well as the US House of Representatives’ passage of the bill that puts forward a discussion on increasing the US debt ceiling to avoid a default.
“The US House of Representatives on Wednesday narrowly passed a bill to raise the nation's $31.4 trillion debt ceiling, defying President Joe Biden by attaching sweeping spending cuts for the next decade,” said Reuters. Following the passages of the "Limit, Save, Grow Act", the White House spokesperson said that President Joe Biden has made clear this bill has no chance of becoming law. The same challenges the initial optimism surrounding the bill amid fears of long and difficult discussion on the key matter.
On the other hand, escalating fears from the First Republic Bank (FRB) should have also put a floor under the DXY, especially after the troubled bank’s shares dropped another 20% on Wednesday following a 50% slump the previous day. With this, the FRB is likely to face the limits on its Fed borrowings, which in turn spreads the ripple effect across the markets.
Even so, mostly upbeat US data and hopes of the Federal Reserve’s (Fed) pause in the rate hike trajectory, following the next week’s 25 basis points (bps) increase push back the market’s pessimism. Furthermore, growing confidence among traders that there will be no recession in the major economies should have also favored the cautious optimism of late.
On Wednesday, US Durable Goods Orders rose by 3.2% in March versus 0.8% expected and -1.2% prior. Further details suggest that the Durable Goods Orders ex Transportation and ex Defense also rose past market forecasts and previous readings in March.
While portraying the mood, the S&P 500 Futures print mild gains of 0.20% around 4,083 by the press time, following a mixed close of Wall Street.
Moving on, US Dollar Index is likely to continue on its latest downbeat performance amid a cautious mood ahead of the US first quarter (Q1) Gross Domestic Product (GDP), expected to ease to 2.0% on an annualized basis versus 2.6% prior. Should the US growth figures offer a positive surprise, the DXY may reconsider cheering the risk-off mood and lure the buyers.
Technical analysis
A convergence of the 21-DMA and a three-week-old descending trend line, around 101.90, guards short-term US Dollar Index recovery amid sluggish MACD signals. However, the below-50 RSI (14) line suggests bottom-picking.
-
00:14
WTI surrenders OPEC+ surprise production cuts inspired rally amid economic slowdown fears
- The oil price has given up gains made after the surprise announcement of production cuts by OPEC+.
- Surprisingly higher drawdown in weekly oil inventories failed to provide support to the oil price.
- A fresh leg of an interest rate hike by Western central banks would weigh further on the oil demand.
West Texas Intermediate (WTI), futures on NYMEX, have turned sideways in the early Asian session after printing a fresh three-week low of $74.60. The oil price has surrendered entire gains built after the surprise announcement of production cuts by the OPEC+ whose agenda was to provide stability in prices. A sheer sell-off in black gold has come amid rising fears of an economic slowdown in the United States and other developed economies.
Fears of an economic slowdown soared on Wednesday after the data from US Commerce Department showed that orders placed for business equipment with US factories fell sharply in March amid a dismal economic outlook and higher interest rates from the Federal Reserve (Fed). Upbeat Durable Goods Orders data was contaminated with rising orders for commercial aircraft. And, demand for motor vehicles saw a decline.
The oil price failed to capitalize on a sharp drawdown in oil inventories reported by US Energy Information Administration for the week ending April 21. The US agency reported a decline in oil stockpiles by 5.054 million barrels, higher than anticipated by market participants.
As various developed economies such as the US, the United Kingdom, and the Eurozone are facing the heat of high inflation, their respective central banks are expected to raise interest rates further to continue to weigh pressure on persistent inflation. The Federal Reserve (Fed) and the Bank of England (BoE) are highly expected to increase borrowing costs by 25 basis points (bps) while investors are divided over the pace of the interest rate hike to be adopted by the European Central Bank (ECB).
-
00:11
Fed rates are unlikely to go anywhere near zero, even if US economy tips into recession – Morgan Stanley
Morgan Stanley (MS) came out with a research paper late Wednesday suggesting that the major central banks are on track to hit peak interest rates within the next few months. The MS, however, also said that central banks will likely pause rates for an extended period before they start easing, but investors should brace for other scenarios.
Key findings
Bank of Canada may have hit its peak already; in the US, the Federal Reserve seems to be edging closer, as banking sector volatility dialed back expectations around future hikes; and the US and Europe may have more hikes in store as their central banks try to manage renewed inflation.
But investors should not be looking for a return to the low rates they have come to expect in recent cycles.
Markets are now aligned with Morgan Stanley Research’s view that the Fed’s upcoming hike on May 3 will be the last.
However, we do not expect sudden and drastic cuts to follow, and rates are unlikely to go anywhere near zero, even if the U.S. economy tips into recession.
Morgan Stanley Research sees a mild recession as the base case in the U.K. If anything, the Bank of England (BoE ) may hike further to avoid re-accelerating inflation.
We think the European Central Bank (ECB) is also willing to accept a recession to bring down inflation.
Additional readables
- Forex Today: A mixed US Dollar and cautious markets before crucial US data
- S&P 500 bears in control following break of structure amid banking sector woes
-
00:03
EUR/JPY Price Analysis: Rebounds from losses, but technicals point to further downside
- EUR/JPY faces stiff resistance as it trades within a busy zone.
- Bearish RSI and negative RoC indicate momentum gathering for EUR/JPY sellers.
- Upward trend is possible if EUR/JPY remains above 147.50 and tests the 148.00 mark.
The EUR/JPY trimmed some of its Tuesdau’s losses on Wednesday, gaining 0.58% as the pair edged above the 147.00 figure. Nevertheless, technical indicators suggest downward action in the EUR/JPY is warranted, trading at 147.39 as the Asian session begins.
EUR/JPY Price Action
The EUR/JPY pair trades within a busy zone of resistance areas. Additionally, printing multi-year highs at around 148.63, it opened the door for a mean reversion move, after a steep advance achieved since the beginning of April, from around 140.00, towards the 148.60s area.
Oscillators like the Relative Strength Index (RSI) at bearish territory continued to edge lower. The Rate of Change (RoC) registers two negative readings out of three days, indicating that sellers are gathering momentum.
Therefore, the EUR/JPY could re-test the weekly lows of 146.28. The cross-currency pair’s first support would be the 147.00 mark. If EUR/JPY cracks the figure, the next support would be 146.28, followed by the 20-day EMA at 146.16, which has been tracking price action, since the start of the month, as a dynamic support.
Conversely, an upward continuation is likely to happen if EUR/JPY holds above 147.50, exacerbating a test of 148.00, before heading toward the multi-year high at 148.63.
EUR/JPY Daily Chart
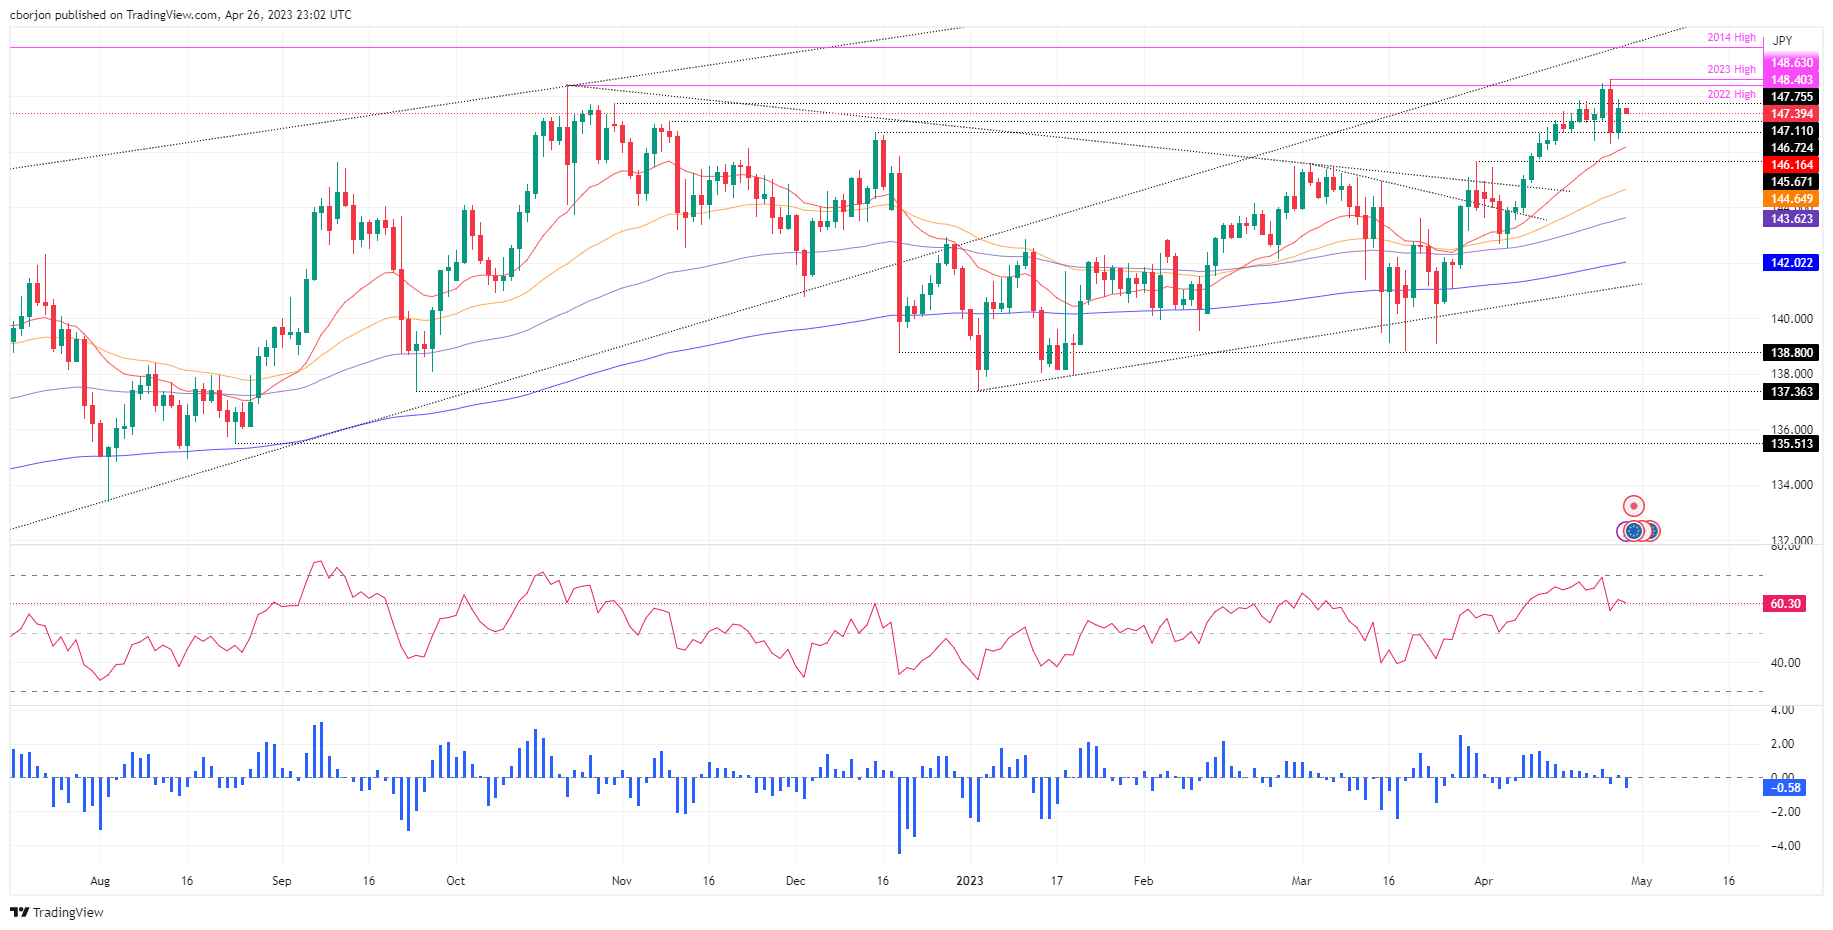
-
00:01
Ireland Consumer Confidence rose from previous 53.9 to 59.2 in April
-
00:01
Silver Price Analysis: XAG/USD remains depressed near $25.00 within bearish channel
- Silver price treats while fading late Wednesday’s corrective bounce.
- Eight-day-old descending trend channel, sustained trading below 200-HMA keeps XAG/USD bears hopeful.
- Absence of oversold RSI adds strength to the bearish bias.
- Silver price recovery needs validation from $25.70 to convince buyers.
Silver price (XAG/USD) drops to $24.90 as it fades the latest corrective bounce amid the early hours of Thursday’s Asian session. In doing so, the bright metal remains inside an eight-day-old downward-sloping trend channel, as well as staying below the 200-Hour Moving Average (HMA).
Not only the bearish chart formation and the sustained trading below the 200-HMA but bearish MACD signals and an absence of the oversold RSI (14) also favor the XAG/USD. It’s worth noting, however, that the below 50 level of the RSI line suggests a bumpy road towards the south.
That said, the 61.8% Fibonacci retracement level of the XAG/USD’s upside between April 03 and 14, near $24.50, appears the immediate support for the Silver price to test.
However, the $25.00 round figure and the aforementioned channel’s bottom line, close to $24.40, seem tough nuts to crack for the commodity sellers, which if broken could make the quote vulnerable to refreshing the monthly low, currently around $23.55.
On the flip side, a convergence of the 200-HMA and 38.2% Fibonacci retracement level guards short-term Silver price upside near $25.10.
Following that, the stated bearish channel’s top line, near $25.25 by the press time, will be in focus.
It should be observed that the XAG/USD run-up beyond $25.25 isn’t an open invitation to the Silver bulls as the $25.70 hurdle comprising the levels marked during mid-April can prod the upside momentum.
Silver Price: Hourly chart
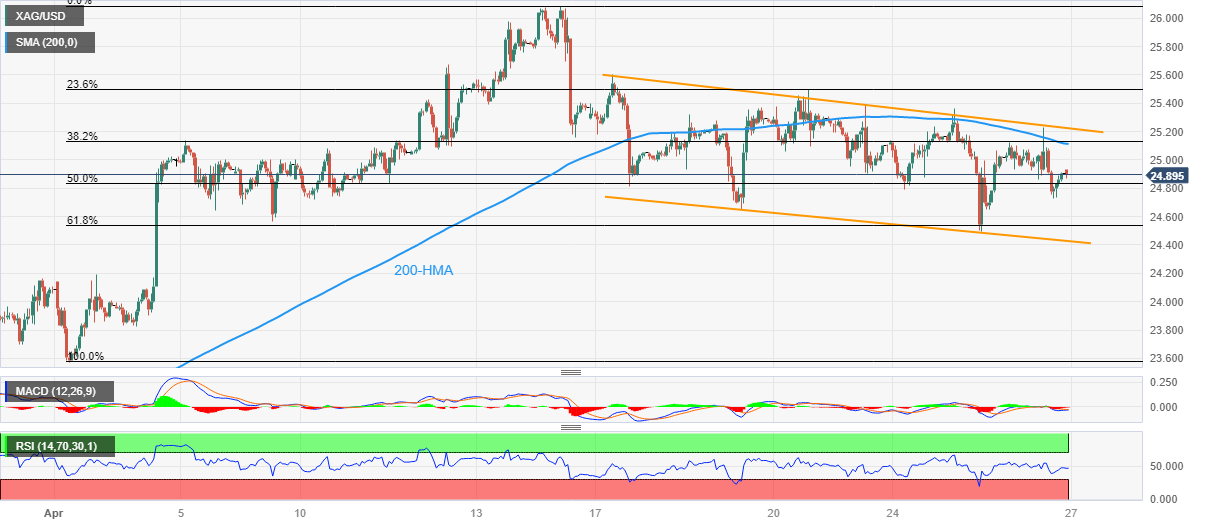
Trend: Further downside expected
-