Notícias do Mercado
-
20:36
Mexico Fiscal Balance, pesos down to -154.83B in November from previous -59.99B
-
20:32
Australia CFTC AUD NC Net Positions fell from previous $-34.1K to $-36.8K
-
20:32
European Monetary Union CFTC EUR NC Net Positions up to €146.2K from previous €142.3K
-
20:32
United States CFTC S&P 500 NC Net Positions: $-174.3K vs previous $-159.8K
-
20:32
Japan CFTC JPY NC Net Positions up to ¥-37.7K from previous ¥-40.9K
-
20:31
United States CFTC Oil NC Net Positions up to 247.6K from previous 238.2K
-
20:31
United States CFTC Gold NC Net Positions rose from previous $128.8K to $136.9K
-
20:31
United Kingdom CFTC GBP NC Net Positions fell from previous £-5.6K to £-10.9K
-
18:17
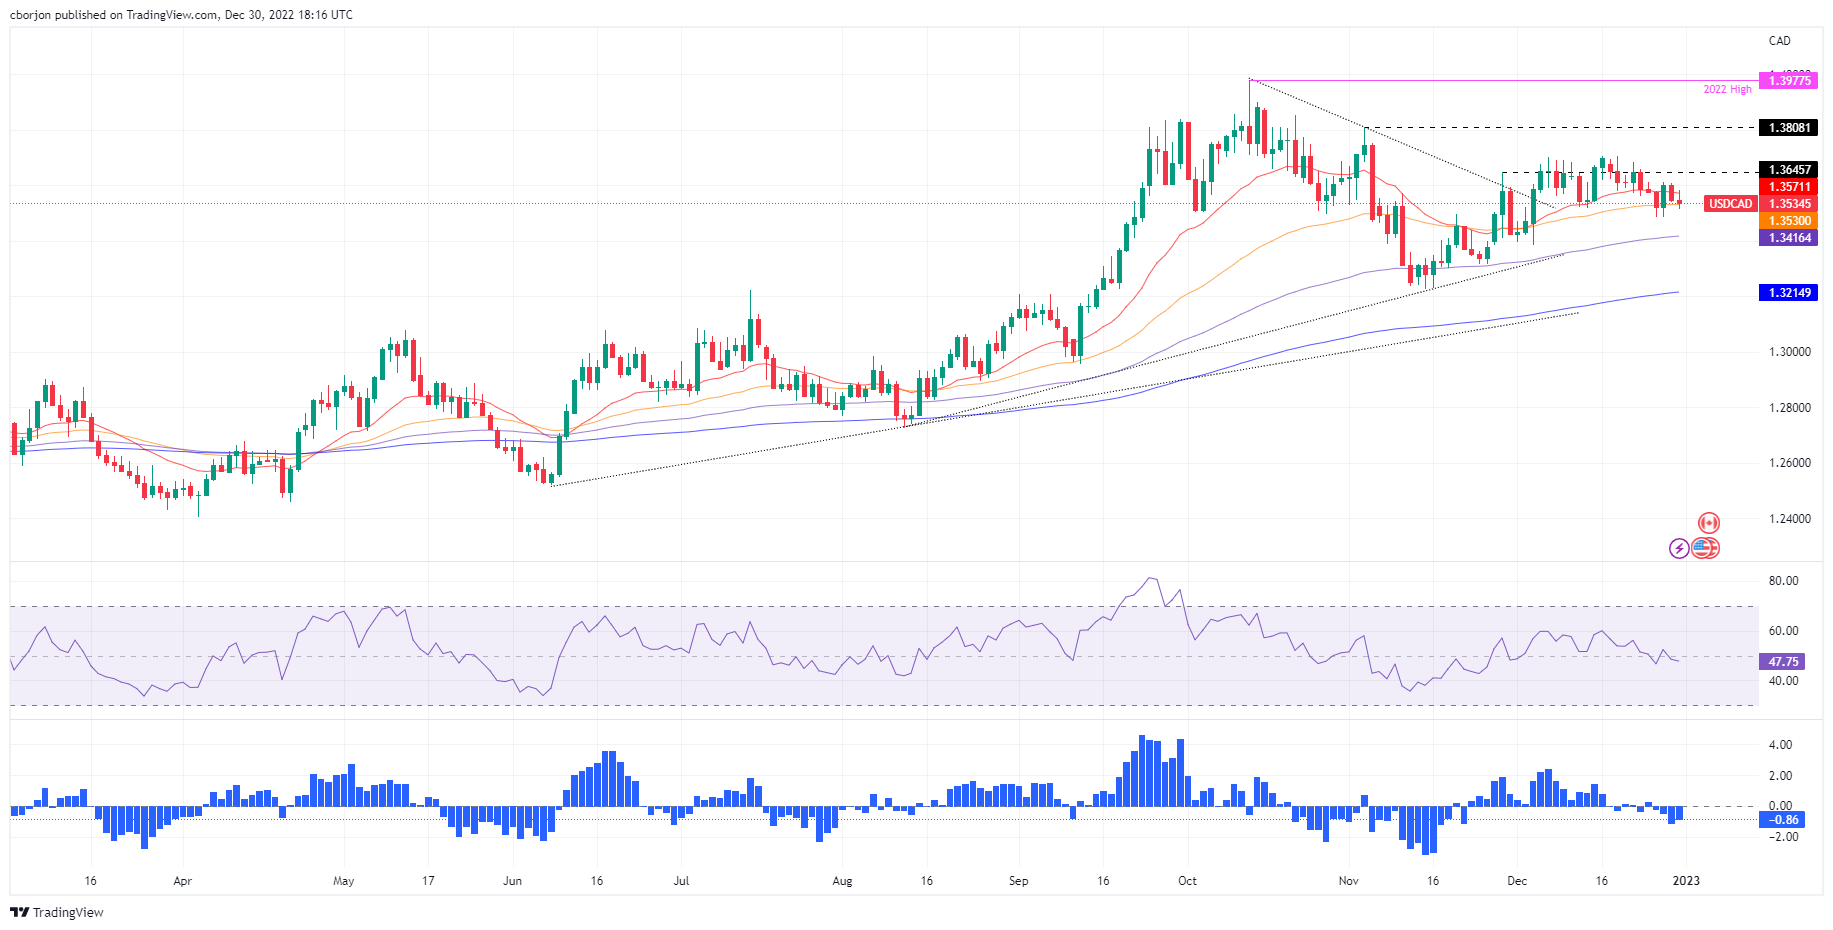
USD/CAD Price Analysis: Battles at the 20-day EMA, drops toward 1.3530s
- USD/CAD struggles at the 20-day EMA and tumbles towards the 1.3530 area.
- USD/CAD Price Analysis: Oscillators offering mixed signals, but price action stalling at crucial EMAs to keep the pair rangebound.
The USD/CAD advance stalled at the 20-day Exponential Moving Average (EMA) at 1.3570 and dropped toward the 50-day EMA as the US Dollar (USD) weakened, while crude oil extended its recovery, a tailwind for the Canadian Dollar (CAD). At the time of writing, the USD/CAD is trading at 1.3530.
USD/CAD Price Analysis: Technical outlook
From a daily chart perspective, the USD/CAD dropped to fresh two-day lows but shy of the weekly low of 1.3484. During the last five trading days, the 20-day Exponential Moving Average (EMA), around 1.3570, capped the USD/CAD recovery towards the 1.3700 figure. And since mid-December, the USD/CAD embarked on successive series of lower highs/lows as the major consolidated ahead of the year’s end.
The Relative Strength Index (RSI), at bearish territory, keeps USD/CAD sellers hopeful for further downside, while the Rate of Change (RoC), suggests selling pressure is waning. Therefore, unless the USD/CAD decisively breaks below 1.3484, that could open the door for further losses. The next support would be the 100-day EMA at 1.3416, ahead of the 1.3400 figure, and the 200-day EMA at 1.3215.
As an alternative scenario, the USD/CAD first resistance would be the 20-day EMA at 1.3570. Once cleared, the next resistance would be 1.3600, followed by the 1.3700 mark.
USD/CAD Key Technical Levels
-
18:02
United States Baker Hughes US Oil Rig Count down to 621 from previous 622
-
17:33
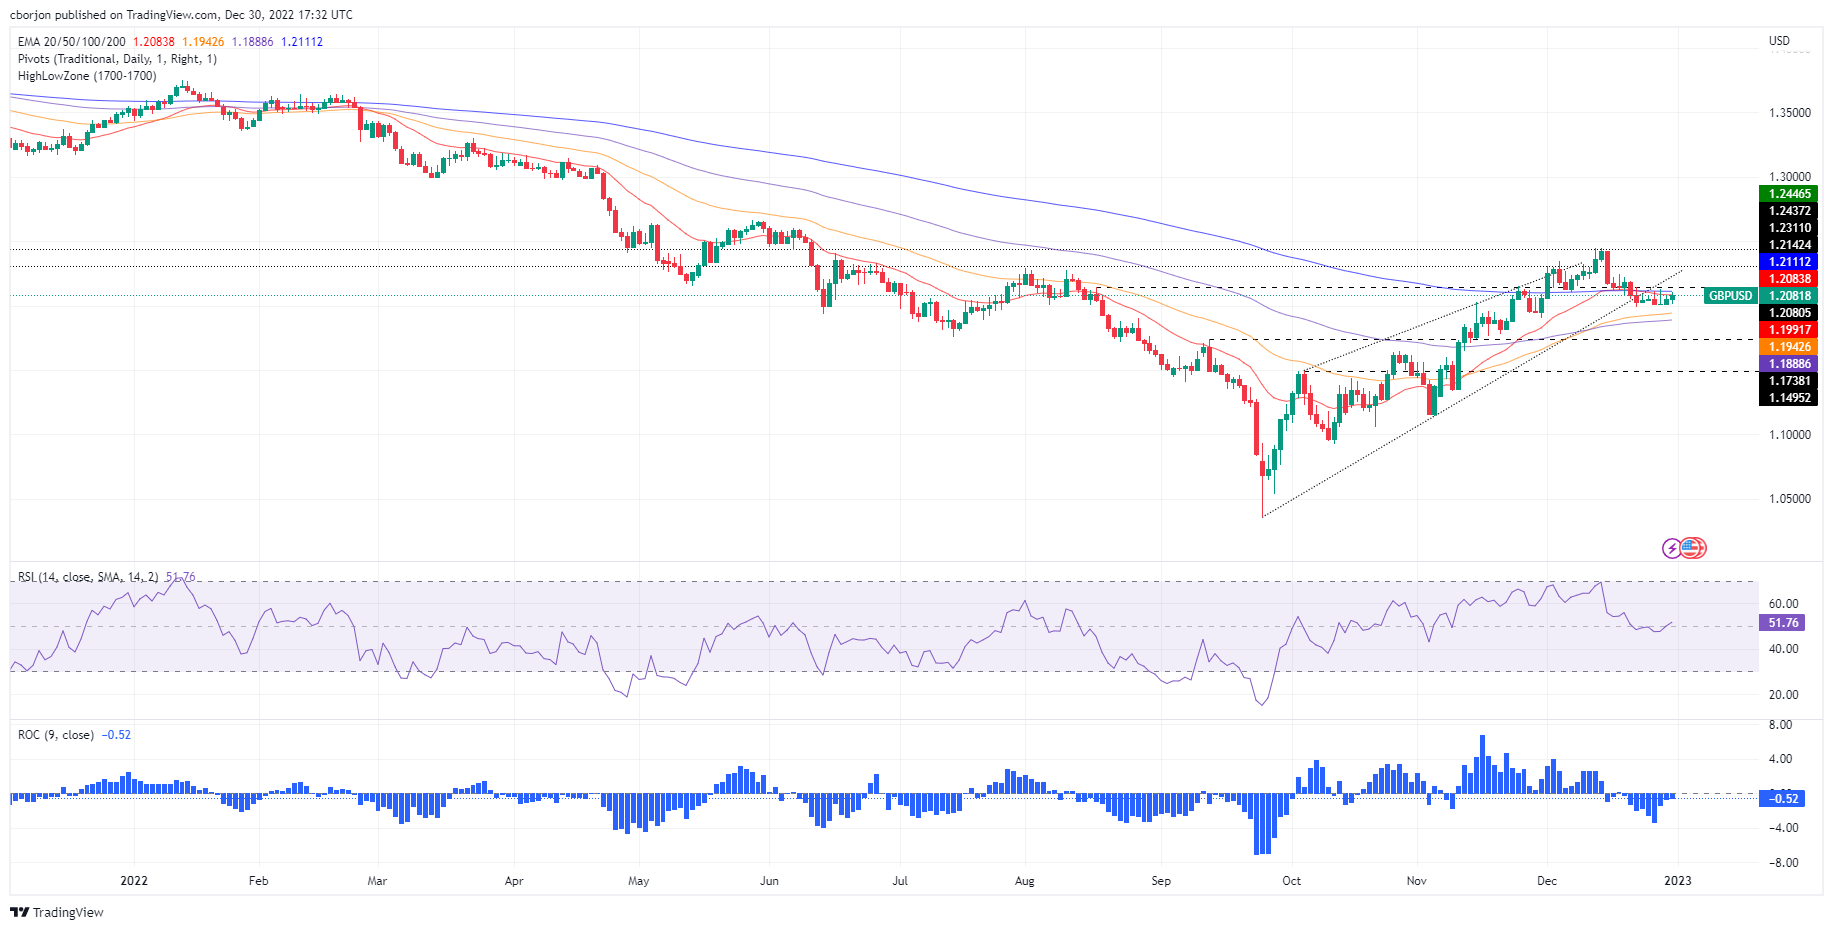
GBP/USD advances steadily towards 1.2080s on a weak USD
- GBP/USD holds to decent gains around 1.2070s but below the 200-day EMA.
- US Chicago Manufacturing PMI exceeded estimates but remains at contractionary territory.
- GBP/USD Price Analysis: Upward biased, but needs to clear the 200-DMA to extend its gains.
The Pound Sterling (GBP) pares its losses against the US Dollar (USD) due to risk aversion dominating the last trading day of 2022. Wall Street extended its losses, while the lack of news kept the GBP/USD within familiar exchange rates. At the time of writing, the GBP/USD is trading at 1.2079 after testing daily lows of 1.2009.
US equities continued to fall amidst the lack of news. The Chicago Purchasing Manufacturing Index (PMI) for December exceeded estimates of 40.5, at 44.9 but remained in contractionary territory. According to sources cited by MarketWatch, the manufacturing sector is suffering from slow demand spurred by a weaker global economy and a backlog of unfilled orders from the pandemic.
In the meantime, the lack of economic data in the UK economic calendar keeps investors adrift to the latest developments linked to the energy crisis in the UK. According to the Times, UK’s finance minister Jeremy Hunt has been weighing how much assistance to provide companies when an existing six-month energy support program worth £18 billion expires in March of 2023.
Meanwhile, the US Dollar Index, a gauge of the buck’s value against a basket of six rivals, extended its losses to 0.40%, at 103.560, contrarily to US Treasury bond yields, and a tailwind for the GBP/USD. The US 10-year benchmark note rate is gaining seven and a half bps at 3.894%.
Ahead into the next week, the UK economic calendar will feature the S&P Global/CIPS Manufacturing PMI on Tuesday. On the US front, the docket will feature the S&P Global Manufacturing PMI.
GBP/USD Price Analysis: Technical outlook
the daily chart depicts the GBP/USD consolidated ahead into the following year. The 200-day Exponential Moving Average (EMA) at 1.2111 is proving difficult resistance to hurdle, while GBP/USD buyers are defending the 1.2000 figure. The Relative Strength Index (RSI) aims higher after crossing the 50 midline, while the Rate of Change (RoC) displays selling pressure waning.
Hence, the GBP/USD is neutral-upward biased, and its first resistance is the 200-day EMA at 1.2111. Break above will expose the December 19 daily high of 1.2242, followed by the 1.2300 figure. As an alternate scenario, the 1.2000 figure is the first defense line for GBP buyers. Once cleared, the next support would be the 50-day EMA at 1.1942, followed by 1.1900.
-
15:56
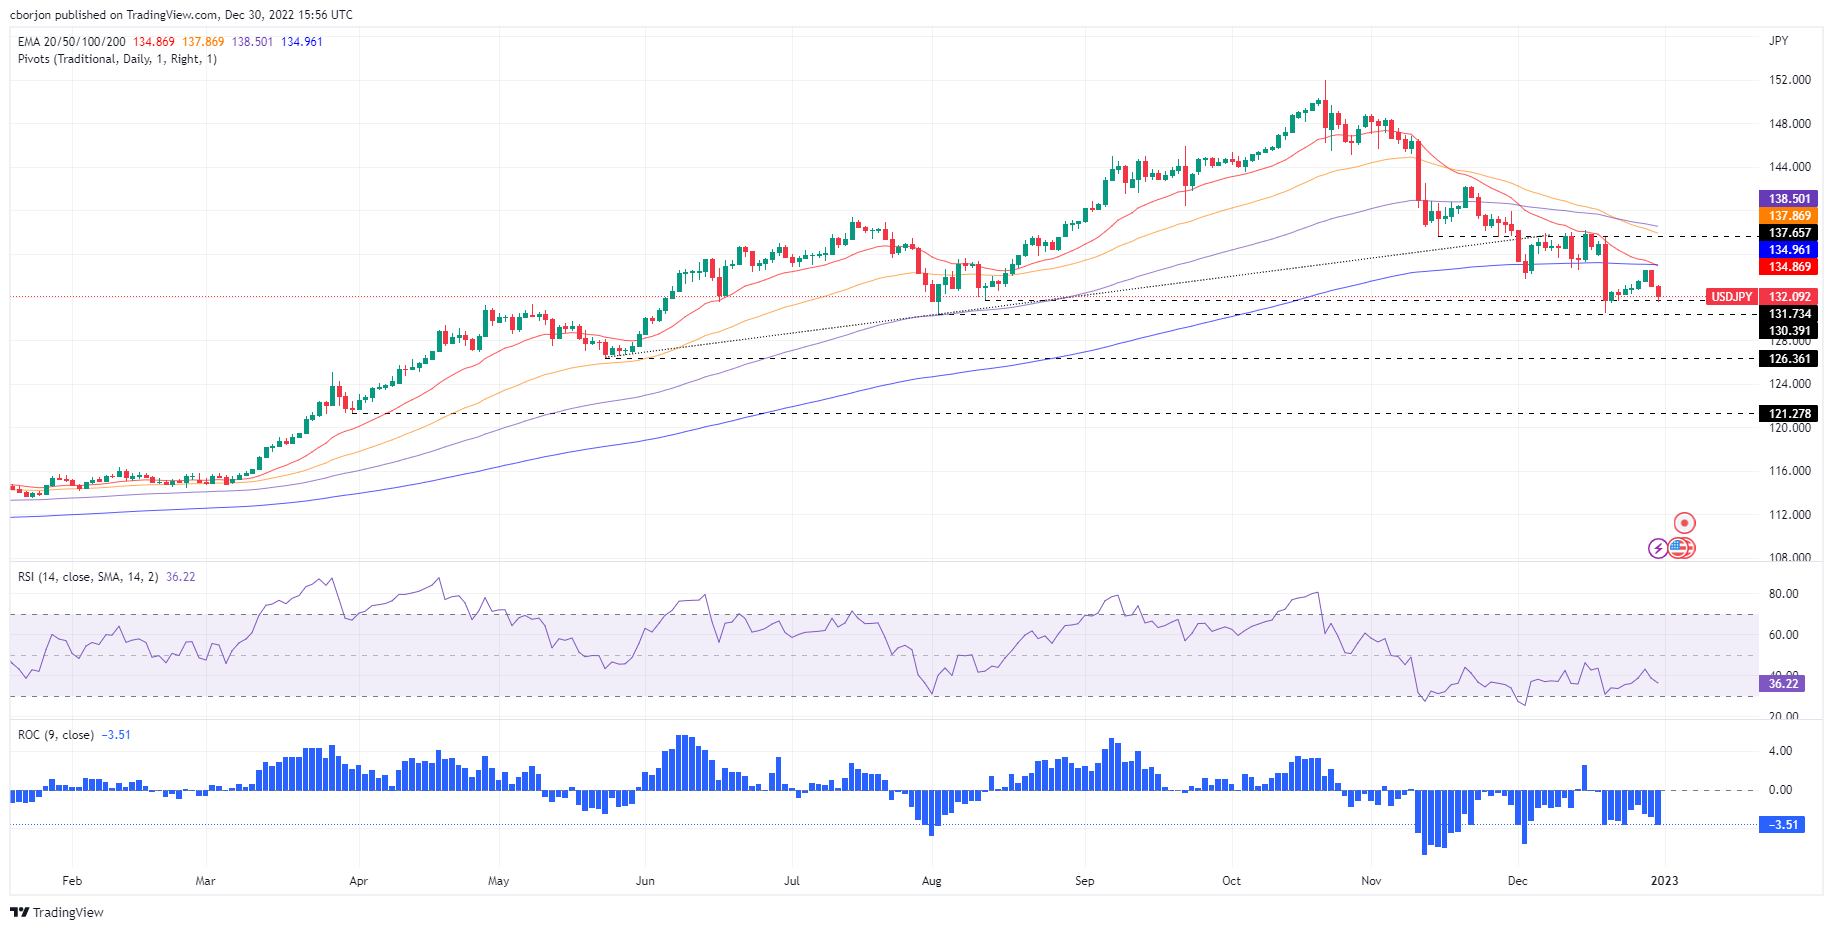
USD/JPY Price Analysis: Stumbles to fresh weekly lows around 132.10s
- USD/JPY drops 0.70% on risk aversion and a softer US Dollar.
- USD/JPY Price Analysis: Downward biased, could extend its losses below 130.00, towards May lows around 126.00.
The USD/JPY is falling for the second consecutive day as risk aversion continues to drive the last trading day of 2022, as shown by Wall Street registering losses. The USD/JPY extended its fall below the December 29 daily low of 132.87 and stabilized at current exchange rates after hitting a daily low of 131.50. At the time of typing, the USD/JPY is trading at 132.11.
USD/JPY Price Analysis: Technical outlook
From a daily chart perspective, the USD/JPY might continue to drop further, but until it breaks the December 20 daily low of 130.56, that could pave the way to test 130.00. At the time of writing, the 20-day Exponential Moving Average (EMA) crossed below the 200-day EMA, exacerbating further downside action. Since peaking at around 151.94 in October, the USD/JPY has recorded successive series of lower highs and lows, confirming the downtrend. Additionally, the Relative Strength Index (RSI) and the Rate of Change (RoC) are in bearish territory, suggesting that sellers are in charge.
That said, the USD/JPY first support would be 130.56, followed by the figure at 130.00. The break below will expose the May 24 swing low of 126.36, followed by the March 31 low of 121.27.
USD/JPY Key Technical Levels
-
15:56
CNY weakness should persist – Credit Suisse
Economists at Credit Suisse expect the Chinese Yuan to continue weakening in the coming months.
Asia FX complex is likely to remain weak in the first part of 2023
“The Asia FX complex is likely to remain weak in the first part of 2023 given the resilient USD trend.”
“Some divergence across the region can be expected, depending on the various economies’ dependence on manufacturing exports. This is one key reason why the CNY is likely to weaken. The other is that imports are likely to accelerate as expansionary fiscal and monetary policy starts to feed through into the real economy in the months to come.”
“With the CNY still 3%-4% above pre-COVID highs in trade-weighted terms, we expect Chinese authorities to be more than comfortable with a meaningful CNY depreciation.”
“Within the region, the IDR should prove more resilient in 2023, due to its trade surplus and attractive carry against the USD, which is among the highest in the region.”
-
15:42
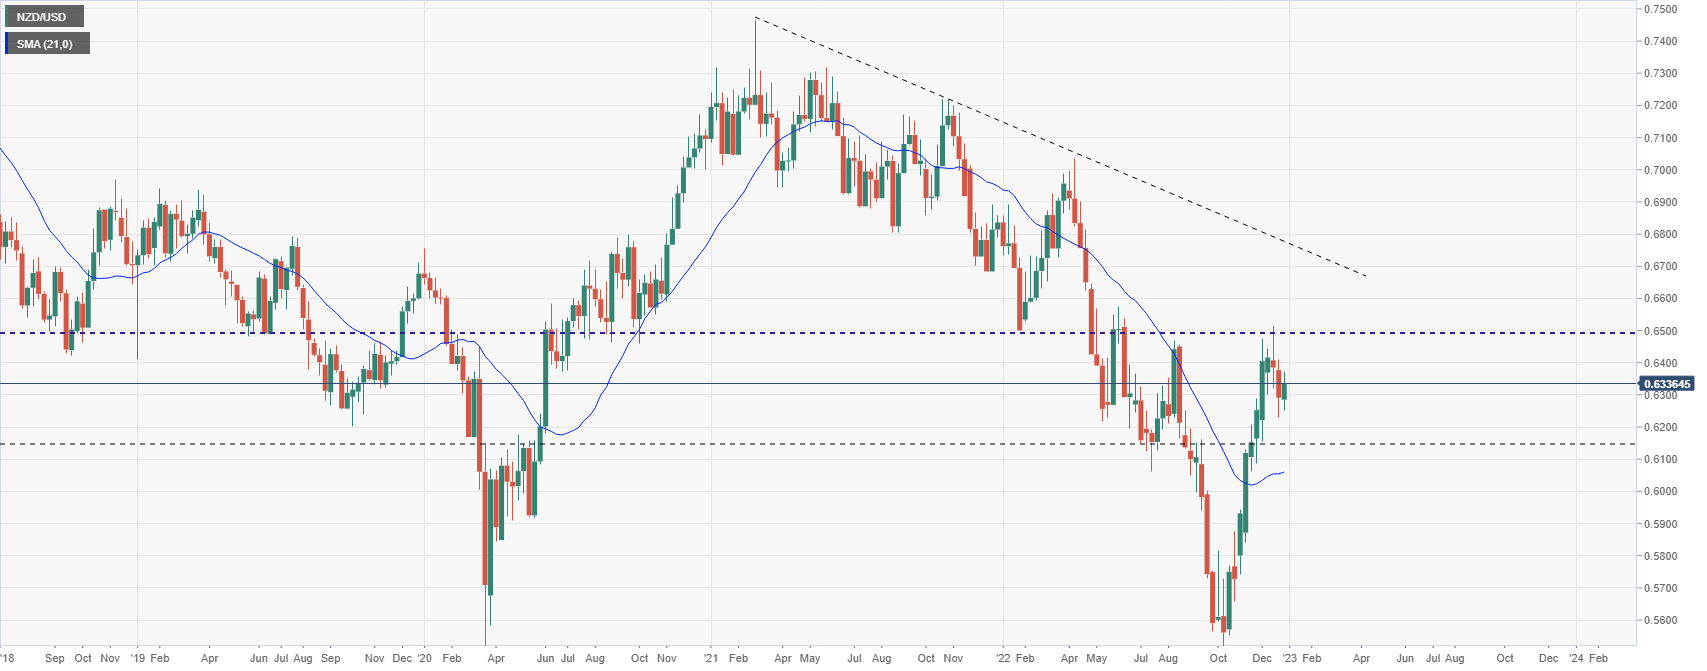
NZD/USD Price Analysis: Kiwi limited while under 0.6350
- Volatility and erratic moves during the last trading session of the year.
- NZD/USD to end year with a 7.30% loss.
- The 0.6500 has the key to more gains for the Kiwi.
The NZD/USD is trading above 0.6300 during the last trading day of 2022. On a volatile session the pair hit the highest level in a week at 0.6373 and then pulled back to the 0.6330 zone.
The Kiwi is among the worst performers on Friday, on a volatile final trading day of 2022. For the year, the NZD lagged among commodity currencies, even after the recovery of the last quarter.
The NZD/USD bottomed during 2022 at 0.5512 in early October. It then started to recovery, trimming yearly losses. The upside move peaked slightly above 0.6500 two weeks ago. The 0.6500 area is a strong barrier that if broken should open the doors to more gains for the Kiwi.
The daily chart shows NZD/USD testing the 20-day Simple Moving Average that is hovering around 0.6350, a horizontal resistance area. While below, risks are tilted toward another test of the bottom of the current range at 0.6240. A daily close well above 0.6350 would point to further gains.
NZD/USD daily chart
-638080116958226339.png)
NZD/USD weekly chart
Technical levels
-
15:26
More downside ahead for Iron Ore – ING
Iron Ore has been one of the worst-performing commodities this year. Hopes of a China recovery in the second half of 2023 should provide support in the medium term. The short-term outlook is more bearish, strategists at ING report.
Iron Ore’s rout to continue until China recovers
“We believe the short-term outlook remains bearish with sluggish demand from China suggesting that prices should trend lower. We expect prices to slide to $85/t in the first quarter of 2023 and hover around $90/t throughout the second and third quarters.”
“Prices should be supported in 2H23 due to expectations of a recovery in China and easing Covid restrictions, with prices moving above $95/t in 4Q.”
-
15:10
Platinum should continue to gain and trade at $1,150 at the end of 2023 – Commerzbank
Platinum price is roughly 3% up for the year, making it the best performing of all exchange-traded precious metals this year. Economists at Commerzbank see Platinum with upside potential.
Only limited upside potential in the short term
“We see only limited upside potential in the short term.”
“Platinum should trade at $1,050 by the middle of next year. With the rising Gold price, Platinum should continue to gain in the second half of the year and trade at $1,150 at the end of the year. The price difference to gold would then be $700, which would mean that Platinum would catch up to some extent with Gold.”
-
15:05
Colombia National Jobless Rate dipped from previous 9.7% to 9.5% in November
-
14:59
Colombia National Jobless Rate fell from previous 9.7% to 8% in November
-
14:59
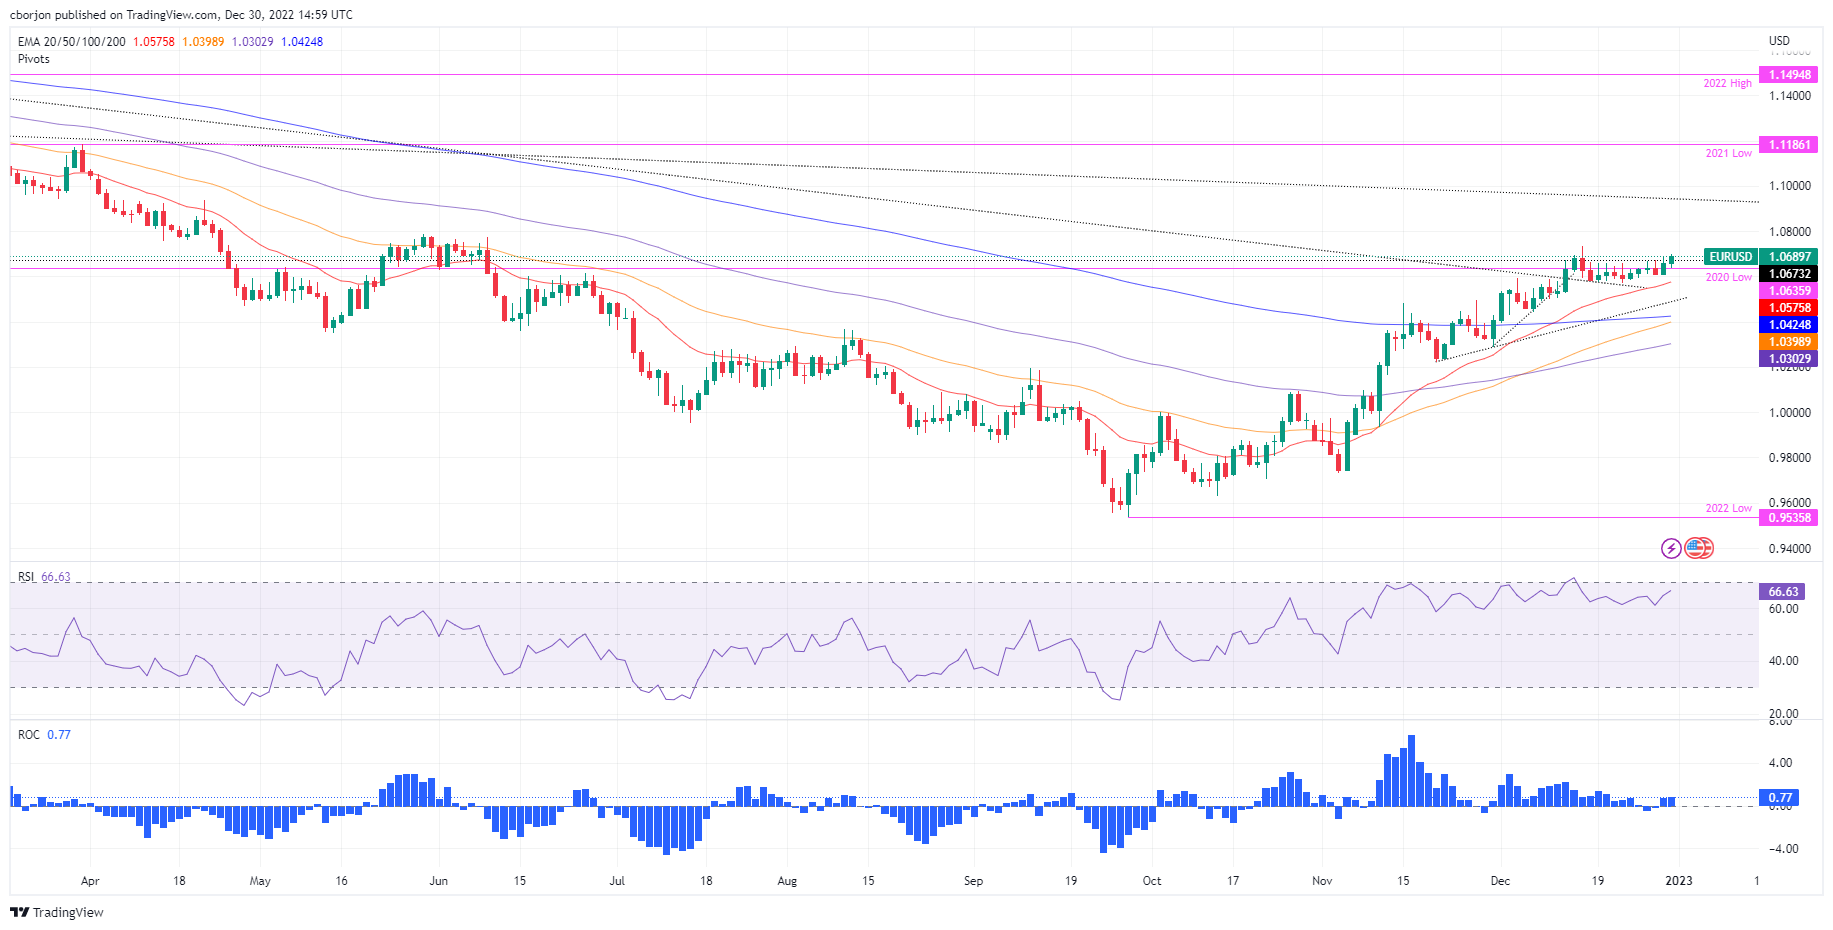
EUR/USD attacks 1.0690s on risk aversion, ECB’s hawkish comments
- EUR/USD is still rangebound, failing to crack the 1.0700 ahead of the year’s end.
- The Chicago PMI for December exceeded expectations and the previous month’s reading.
- EUR/USD Price Analysis: Upward biased, but failure to conquer 1.0700 would expose the pair to selling pressure.
The EUR/USD advances modestly in the last trading day of 2022, during the North American session, though above its opening price by 0.13%. A light economic calendar keeps the EUR/USD pair within familiar ranges ahead of the week, month, quarter, and year-end. At the time of writing, the EUR/USD is trading at 1.0695.
Wall Street is set to open lower as US equity futures tumble with no fundamental catalyst. The US economic calendar is light, with the release of Chicago’s Purchasing Managers Index for December at 44.9, beating an estimate of 40. Thursday’s release of unemployment claims exerted downward pressure on the US Dollar (USD), weakening against most of the G7 currencies.
The US Dollar Index (DXY), a measure of the buck’s value against a basket of currencies, drops 0.33%, down to 103.634. Even though the greenback is falling, the US 10-year Treasury bond yield is rising five bps, at 3.869%.
Aside from this, the European economic docket revealed that inflation in Spain dropped for the fifth consecutive month, to 5.6% YoY, below November’s 6.7% reading. However, due to thin liquidity trading conditions and 2023 around the corner, it failed to trigger any upside reaction that could break the EUR/USD 1.0600-90 trading range.
Of late, ECB’s Stournaras said that rates should be restricted sufficiently, lifting the pair towards 1.0700, before erasing those gains.
Meanwhile, on geopolitics, Russia and China continue to deepen their ties, as Russian President Vladimir Putin and China’s Xi Jinping videoconference showed intentions for further cooperation between both countries on trade, energy, finance, and agriculture.
Furthermore, Russia’s invasion of Ukraine continued during new year’s eve, as the fourth wave of drones attacked civilian buildings, as reported by Ukrainian authorities. Shelling continued in Kiyv and Kharkiv, killing at least two people.
EUR/USD Price Analysis: Technical outlook
From a technical perspective, the EUR/USD is still upward biased. Nevertheless, the inability to decisively crack the 1.0700 mark would expose the pair to selling pressure. Oscillators like the Relative Strength Index (RSI) and the Rate of Change (RoC) favor EUR/USD upside, but low volumes keep traders at bay.
However, the EUR/USD key resistance levels lie at 1.0700, followed by the December 15 daily high of 1.0736 and 1.0800. On the other hand, if the EUR/USD drops below 1.0638, a test of 1.0600 is on the cards, followed by the 20-day Exponential Moving Average (EMA) at 1.0575.
-
14:59
Colombia National Jobless Rate: 8.8% (November) vs previous 9.7%
-
14:59
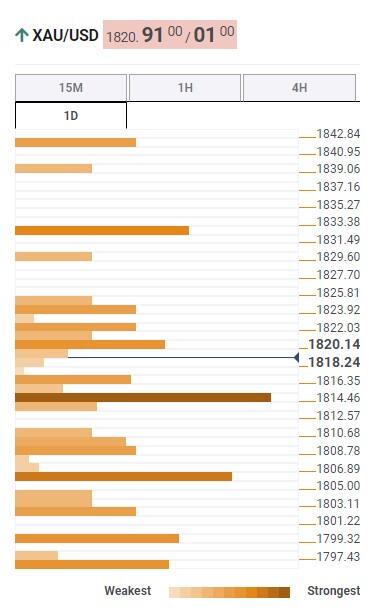
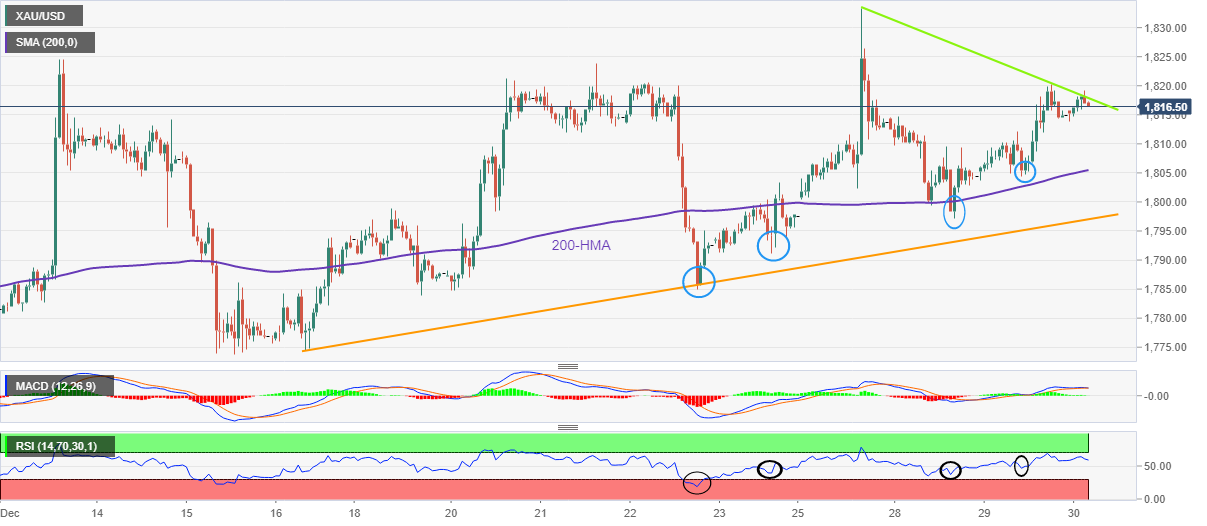
Gold Price Analysis: XAU/USD remains unable to consolidate above $1,820
- Gold prices print new highs, but continues to have difficulties holding above $1,820.
- Divergence in metals: gold tests daily highs while silver hits fresh lows.
- Volatile final hours of 2022 across financial markets on the London fix.
Gold prices are hovering around $1,820 about to end 2022 practically flat for a wild year. On Friday, XAU/USD rose to as high as $1,825 and then pulled back. The bias point to the upside, but the yellow metal continues to show difficulties in holding above the $1,820 zone.
Silver and gold prices showed an unusual divergence. Silver tumbled from fresh highs at $24.15 to 23.66$ while gold remained near the top. XAU/USD is up 0.21% and XAG/USD falls by 0.95%.
Volatility is on the rise during the last hour of trading of the year across financial markets. The Dow Jones is falling by 0.76% and the Nasdaq by 1.25%. US stocks are about to have the worst year in more than a decade.
It has been a wild year for gold. It reached levels above $2,000 during the first half of the year and then tumbled until it built a base around $1,615 from where it started a recovery that is still going on.
Gold daily chart
-638080091052713634.png)
-
14:57
GBP to remain under pressure in 2023 relative to other G10 currencies – ANZ
2022 has been a difficult year for the UK. Economists at ANZ Bank expect the GBP to remain under pressure in 2023 relative to other G10 currencies.
Structural challenges
“In view of weak fundamentals in the UK, we expect the GBP to remain under pressure in 2023 relative to other G10 currencies.”
“The fundamental backdrop for the UK is filled with uncertainty. Over the short term, households will have to deal with elevated inflation, higher taxes and the increased costs of servicing debt. This will dent consumption and dampen the already subdued growth outlook. All of these are GBP negative.”
“The fiscal and political risk premium in the GBP has decreased considerably since Cable touched a low of 1.0350 in September. The GBP is unlikely to test those lows again. Considering the new government and the fiscal plan announcement, our view is that it has established a new floor at 1.15 against the USD.”
-
14:45
United States Chicago Purchasing Managers' Index above forecasts (41.2) in December: Actual (44.9)
-
14:33
Monetary policy is partly restrictive in the US and generally still expansionary in the Eurozone – Natixis
Is US or Eurozone monetary policy restrictive, or will it become restrictive? Analysts at Natixis look if the two conditions for monetary policy to become restrictive are met.
Conditions for monetary policy to become restrictive
“For monetary policy to be restrictive: The real interest rate (calculated with core inflation or with the GDP deflator) must be higher than potential growth; Mortgage rates must be higher than the per capita wage growth rate.”
“In the US, the real long-term interest rate is still well below potential growth, but the mortgage rate is higher than nominal wage growth. It is normal to see a significant downturn in residential investment; monetary policy is therefore partially restrictive.”
“In the Eurozone, the real long-term interest rate is well below potential growth, and the mortgage rate is lower than nominal wage growth; monetary policy is therefore completely expansionary.”
-
14:04
Gold and Silver unlikely to outperform in the coming months – HSBC
Strategists at HSBC remain neutral on Gold and Silver as they see muted momentum.
Higher rates and real bond yields create a competitive disadvantage for Gold
“Despite the recent bounce in commodity prices, we do not expect Gold and Silver to outperform in the coming months.”
“USD’s recent strength has weighed on metals, while higher rates and real bond yields create a competitive disadvantage for Gold compared to cash and bonds.”
See – Gold Price Forecast: XAU/USD to rebound slightly next year as Fed easing starts – ING
-
13:55
EUR/GBP reaches fresh three-month highs above 0.6860 as the pound loses ground
- The Euro appreciates for the second consecutive day to reach fresh three-month highs at 0.8875.
- The Pound losses ground weighed by grim UK economic perspectives and hopes of a slower BoE tightening.
- EUR/GBP appreciates about 5.5% in 2022 with the Sterling hit by the UK's political drama.
The Euro finally managed to pierce the 0.6860 resistance area on Friday, extending its rebound from session lows at 0.6820 to fresh three-month highs at 0.6870 so far. The common currency is taking advantage of a moderately weak Sterling on a sluggish pre-holiday session.
The pair has shrugged off the mild risk aversion on the back of concerns about the consequences of the strong COVID-19 outbreak in China and the escalating tensions in Ukraine, to appreciate for the second consecutive day.
On the other hand, the Pound remains offered across the board, weighed by the grim economic perspectives in the UK and hopes that the Bank of England will slow down its monetary tightening path over the coming months.
The Sterling is about to close its worst year since 2016
The EUR/GBP is set to end the year with a 5.5% appreciation, favored by the broad-based pound weakness in 2022. The Sterling was hit hard by the political uncertainty during the last months of Boris Johnson's mandate and Liz Truss’ tax reform fiasco.
Johnson’s successor as in Downing Street tax cuts plan caused a historical Pound crash in October and prompted an intervention by the Bank of England to avert a credit crunch.
The pound has firmed up somewhat in the fourth quarter, as the election of Rishi Sunak calmed the markets although the negative economic outlook coupled with soaring inflation is keeping GBP buyers at bay.
Technical levels to watch
-
13:36
Weak economic momentum is expected to continue into early 2023 – Deutsche Bank
Economists at Deutsche Bank expect mild US and European recessions in the first half of 2023 with growth then picking up.
China to register significantly more dynamic growth in the year ahead
“We are expecting a mild recession overall in the Eurozone at the turn of the year. With recovery starting in the second quarter, economic growth for the full year 2023 is likely to be 0.3%. The main risk factor remains energy, coupled with a possible shortage of gas in winter 2023/2024.”
“If inflation rates continue to decline and there is no need for robust Fed intervention, the US economy could return to growth in the second half of 2023, finishing the year overall at +0.4%.”
“Economic momentum in China is likely to be much stronger next year. We are expecting growth of around 5% in 2023 after an estimated 3.3% this year.”
-
13:28
South Africa Trade Balance (in Rands) increased to 7.98B in November from previous -4.31B
-
13:24
India FX Reserves, USD down to $562.81B in December 23 from previous $563.5B
-
13:24
India Bank Loan Growth declined to 17.4% in December 12 from previous 17.5%
-
13:06
EUR/USD: Euro to stay weaker for longer in a 1.09-1.14 average range – Citi
The Euro faces multiple headwinds. Economists at Citi expect the EUR/USD pair to stay in a 1.09-1.14 average range.
ECB is expected to hike rates to 2.5%
“The single currency zone faces an unfavorable mix of lower growth, high inflation and rising rates in the months ahead.”
“The ECB is expected to hike rates to 2.5% amid fears of a severe winter’s effect on energy consumption, China’s delayed recovery and likely recession in Europe. These forces suggest the Euro staying weaker for longer in a 1.09-1.14 average range.”
“The caveat is the timing of a turn in the US Dollar. Should the Fed turn more dovish in its monetary policy, the USD could weaken across the board. The timing of such a move remains difficult to forecast, however.”
-
12:54
AUD/USD keeps pushing against the 0.6800 resistance area on pre-holiday trading
- The Aussie, rejected at 0.6805, remains close to the 0.6800 resistance area.
- A mild risk aversion on the back of COVID-19 cases in China keeps AUD bulls in check.
- AUD/USD is set to end the year with a nearly 6.5% decline.
The Aussie has spiked up to two-week highs at 0.6805 during Friday’s European trading. although the pair is lacking follow-through above the 0.6800 resistance area and has retreated to 0.6795 so far.
The AUD remains bid on a sluggish market session
The Australian Dollar appreciates for the sixth consecutive day on Friday, unfazed by the moderate risk aversion, with the USD showing a soft tone across the board.
On Thursday, the US Department of Labor reported an increment of 9,000 on the weekly jobless claims, to a total amount of 225K. Continuous claims rose to 1.71M from 1.669M in the same week, which increased doubts about the US economic momentum and added selling pressure to the USD.
The pair however is hesitating at 0.6800 amid the growing uncertainty regarding the evolution of the recent COVID-19 outbreak in China, which has dampened previous hopes of a strong rebound in the Chinese economy and is casting doubts about the global economic outlook.
AUD/USD, on track to a nearly 6.5% decline in 2022
Looking back, the US Dollar is about to post solid performance in 2022, having appreciated about 6.5% over the last 12 months.
After a rather positive year opening, the risk-sensitive Aussie dropped steadily from March on, as the Russian invasion in Ukraine hammered risk appetite and aggravated fears of a global economic slowdown.
At the same time, the aggressive monetary tightening pace adopted by the Federal Reserve, which has raised rates by 425 basis points in 2022 acted as a tailwind for the US dollar.
The pair bottomed at a two-year low at 0.6175 in October and has been appreciated steadily ever since as speculation about an economic recession in the US and expectations of a slower Fed monetary tightening next year have hurt USD's demand across the board.
Technical levels to watch
-
12:26
S&P 500 Index: 2023 year-end range is wide at 3,800-4,500 – BNY Mellon
2022 was a volatile year for equities. Ecnomists at BNY Mellon expect S&P 500 Index to remain under pressure before starting to move higher.
More pain before gain in equities
“We don’t expect stocks to bottom until the market prices in a recession and Wall Street’s consensus 2023 earnings per share (EPS) estimate falls further. At $232, the consensus EPS estimate is considerably higher than our $205-$215 estimate, which reflects the weakening economy.”
“Our 2023 year-end range for the S&P 500 is wide at 3,800-4,500, reflecting the considerable macro-uncertainty ahead.”
“Although it is unlikely the market will have a V-shaped recovery given the prospect of higher rates and inflation continuing in the coming years, we do expect returns to be positive in 2023.”
-
12:03
USD/CNY to slump towards 6.65 by end-2023 – ANZ
USD/CNY hovers around the 6.95 level. Economists at ANZ Bank expect the pair to edge lower next year towards 6.65.
Recovery in China’s growth reduces the need for further PBoC’s easing
“Although it will be a bumpy road ahead as China reopens, at least the shift in the narrative from overwhelmingly negative in 2022 towards a more hopeful tone for 2023 will help prompt inflows and encourage exporters’ conversion of accumulated dollar receipts. A recovery in China’s growth reduces the need for further People’s Bank of China easing as well.”
“We do not foresee a rapid rebound in outbound Chinese tourists at first due to an anticipated backlog in passport applications. This should allay any concerns over potential outflows.”
“We forecast a rebound in the CNY to 6.65 against USD by the end of 2023.”
-
12:02
USD/CAD dives to fresh lows below 1.3525 on a thin market session
- The Dollar resumes its downtrend and dives to intra-day lows near 1.3500.
- The Canadian Dollar appreciates amid a moderate pick up in oil prices.
- USD/CAD is about to end the year with a 7% appreciation.
The US Dollar has resumed its downtrend against its Canadian counterpart and is exploring fresh intra-day lows sub-1.3525 on the last trading day of the year, with the market in a pre-holiday mood.
The Canadian Dollar ticks up amid a moderate rebound in oil prices
The Lonie is gaining some ground during Friday’s European trading session, underpinned by a milder recovery on crude prices and a sluggish US dollar.
Oil prices have picked up to the $78.50 area on the European morning trade, after bouncing up from session lows at $77.75 earlier today. On a wider perspective, however, crude oil remains trading sideways, weighed by concerns about the demand outlook.
On the other hand, the US Dollar remains on the back foot despite the moderately higher US Treasury bonds. Weekly jobless figures released on Thursday showed a 9,000 increment to 225K in the week of December 24 while the continuous claims rose to 1.71M from 1.669M in the same week, which added pressure on an already soft USD.
USD/CAD is about to close the year with a 7% appreciation
The USD is set to end the year 7% above its opening levels. The pair appreciated steadily through the first half of the year, buoyed by the Federal Reserve’s aggressive monetary tightening path and investors’ concerns about a global economic slowdown.
Over the last months, however, increasing speculation about a recession in the US and hints about a slowdown in the Fed’s monetary tightening cycle has triggered a nearly 3% drop from the 1.3970 two-year high seen in October.
Technical levels to watch
-
12:01
Chile Industrial Production (YoY) fell from previous -4.2% to -7.8% in November
-
11:41
India Infrastructure Output (YoY) climbed from previous 0.1% to 5.4% in November
-
11:41
Aluminium to slide in early 2023 on poor near-term economic outlooks – ING
Aluminium prices have been highly volatile in 2022.Next year, negative macro sentiment will continue to put downward pressure.
Aluminium faces macroeconomic headwinds
“Looking ahead to 1Q 2023, the risk for Aluminium prices will be mainly to the downside, with the prolonged war in Ukraine, rising energy prices, low gas availability, high inflation and weakening downstream demand all adding to the bearish outlook for the lightweight metal.”
“In the short-term, the market’s focus will remain on the bigger macro-economic and demand-side problems, with prices expected to fall further to $2,150/t in 1Q 2023.”
“We believe a recovery in price should start in 2Q 2023, although any recovery is likely to be slow.”
-
11:30
India M3 Money Supply fell from previous 9.1% to 8.8% in December 16
-
11:29
Reuters Poll: WTI seen averaging $84.84 in 2023
According to the findings of a recently conducted Reuters poll, the barrel of West Texas Intermediate (WTI) is expected to average $84.84 in 2023, down from $87.80 in November's survey.
The barrel of Brent is seen averaging $$89.37 in 2023, compared to $93.65 in November's survey.
The uncertainty surrounding the global economic outlook and heightened concerns over the impact of the coronavirus situation in China on the energy demand are cited as reasons behind the downward revisions.
Market reaction
Crude oil prices showed no immediate reaction to this headline and the WTI was last seen trading at $78.22, where it was down 0.65% on the day.
-
11:29
EUR/USD expected to be 1.05 by end-2023 – Deutsche Bank
Following the winter, growth in the Eurozone and in China, in particular, should pick up again. This could weaken the USD and lift the EUR, according to economists at Deutsche Bank.
Difference between returns in the US and the Eurozone should diminish
“The difference between returns in the US and the Eurozone should diminish as the year 2023 progresses. The US interest rate cycle will probably reach its peak in spring 2023 while the European Central Bank raises interest rates further.”
“Growth in the Eurozone and in China in particular may pick up again following a weaker winter. For this reason, we expect the EUR/USD rate to be around 1.05 at year-end 2023.”
-
11:27
Portugal Consumer Price Index (YoY) fell from previous 9.9% to 9.6% in December
-
11:26
Portugal Consumer Price Index (MoM) fell from previous 0.3% to -0.3% in December
-
11:26
India Federal Fiscal Deficit, INR dipped from previous 7581.37B to 9.781B in November
-
11:21
WTI prices, wavering below $79 on concerns about China
- Oil prices remain within recent ranges, capped below $79.
- Concerns about COVID-19 infections in china are weighing on crude prices.
- WTI oil to end 2022 little changed after having surged near all-time highs.
Crude oil prices are trading sideways in a range between $77 and $79 for the second consecutive day, with investors increasingly wary about the surging COVID-19 infections in China and its consequences for the global economy.
Concerns about the outlook of oil demand are weighing on prices
Investors' optimism about the decision of the Chinese Authorities to lift the restrictions on inbound travelers faded in the second half of the week as news from China cast a shadow over hopes of a strong economic recovery in the Asian Country.
Furthermore, most of the major world economies have announced mandatory coronavirus tests for all arrivals from China, which is adding woes to the outlook for crude oil demand.
On Thursday, the United States Energy Information Administration (EIA) announced a 0.718 million increase in US oil stocks, in the week of December 23. These figures confront the market consensus of a 1.53 million barrels decline and have added bearish pressure on oil prices.
Oil prices, barely changed in the year
Crude prices are on track to end the year near the levels of early January. The sharp oil rally seen after Russia invaded Ukraine, which pushed the WTI barrel to levels neat $127, lost steam in the second half of the year.
The high energy cost, which has boosted inflation to its highest levels in decades has triggered concerns about a global economic slowdown which are being exacerbated by the recent coronavirus outbreak in China.
Technical levels to watch
-
11:03
Central banks to take rates higher, not lower, in 2023 – BMO
Central banks are not done yet. Given the inflation outlook, economists at the Bank of Montreal expect further rate hikes even into the second half of 2023.
Core inflation will prove to be more persistent
“We look for headline and especially core inflation trends to still be north of 3% by the end of 2023, simply too high for central bank comfort.”
“Given our view on core inflation, we believe the main story is that there will be no scope for rate cuts in the year ahead, and that central banks will maintain these relatively high rates until underlying inflation is truly cracked – and that process will take time. We don’t look for rate relief until 2024.”
-
10:45
Nickel to remain under pressure as surplus builds – ING
Nickel has had a tumultuous year. In the view of economists at ING, the short-term outlook remains bearish amid a deteriorating macro picture and sustained market surplus.
Nickel surplus to build
“We forecast Nickel prices to remain under pressure in the short term as a surplus in the market builds, however, the tightness in the class 1 market is likely to offer some support.”
“We see prices hovering between $20,000/t and $20,500/t over the first two quarters of 2023 before gradually increasing to $21,000/t in 3Q and $22,000/t in 4Q as the global growth outlook starts to improve.”
-
10:37
USD/CHF capped below 0.9250 remains close to multi-month lows
- The dollar fails to break 0.9250 and approaches nine-month lows at 0.9210.
- The mild rebound on US Treasury bonds is failing to lift the USD in a pre-holiday session.
- USD/CHF is on track to end the year with a minor appreciation.
The US Dollar’s mild recovery attempt seen during Friday’s Asian session has been capped at 0.9250, and the pair is giving away gains during the European trading, reaching prices close to the nine-month low of 0.9210.
The Dollar remains soft on a sluggish year-end session
The Greenback is failing to capitalize on the US Treasury bond’s modest recovery. The US Dollar Index is trading nearly 1% down on the day with the market in a pre-holiday mood on the last trading day of the year.
US macroeconomic data was not particularly Dollar-supportive on Thursday, with the Initial jobless claims up by 9,000 to 225K in the week of December 24 while the continuous claims rose to 1.71M from 1.669M in the same week.
Beyond that, concerns about the global economic impact of the surging COVID-19 infections in China and the rising tensions in Ukraine, whose main cities are suffering one of the worst artillery attacks since the start of the war, are taking a toll on risk appetite.
USD/CHF is about to end the year nearly unchanged
The pair is set to end 2022 with a minor appreciation, after having retreated nearly 10% over the last quarters.
The USD appreciated sharply in the first half of the year, boosted by the Federal Reserve’s hawkish monetary policy stance, to drop just as quickly over the last quarter on weighed by rising speculation about a potential US recession in 2023 and investors' expectations of a slowdown in the Fed’s rate hike path.
Technical levels to watch
-
10:18
NZD/USD to stay in the low 0.60 range in the early part of 2023 – ANZ
NZD/USD is trading above the 0.63 level. In the early part of next year, economists at ANZ Bank expect the pair to remain in the low-0.60s.
AUD/NZD appreciation in 2023
“We see some residual USD strength in the early part of 2023, keeping the NZD/USD in the low 0.60 range.”
“We expect New Zealand’s economic woes in the second half of 2023 to manifest primarily in NZD weakness against crosses, particularly AUD/NZD.”
See: AUD/USD to remain below 0.70 through to June before rising into year-end – ANZ
-
10:00
Greece Retail Sales (YoY) down to -2.2% in October from previous 1.4%
-
10:00
Greece Producer Price Index (YoY) dipped from previous 35.4% to 26.2% in November
-
09:54
GBP/USD capped below 1.2075, remains treading water around 1.2050
- The pound remains within recent ranges, unable to breach the 1.2075 resistance.
- Concerns about China and Ukraine are weighing on the GDP.
- GBP/USD on track to its worst year since Brexit.
The pound remains unable to capitalize on a softer US dollar on the last trading day of the year. The pair has failed to break above 1.2075 and keeps moving within a 60-pip range on both sides of 1.2050 for the second consecutive day.
Concerns about China and Ukraine and BoE’s dovishness weigh on the GBP
Concerns about the fast expansion of coronavirus cases in China have kept risk appetite in check over the last half of the week. Reports from independent sources talking about 9,000 daily deaths contrast with the information by official institutions reporting 5,000 new infections and only one death on Friday.
These contradictions have prompted several countries to impose mandatory COVID-19 tests on all arrivals from China and are casting doubts about the strong economic recovery in the Asian dragon, triggered by the end of the Zero-COVID policy.
Beyond that, the Russian army keeps shelling heavily Kyiv and other Ukrainian cities for the second consecutive day after Kremlin’s refusal to accept Zelenski’s peace plan. The rising tension in the eastern-European country is weighing risk appetite further.
In the UK, the grim economic perspectives forced the Bank of England to lift its foot from the rate-hike pedal in December. This was taken by the markets as a signal of a slowdown in the tightening cycle, which has added negative pressure on the GBP
Political uncertainty and a weak economy have crushed the pound in 2022
The sterling is set to close the year with a decline of about 11% in its worst yearly performance since 2016 when the Brexit party won the referendum by a tiny margin.
The political uncertainty on Boris Jonson’s last days and Liz Truss’ tax fiasco battered the GBP earlier this year. The pair however bounced up steadily, cutting losses by bout 20% as the market welcomed the election of Rishi Sunak as the new Prime Minister in late October.
Against this backdrop, economic indicators have confirmed the strong impact of Brexit. UK post-pandemic recovery has lagged behind the world’s major economies, with the GDP still 0.4% below the last quarter of 2019 and price inflation out of control, which is turning UK citizens‘ cost of living on a nightmare and posing a serious challenge to the Bank of England.
Technical levels to watch
-
09:45
Shareholder return and remuneration are higher in the US than in the Eurozone – Natixis
Comparing the United States and the Eurozone, analysts at Natixis see that both the shareholder return and shareholder remuneration as a percentage of GDP are markedly higher in the US than in the Eurozone.
How do the US and the eurozone compare?
“As regards the shareholder return, it is 2.5% higher in the US than in the Eurozone.”
“As regards shareholder remuneration (as a percentage of GDP), we have seen that it corresponds to 8% of GDP in the US versus 4% in the Eurozone.”
“As regards the proportion of gross earnings that is distributed and earnings as a percentage of corporate investment, we see that they are about twice as high in the US than in the Eurozone.”
“All things considered, US companies pay their shareholders significantly more than European companies do, the risk being that shareholders receive amounts that should be invested.”
-
09:06
AUD/USD to remain below 0.70 through to June before rising into year-end – ANZ
Domestic economic momentum will remain a source of strength for the AUD vis-à-vis non-USD currencies. Regarding AUD/USD, the pair is set to stay below 0.70 in the first half of 2023.
Strength against crosses
The RBA wants to remain on the ‘narrow path’ to a soft landing. As a result, we see the cash rate peaking at 3.85% by mid-2023 and staying there for at least a year. This higher-for-longer story is a key tenet of our medium-term upside bias for the AUD against currencies with more aggressive central banks, such as the NZD and GBP, which will face pressure to cut sooner.”
“Decelerating global growth and tighter liquidity conditions will keep a lid on upside potential, but we think a significant degree of this structural story is now priced in. We have the AUD/USD remaining below 0.70 through to June, before broad-based USD weakness helps lift the Aussie and other cyclicals into year-end.”
-
09:00
Spain Current Account Balance registered at €2.7B above expectations (€0.735B) in October
-
08:52
USD/JPY extends its slide and hits one-week lows near 132.00
- The Dollar depreciates for the second day in a row and reaches the 132.00 area.
- COVID-19 fears and the BoJ's bond purchases are underpinning Yen's recovery.
- The USD/JPY is about to close its best year since 2013.
The US Dollar is dropping against the Japanese Yen for the second consecutive day. The pair has lost about 1.75% over the last two days and is trading at one-week lows right above 132.00, down from the 134.45 high seen on Wednesday.
The BoJ’s bond purchases and COVID-19 fears are boosting the safe-haven yen
The Japanese currency remains bid on the last trading day of 2022, in spite of the risk appetite observed in equity markets. Concerns about the economic consequences of the coronavirus outbreak in China, and the unscheduled bond purchases announced by the Bank of Japan have spurred demand for the JPY.
The sharp increase in COVID-19 infections in China has curbed expectations of a quick economic recovery in the Asian country. In this new scenario, several countries, including, the US, UK, and Japan have announced the imminent introduction of mandatory coronavirus tests for arrivals from China.
Furthermore, the Bank of Japan surprised the markets on Thursday, announcing two consecutive bonds’ purchasing actions in a single day. This action caught the market off the ward, speculating about the possibilities of further relaxation of the bond yield curve, and offered additional support for the Yen.
In the macroeconomic docket, US Initial jobless claims increased by 9,000 to 225K in the week of December 24 while the continuous claims rose to 1.71M from 1.669M in the same week, figures that failed to stimulate demand for the USD.
The dollar about to close a strong 2022
The greenback is on track to close the year with a 14% appreciation, its best yearly performance since 2013. The pair has been boosted by the Federal Reserve’s aggressive monetary tightening path. The bank has increased the Federal Funds rate by 425 basis points with the Bank of Japan stuck to its ultra-loose policy, which crushed the yen for most of the year.
In the last quarter, however, the BoJ by allowing a certain relaxation on its long-term yields’ curve control, which sparked speculation about a monetary policy tweak over the coming months and triggered a 13% recovery for the Japanese Yen over the fourth quarter of the year
Technical levels to watch
-
08:37
US Dollar to remain overvalued in 2023 – Credit Suisse
The USD Index (DXY) is on track for one of its best annual performances in decades in 2022. Economists at Credit Suisse think this unusual strength is justified.
USD looks set to remain supported going into 2023
“With underlying inflation substantially more elevated than the US Fed’s inflation target, the Fed initiated the fastest policy tightening in decades. This generated a major source of USD support through increased carry attractiveness. Furthermore, the USD’s safe-haven characteristics proved attractive at a time of deteriorating risk sentiment globally. Both these factors will likely remain in place going into 2023, and we expect the USD to remain largely overvalued throughout 2023.”
“A turning point in the USD might come later in 2023. A dovish Fed pivot together with an improving global economic outlook would be needed for the USD to give back its gains.”
-
08:04
Austria Producer Price Index (MoM): -1.1% (November) vs previous 0%
-
08:04
Austria Producer Price Index (YoY) down to 15.4% in November from previous 18.4%
-
08:03
Spain Harmonized Index of Consumer Prices (YoY) came in at 5.6% below forecasts (6.8%) in December
-
08:03
Spain Harmonized Index of Consumer Prices (MoM) registered at 0.1%, below expectations (1.5%) in December
-
08:03
Spain Consumer Price Index (MoM) below expectations (0.4%) in December: Actual (0.3%)
-
08:01
Spain Consumer Price Index (YoY) came in at 5.8%, above forecasts (5.6%) in December
-
08:00
Switzerland KOF Leading Indicator above forecasts (86.9) in December: Actual (92.2)
-
07:51
EUR/USD to end 2023 at 1.06 – ANZ
Economists at ANZ Bank expect the Euro to struggle in the first months of 2023 but expect EUR/USD to recover later and end the year at 1.06.
Recession risks could add pressure on the Euro
“We expect risk sentiment and the final leg of the USD rally to drive the market in H1 2023.”
“Recession risks are not fully priced in and could add pressure on the EUR.”
“Once the US is close to completing its hiking cycle in early to mid-2023, we expect the EUR to appreciate, trading in line with underlying fundamentals.”
“We expect the EUR/USD to end 2023 at 1.06.”
-
07:32
Gold Price Forecast: XAU/USD eyes yearly closing above $1,825 to confirm an ascending triangle
Gold price is looking to extend the previous rebound. Will XAU/USD close the final day of 2022 above $1,825? FXStreet’s Dhwani Mehta analyzes the pair’s technical picture.
Bulls remain on track to recapture the critical $1,825 resistance
“Gold bulls yearn for a daily closing above the horizontal trendline (triangle) resistance at $1,825 to confirm the ascending triangle breakout. Buyers will then target the six-month high at $1,833, above which a fresh upswing toward the psychological $1,850 level could be on the cards.”
“Immediate support is seen at Thursday’s low of $1,804. A breach of the latter could put Tuesday’s low at $1,800 under threat. The next critical support awaits at $1,797, which is the confluence of the rising trendline (triangle support line) and the bullish 21-Daily Moving Average (DMA). That demand area will be a tough nut to crack for Gold sellers.”
-
07:10
Forex Today: Action turns subdued on last trading day of 2022
Here is what you need to know on Friday, December 30:
Markets stray extremely quiet and major currency pairs continue to fluctuate in weekly ranges on the last trading day of 2022. Investors seem to have turned cautious following Thursday's risk rally and the US Dollar Index moves sideways at around 104.00. US stock markets will operate at usual hours on Friday but the US bond market will close early heading into the New Year holiday. The ISM's Chicago Purchasing Managers Index for December will be the only data featured in the US economic docket later in the day.
On Thursday, Wal Street's main indexes registered strong gains despite a lack of fundamental drivers. Following the decline witnessed earlier in the week, investors may have taken the opportunity to make some bargain shopping. Nevertheless, US stock index futures are down between 0.3% and 0.5% during the European trading hours.
EUR/USD managed to close in positive territory on Thursday as the improving market mood weighed on the US Dollar during the American trading hours. The pair trades in a tight channel at around 1.0650 early Friday. Preliminary December Consumer Price Index (CPI) figures will be released from Spain but they are unlikely to trigger a significant market reaction.
GBP/USD snapped a two-day losing streak on Thursday but struggled to gather bullish momentum. At the time of press, the pair was trading marginally lower on the day slightly below 1.2050.
Following Thursday's slide, USD/JPY extended its downward correction and was last seen trading in negative territory at around 132.40. The Bank of Japan (BoJ) announced on Friday that it conducted unscheduled bond purchases for the third straight day in the final trading week of 2022, offering to buy unlimited amounts of two-year notes at a yield of 0.04%, and five-year debt at 0.24%.
Gold price gathered bullish momentum and rose more than 0.5% as the benchmark 10-year US Treasury bond yield lost nearly 2% on Thursday. XAU/USD continues to push higher early Friday and was last seen trading above $1,820.
Bitcoin benefited from the risk-positive market environment and posted small gains on Thursday. Nonetheless, BTC/USD continues to move up and down in a very narrow range at around $16,500. Ethereum recovered modestly on Thursday but lost its traction early Friday. ETH/USD was last seen trading in negative territory below $1,200.
-
07:01
Gold Price Forecast: XAU/USD bulls hold the fort amid bumpy road near $1,815 – Confluence Detector
- Gold price grinds higher while keeping the upside break of $1,805 key support.
- Mixed catalyst surrounding China, Russia fail to depress XAU/USD bulls amid doubts on hawkish Fed bets.
- Expectations of easy rates, economic recovery underpin bullish bias for Gold even as multiple hurdles probe upside momentum.
Gold price (XAU/USD) prints the second consecutive gain on the daily, weekly and monthly formats as bulls brace for an upbeat 2023 amid economic optimism and hopes of lower rates. Also likely to have favored the XAU/USD buyers could be the recently softer US data, as well as a pullback in the US Treasury bond yields. It’s worth mentioning that Asian economies like India and China are likely to be the growth engine in the next and could help the Gold buyers to keep the reins due to their higher consumption of the bullion. Alternatively, Covid woes in China and the geopolitical fears surrounding Ukraine could join the recent weakness in global equities, on a monthly and quarterly basis, to probe the Gold buyers. Additionally, a light calendar and the holiday mood also challenge the metal’s recent moves.
Also read: Gold Price Forecast: Will XAU/USD close the final day of 2022 above $1,825?
Gold Price: Key levels to watch
The Technical Confluence Detector shows that the Gold price stays firmer past the Fibonacci 38.2% one-day resistance, now support at $1,813. Also increasing the strength of the stated resistance-turned-support is the Fibonacci 23.6% one-week and middle band of the hourly Bollinger.
That said, the Gold price is firmly on the way to the previous daily high and Pivot Point one-week R1 surrounding $1,820. Following that, multiple hurdles near $1,825 could test the upside momentum before directing XAU/USD buyers to the $1,833 hurdle encompassing Point one-month R1.
On the contrary, a downside break of the $1,813 key support could drag the prices to the $1,805 support including the 5-DMA, Point one-day S1 and 200-HMA.
It’s worth noting that the quote’s weakness past $1,805 will seek validation from the $1,800 threshold before welcoming the Gold bears.
Here is how it looks on the tool
About Technical Confluences Detector
The TCD (Technical Confluences Detector) is a tool to locate and point out those price levels where there is a congestion of indicators, moving averages, Fibonacci levels, Pivot Points, etc. If you are a short-term trader, you will find entry points for counter-trend strategies and hunt a few points at a time. If you are a medium-to-long-term trader, this tool will allow you to know in advance the price levels where a medium-to-long-term trend may stop and rest, where to unwind positions, or where to increase your position size.
-
07:01
Turkey Trade Balance: -8.8B (November) vs previous -7.87B
-
07:00
United Kingdom Nationwide Housing Prices n.s.a (YoY) declined to 2.8% in December from previous 4.4%
-
07:00
United Kingdom Nationwide Housing Prices s.a (MoM) up to -0.1% in December from previous -1.4%
-
06:52
FX option expiries for Dec 30 NY cut
FX option expiries for Dec 30 NY cut at 10:00 Eastern Time, via DTCC, can be found below.
- GBP/USD: GBP amounts
- 1.2000 998.4m
- 1.2462 648.4m
- USD/JPY: USD amounts
- 133.00 705m
- USD/CNY: USD amounts
- 7.4000 1.25b
- 7.6000 1.25b
-
06:29
US Dollar Index stays defensive near 104.00, eyes the biggest yearly jump since 2015
- US Dollar Index picks up bids to pare early-day losses amid sluggish session.
- US Treasury bond yields seek fresh clues, risk catalysts flash mixed signals.
- Softer US data weigh on hawkish Fed bets but fears from China keep DXY firmer.
- Second-tier US data, Xi-Putin talks eyed for fresh impulse.
US Dollar Index (DXY) pares recent losses as it regains 104.00 level during early Friday morning in Europe. In doing so, the greenback’s gauge versus the six major currencies replicates the sluggish markets amid the year-end holiday mood, as well as due to the mixed catalysts. It should be noted that the DXY prints the biggest yearly gains since 2015 despite the latest three-month downtrend.
The DXY dropped the most in two weeks the previous day after the US data pushed back the hawkish Fed expectations. That said, the Initial Jobless Claims rose 225K versus 216K prior for the week ended on December 24 while the Continuing Jobless Claims increased by 1.71M from 1.669M previous readout during the week ended on December 16. However, the 4-week moving average for the same dropped to 221K versus the revised down previous readings of 221.25K.
On the other hand, pessimism surrounding China’s Covid conditions and the Ukraine-Russia tussles weigh on the sentiment and put a floor under the DXY prices. Alternatively, the hopes of the peak in the virus numbers in China and the discovery of an anti-Covid pill joins the chatters of no economic slowdown in the US and Europe to keep the markets positive. Also likely to defend the US Dollar optimists is the US government funding bill worth $1.7 trillion for the fiscal year 2023.
Against this backdrop, the US 10-year Treasury yields fade the previous day’s pullback from the six-week high and take rounds to 3.83% whereas the S&P 500 Futures print mild losses around 3,857 despite Wall Street’s positive closing.
Moving on, the year-end consolidation and a light calendar could challenge DXY traders but a virtual meeting between China President Xi Jinping and Russian counterpart Vladimir Putin could entertain traders. Further, the US Chicago Purchasing Managers’ Index for December, expected 41.2 versus 37.2 prior, will decorate the calendar.
Technical analysis
US Dollar Index remains sidelined between 103.75 and 104.55 but the bears appear to run out of steam, if watched on the daily timeframe.
-
06:11
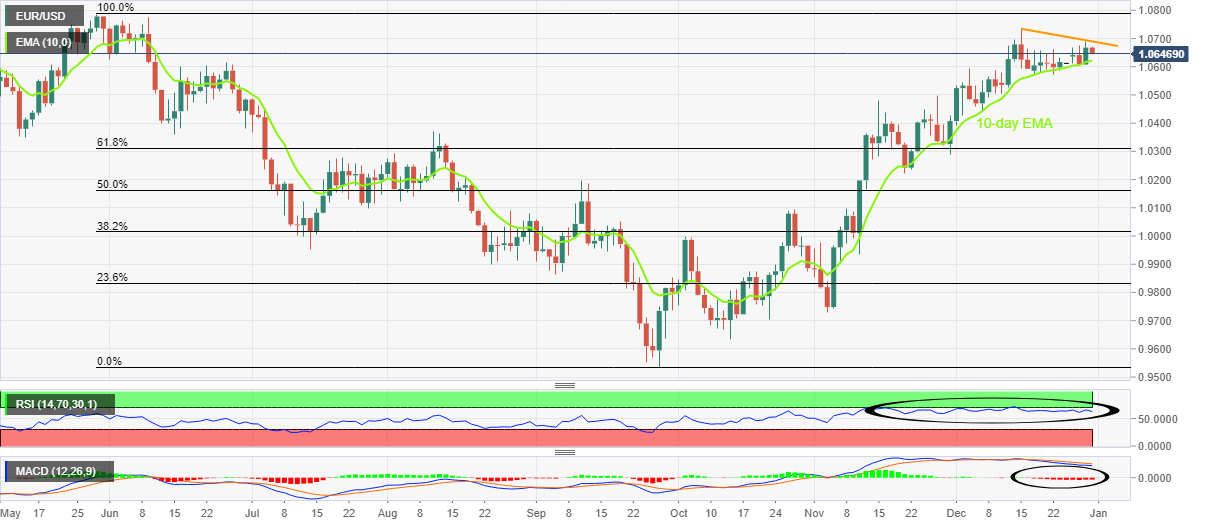
EUR/USD Price Analysis: Mildly offered between fortnight-old resistance and 10-day EMA
- EUR/USD renews intraday low while paring the biggest daily in two weeks.
- RSI, MACD signals suggest that bulls are running out steam.
- May’s top acts as the key upside hurdle, bears need validation from “golden ratio”.
EUR/USD drops to 1.0645 as it renews its intraday low during the initial hour of Friday’s European session. In doing so, the major currency pair reverses from the two-week-old descending trend line resistance.
The pullback move could also be linked to the bearish MACD signals, which in turn suggests the quote’s further weakness.
However, the 10-day Exponential Moving Average (EMA), around 1.0620 by the press time, restricts the EUR/USD pair’s short-term downside.
That said, the RSI (14) grinds higher around the overbought territory, which in turn joins the MACD conditions and the failure to cross immediate EMA, stated above, to keep EUR/USD sellers hopeful.
As a result, the quote’s sustained weakness below the 10-day EMA level could gradually drag it toward the previous monthly top near 1.0480.
Though, the 61.8% Fibonacci retracement level of the EUR/USD’s downside between May and September near 1.0310, also known as the “golden ratio”, becomes crucial for the bear’s conviction.
On the contrary, recovery moves remain elusive even if the EUR/USD bulls manage to cross the immediate resistance line, around 1.0690 at the latest. The reason could be linked to the pair’s previous pullbacks from the below 1.0800 region, marked in May 2022. Hence, the pair buyers need a successful break of the 1.0800 threshold to dominate further.
EUR/USD: Daily chart
Trend: Downside expected
-
06:07
Russia S&P Global Services PMI declined to 45.9 in December from previous 48.3
-
06:02
USD/CAD turns sideways around 1.3550 as street sees inflation above Fed’s target in 2023
- USD/CAD is displaying a sideways profile around 1.3550 as investors are avoiding building positions amid the festive season.
- Federal Reserve might continue its hawkish policy as the street sees inflation well above 3% in CY2023.
- The US Dollar witnessed selling pressure after the release of additions in the weekly Initial Jobless Claims.
- USD/CAD is likely to continue its rangebound structure amid the unavailability of any major economic event.
USD/CAD is displaying a sideways performance in the early European session as investors are hesitating in building positions ahead of the long weekend. The Loonie asset is displaying a lackluster performance in a narrow range around 1.3550 amid indecisiveness in the global markets towards inflation projections for CY2023.
The risk-perceived currencies are failing to capitalize on the improved risk appetite of investors after Thursday’s action. S&P500 displayed a firmer recovery after investors saw value-buying in the equities domain of the United States. In early Friday, S&P500 futures are holding their Thursday gains but are failing to extend their recovery further. It seems that investors are preferring to go light in CY2023 as volatility could heat up.
The US Dollar Index (DXY) is struggling to extend its gains above the immediate resistance of 103.70 after a recovery attempt from 103.50. The USD Index has been oscillating in a bounded range of 103.50-104.60 since Monday. Meanwhile, caution in the market is supporting the 10-year US Treasury yields. The return in 10-year US Treasury bonds is holding above 3.83%.
A rise in weekly jobless claims impacted the US Dollar
The US Dollar Index witnessed selling pressure on Thursday after the United States Department of Labor (DoL) reported an increase in the number of individuals applying for jobless claims for the very first time. The economic data landed at 225K for the week ending December 23, higher than the former release of 216K. The impact of higher interest rates by the Federal Reserve (Fed) has forced the firms to pause the recruitment process. Firms have halted the employment creation process as the street sees bleak economic growth amid expectations of the continuation of extremely hawkish monetary policy by the Federal Reserve. This led to a surge in jobless claims.
Street sees no achievement of the Fed’s 2% inflation target in 2023
In CY2022, the agenda of the Federal Reserve chair Jerome Powell and his teammates has remained the achievement of price stability. Federal Reserve policymakers continuously hiked interest rates to squeeze the supply of the US Dollar into the economy. No doubt, the central bank managed to drag the headline Consumer Price Index (CPI) from its peak of 9.1% but the road to recovery is far from over.
Economists at TD Securities are of the view that inflation in the United States will remain well above 3% by the end of Q4 2023. “We look for headline inflation to end the year at a robust 7.1% YoY pace in Q4, but to slow to 3.1% in Q4 2023. We also forecast Core CPI inflation to end the year at a still-high 6.0% but to decelerate to 3.3% in Q4 2023.”
Also, in the opinion of economists at Deutsche Bank “Headline inflation seems to have already peaked in the United States.” However, it will still be well above the target set by the Fed in 2023.
Oil price struggles to recapture $80.00
China’s Covid-19 status is getting vulnerable each day as the number of infections are rising dramatically. Also, death numbers are scaling higher as medical facilities are unable to address each infected individual. This has also forced various nations to demand negative Covid reports of arrivals from China in order to safeguard themselves from the pandemic. The street is in a dilemma whether to support oil prices by considering optimism over the reopening of the Chinese economy or to consider the short-term pain due to supply chain disruptions. The oil price has rebounded after dropping to near $77.00 but is struggling to recapture the crucial hurdle of $80.00. It is worth noting that Canada is a leading oil exporter to the United States and higher oil prices might support the Canadian Dollar.
USD/CAD technical outlook
-638079768426301626.png)
USD/CAD has shifted its auction profile below the upward-sloping trendline placed from November 16 low at 1.3228 on a four-hour scale. The Loonie asset is hovering below the 200-period Exponential Moving Average (EMA) around 1.3550.
Meanwhile, the Relative Strength Index (RSI) (14) is oscillating in a 40.00-60.00 range. A slippage of the momentum oscillator inside the bearish range of 20.00-40.00 will trigger a bearish momentum.
-
06:01
South Africa Private Sector Credit below expectations (9.99%) in November: Actual (8.3%)
-
06:01
South Africa M3 Money Supply (YoY) came in at 8.76%, above expectations (7.15%) in November
-
05:43
Asian Stock Market: All set to end 2022 on a positive note despite challenges from China
- Asia-Pacific equities fail to justify market’s fears of Covid, Russia-Ukraine tussles amid year-end inaction.
- Softer US data weighs on hawkish Fed bets, allowing shares buyers to keep the reins.
- Hopes of easy rates in 2023, economic recovery keep stocks on the bull’s desk amid sluggish yields.
Asian stocks grind higher as traders brace for a positive close to the volatile 2022 during the last trading of the year. While portraying the mood, the MSCI’s index of Asia-Pacific shares outside Japan rises nearly half a percent whereas Japan’s Nikkei 225 remains sluggish by the press time.
On a broader front, US 10-year Treasury yields fade the previous day’s pullback from the six-week high and take rounds to 3.83% whereas the S&P 500 Futures print mild losses around 3,865 despite Wall Street’s positive closing.
Bank of Japan’s (BOJ) third consecutive day of bond market action joins the mixed sentiment to keep the Yen as the market’s favorite and probe the Nikkei 225. On the other hand, the hopes of a peak in the virus numbers in China and the discovery of an anti-Covid pill favor equity market optimism in Australia and China.
It should be noted that the strong economic performance of India in 2022 puts it on the bull’s radar and helps BSE Sensex to print mild gains despite inactive markets.
Wall Street closed higher after mixed US data pushed back hawkish Fed expectations amid an absence of Fedspeak. That said, US Initial Jobless Claims rose 225K versus 216K prior for the week ended on December 24 while the Continuing Jobless Claims increased by 1.71M from 1.669M previous readout during the week ended on December 16. However, the 4-week moving average for the same dropped to 221K versus the revised down previous readings of 221.25K. It's worth noting that the US Dollar struggles for clear direction while prices of Gold and Oil remain mildly bid at the latest.
Even so, doubts over China’s Covid numbers and multiple restrictions on Chinese travelers curb optimism surrounding Beijing’s unlock. On the same line could be the recent escalation in the Russia-Ukraine tussles.
Elsewhere, Indonesia’s IDX Composite prints mild gains as Indonesia's President Joko Widodo has signed an emergency regulation to replace the controversial job creation law, his chief economics minister said on Friday, a law that the Constitutional Court had ruled was flawed in 2021, per Reuters.
Moving on, a virtual meeting between China President Xi Jinping and Russian counterpart Vladimir Putin will be important to watch for traders. On the same line, the US Chicago Purchasing Managers’ Index for December, expected 41.2 versus 37.2 prior, will decorate the calendar. Following that, Saturday’s official readings of China Manufacturing and Non-Manufacturing PMIs for the current month should be eyed for one last view in 2022.
-
05:30
Netherlands, The Retail Sales (YoY): 6.3% (November) vs 2.9%
-
05:12
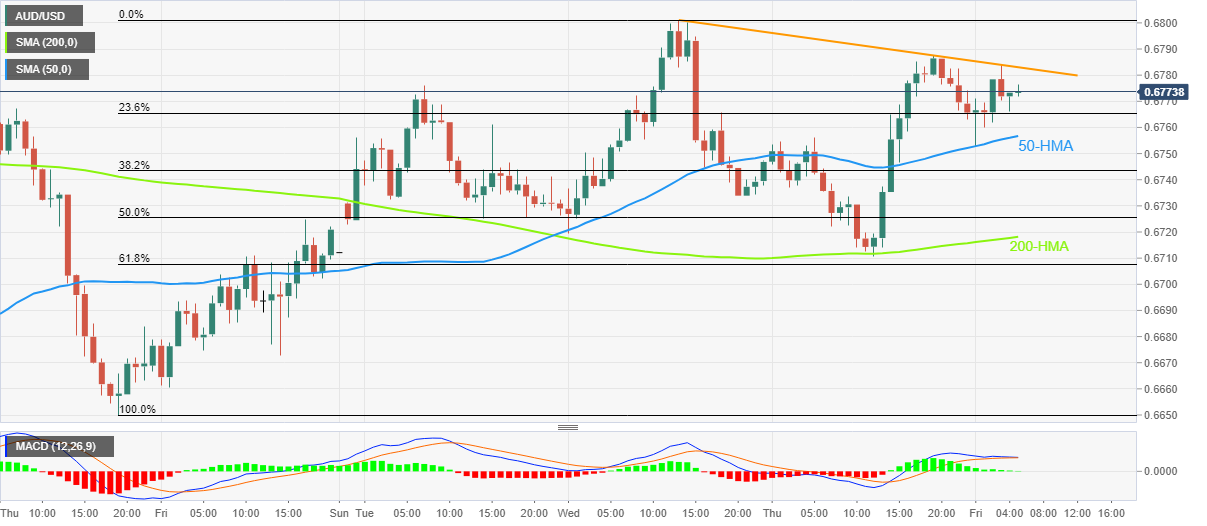
AUD/USD Price Analysis: Retreats from adjacent resistance line near 0.6785
- AUD/USD fades bounce off 50-HMA amid failures to cross three-day-old descending resistance line.
- Looming bear cross on MACD keeps sellers hopeful but 200-HMA is a tough nut to crack for sellers.
- Bulls need validation from 0.6800 to retake control.
AUD/USD snaps a two-day uptrend as it retreats from a short-term downward-sloping resistance line during early Friday. Even so, the sluggish MACD and holiday mood in the market restricts the Aussie pair’s downside and hence the quote remains mildly offered near 0.6770 by the press time.
It should be observed that the MACD is likely teasing the bears, despite being sidelined of late, which in turn joins the quote’s failure to cross the immediate hurdle to keep the sellers hopeful.
However, the 50-HMA level surrounding 0.6755 restricts the AUD/USD pair’s immediate downside.
Should the quote breaks the immediate HMA support, traders will pay attention to the key downside level of 0.6718, comprising the 200-HMA, a break of which could quickly drag the Aussie pair towards the monthly low of 0.6629 marked in the last week.
Alternatively, recovery moves need to cross the descending trend line from Wednesday, around 0.6785, to push back the bearish bias.
Even so, the weekly top surrounding the 0.6800 round figure acts as an extra filter to the north before welcoming the AUD/USD bulls.
Overall, AUD/USD remains sidelined even as the bears struggle to retake control.
AUD/USD: Hourly chart
Trend: Sidelined
-
04:58
NZD/USD drops to near 0.6300 as US Dollar attempts recovery, China’s official PMI in focus
- NZD/USD has slipped sharply below 0.6320 as the US Dollar Index has shown a recovery move.
- Market mood is turning cautious as the Covid-19 situation in China is getting vulnerable.
- Going forward, investors will keep an eye on China’s official PMI data.
The NZD/USD pair has dropped to near intraday low at 0.6316 in the Asian session as the US Dollar Index (DXY) has attempted a recovery after dropping to near 103.50. The New Zealand Dollar has witnessed selling pressure as COVID-19 situation in China is getting more vulnerable.
The headline of rising deaths from Covid-19 in China has spooked the market mood again. According to UK-based health data firm Airfinity “Around 9,000 people in China are probably dying each day from COVID-19. Also, cumulative deaths in China since Dec. 1 likely reached 100,000 with infections totaling 18.6 million.
S&P500 futures are holding the majority of their gains recorded on Thursday, portraying cautious optimism in the global market. At the press time, the USD Index is attempting to extend its rebound move above the crucial hurdle of 103.70. Meanwhile, the 10-year US Treasury yields have recovered their entire morning losses and have scrolled above 3.83%.
It seems that investors are shrugging off the release of an increment in initial jobless claims data and are supporting the USD index again. On Thursday, the United States Labor Statistics department reported an increase in jobless claims to 225K led by a pause in the recruitment process by various firms due to a bleak economic outlook.
This week, investors will keep an eye on China’s official PMI data, which will release this weekend. As per the projections, the National Bureau of Statistics (NBS) Manufacturing PMI is seen higher at 49.2 vs. the former release of 48.0. A sheer outperformance is expected from the Non-Manufacturing PMI catalyst as the economic data is seen at 51.4 vs. the prior release of 46.7. It is worth noting that New Zealand is one of the leading trading partners of China and the PMI status of the Chinese economy will have a significant impact on the New Zealand Dollar.
-
04:45
GBP/USD eyes fourth weekly loss amid UK’s economic pessimism
- GBP/USD takes offers to refresh intraday low, pares the biggest daily gains in two weeks.
- UK PM Sunak is up for a bitter announcement, British commercial properties remain weak.
- US Dollar licks its wounds as UK-based data firm hints higher Covid-led deaths, yields pause previous fall.
- Second-tier data, risk catalysts will be eyed for fresh impulse.
GBP/USD reverses the previous day’s gains, the biggest in two weeks, while taking offers to refresh the intraday low around 1.2040 heading into Friday’s London open. In doing so, the Cable pair justifies the downbeat signals surrounding the British economy, as well as the recent pause in the downside of the US Treasury yields and the US Dollar.
The Times’ news suggesting UK Prime Minister’s readiness for halving financial support on energy bills for businesses, amid concerns about the cost, seemed to have exerted downside pressure on the GBP/USD prices. “The report comes after British public borrowing during last month hit its highest for any November on record, reflecting the mounting cost of energy subsidies, debt interest and the reversal of an increase in payroll taxes,” per the news.
On the same line is the Financial Times (FT) update stating that the UK commercial property values and rents are predicted to “tumble off a cliff edge” in the first quarter of 2023.
Furthermore, labor strikes in the UK become fierce and weigh on the GBP/USD prices. “Britain has been hit by a wave of strikes by public sector workers pressing for better pay deals in the face of decades-high inflation rates,” said Reuters.
Also weighing on the GBP/USD price is the UK-based health data firm Airfinity’s stated mentioning that around 9,000 people in China are probably dying each day from COVID-19, double the numbers expected the previous day and higher than the official figures conveyed by China.
However, the hopes of a peak in the virus numbers in China and the discovery of an anti-Covid pill joins the chatters of no economic slowdown in the US and Europe to put a floor under the GBP/USD prices, via challenging the US Dollar’s haven demand.
Amid these plays, US 10-year Treasury yields fade the previous day’s pullback from the six-week high and take rounds to 3.8% whereas the S&P 500 Futures print mild losses around 3,865 despite Wall Street’s positive closing.
Moving on, GBP/USD is likely to remain pressured as the British leaders have multiple negatives to tackle as compared to their US counterparts.
Technical analysis
Repeated failure to cross the 200-day Exponential Moving Average (EMA), around 1.2115 by the press time, keeps GBP/USD bears hopeful.
-
04:25
Gold Price Forecast: XAU/USD clings to mild gains above $1,800 as bulls brace for 2023
- Gold price defends the previous day’s bullish bias despite recent struggle around daily top.
- Mixed sentiment, sluggish markets restrict XAU/USD moves but buyers cheer second monthly gain as 2022 bids adieu.
- Hopes of economic recovery, lower rates could keep Gold buyers on the table even as Covid, geopolitics probe immediate upside.
Gold price (XAU/USD) replicates the sluggish market conditions during early Friday, despite printing mild gains around the intraday high near $1,818 by the press time. The reason could be linked to the year-end holiday mood and a light calendar, as well as mixed headlines surrounding the recent key risk catalysts.
While portraying the mood, US 10-year Treasury yields fade the previous day’s pullback from the six-week high and take rounds to 3.8% whereas the S&P 500 Futures print mild losses around 3,865 despite Wall Street’s positive closing.
Talking about the key catalysts, pessimism surrounding China’s Covid conditions and the Ukraine-Russia tussles joining the global recession woes to weigh on the sentiment. Alternatively, the hopes of the peak in the virus numbers in China and the discovery of an anti-Covid pill joins the chatters of no economic slowdown in the US and Europe to keep the markets positive. Also likely to defend the optimists is the US government funding bill worth $1.7 trillion for the fiscal year 2023.
Alternatively, the UK-based health data firm Airfinity said on Thursday that around 9,000 people in China are probably dying each day from COVID-19, double the numbers expected the previous day and higher than the official figures conveyed by China. It’s worth noting that seven counties including the US, the UK and Japan have already announced Covid-test requirements for travelers from China. Elsewhere, the US funding bill suggesting more weapon support for Ukraine also weighs on the sentiment.
It should be observed that the mixed prints of the second-tier US data allowed the US Dollar bears to keep the reins amid inactive markets.
Moving on, a virtual meeting between China President Xi Jinping and Russian counterpart Vladimir Putin will be important to watch for Gold traders. On the same line, the US Chicago Purchasing Managers’ Index for December, expected 41.2 versus 37.2 prior, will decorate the calendar. Following that, Saturday’s official readings of China Manufacturing and Non-Manufacturing PMIs for the current month should be eyed for one last shot at the markets in 2022.
For 2023, the hopes of easy rates and a likely economic recovery could keep the Gold buyers on the desk despite the latest challenges to the sentiment.
Gold price technical analysis
Gold price flirts with a three-day-old resistance line as bulls take a breather amid nearly overbought RSI (14) and sluggish MACD signals.
However, higher lows on prices gain support from the higher bottoms of the RSI and hence the latest upside momentum appears valid. Also keeping the Gold buyers hopeful is the metal’s successful trading above the 200-HMA.
As a result, the yellow metal is well-set for crossing the immediate trend line hurdle, surrounding $1,818, while targeting the multiple hurdles near $1,825 and the monthly peak of $1,834. It’s worth noting that the bullion’s successful trading beyond $1,834 won’t hesitate to challenge June’s peak near $1,880.
On the other hand, pullback moves need validation from the 200-HMA support of $1,805, as well as the $1,800 threshold, to convince Gold sellers.
Even so, a two-week-old ascending support line, around $1,795 by the press time, could challenge the XAU/USD bears.
Gold price: Hourly chart
Trend: Further upside expected
-
04:21
USD/INR Price News: Drops firmly from 82.80 amid ease in the US Dollar Index
- USD/INR has dropped to near 82.70 as investors are adjusting positions after an ease in the risk-off mood.
- Analysts at Deutsche Bank see inflation above the target of 2% set by the Fed.
- The Indian Rupee bulls will display action according to the oil price activity ahead.
The USD/INR pair is displaying volatile moves in early trade as investors are adjusting positions after an ease in the risk-off mood. The asset has dropped to near 82.70 and is likely to remain on the back foot amid a sheer drop in the US Dollar Index (DXY). The USD Index is hovering near the lower side of the weekly trading range. The asset has auctioned in a range of 103.50-104.60.
Investors should brace for a lackluster performance on Friday as the entire trading activity is expected to decline. On Thursday, the risk appetite of the market participants was improved after the equities domain in the United States was delighted with value-buying. Investors rushed to park their funds in S&P500 after a two-day sell-off.
An ease in the negative market sentiment favored US Treasury bonds. The 10-year US Treasury yields dropped to 3.82% after a four-day winning streak.
The market is edge away from entering into the CY2023 and the street has started talking about inflation projections in the United States economy. Federal Reserve (Fed) chair Jerome Powell and his teammates have worked hard for cooling off the ultra-hot inflation. No doubt, the street has witnessed a sheer drop from the inflation peak of 9.1% but the road to 2% inflation is still out of sight.
In the opinion of economists at Deutsche Bank “Headline inflation seems to have already peaked in the United States.” However, it will still be well above the target set by the Fed in 2023.
On the Indian front, the Indian Rupee bulls are likely to display action based on the movement of the oil price. The black gold has rebounded after dropping to near $77.00 but is struggling to extend its gains further as a spike in Covid-19 cases in China is displaying short-term pain in the oil demand. It is worth noting that India is one of the leading importers of oil and volatility in oil prices impacts the Indian Rupee.
-
03:40
EUR/USD oscillates above 1.0650 as trading activity drops amid a festive mood
- EUR/USD has turned directionless above 1.0650 ahead of an extended weekend for New Year celebrations.
- The US Dollar Index has attempted a rebound after dropping to near 103.50.
- An ease in the risk-off mood has also improved the demand for US government bonds.
The EUR/USD pair is displaying back-and-forth moves marginally above 1.0650 in the Asian session. The major currency pair is displaying a sideways auction as investors are restricting themselves from making positions ahead of the extended weekend for New Year celebrations. A decline in trading activity is resulting in confusing price action by different asset classes.
The US Dollar Index has attempted a rebound after dropping to near 103.50, however, the recovery move seems less confident amid a decline in safe-haven’s appeal. Cautiousness in the global market was trimmed on Thursday after S&P500 witnessed value-buying interest by the market participants. At the press time, S&P500 futures are displaying a subdued performance, however, the upside bias is still solid.
An ease in the risk-off mood has also improved the demand for US government bonds. The return on 10-year US Treasury yields dropped to near 3.82% after a four-day bullish move.
CY2022 has been named a year of higher inflation and continuous interest rate hikes by the Federal Reserve (Fed). Fed policymakers worked hard to achieve price stability, however, the achievement of 2% inflation seems far now as the street is seeing an inflation rate well above 3% after QYCY2023.
Economists at TD Securities believe that inflation in the United States will remain well above 3% by the end of Q4 2023. “We look for headline inflation to end the year at a robust 7.1% YoY pace in Q4, but to slow to 3.1% in Q4 2023. We also forecast Core CPI inflation to end the year at a still-high 6.0% but to decelerate to 3.3% in Q4 2023.”
On the Eurozone front, investors are shifting their focus toward preliminary German Harmonized Index of Consumer Prices (HICP) data, which will release on Tuesday. As per the consensus, the headline HICP is expected to extend to 11.8% from the former release of 11.3% on an annual basis. Apart from that, investors will focus on the Unemployment Change, which is expected to surge to 27K against the prior release of 17K.
-
03:19
USD/JPY Price Analysis: Further downside towards mid-131.00s appears imminent
- USD/JPY justifies weekly support break to print two-day downtrend.
- Bears approach eight-month-old horizontal support area before poking the latest multi-month low.
- Descending trend line from October, 21-DMA restricts immediate upside.
USD/JPY drops for the second consecutive day after reversing from a two-month-old descending resistance line, down 0.35% intraday near 132.60 during early Friday.
In doing so, the Yen pair also justifies the previous day’s downside break of a one-week-old ascending support line, now resistance around 133.90.
That said, the quote is declining towards a horizontal support zone comprising multiple levels marked since April, around 131.50-30. However, the pair’s further declines past 131.30 appear limited due to the sluggish MACD signals.
In a case where the USD/JPY breaks the 131.30 support the recent bottom surrounding 130.55, also the lowest level in four months, will be in focus.
Also likely to challenge the USD/JPY bears is the August month’s low near 130.40 and the 130.00 round figure, a break of which could quickly drag the quote towards May’s low near 126.35.
Alternatively, the immediate support-turned-resistance line, around 133.90, guards short-term USD/JPY recovery.
Following that, a downward-sloping resistance line from October 21 and the 21-DMA could challenge the bulls around 134.20 and 135.00 respectively.
It’s worth noting, however, that a convergence of the 200-DMA and the 61.8% Fibonacci retracement level of the pair’s May-October upside, near 136.25, appears a tough nut to crack for the USD/JPY buyers.
USD/JPY: Daily chart

Trend: Further downside expected
-
02:51
GBP/JPY slides below 160.00 as Yen cheers mixed sentiment, BOJ action
- GBP/JPY takes offers to refresh intraday low, extends the previous day’s pullback from one-week high.
- BOJ announced the third day of bond market moves, keeps JPY on the front foot.
- Mixed headlines surrounding China, fears of risk-negative announcements from UK PM Sunak also weigh on prices.
- Yields struggle for clear directions and should be eyed for fresh impulse.
GBP/JPY renews intraday low around 159.70 as bears keep the reins for the second consecutive day on early Friday.
The cross-currency pair’s latest weakness could be linked to the broad-based strength of the Japanese Yen (JPY), as well as fears emanating from the UK, amid a sluggish morning session.
It’s worth noting that the Bank of Japan’s (BOJ) third consecutive day of bond market action joins the mixed sentiment to keep the Yen as the market’s favorite.
That said, pessimism surrounding China’s Covid conditions and the Ukraine-Russia tussles joining the global recession woes to weigh on the sentiment. Alternatively, the hopes of the peak in the virus numbers in China and the discovery of an anti-Covid pill joins the chatters of no economic slowdown in the US and Europe to keep the markets positive. Also likely to defend the optimists is the US government funding bill worth $1.7 trillion for the fiscal year 2023.
The Times’ news suggesting UK Prime Minister’s readiness for halving financial support on energy bills for businesses, amid concerns about the cost, also seemed to have exerted downside pressure on the GBP/JPY prices. “The report comes after British public borrowing during last month hit its highest for any November on record, reflecting the mounting cost of energy subsidies, debt interest and the reversal of an increase in payroll taxes,” per the news.
Against this backdrop, US 10-year Treasury yields fade the previous day’s pullback from the six-week high by taking rounds to 3.8% while the S&P 500 Futures print mild losses around 3,865 despite Wall Street’s positive closing.
To sum up, the market’s rush toward risk safety and hopes of a hawkish move in 2023 by the BOJ seems to keep the JPY on the front foot and hence the GBP/JPY bears are likely to keep the reins amid a light calendar through the year-end.
Technical analysis
GBP/JPY bears approach 159.60 support, comprising the one-week-old ascending trend line, after reversing from a fortnight-long resistance line, close to 161.00 by the press time. That said, bearish MACD signals suggest further downside of the cross-currency pair.
-
02:33
WTI Price Analysis: Respects Dragonfly Doji bullish candlestick to snap three-day downtrend
- WTI remains mildly bid after consecutive three days of downbeat performance.
- Bullish candlestick formation, sustained bounce off 21-DMA favor buyers.
- Previous support line, 50-DMA challenges immediate upside ahead of the monthly high.
WTI crude oil prints the first daily gains in three despite making rounds between $78.50 and $79.00 during early Friday.
In doing so, the black gold respects the Dragonfly Doji bullish candlestick, marked the previous day, amid bullish MACD signals.
Also favoring the upside bias is the quote’s successful rebound from the 21-DMA, around $76.60 by the press time.
However, the support-turned-resistance line from early December, near $79.65 at the latest, precedes the $80.00 round figure to restrict the immediate upside of the energy benchmark.
Additionally challenging the WTI bulls is the 50-DMA hurdle surrounding $81.00 and the monthly peak of $83.30.
In a case where the commodity prices remain firmer past $83.30, the odds of witnessing a run-up toward the $90.00 threshold can’t be ruled out.
On the flip side, the sellers need validation from the 21-DMA support of $76.60 to aim for the mid-December lows surrounding $73.50.
If at all the crude oil price weakens below $73.50, the monthly low around $70.30 and the $70.00 psychological magnet will gain the market’s attention as a break of which could favor WTI bears to aim for late December 2021 bottom near $66.10.
WTI: Daily chart
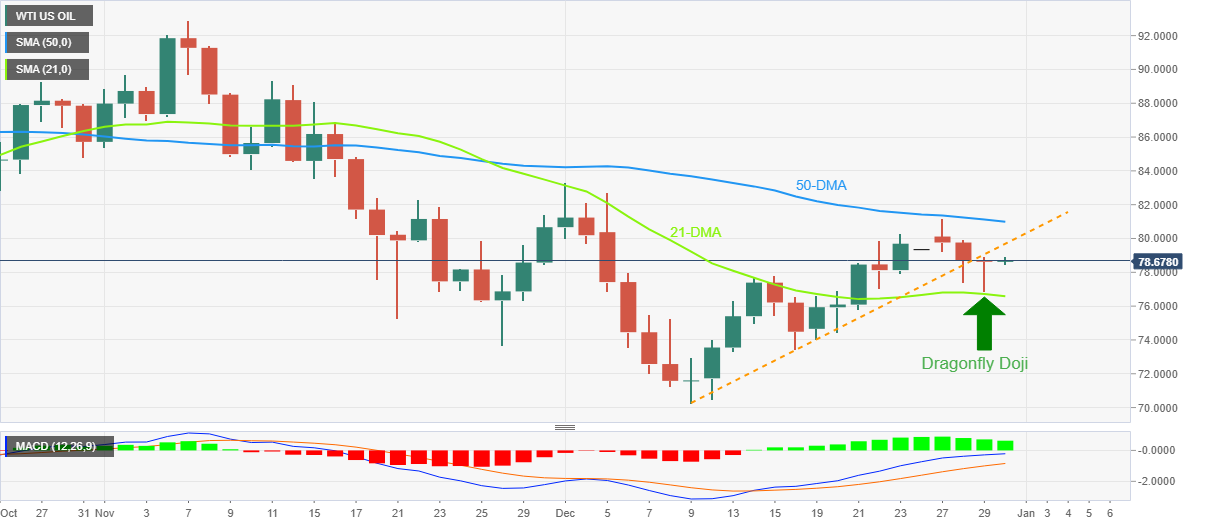
Trend: Limited upside expected
-
02:30
Commodities. Daily history for Thursday, December 29, 2022
Raw materials Closed Change, % Silver 23.904 1.53 Gold 1814.87 0.57 Palladium 1811.5 2.1 -
02:25
BoJ announces bond-buying on an unplanned basis for the third day
The Bank of Japan (BoJ) announced on Friday that it conducted unscheduled bond purchases for the third day in the final trading week of 2022.
Key details (via Bloomberg)
“The BoJ offered to buy unlimited amounts of two-year notes at a yield of 0.04%, and five-year debt at 0.24%.“
“It also offered to purchase a total JPY700 billion ($5.3 billion) of one-to-10 year bonds, and JPY300 billion of 10-to-25 year debt.”
“It offered to buy unlimited quantities of 10-year securities and futures-linked securities at 0.5%.”
Market reaction
USD/JPY is trading deep in the red, despite the unscheduled BoJ bond-buying operation, as the end-of-the-year repatriation flows into the Yen drive the major. The spot is down 0.31% on the day at 132.53, at the press time.
-
02:12
S&P 500 Futures part ways from Wall Street, Treasury bond yields dribble as 2022 bids adieu
- Market sentiment remains dicey amid mixed feeling over Covid, US data.
- S&P 500 Futures pares recent gains with mild losses.
- US 10-year Treasury yields stabilize after reversing from three-week high.
- Second-tier US data, China PMIs to entertain traders during the last days of 2022.
Global markets remain mostly downbeat during early Friday as traders brace for the last active day of 2022 with mixed signals surrounding China and the US.
While portraying the mood, the US 10-year Treasury yields fade the previous day’s pullback from the six-week high by taking rounds to 3.8% while the S&P 500 Futures print mild losses around 3,865 despite Wall Street’s positive closing.
Among the main catalysts, pessimism surrounding China’s Covid conditions and the Ukraine-Russia tussles join the global recession woes to weigh on the sentiment. Alternatively, the hopes of the peak in the virus numbers in China and the discovery of an anti-Covid pill joins the chatters of no economic slowdown in the US and Europe to keep the markets positive. Also likely to defend the optimists is the US government funding bill worth $1.7 trillion for the fiscal year 2023.
Recently, the UK-based health data firm Airfinity said on Thursday that around 9,000 people in China are probably dying each day from COVID-19, double the numbers expected the previous day and higher than the official figures conveyed by China. It’s worth noting that seven counties including the US, the UK and Japan have already announced Covid-test requirements for travelers from China. Elsewhere, Moscow’s heavy missile fire on Kyiv and Kharkiv highlighted geopolitical woes while the US funding bill suggesting more weapon support for Ukraine also weigh on the sentiment.
On the other hand, Italy’s rejection of fears of any new Covid variant, after finding 50% of flight passengers being infected by the virus, seemed to have helped the markets in ignoring the fears of the virus. Further, the headlines suggesting China’s discovery of a Covid antiviral pill and hopes of the CDC board to overcome the COVID-19 fears by citing the peak of virus spread in Beijing, Tianjin and Chengdu also favor the sentiment. Additionally, an absence of heavy losses to lives and infrastructures during Thursday’s heavy missile fire on Kyiv and Kharkiv by Moscow joined the global backup to Ukraine in suggesting a sooner end to the thorny issue and probed the pessimism.
Talking about the US data, Initial Jobless Claims rose 225K versus 216K prior for the week ended on December 24 while the Continuing Jobless Claims increased by 1.71M from 1.669M previous readout during the week ended on December 16. However, the 4-week moving average for the same dropped to 221K versus the revised down previous readings of 221.25K.
Looking forward, a virtual meeting between China President Xi Jinping and Russian counterpart Vladimir Putin could entertain traders while the US Chicago Purchasing Managers’ Index for December, expected 41.2 versus 37.2 prior, will decorate the calendar. Following that, Saturday’s official readings of China Manufacturing and Non-Manufacturing PMIs for the current month will be important to watch for clear directions.
Also read: Forex Today: US Dollar gives up as Wall Street advances
-
01:57
USD/CAD sees more weakness below 1.3540 amid a risk-on mood and a recovery in oil price
- USD/CAD is likely to display more weakness below 1.3540 as risk-on impulse firms.
- A recovery in oil prices is expected to support the Canadian Dollar.
- The fresh supply of the US Dollar amid the funding announcement by US President Joe Biden might impact the Greenback.
The USD/CAD pair is displaying a sideways profile below the crucial resistance of 1.3560 in the Tokyo session. The Lonnie asset has turned rangebound after a sell-off from the round-level hurdle of 1.3600. The major is expected to remain on the tenterhooks and may deliver more weakness ahead amid a significant improvement in the risk appetite of the market participants. Also, a rebound in the oil price might strengthen the Canadian Dollar.
The US Dollar Index is attempting to recover after a sheer drop to near 103.50, however, the risk-on impulse is acting as a major barricade. S&P500 futures are displaying some losses in early Asia after a fantastic Thursday. A minor correction in the 500-stock basket futures could be due to the long weekend ahead for New Year celebrations. Meanwhile, the 10-year US Treasury yields have dropped to near 3.82%.
The USD index is expected to remain under pressure after a surge in the United States Initial Jobless Claims released on Thursday. As per the release, 225K individuals have signed up for jobless claims for the very first time for the week ending December 23. This might be the outcome of a slowdown in the hiring process by firms after failing to execute expansion plans due to higher interest rates by the Federal Reserve (Fed).
Apart from the jobless claims data, the announcement of fresh funding for the U.S. government for the fiscal year 2023 might impact the US Dollar. Dollar supply into the economy might weaken its essence ahead. President Joe Biden on Thursday signed a $1.66 trillion bill for funding the U.S. government, as reported by Reuters.
On the oil front, projections of a revival in the overall demand in China after its reopening measures are supporting the oil price. West Texas Intermediate (WTI) has recovered after dropping to near $77.00. It is worth noting that Canada is a leading oil exporter to the United States and higher oil prices will support the Canadian Dollar.
-
01:46
AUD/USD slides to 0.6750 amid mixed concerns over China Covid, Aussie consumer sentiment
- AUD/USD holds lower grounds on the way to reverse the previous day’s gains.
- Market sentiment deteriorates on hopes of Covid pain, downbeat Aussie consumer index adds strength to the bearish bias.
- China’s heavy cash injections, downbeat US Treasury yields put a floor under the prices.
AUD/USD justifies its risk-barometer status while easing to 0.6765 during early Friday, after rising the most in a week the previous day.
The Aussie pair’s latest weakness could be linked to the receding optimism amid downbeat headlines surrounding China. Adding strength to the bearish bias could be the Aussie Consumer sentiment-linked updates. However, downbeat US Treasury yields and the People’s Bank of China’s (PBOC) actions seem to challenge the pair sellers of late.
Although Australia hasn’t joined the league of seven counties that announced Covid-test requirements for travelers from China, the recent chatters raise fears that the COVID-19 conditions in the dragon nation are worst than appear. While highlighting the same, the UK-based health data firm Airfinity said on Thursday that around 9,000 people in China are probably dying each day from COVID-19, double the numbers expected the previous day and higher than the official figures conveyed by China.
Elsewhere, Reuters reported that Australia's consumer index is on track to drop 7.4% in 2022, posting its worst year since 2014.
Previously, the mixed US data and easing fears of the Coronavirus, as well as hopes of overcoming the Ukrainian crisis, seemed to have weighed on the US Dollar and helped the AUD/USD pair to remain firmer.
That said, US Initial Jobless Claims rose 225K versus 216K prior for the week ended on December 24 while the Continuing Jobless Claims increased by 1.71M from 1.669M previous readout during the week ended on December 16. However, the 4-week moving average for the same dropped to 221K versus the revised down previous readings of 221.25K.
On the other hand, Italy’s rejection of fears of any new Covid variant, after finding 50% of flight passengers being infected by the virus, seemed to have helped the markets in ignoring the fears of the virus. On the same line could be the headlines suggesting China’s discovery of a Covid antiviral pill and hopes of the CDC board to overcome the COVID-19 fears by citing the peak of virus spread in Beijing, Tianjin and Chengdu. Also, an absence of heavy losses to lives and infrastructures during Thursday’s heavy missile fire on Kyiv and Kharkiv by Moscow joined the global backup to Ukraine in suggesting a sooner end to the thorny issue and probed the pessimism.
Against this backdrop, US 10-year Treasury yields extend the previous day’s pullback from the six-week high while the S&P 500 Futures print mild losses despite Wall Street’s positive closing.
Given the shift in the market sentiment, the AUD/USD pair may witness further downside and hence highlight the aforementioned risk catalysts. Also important to watch is the US Chicago Purchasing Managers’ Index for December, likely to improve to 41.2 from 37.2 prior.
Technical analysis
A successful break of the 21-DMA, around 0.6740 by the press time, keeps the AUD/USD bulls directed towards the monthly high of 0.6893.
-
01:28
Gold Price Forecast: XAU/USD senses demand above $1,810 amid risk-on impulse
- Gold price has rebounded after picking demand around $1,814.00.
- An increment in the US Initial Jobless Claims impacted the US Dollar Index.
- US President Joe Biden signed a $1.66 trillion bill for funding the U.S. government for CY2023.
Gold price (XAU/USD) has picked up demand after a corrective move to near $1,814.00 in the Asian session. The precious metal corrected after kissing the $1,820.00 resistance but is likely to resume its upside journey as the risk aversion theme has been trimmed.
A solid recovery in S&P500 on Thursday after a two-day sell-off vanished the risk-off mood from the market. Investors stepped in for providing support to the United States equities as value-buying emerged. Meanwhile, a decline in safe-haven’s appeal brought a sell-off in the US Dollar Index. The USD Index dropped to near 103.50, which has been a critical support this week. Significant ease in negative market sentiment also halted the four-day sell-off in the US Treasury bonds.
The US Dollar faced immense heat after an acceleration in the number of weekly jobless claims. Individuals who claimed for the first time for the week ending December 23 rose to 225K. This highlighted a slowdown in the employment process by firms led by higher interest rates.
In early Asia, Reuters came out with the White House Statement as saying, “President Joe Biden on Thursday signed a $1.66 trillion bill for funding the U.S. government for the fiscal year 2023.” Reuters also stated that the bill was passed by Congress in the last week and was recently signed by Biden while he is on vacation to the Caribbean island of St. Croix. Fresh stimulus in the United States economy could lead to a drop in the US Dollar Index ahead.
Gold technical analysis
Gold price is advancing towards the horizontal resistance of the Ascending Triangle chart pattern formed on a two-hour scale. The horizontal resistance of the aforementioned chart pattern is placed from December 13 high at $1,824.55 while the upward-sloping trendline is plotted from December 16 low at $1,774.36.
The precious metal is auctioning above the 20-period Exponential Moving Average (EMA) at $1,811.23, which indicates that the upside trend in the short term is solid.
Meanwhile, the Relative Strength Index (RSI) (14) is looking to break inside the bullish range of 60.00-80.00.
Gold two-hour chart

-
01:19
PBOC sets USD/CNY reference rate at 6.9646 vs. 6.9793 previous
People’s Bank of China (PBOC) set the USD/CNY central rate at 6.9646 on Friday, versus Thursday's fix of 6.9793 and market expectations of 6.9653.
It's worth noting that the USD/CNY closed near 6.9650 the previous day, trading near the same by the press time.
“With 2 billion Yuan worth of reverse repos maturing on Thursday, China central bank injects 181 billion Yuan on a net basis on the day,” mentioned Reuters.
Given the Chinese central bank's latest Open Market Operations (OMO), the policymakers marked the biggest weekly cash injectionsm, of around 975 billion Yuan, since January 2019.
About the fix
China maintains strict control of the yuan’s rate on the mainland.
The onshore yuan (CNY) differs from the offshore one (CNH) in trading restrictions, this last one is not as tightly controlled.
Each morning, the People’s Bank of China (PBOC) sets a so-called daily midpoint fix, based on the yuan’s previous day's closing level and quotations taken from the inter-bank dealer.
-
01:09
EUR/USD Price Analysis: Flirts with resistance-turned-support near 1.0350
- EUR/USD bounces off intraday low, justifies the strength of fortnight-long horizontal support.
- Bullish MACD signals, sustained break of previous key hurdle favor buyers.
- Three-week-old ascending trend line, 100-SMA adds to the downside filters.
EUR/USD picks up bids to pare intraday losses around 1.0665 after a negative start to the last trading day of 2022.
The major currency pair rose the most in two weeks the previous day and provided a daily closing beyond the fortnight-old horizontal hurdle, surrounding 1.0650. The upside momentum also took clues from the bullish MACD signals.
Hence, the EUR/USD pair’s latest pullback remains elusive unless breaking the aforementioned horizontal resistance-turned-support.
Even so, an ascending trend line from December 08, near 1.0615 by the press time, could restrict short-term EUR/USD downside.
It’s worth noting that the 100-SMA, close to 1.0600 at the latest, acts as the last defense of the EUR/USD bulls, a break of which won’t hesitate to direct the bears towards the 50% Fibonacci retracement level of the pair’s upside from late November to early December, near 1.0515.
Alternatively, the quote’s upside momentum will aim for the 1.0700 threshold before challenging the monthly peak surrounding 1.0735.
In a case where EUR/USD remains firmer past 1.0735, May’s peak of 1.0786 and the 1.0800 round figure may lure the pair buyers.
EUR/USD: Four-hour chart
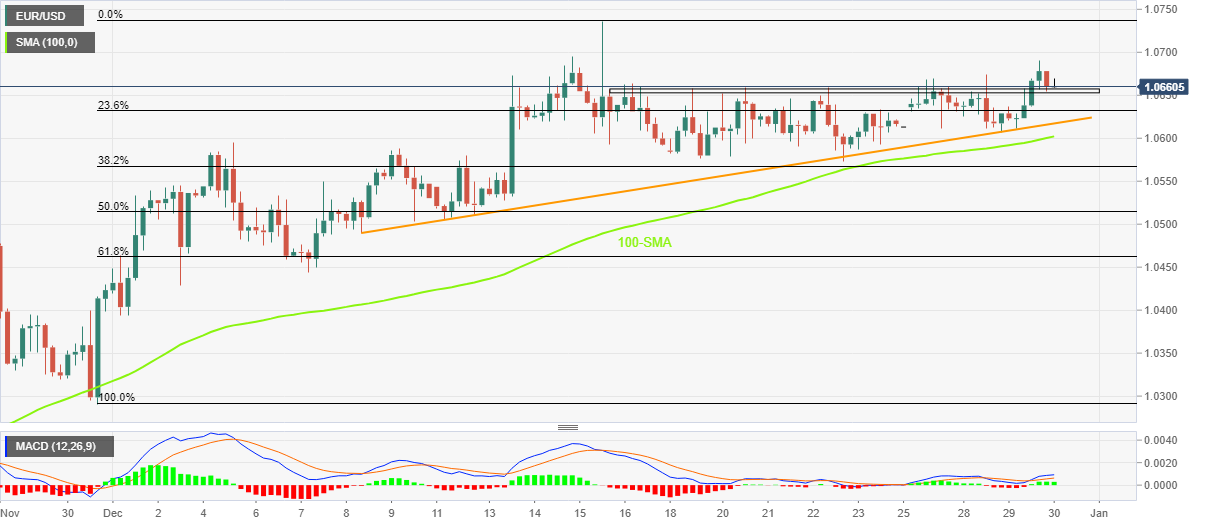
Trend: Further recovery expected
-
00:57
UK’s Airfinity: China COVID deaths accelerate to 9,000 a day
“Around 9,000 people in China are probably dying each day from COVID-19, UK-based health data firm Airfinity said on Thursday, nearly doubling its estimate from a week ago, as infections ripped across the world's most populous nation,” reported Reuters.
Key quotes
Cumulative deaths in China since Dec. 1 likely reached 100,000 with infections totalling 18.6 million, Airfinity said in a statement. It says it uses modelling based on data from Chinese provinces before the recent changes to reporting cases were implemented.
Airfinity expects China's COVID infections to reach their first peak on Jan. 13 with 3.7 million cases a day.
Airfinity expects deaths to peak on Jan. 23 around 25,000 a day, with cumulative deaths reaching 584,000 since December.
Since Dec. 7 when China made its abrupt policy U-turn, authorities have reported 10 COVID deaths.
As of Dec. 28, China's official COVID death toll stood at 5,246 since the start of the pandemic in 2020.
Airfinity expects 1.7 million deaths across China by the end of April, according to its statement.
According to its website, in 2020 it built "the world's first dedicated COVID-19 health analytics and intelligence platform".
Market implications
The news probes the market sentiment in Asia and weighs on the S&P 500 Futures, down 0.15% intraday near 3,865, despite firmer Wall Street closing.
-
00:48
GBP/USD Price Analysis: Aims for a Descending Triangle breakout above 1.2100
- A recovery in the risk-on mood has underpinned the Pound Sterling.
- The Cable is hovering around the downward-sloping trendline of the Descending Triangle pattern.
- A break inside the bullish range of 60.00-80.00 by the RSI (14) will trigger the bullish momentum.
The GBP/USD pair is displaying a lackluster performance in the Asian session as investors are restricting themselves from making large positions amid the festive market mood. The Cable is oscillating in a 10-pips range below 1.2060 and is likely to remain sideways ahead.
Meanwhile, the US Dollar Index (DXY) has attempted a recovery after dropping to near 103.50. The USD Index witnessed an intense sell-off on Thursday amid a recovery in the risk-appetite theme. The return on 10-year US Treasury bonds has dropped below 3.83% in early trade.
The Cable is gathering strength to deliver a breakout of the Descending Triangle chart pattern on an hourly scale. The major is hovering around the downward-sloping trendline is plotted from December 19 high at 1.2242 while the horizontal support of the aforementioned chart pattern is placed from the December 22 low at 1.1992.
The pair is currently holding above the 20-period Exponential Moving Average (EMA) around 1.2050, which indicates the short-term upside trend is still solid.
While the Relative Strength Index (RSI) (14) is oscillating in a 40.00-60.00 range, which indicates a consolidation ahead. A break inside the bullish range of 60.00-80.00 will trigger the bullish momentum.
Should the Cable surpasses December 27 high at 1.2112 decisively, Pound Sterling bulls will drive the asset toward December 21 high at 1.2189 followed by December 19 high at 1.2242.
On the flip side, a decisive downside below December 22 low at 1.1992 will trigger a breakdown of the Descending Triangle and will drag the Cable toward November 29 low at 1.1940. A slippage below the latter will expose the Cable for more weakness toward November 30 low around 1.1900.
GBP/USD hourly chart

-
00:44
USD/JPY bears keep the reins near 132.50 as yields remain pressured, focus on BOJ action, Covid
- USD/JPY extends the previous day’s pullback from weekly top, renews intraday low of late.
- US Treasury bond yields remain depressed after reversing from six-week top.
- Market sentiment dwindles amid year-end inaction but headlines surrounding China, Russia and mixed US data probe optimists.
- BOJ will also be in focus after its two consecutive market moves in a single day.
USD/JPY bears stay in the driver’s seat as the Yen pair renews intraday low around 132.50 during the initial hours of Tokyo opening on Friday. That said, the quote posted the biggest daily loss since December while reversing from a one-week high the previous day.
The quote’s weakness could be linked to the downside of US Treasury bond yields, as well as the mixed sentiment and the US data, not to forget the year-end inaction.
It should be noted that the US 10-year Treasury yields remain pressured around 3.825% while snapping a five-day uptrend the previous day, not to forget marking a U-turn from the six-week high. The pullback in the key US bond coupons weighed on the US Dollar Index (DXY) amid mixed data and headlines surrounding China and Russia.
Talking about the data, US Initial Jobless Claims rose 225K versus 216K prior for the week ended on December 24 while the Continuing Jobless Claims increased by 1.71M from 1.669M previous readout during the week ended on December 16. However, the 4-week moving average for the same dropped to 221K versus the revised down previous readings of 221.25K.
Further, around seven major nations, including the US and the UK have recently announced Covid test requirements for Chinese travelers as the virus cases swirl in the dragon nation but Beijing reverses the “Zero-Covid” policy. Additionally, China’s Center for Disease Control and Prevention (CDC) top epidemiologist Wu Zunyou warned that Covid is seen spreading throughout the holiday season.
On the positive side, Italy’s rejection of fears of any new Covid variant, after finding 50% of flight passengers being infected by the virus, seemed to have helped the markets in ignoring the fears of the virus. On the same line could be the headlines suggesting China’s discovery of a Covid antiviral pill and hopes of the CDC board to overcome the COVID-19 fears by citing the peak of virus spread in Beijing, Tianjin and Chengdu. Also, an absence of heavy losses to lives and infrastructures during Thursday’s heavy missile fire on Kyiv and Kharkiv by Moscow joined the global backup to Ukraine in suggesting a sooner end to the thorny issue and probed the pessimism.
At home, the Bank of Japan’s (BOJ) two consecutive bond purchase actions in a single day raised hopes of more defense to the yield curve and hence further strength of the Yen (JPY).
Amid these plays, Wall Street closed positive but stocks in the Asia-Pacific nation printed mild losses of late.
Moving on, the US Chicago Purchasing Managers’ Index for December, likely to improve to 41.2 from 37.2 prior, will decorate the calendar. However, major attention should be paid to the risk catalysts and the BOJ moves for clear directions.
Technical analysis
A clear downside break of the one-week-old ascending support line, now resistance around 133.80, directs USD/JPY bears towards the four-month low marked the last week around 130.55.
-
00:30
Stocks. Daily history for Thursday, December 29, 2022
Index Change, points Closed Change, % NIKKEI 225 -246.83 26093.67 -0.94 Hang Seng -157.77 19741.14 -0.79 KOSPI -44.05 2236.4 -1.93 ASX 200 -66.3 7020.1 -0.94 FTSE 100 15.52 7512.72 0.21 DAX 146.12 14071.72 1.05 CAC 40 62.98 6573.47 0.97 Dow Jones 345.09 33220.8 1.05 S&P 500 66.06 3849.28 1.75 NASDAQ Composite 264.8 10478.09 2.59 -
00:27
NZD/USD Price Analysis: Retreats towards 0.6300 inside weekly bullish channel
- NZD/USD snaps two-day uptrend as it eases inside a bullish chart formation.
- Bullish MACD signals, firmer RSI keeps buyers hopeful.
- 50-SMA acts as immediate support, monthly low acts as the last defense of bulls.
NZD/USD renews its intraday low near 0.6330 as it pares the recent gains during the last trading day of 2022.
The Kiwi pair rose during the last two consecutive days before reversing from 0.6359. In doing so, the quote took a U-turn from the upper line of a one-week-old ascending trend channel formation.
Although the RSI retreat suggests further consolidation of the NZD/USD gains, the bullish MACD signals could allow the quote to bounce off the 50-SMA support near 0.6300.
In a case where the pair breaks the 0.6300 SMA support, the stated channel’s lower line near 0.6270 will be important to watch afterward. Also acting as the short-term key support is the monthly low which also surrounds the 61.8% Fibonacci retracement level of the November-December upside, near 0.6235.
Should the NZD/USD price drops below 0.6235, the odds of witnessing a slump toward the late November swing low of 0.6155 can’t be ruled out.
On the contrary, the stated channel’s upper line, around 0.6365 by the press time, restricts the immediate advances of the Kiwi pair.
Following that, the 23.6% Fibonacci retracement and the monthly high, respectively around 0.6400 and 0.6500, will be in focus.
Overall, NZD/USD is likely to witness further downside but the room towards the south is limited.
NZD/USD: Four-hour chart
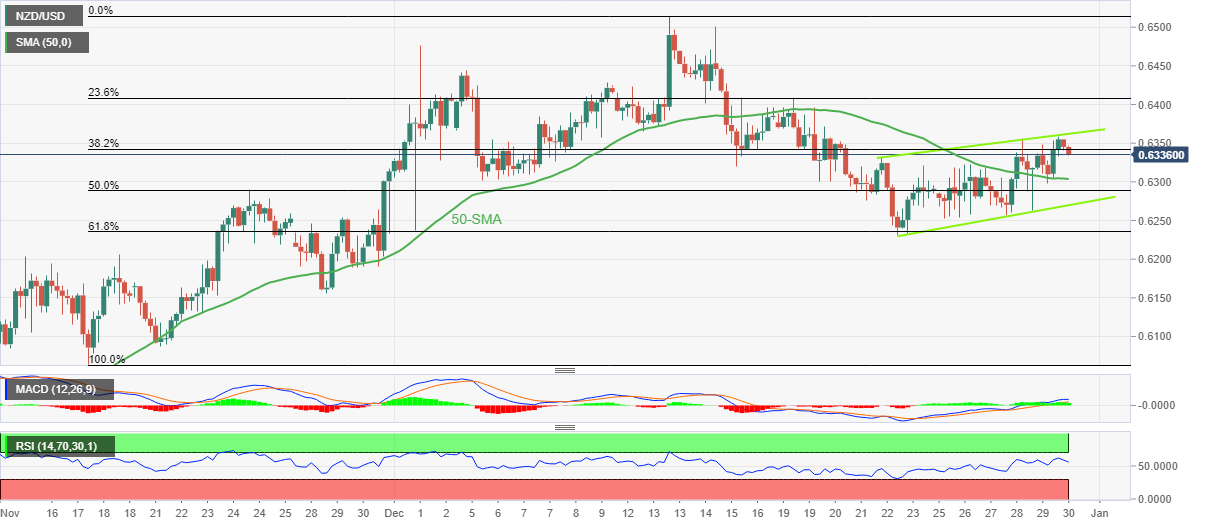
Trend: Limited downside expected
-
00:15
Currencies. Daily history for Thursday, December 29, 2022
Pare Closed Change, % AUDUSD 0.67783 0.65 EURJPY 141.823 -0.47 EURUSD 1.0661 0.49 GBPJPY 160.355 -0.64 GBPUSD 1.20548 0.35 NZDUSD 0.63482 0.9 USDCAD 1.35466 -0.39 USDCHF 0.92316 -0.41 USDJPY 133.02 -1.01 -
00:13
AUD/JPY drops below $90.00 as focus shifts to China’s official PMI data
- AUD/JPY has slipped below the psychological support of $90.00 amid China’s Covid uncertainty.
- China’s official PMI data for December is expected to outperform ahead.
- The BoJ will supply about JPY one trillion at a 0.0% interest rate in operations on January 4.
The AUD/JPY pair has surrendered the psychological support of 90.00 in the Asian session. The risk barometer has sensed a sell-off move as a spike in Covid-19 cases in China is forcing other nations to look for extremely safe measures for arrivals from China. A significant surge in Covid cases in China is impacting the Australian Dollar as trading activity could reduce led by further supply chain disruptions.
The expression of the reopening of China from January 2023 with the intention of easing supply chain bottlenecks has resulted in further disruptions. Major nations are demanding negative Covid reports of arrivals from China to safeguard themselves from the pandemic. Meanwhile, China’s Center for Disease Control and Prevention (CDC) top epidemiologist Wu Zunyou warned at a briefing on Thursday, Covid is seen spreading throughout the holiday season.
Apart from the Covid situation, investors are getting uncertain about China’s official PMI data, which will release this weekend. As per the consensus, the National Bureau of Statistics (NBS) Manufacturing PMI is seen higher at 49.2 vs. the former release of 48.0. A sheer outperformance is expected from the Non-Manufacturing PMI catalyst as the economic data is seen at 51.4 vs. the prior release of 46.7.
It is worth noting that Australia is a leading trading partner of China and economic uncertainties in China bring volatility to the Australian Dollar.
On the Tokyo front, the Japanese Yen is getting traction despite the announcement of funds-supplying operations against pooled collateral by the Bank of Japan (BoJ) on Thursday. The BoJ will supply about JPY one trillion at a 0.0% interest rate in operations on January 4.
-