Notícias do Mercado
-
23:39
AUD/USD stays pressured towards 0.6800 ahead of China/US PMI, NFP
- AUD/USD holds lower ground at the lowest levels in six weeks marked the previous day.
- Risk-aversion, pessimism surrounding key customer China join downbeat data at home to weigh on prices.
- Hawkish Fed, recession woes keep bears hopeful ahead of top-tier statistics.
AUD/USD begins September month’s trading while keeping the two-day downtrend at the 1.5-month low, taking rounds to 0.6840 by the press time. In doing so, the Aussie pair justifies the market’s risk-off mood, as well as concerns surrounding Australia’s biggest customer China. Also keeping the quote pressured are the latest statistics from Australia.
Recently, Australia’s AiG Performance of Manufacturing Index marked the first activity contraction in seven months with 49.3 numbers for August, versus 52.5 prior. The same follows Wednesday’s second quarter (Q2) Construction Work Done that dropped to -3.8% versus 0.9% market forecasts and -0.9% prior. Further, Aussie Private Sector Credit eased in July to 0.7% MoM from 0.9% prior while staying intact at 9.1% YoY.
It should be noted that the US data wasn’t either too positive but could manage to keep the greenback buyers hopeful amid the recently loose links between ADP and Nonfarm Payrolls (NFP). That said, US ADP Employment Change rose by 132K versus 288K expected and 270K prior. However, the average wage increases in the US in August were 7.6% y/y and the same kept the Fed policymakers hawkish.
Following the data, Cleveland Federal Reserve Bank President Loretta Mester said on Tuesday that she was not anticipating the Fed to cut rates next year, as reported by Reuters.
On a different page, Taiwan’s first shooting at a Chinese drone and more virus-led lockdown on the dragon nation joined the second month of manufacturing activity contraction in China, per NBS Manufacturing PMI, to weigh on the AUD/USD prices, as well as risk appetite. On the same line was the latest statement from the United Nations (UN) Human Resource Office mentioning that the Chinese government has committed ‘serious human rights violations’ in Xinjiang.
Against this backdrop, Wall Street closed with losses while the US 10-year Treasury yields rose the most in two weeks while rising to the highest level since late June.
Looking forward, China’s Caixin Manufacturing PMI for August and the US ISM Manufacturing PMI could decorate the calendar before highlighting Friday’s US NFP. It should be observed that the pair’s downside appears to lose steam of late, which in turn could trigger the corrective pullback of the pair in case of positive surprise from China statistics and/or risk catalysts.
Technical analysis
May’s low near 0.6830 appears immediate support, a break of which could direct AUD/USD bears towards early July’s bottom around 0.6760. Alternatively, a downward sloping support-turned-resistance line from early August, close to 0.6850, probes corrective pullback ahead of the 50-DMA hurdle of 0.6910.
-
23:30
Australia AiG Performance of Mfg Index declined to 49.3 in August from previous 52.5
-
23:25
GBP/USD Price Analysis: Downside momentum loss to support cable, 1.1650 a critical hurdle
- A symmetrical triangle formation near monthly lows indicates a loss of momentum and supports a pullback move.
- Declining 20-and 50-EMAs still favor the downside bias.
- The RSI (14) is attempting to recapture the neutral range of 40.00-60.00
The GBP/USD pair is displaying back-and-forth moves in a narrow range of 1.1609-1.1623 in the early Tokyo session. The cable has turned sideways after defending the critical support of 1.1600. Broadly, the asset is oscillating in a wider range of 1.1607-1.1645 and is likely to display volumes and wider ticks.
A Symmetrical Triangle chart formation on an hourly scale near a two-year low is displaying signs of momentum loss, which may deliver a solid pullback move ahead. The upper portion of the above-mentioned chart pattern is placed from Tuesday’s high at 1.1761 while the lower portion is plotted from Monday’s low at 1.1645.
The 20-period Exponential Moving Average (EMA) at 1.1634 has acted as a major hurdle for the pound bulls. Also, the 50-EMA at 1.1661 is declining, which still favors a downside bias.
Meanwhile, the Relative Strength Index (RSI) is attempting to shift into the neutral range of 40.00-60.00 from the bearish range of 20.00-40.00 as exhaustion signals in the downside momentum are in play.
A break above Wednesday’s average price at 1.1650 will send the asset towards the round-level resistance at 1.1700, followed by Tuesday’s high near 1.1760.
Alternatively, a downside below Wednesday’s low near 1.1600 will drag the asset towards 19 March 2020 low at 1.1472. A breach of the latter will drag cable towards a 37-year low at 1.1410.
GBP/USD hourly chart
-637975814164567475.png)
-
23:09
EUR/USD begins September on softer foot above 1.0000, US PMI, NFP eyed
- EUR/USD struggles to extend three-month downtrend around nearly two-decade low.
- Markets turned dicey but hawkish central bankers, firmer EU inflation data kept bears in driver’s seat.
- Geopolitical, covid news also exerted downside pressure ahead of the key US data.
- German Retail Sales, US ISM Manufacturing PMI could offer intraday directions.
EUR/USD seesaws around 1.0050, probing a three-day rebound from the yearly low, after declining for three consecutive months. The pair’s latest inaction could be linked to the anxiety ahead of the key data/events while the daily gains could be attributed to the hawkish EU data versus softer US numbers. Even so, hawkish Fed bets and fears of recession kept the quote pressured.
As per the first readings of the Eurozone Harmonised Index of Consumer Prices (HICP) released for August, the inflation in the bloc rose to 9.1% YoY versus 9.0% expected and 8.9% prior. On Tuesday, Germany’s HICP for the stated month grew 8.8% while matching expectations, versus 8.5% prior.
Following the data, the European Central Bank (ECB) “urgently needs to act decisively next week,” the central bank’s Governing Council member and German central bank head Joachim Nagel said on Wednesday. “We need a strong rate hike in September,” the policymaker added.
Additionally, Germany’s Chancellor Olaf Scholz said that the government will present the next relief package soon.
On the other hand, US ADP Employment Change rose by 132K versus 288K expected and 270K prior. However, the average wage increases in the US in August were 7.6% y/y and the same kept the Fed policymakers hawkish.
Cleveland Federal Reserve Bank President Loretta Mester said on Tuesday that she was not anticipating the Fed to cut rates next year, as reported by Reuters. The policymaker also stressed that inflation must be brought under control, even if it means a recession. Restoring stability to consumer prices is now the clear priority for many key central banks, and with inflation so strong, that will come at the expense of growth.
It should be noted that the energy crisis in Germany and the fears of the US-China tussles, recently over Taiwan, join covid woes in China to also underpin the US dollar’s safe-haven demand.
Amid these plays, Wall Street closed with losses while the US 10-year Treasury yields rose the most in two weeks while rising to the highest level since late June.
Moving on, Germany’s Retail Sales for August and the US ISM Manufacturing PMI could entertain the EUR/USD traders ahead of Friday’s US Nonfarm Payrolls (NFP).
Also read: US ISM Manufacturing PMI Preview: Slowing growth or recession?
Technical analysis
Although 0.9900 puts a short-term floor under the EUR/USD prices, July’s low near the 1.000 threshold precedes a downward sloping trend line from February, near 1.0190, to restrict the pair’s upside momentum.
-
23:02
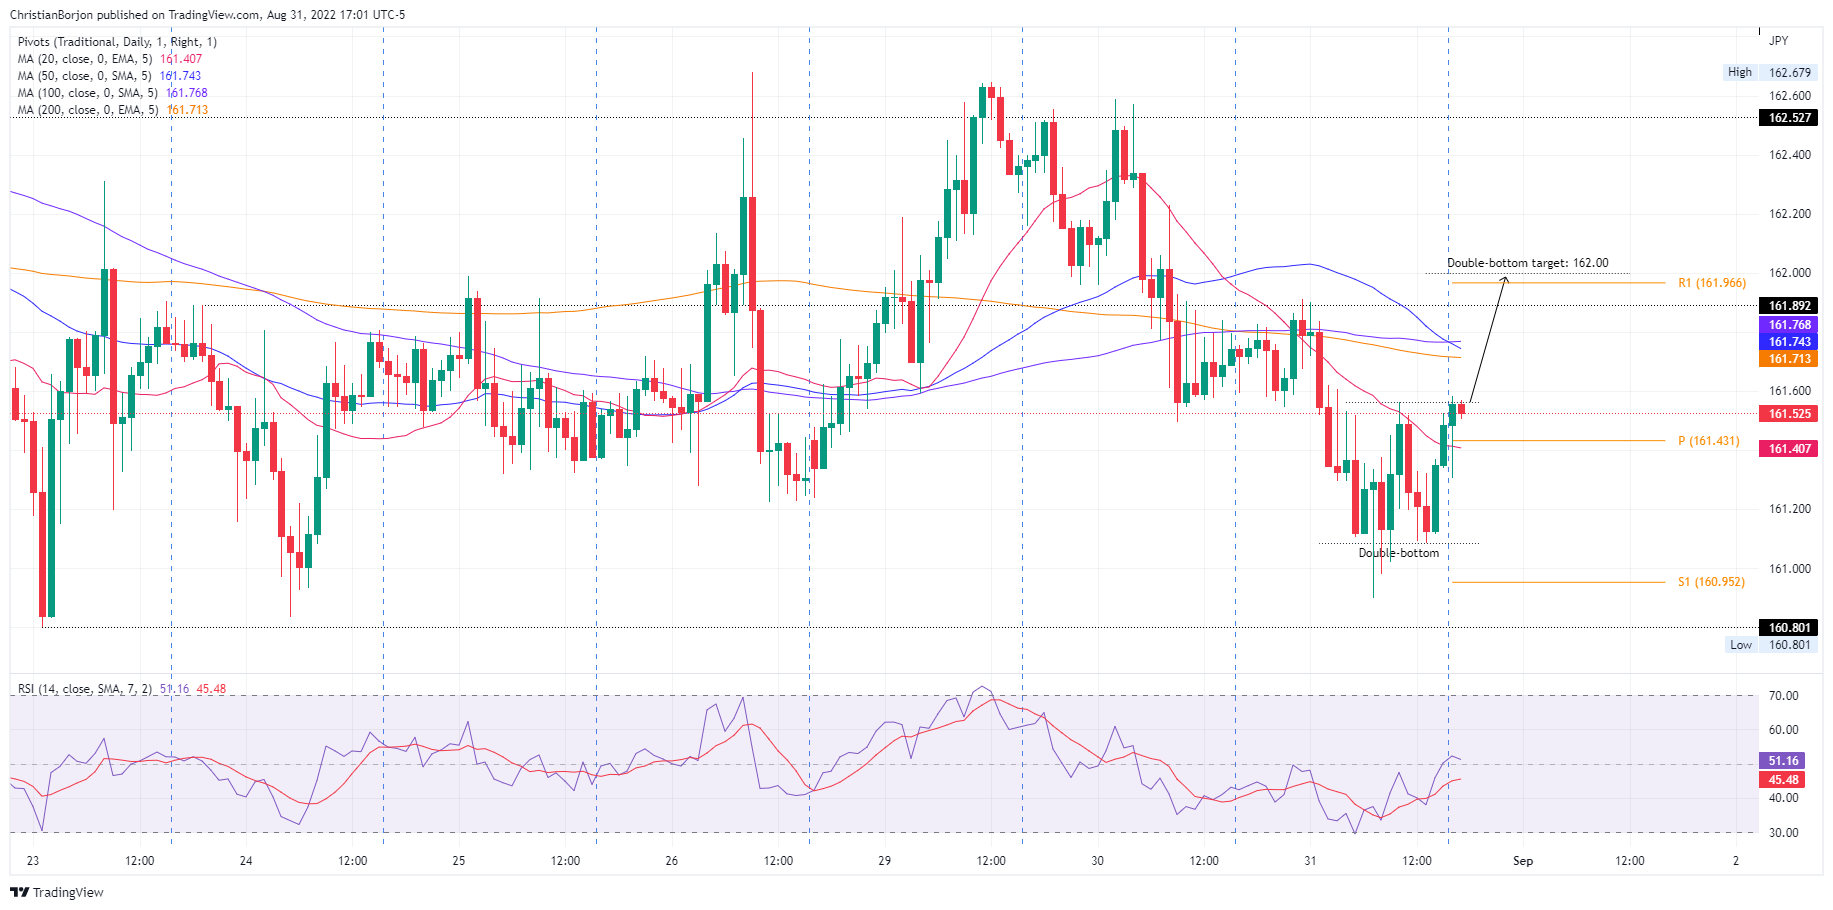
GBP/JPY Price Analysis: Bounces off a double-bottom in the H1, targets 162.00
- GBP/JPY daily chart shows the pair trading sideways due to the lack of fresh impetus.
- Near-term, the hourly chart formed a double-bottom, targeting 162.00.
The GBP/JPY extended its losses for the second straight day, stumbling below the 20-day EMA at 162.00, striking a new weekly low at 160.90. However, the British pound staged a recovery late in the session and trimmed earlier losses. The GBP/JPY is trading at 161.52, below its opening price as the Asian Pacific session begins.
GBP/JPY Price Analysis: Technical outlook
From a technical perspective, the GBP/JPY remains sideways. During the last 22 days, the cross-currency remains in the 159.44-162.84 range, unable to crack above/below it due to fundamental reasons linked to both currencies. The Relative Strength Index (RSI) paints a dull picture, trapped in the 38-49 reading, in bearish territory, directionless. Therefore, GBP/JPY intraday price action could be more entertaining.
Short term, the GBP/JPY one-hour chart illustrates the formation of a double-bottom on Wednesday, which targets the 162.00 mark. Nevertheless, the cross-currency pair would find crucial supply zones on its way north.
The GBP/JPY first resistance would be the 200-EMA at 161.71. Break above will expose the confluence of the 50 and 100-EMAs in the 161.75-76 area, followed by the R1 daily pivot at 161.96, ahead of the double-bottom’s target.
GBP/JPY Key Technical Levels
-
22:55
Gold Price Forecast: XAU/USD declines towards $1,700 on hawkish Fed bets, US NFP eyed
- Gold price is expected to extend its weakness to near $1,700.00 on hawkish Fed bets.
- A decline in US ADP employment data failed to weaken the DXY.
- The US NFP is seen lower at 300k vs. 528k reported earlier.
Gold price (XAU/USD) has displayed a less-confident pullback after hitting a fresh monthly low of $1,709.67 in the late New York session. The precious metal is expected to decline further to near the psychological support of $1,700.00 as investors ignored the weaker employment generation numbers and are focusing on more restrictive monetary policy by the Federal Reserve (Fed).
Ahead of more comprehensive and considered US Nonfarm Payrolls (NFP) data, the unconventional US Automatic Data Processing (ADP) has reported 132k new job additions in August in the private sector, much lower than the expectations of 288k. Investors were already expecting a fall in employment generation as big tech boys announced a halt in recruitment or retrenchment at a conference call after the release of second-quarter results.
Going forward, the mega event of US NFP is expected to land at 300k lower than the prior release of 528k. Also, the Unemployment Rate is expected to remain unchanged at 3.5%. As bringing price stability is the foremost priority of the Fed, softening labor market is not able to change the conviction of Fed policymakers towards hiking interest rates.
Gold technical analysis
Gold prices are declining firmly towards the monthly lows placed at $1,680.91, recorded on July 21. The 20-and 50-period Exponential Moving Averages (EMAs) at $1,726.40 and $1,738.32 respectively are scaling towards the south, which adds to the downside filters.
Also, the Relative Strength Index (RSI) (14) has shifted into the bearish range of 20.00-40.00, which indicates more weakness ahead.
Gold four-hour chart

-
22:08
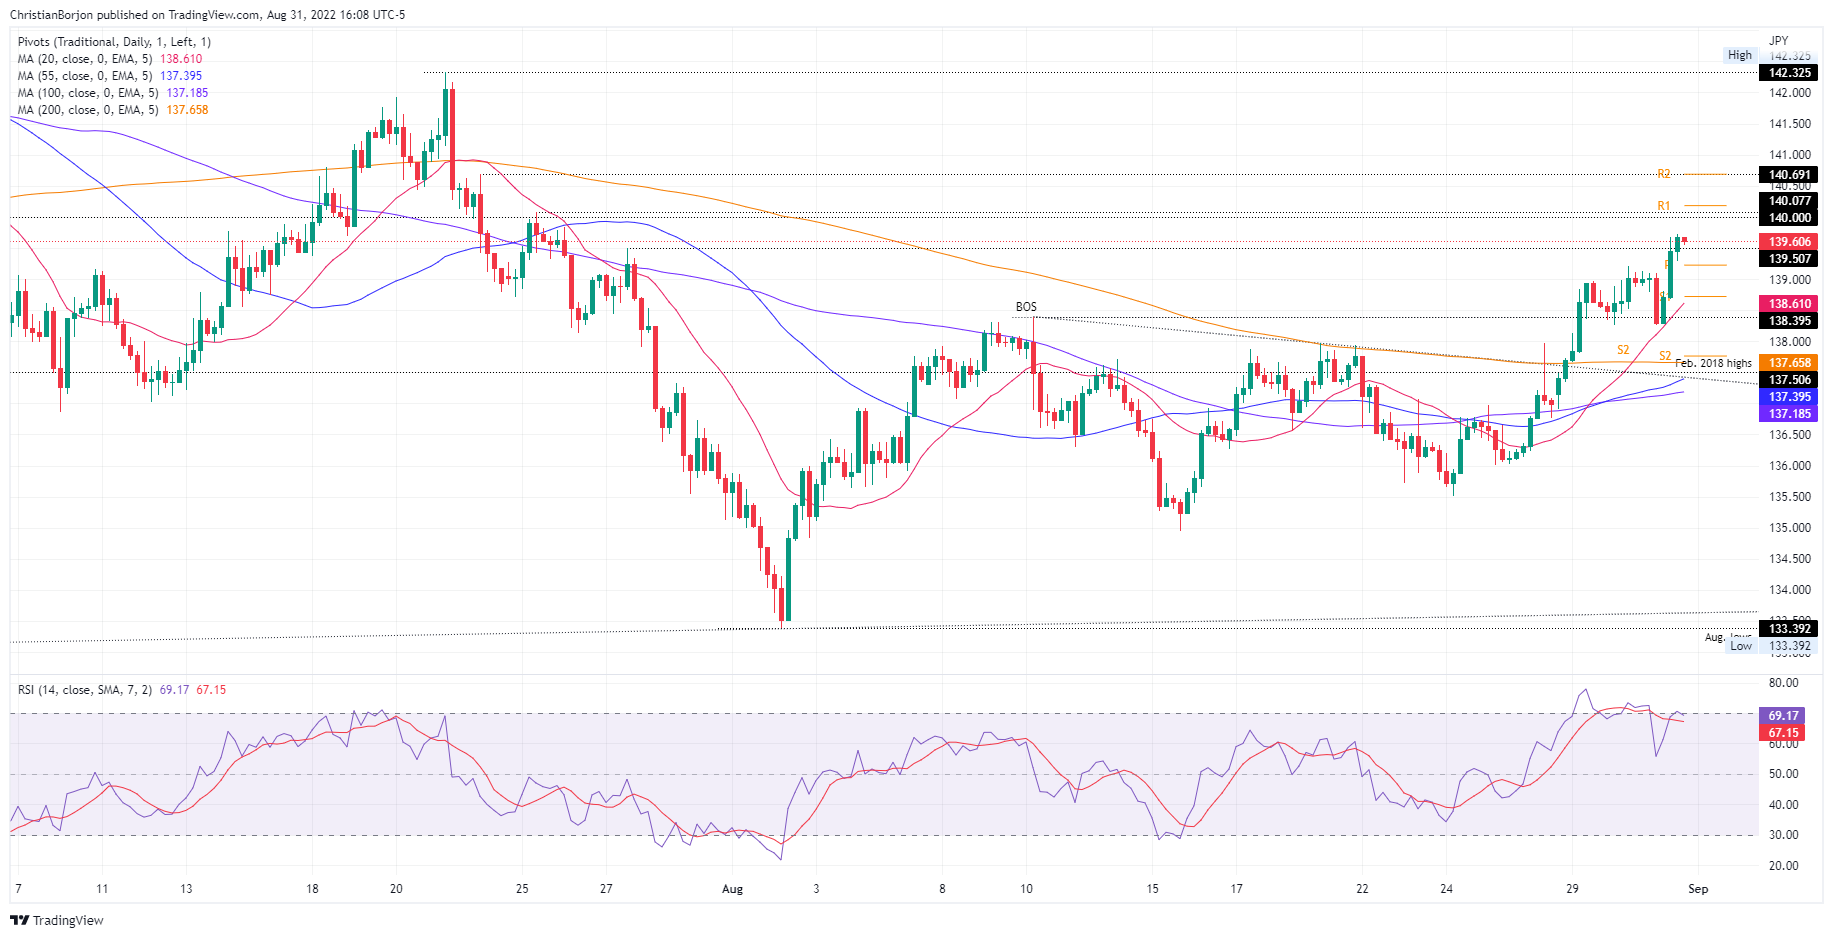
EUR/JPY Price Analysis: Trades at around five-week highs, eyeing 140.00
- EUR/JPY recorded a fresh weekly high each day of the week.
- The shared currency strengthened once it broke above the 139.00 mark on the high EU inflation data.
- EUR/JPY and RSI’s negative divergence in the 4-hour chart suggests the pair might pull back before testing 140.00.
The EUR/JPY extends its weekly gains for the fourth consecutive day, up almost 0.50% during the day as the New York session is about to end. At the time of writing, the EUR/JPY is trading at 139.60, refreshing five-week highs, for the fourth straight day.
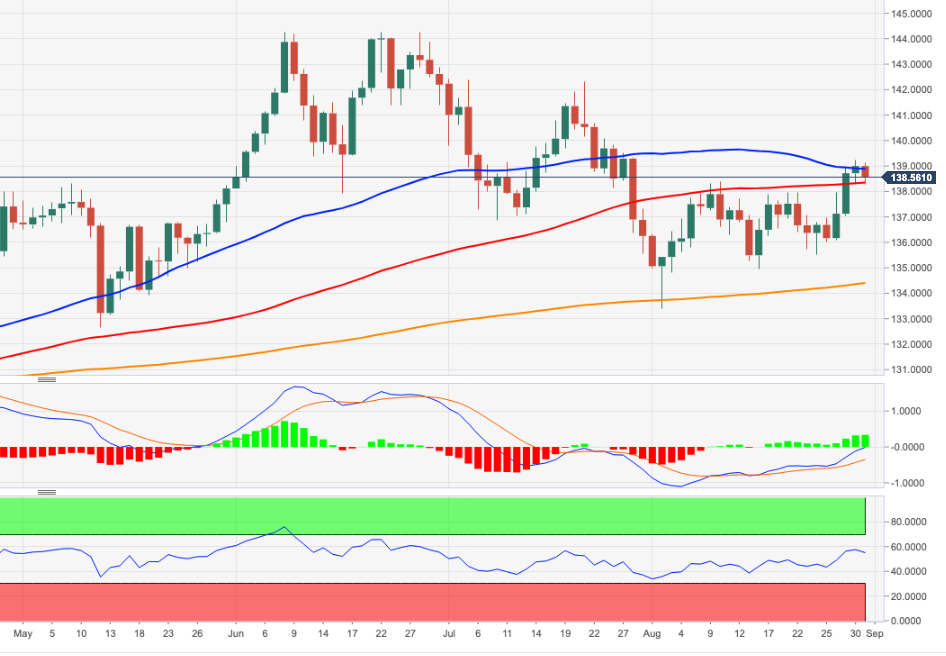
EUR/JPY Price Analysis: Technical outlook
After consolidating around the 138.20-139.20 area, the cross-currency resumed its up trend. Data from the euro area, showing inflation around 9.1% YoY, caused a jump in the pair, clearing the 139.00 figure and hitting a fresh weekly high of 139.68.
Hence, the EUR/JPY path of least resistance is upwards. So, the EUR/JPY first resistance would be the 140.00 figure. A decisive break would pave the way toward July 21 cycle high at 142.32.
The EUR/JPY 4-hour chart illustrates the pair clearing the July 27 high at 139.50, further cementing the case for a 140.00 test. Nevertheless, the Relative Strength Index (RSI) shows signs of exhaustion, as the EUR/JPY reaches a fresh higher high, while the RSI’s peak is lower than the previous impulse to the upside. Therefore, a negative divergence could be forming, meaning that the EUR/JPY might drop soon before resuming the uptrend.
The EUR/JPY’s first resistance would be the 140.07 July 25 high. Once cleared, the next resistance would be the July 22 daily high at 141.09, followed by the YTD high at 142.35.
EUR/JPY Key Technical Levels
-
21:46
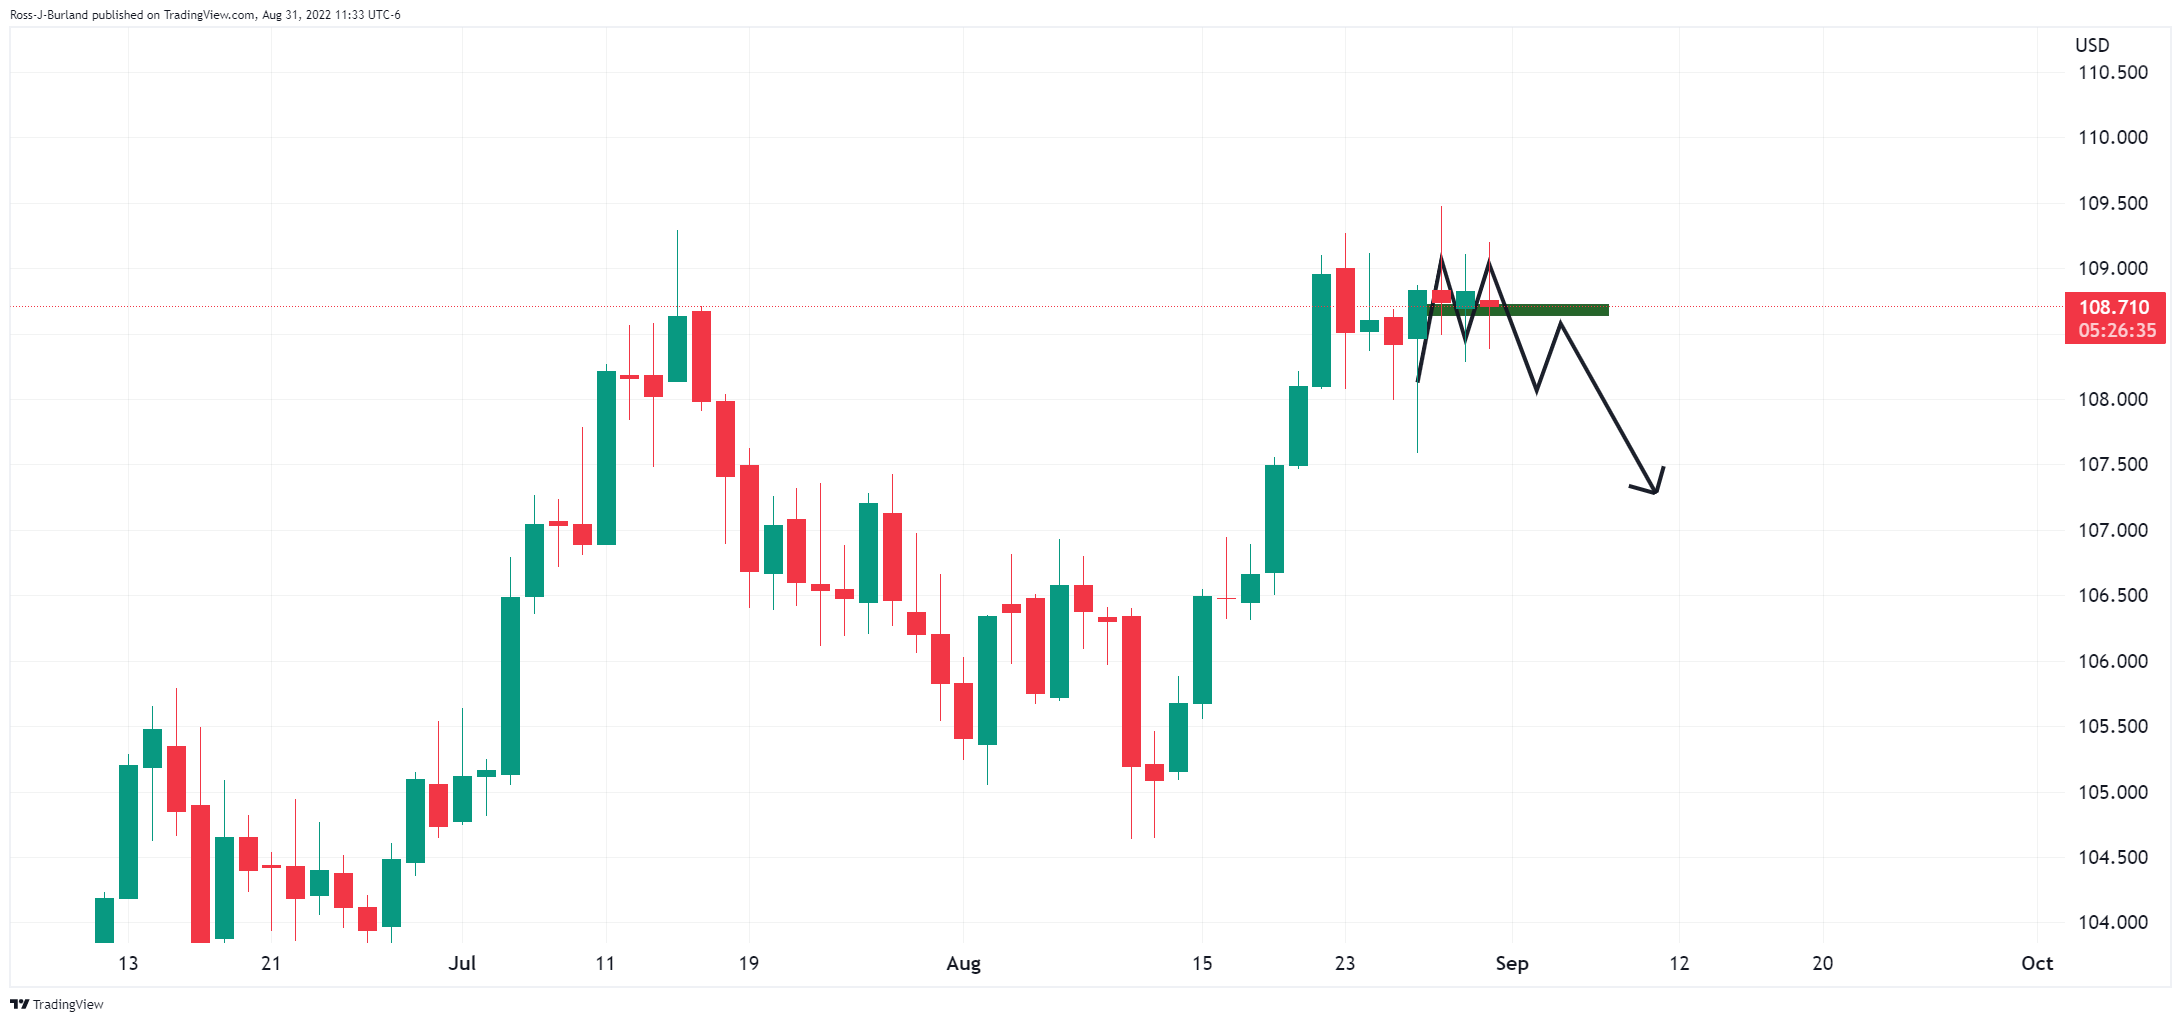
NZD/USD bulls could be about to make a significant move
- NZD/USD is pressured in a strong dollar environment.
- The price is carving out an M-formation on the 4-hour chart.
- A break of 0.6150 will leave the bulls back in control.
NZD/USD is under pressure by some 0.2% and falling into the final stage of the North American session at month's end. The bird has travelled between a high of 0.6154 and a low of 0.6110 so far on Wednesday.
''The Kiwi is little-changed this morning after bouncing around in a fairly confined range overnight as markets continued to digest more hawkish messaging from central banks, higher than expected European inflation, and further weakness in equities and cryptocurrencies,'' analysts at ANZ Bank explained.
The record-high inflation in parts of the world is compounding recession fears stalking markets on Wednesday which is serving as a bullish plate for the US dollar and US Treasury yields. this is a weight for the antipodeans, given their high beta status to global stocks.
Equities on Wall Street ended the month with their fourth straight daily decline on Wednesday, cementing the weakest August performance in seven years. Selling pressure accelerated on the back of last week's speech by the Fed Chair Jerome Powell who advocated for keeping monetary policy tight "for some time". This dashed hopes of more modest interest rate hikes, with the benchmark index down more than 5% over the past four trading sessions. Traders are now pricing in about a 70% chance of a 75 basis points Fed rate hike next month, according to data from Refinitiv.
On Wednesday, the two-year US Treasury yield, which is relatively more sensitive to the monetary policy outlook in the US, hit a 15-year high at 3.499% overnight but eased back to 3.446%. The 10-year Treasury yield, which hit a two-month high of 3.153% on Tuesday, stood at 3.123, easing back from 3.164%%.
''In this sort of environment, with global recession fears percolating, FX markets attuned to a risk-off vibe, UK gripped by political/energy/inflation woes, Europe struggling under the weight of energy prices, drought and a war on its back doorstep, and the Bank of Japan resolute in its desire to maintain an easy policy, markets will naturally be attracted to the USD, and in blunt terms, that is where the risks lie for the Kiwi,'' the analysts at ANZ Bank said.
''The idea that the RBNZ might be done after a couple more hikes isn’t helping either (we think the risks are skewed to more, but the market doesn’t think that).''
Meanwhile, much will depend on this week's US jobs data, in the Nonfarm Payrolls report. Analysts at TD Securities explained that ''employment likely continued to advance robustly in August but at a more moderate pace following the booming 528k print registered in July. High-frequency data, including Homebase, point to still above-trend job creation.'' The analysts also look for the Unemployment Rate to drop by a tenth for a second consecutive month to 3.4%, and for wage growth to advance at a firm 0.4% MoM (5.3% YoY).
NZD/USD technical analysis
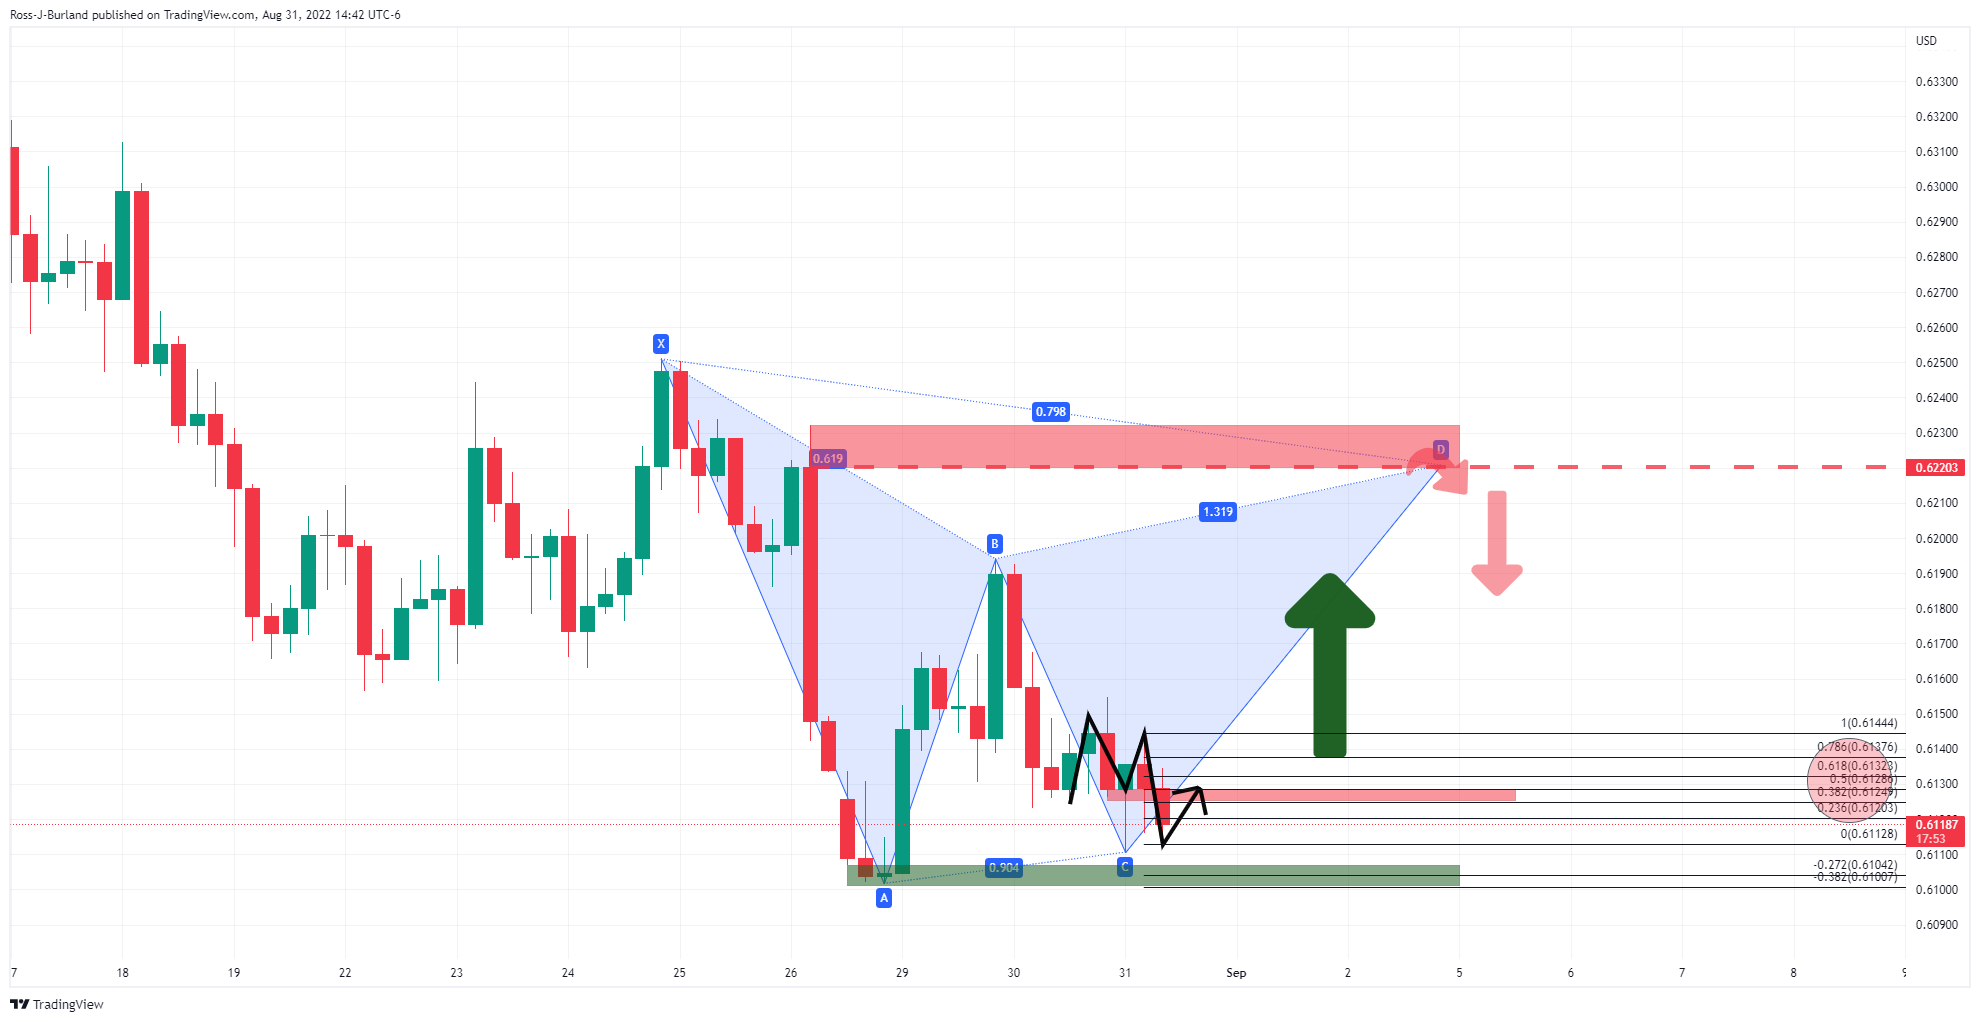
Despie the bullish environment for the greenback, from a technical standpoint, there are prospects of a move up to complete a Gartley pattern on the 4-hour chart over the first part of the new month. In the meanwhile, the price is carving out an M-formation on the 4-hour chart that would be expected to result in a pullback to meet the neckline in a 50% mean reversion for the coming sessions. A break of 0.6150 will leave the bulls back in control.
-
20:57
Forex Today: The dollar stands victorious for one more month
What you need to take care of on Thursday, September 1:
The American dollar ended August with substantial gains across the FX board. On Wednesday, it edged higher against most major rivals, although the EUR/USD pair advanced for a third consecutive day and settled around 1.0050.
The EU Harmonised Index of Consumer Prices (HICP) rose by 9.1% YoY in August, up from 8.9% in July, while the core reading for the same period jumped to 4.3% from 4% in the previous month. Both figures were above the market's expectations and at record highs, somehow justifying the hawkish shift from European policymakers.
The USD suffered a temporal knee-jerk early in the US session as the ADP report disappointed, showing the private sector added just 132K new jobs in August. However, the currency recovered ahead of the close as US Treasury yields surged to fresh weekly highs while US indexes closed in the red for a second consecutive day.
GBP/USD struggles to retain the 1.1600 threshold, while AUD/USD trades at weekly lows in the 0.6840 price zone. The USD/CAD pair soared and now hovers around 1.3130.
Safe-haven currencies eased modestly against their American rival, with USD/CHF now at 0.9780 and USD/JPY at 138.90.
Crude oil prices edged lower after the US Defence Department Spokesman announced that G7 finance ministers would discuss Russia's oil price cap on Friday. WTI settled at $89.10 a barrel. Spot gold heads into the Asian session, trading around $1,710 a troy ounce, its lowest in over a month.
Bitcoin price flaunts possible falling bullish wedge revival amid fears of decoupling from traditional markets
Like this article? Help us with some feedback by answering this survey:
Rate this content -
20:30
US dollar bears move in ahead of critical NFP
- The US dollar is pressured at month end and ahead of key US data.
- The focus stays on the prospects of a global recession and inflationary pressures.
The US dollar, as measured by the DXY index, is back under pressure on Wednesday in midday trade as traders count down to this week's US Nonfarm Payrolls data due on Friday that could make solidify the case for a 75bp rate hike by the Federal Reserve in September.
The dollar remains near the 2-decade high hit on Monday. The DXY, which measures the greenback against a basket of six currencies, was last down 0.1% at 108.66, after earlier coming within a whisker of Monday's two-decade peak of 109.48. The index is on track for a rise of around 2.6% in August, its third-straight monthly gain.
Record-high inflation in parts of the world is compounding recession fears stalking markets on Wednesday which is serving as a bullish plate for the US dollar and US Treasury yields. The two-year US Treasury yield, which is relatively more sensitive to the monetary policy outlook in the US, hit a 15-year high at 3.499% overnight but eased back to 3.446%. The 10-year Treasury yield, which hit a two-month high of 3.153% on Tuesday, stood at 3.123, easing back from 3.164%.
Traders are now pricing in about a 70% chance of a 75 basis points Fed rate hike next month, according to data from Refinitiv following Fed officials reiterating their support for further rate hikes. New York Fed President John Williams told Wall the Wall Street Journal that inflation expectations in the US were well anchored but added that it would take a few years to bring inflation back to 2%. Richmond Federal Reserve Bank President Thomas Barkin said on Tuesday that the United States is facing "post-war-like" inflation. The remarks made by officials have followed the comments from Fed Chair Jerome Powell who spoke at the Jackson Hole central banking symposium in Wyoming late last week that left the door wide open for ongoing rate hikes into mid-2023, which prompted a wave of US dollar strength.
Meanwhile, economic news remained grim with overnight data showing economic activity in China. The nation has extended its decline this month after new COVID-19 infections, the worst heatwaves in decades and struggles in the property sector. China’s PMI survey data for August showed a contraction in factory activity. The data has led some analysts to believe the world's second-largest economy will likely dip below 3.0% in the third quarter of this year. ''We have trimmed our 2022 GDP forecast to 3.0% from 4.0% as both domestic and external demand continues to weaken,'' analysts at ANZ Bank said.
Eyes on NFP
The data is expected to keep the yuan on the back foot, supporting a bullish outlook for the greenback. Meanwhile, for the US, PMI surveys already released point to a deceleration in manufacturing activity for August, with 4 out of 5 registering notable declines on an ISM-equivalent basis. There will be data tomorrow that analysts at TD Securities explained a sharp drops in shipments/new orders doesn't bode well for current/future manufacturing output. ''We look for a decline in the ISM index, but may revise the forecast as more surveys are released.''
The showdown for the start of the month, however, will be Friday's jobs data. The analysts at TD Securities explained that ''employment likely continued to advance robustly in August but at a more moderate pace following the booming 528k print registered in July. High-frequency data, including Homebase, point to still above-trend job creation.'' The analysts also look for the UE rate to drop by a tenth for a second consecutive month to 3.4%, and for wage growth to advance at a firm 0.4% MoM (5.3% YoY).
DXY technical analysis
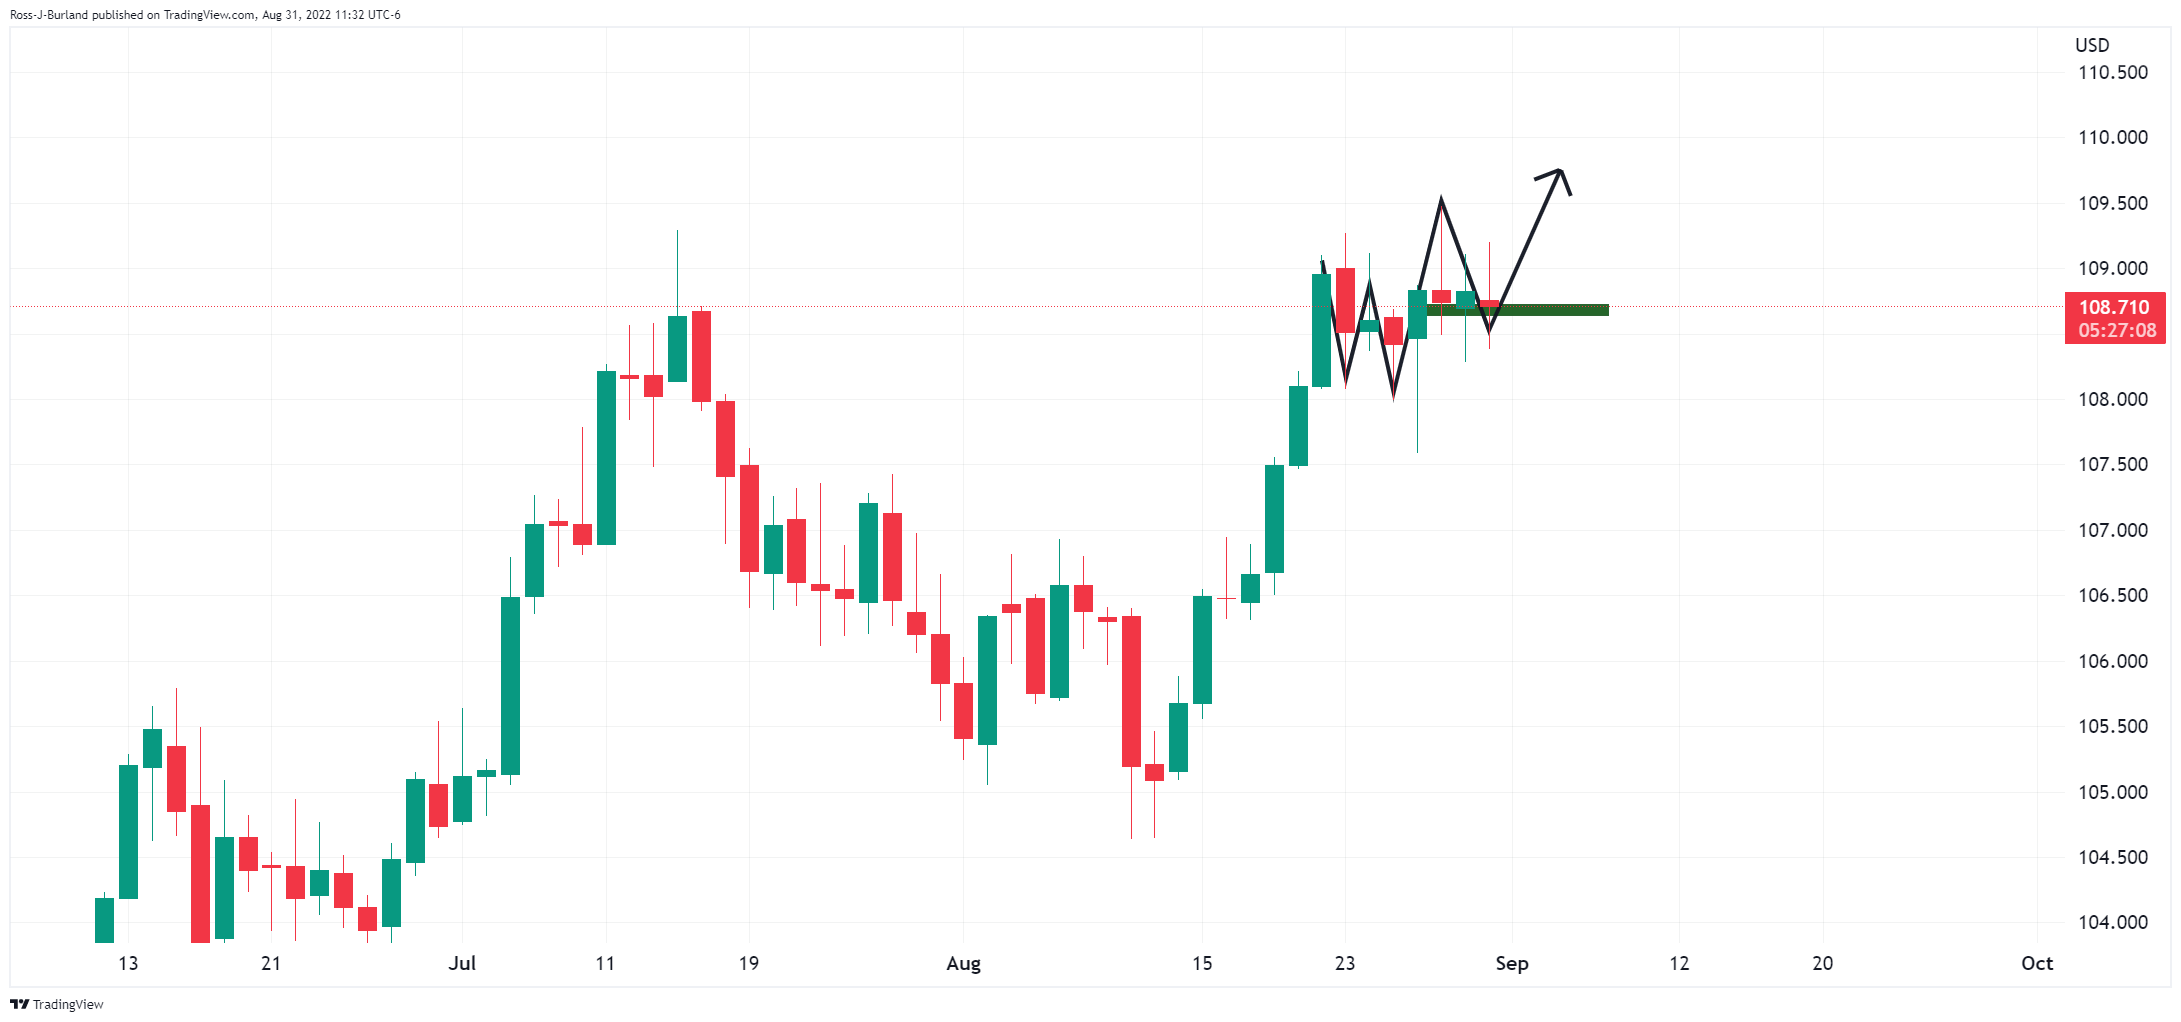
The above two charts are the daily outlook from a bullish and bearish perspective. Both scenarios are determined by either a W or an M formation. Should the current support in the 106.60s hold up, then the focus will be on the upside for the immediate future. On the other hand, a break below and tests of recent lows could result in a wave of selling pressure for a run on the prior bullish impulses.
-
19:28
AUD/USD hovers around 0.6850 below the daily high at around 0.6900
- The AUD/USD stays positive, although off the day’s highs.
- Fed’s Mester: Expects the Federal Funds Rate (FFR) to end at around 4% in 2023.
- Mixed US economic data, a tailwind for the AUD/USD.
The AUD/USD is almost flat, though off the day’s highs after hitting a daily high above the 0.6900 mark. Factors like risk aversion courtesy of month-end flows, alongside Fed speakers reiterating the need to get into the restrictive mode. At the time of writing, the AUD/USD is trading at 0.6858, just above its opening price.
US equities remain heavy due to risk-off. Fed policymakers continue to grab the spotlight. On Wednesday, Loretta Mester expressed that rates in the US need to be above 4% by the next year while adding that she does not estimate rate cuts in the next year. She added that recession fears had risen but are not part of her baseline.
Data-wise, the US economic calendar was light, though it featured the August ADP Employment Change, the first one, after pausing due to some changes made to the survey. Private hirings rose by 132K less than July’s 270K. Later, the Chicago PMI for August increased more than estimated, topping 52.2 vs. 52 expected by analysts.
Meanwhile, on the Australian side, the Australian Construction Work Done for the second quarter, plunged by 3.8% QoQ vs. estimates of a 0.9% expansion.
Analysts at ANZ said, “The weakness was widespread across states and sectors. This raises concerns that construction activity will not be as strong as we had expected this year, despite the extensive pipelines of work yet to be done, particularly across the residential and infrastructure sectors. Demand is still there, capacity utilization in the industry is running well above average, but supply constraints don’t explain the extent of the weakness in Q2.
What to watch
The Australian economic docket will feature the S&P Global Manufacturing PMI alongside the AIG Manufacturing Index, both readings expected to slow down. On the US front, the calendar will feature unemployment claims, the S&P Global PMI, and, most importantly, the ISM Manufacturing PMI.
AUD/USD Key Technical Levels
-
19:17
GBP/USD bulls could be about to take over from fresh bear cycle lows
- GBP/USD has been pressured to fresh cycle lows on US dollar strength.
- The daily chart's M-formation is a reversion pattern that could see the price revert to the 50% mean reversion point near 1.1750.
GBP/USD bleeds out on Wednesday following a brief recovery vs. the nightly greenback. At the time of writing, GBP/USD is trading at 1.1609 and is recording a 0.4% loss on the day so far having fallen from a high of 1.1693 to a low of 1.1598. The pound has pierced the psychological 1.16 round level and is set for its worst month since late 2016 against the greenback as UK inflation is already at 10% and rising, with the Bank of England set to increase rates next month.
Record-high inflation in parts of the world is compounding recession fears stalking markets on Wednesday which is serving as a bullish plate for the US dollar and US Treasury yields. The two-year US Treasury yield, which is relatively more sensitive to the monetary policy outlook in the US, hit a 15-year high at 3.499% overnight but eased back to 3.446%. The 10-year Treasury yield, which hit a two-month high of 3.153% on Tuesday, stood at 3.123, easing back from 3.164%%.
The dollar index gained around 0.4% to 109.20, after starting the week by marking a two-decade high at 109.48. Nevertheless, the greenback remains on track for its third-straight monthly rise, with markets bracing for more oversized interest rate hikes from the US Federal Reserve. The index is on track for a rise of over 3% in August, and its highest end-of-month closing level since May 2002. Traders are now pricing in about a 70% chance of a 75 basis points Fed rate hike next month, according to data from Refinitiv.
The hawkish sentiment was underpinned this week by Fed officials reiterating their support for further rate hikes. New York Fed President John Williams told Wall the Wall Street Journal that inflation expectations in the US were well anchored but added that it would take a few years to bring inflation back to 2%. Richmond Federal Reserve Bank President Thomas Barkin said on Tuesday that the United States is facing "post-war-like" inflation. The comments followed the speech from Fed Chair Jerome Powell at the Jackson Hole central banking symposium in Wyoming late last week that shut left the door wide open for ongoing rate hikes into mid-2023, which prompted a wave of dollar strength.
Global growth risks weigh on GBP
Meanwhile, economic news remained grim with overnight data showing economic activity in China. The nation has extended its decline this month after new COVID-19 infections, the worst heatwaves in decades and struggles in the property sector. China’s PMI survey data for August showed a contraction in factory activity. The data has leads some analysts to believe the world's second-largest economy will likely dip below 3.0% in the third quarter of this year. '' We have trimmed our 2022 GDP forecast to 3.0% from 4.0% as both domestic and external demand continues to weaken,'' analysts at ANZ Bank said.
Such bearish sentiment is a risk for risk currencies, such as the pound as recessions loom. The BoE's recent forecast of recession underpins the vulnerability of the pound going forward. ''The warnings on growth over-rode any support for the currency that may otherwise have been derived from the Bank’s 50 bps rate hike, the largest incremental move in 27 years,'' analysts at Rabobank said.,
''The UK is facing months of astoundingly high inflation levels faced by a period of disinflation during potentially 5 quarters of negative GDP growth.''
''We see risk that cable could print as low at 1.14 on a 1 to 3-month view. This assumes a continued period of broad-based USD strength.''
GBP/USD technical analysis
The pound has extended the daily decline in a classic continuation from a 50% mean reversion of the prior bearish impulse on the hourly chart:
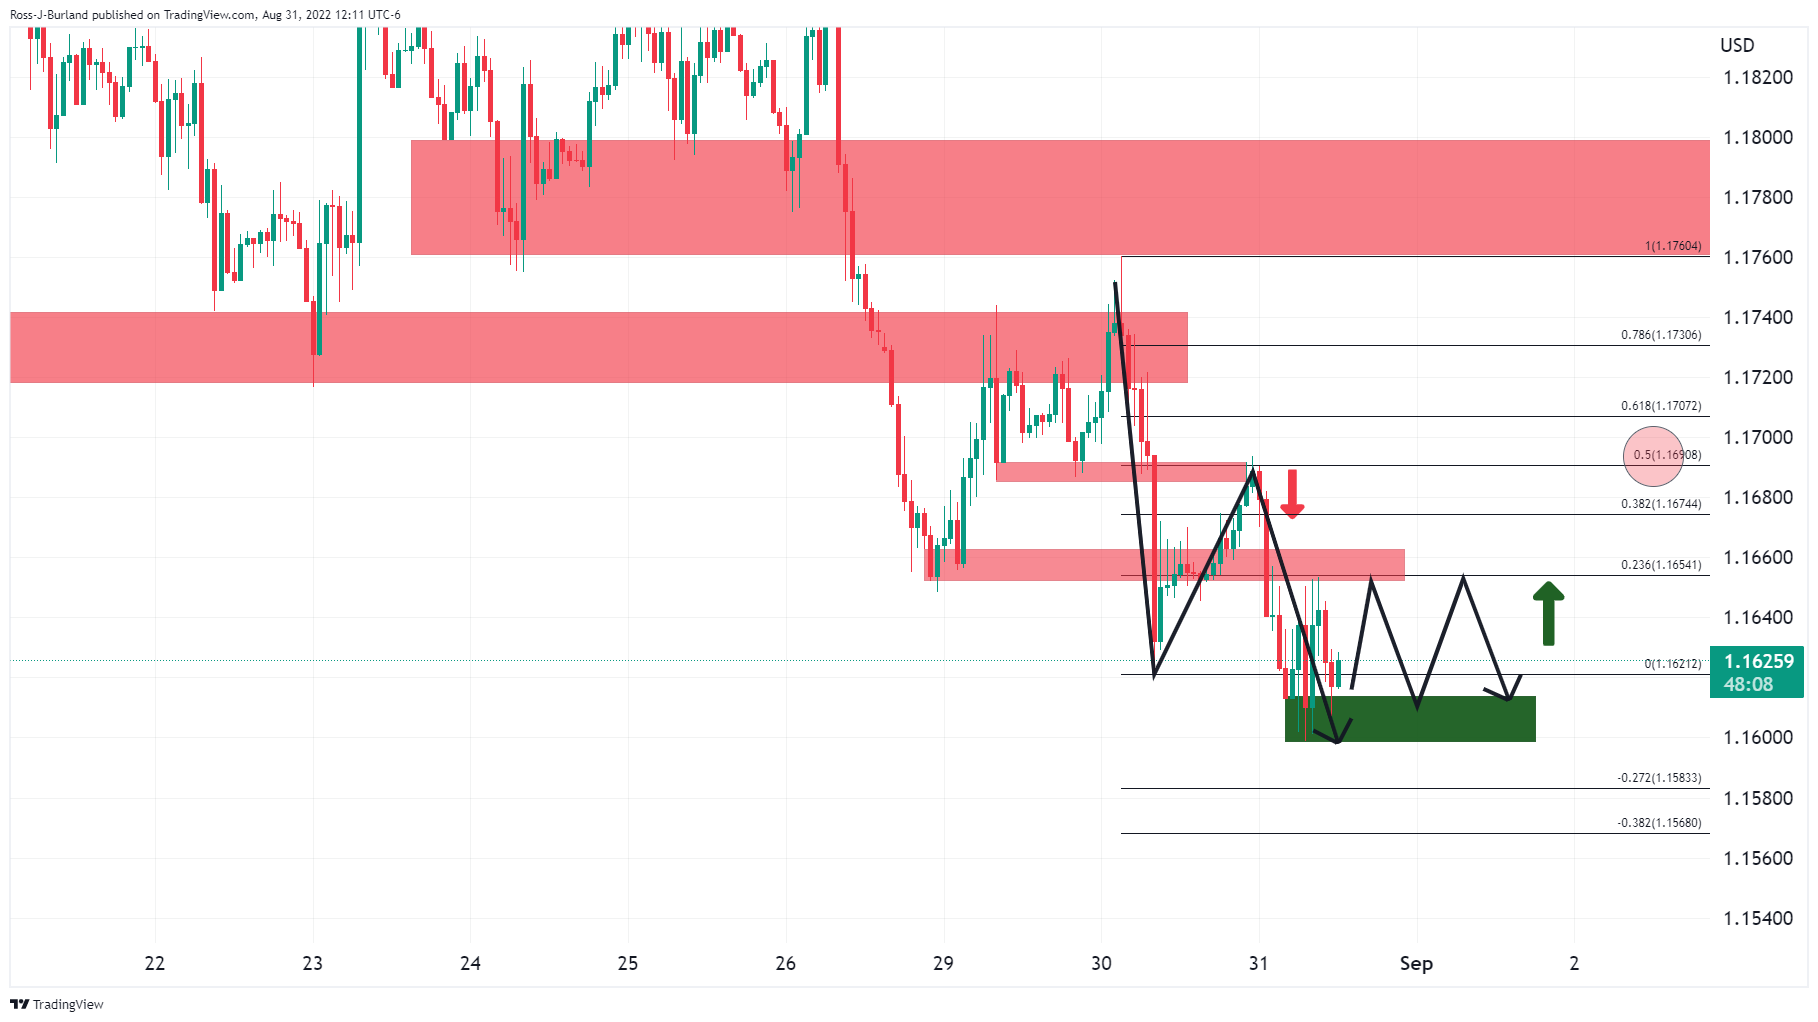
However, as illustrated on the chart above, we could be in for some consolidation between support and resistance and ultimately, this could lead to a bullish correction, as per the daily chart's analysis:
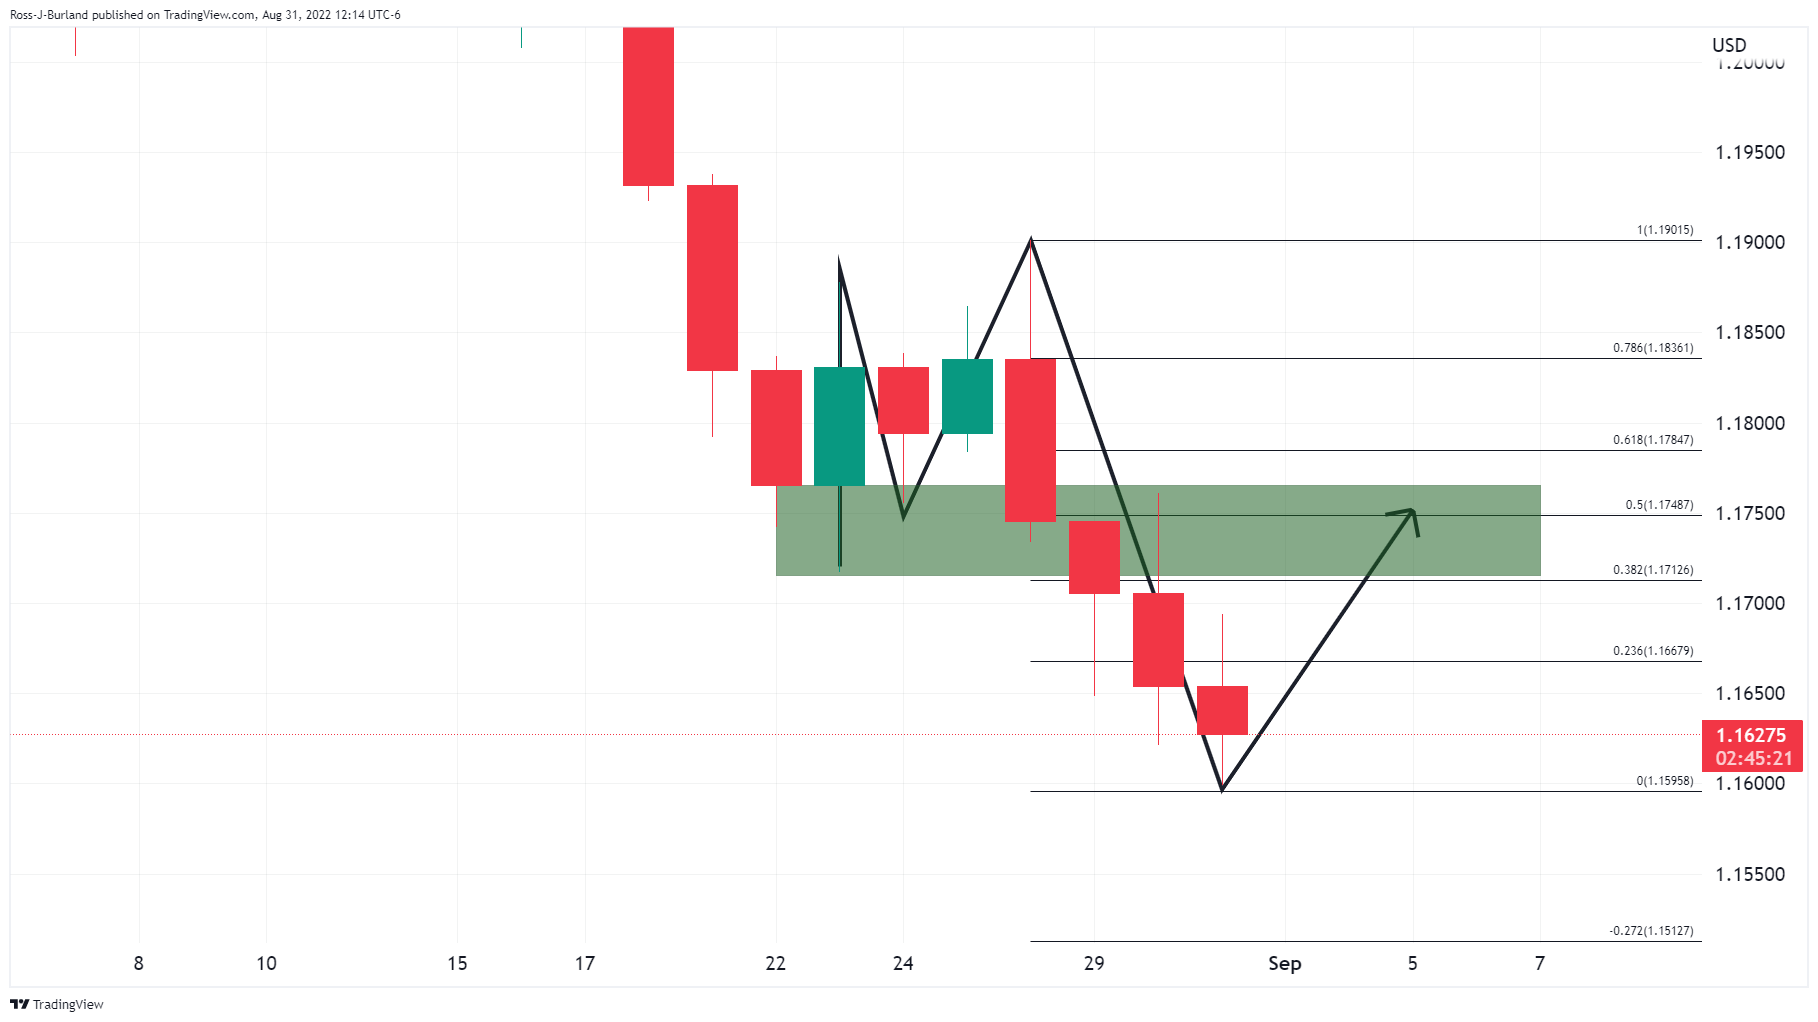
The daily chart's M-formation is overextended, but it is a reversion pattern that could see the price revert to the 50% mean reversion point near 1.1750 in due course.
-
18:42
USD/CHF Price Analysis: Marches firmly towards the 0.9800 figure
- USD/CHF extends its rally to four straight days, refreshed seven-week highs.
- Solid resistance lies around the confluence of a top-trendline of an ascending channel and a psychological price level of around 0.9800.
The USD/CHF advances sharply after hitting a daily low at 0.9726. in the North American session, the USD/CHF is trading at 0.9758 after hitting a seven-week high at 0.9807.
USD/CHF Price Analysis: Technical outlook
During the day, the USD/CHF printed a seven-week high, above the 0.9800 figure, though it was short-lived. The major retreated toward current exchange rates. Nevertheless, oscillators, particularly the Relative Strength Index (RSI), signal buyers still have some fuel left in the tank to re-test the abovementioned level, which, once cleared, could pave the way towards July’s 14 swings high at 0.9886.
Otherwise, the USD/CHF might consolidate around the 0.9700-0.9800 range ahead of the release of Swiss CPI figures on Thursday, alongside Friday’s US Nonfarm Payrolls.
Short term, the USD/CHF 4-hour chart depicts the pair trending up in an ascending channel. The high of the day was the second test of the top-trendline of the channel, with sellers stepping in. dragging the major 50 pips lower. USD/CHF traders should note that the high of the day, was reached when the Relative Strength Index (RSI) peaked at overbought conditions. Therefore, once the RSI dipped, then a re-test of the 0.9800 figure is on the cards.
The USD/CHF first resistance would be the R1 pivot at 0.9777. Once cleared, the next supply zone would be the figure and top-trendline of the channel around 0.9800. On the flip side, the USD/CHF First support would be the daily pivot at 0.9722. A breach of the latter will send the major tumbling towards the 20-EMA at 0.9709, followed by the 0.9700 mark.

USD/CHF Key Technical Levels
-
17:21
EUR/USD hovers around 1.0057 after reaching new week highs
- EUR/USD advances sharply ahead of US NFP and next week’s ECB monetary policy decision.
- Cleveland’s Fed Mester expects Fed funds rates above 4% and would like to hold them higher for longer.
- ECB’s hawks expect at least a 50 bps increase at September 8 meeting.
- Money market futures estimate the ECB would hike 125 bps by October.
EUR/USD is recording decent gains in the North American session amidst a risk-off mood, courtesy of further hawkish Fed commentary, with Cleveland’s Fed Mester taking the stand. At the same time, month-end flows weighed on the greenback.
The EUR/USD opened near parity before sliding towards the day’s lows at 0.9971 before climbing sharply, reaching a daily high at 1.0076 on month-end flows. At the time of writing, the EUR/USD is trading at 1.0059, above its opening price.
During the New York session, Cleveland’s Fed President Loretta Mester emphasized that rates in the US need to be above 4% by 2023 and reiterated the Fed needs to “hold it there.” Mester added that she does not foresee rate cuts in 2023 while acknowledging that even though recession fears had risen, they are not part of her baseline.
In the meantime, the US economic docket featured the US ADP August’s figures, the first one, after pausing due to changes made to the report. Private hirings rose by 132K less than July’s 270K. Later, the Chicago PMI for August increased more than estimated, topping 52.2 vs. 52 expected by analysts.
In the meantime, the Euro area energy crisis continues to worsen. The Nordstream 1 pipeline entered three-day maintenance, as reported by Gazprom, keeping investors uneasy amid a period of high energy prices. In the meantime, EU’s inflation rose 9.1% YoY, higher than estimates, while core readings, which extract volatile items, also rose 4.3%.
Last reports about the Nordstream 1, Gazprom commented that Siemens could not hold regular equipment maintenance for the pipeline via Interfax. The natural gas pipeline works at a 20% capacity.
Elsewhere, ECB’s hawks are all over the place, crossing wires. The first one was Rehn, which expressed that although the economic outlook has darkened, monetary policy needs to normalize. He foresees further rate hikes coming. Later ECB’s Holtzmann commented that 50 bps is the minimum for September while adding that 75 bps need to be thrown into discussions.
What to watch
The euro area economic calendar will reveal German Retail Sales, amongst a tranche of S&P Global Manufacturing PMIs readings. On the US front, the docket will feature unemployment claims, the S&P Global PMI, and, most importantly, the ISM Manufacturing PMI.
EUR/USD Key Technical Levels
-
17:00
Russia Unemployment Rate came in at 3.9%, below expectations (4.1%) in July
-
16:51
Gold Price Forecast: XAU/USD rebounds as US yields turn to the downside
- XAU/USD rises more than $10 from monthly lows.
- US yields retreat after ADP data, DXY turns negative.
- Stocks in Wall Street fail to hold to gains.
Gold prices are modestly down on Wednesday but off lows. During the American session, XAU/USD rebounded from the one-month low at $1,709 and rose to $1,723. It is hovering around $1,720.
The rebound in gold is preventing a daily close under $1,715 which would be a negative technical development suggesting more losses ahead, targeting $1,700. Below, the next level to watch is the July low at $,1680. The immediate resistance on the upside is located at $1,725; above the bearish pressure would ease.
Yields down
US yields are now falling on Wednesday. Following the August ADP employment report, the demand for Treasuries rose. The employment numbers came in below expectations with the private sector adding 132K jobs versus the 288K of market consensus. On Thursday the ISM Manufacturing is due and on Friday, the Non-farm payroll (consensus: 300K).
The US 10-year yield peaked at 3.16%, the highest level in two months and then pulled back to 3.10%; the 2-year yield retreat from the highest since 2007 at 3.49% to 3.43%. The decline in yields weakened the greenback, helping XAUUSD. The US Dollar Index falls 0.35% on Wednesday and is back under 108.50. The DXY continues to move sideways, holding between 108.00 and 109.00.
Despite the move lower in yields, the doors for a 75 basis points rate hike from the Federal Reserve are still open. Also, despite the rebound, the primary trend in XAU/USD is still bearish.
Technical levels
-
16:42
Colombia National Jobless Rate fell from previous 11.3% to 11% in July
-
16:26
Canada: As the weather heated up, the economy was cooling down – CIBC
Data released on Wednesday showed a solid growth rate in Canada during the second quarter of 3.3%, however, it was below expectations of 4.5%. Analysts at CIBC point out the numbers were far from a disaster and continue to show solid growth. They expected a 75 basis point rate hike from the Bank of Canada next week.
Key Quotes:
“As the weather heated up, the Canadian economy was cooling down. While growth in Q2 as a whole was solid at an annualized +3.3%, and little changed from Q1's pace, it was disappointing relative to consensus expectations (+4.4%) and was largely driven by an acceleration in early spring. The latest monthly GDP figures, including an advance estimate for a slight decline in July, have shown a broadly flat trend starting in May. While we still expect that the Bank of Canada will hike interest rates further to combat high inflationary pressures, a cooling economy supports our view that the peak will be lower than financial markets have been pricing in
“Today's GDP figures were far from a disaster, and still show that the Canadian economy managed to achieve solid growth during a period of time that the US economy was contracting. However, somewhat cooler growth in Q2 and Q3 than the Bank of Canada recently forecasted should give policymakers comfort that inflation will start to ease more meaningfully later in the year without interest rates needing to move too far into restrictive territory.”
“We still forecast a 75bp hike from the Bank next week, that will take the overnight rate to 3.25% and into a range that policymakers think is restrictive (above 3%). However, we also expect a pause after that as the Bank reassess the impact of these restrictive rates on growth and inflation.”
-
16:14
EUR/GBP rallies toward fourth straight day, hits monthly highs near 0.8650
- Pound remains under pressure on negative UK economic outlook.
- Euro keeps rising amid expectations of a 75 rate hike from the ECB.
- EUR/GBP gains momentum after breaking key technical levels.
The EUR/GBP broke above 0.8605 and jumped to 0.8640, reaching the highest level since July 1. The cross remains near the top, with a strong bullish tone as EUR/USD breaks above 1.0050.
The euro is rising for the fourth consecutive day against the pound, accumulating a gain of more than 200 pips. The impressive rally can have more legs to go particularly if EUR/GBP holds above 0.8630. The next resistance stands at 0.8650 followed by 0.8670 and then 0.8720.
Inflation in EZ, fear in UK
Earlier on Wednesday, Eurozone inflation data showed a new record with the annual rate reaching 9.1% (above the 9% of market consensus). The numbers favored expectations of a “jumbo” rate hike of 75 basis points from the European Central Bank at next week’s meeting. Also, more ECB officials offered hawkish remarks. UK and EZ bond yields continue to rise ahead of rate hikes from central banks. European bonds are on track for their worst month ever.
In the UK, the negative economic outlook, the energy crisis and soaring inflation keep hitting the pound. The currency is about to post the biggest monthly drop versus the US dollar since October 2016.
Also weighing on GBP is the cautious tone across financial markets that usually affect the pound more than the euro. Wall Street is flat on Wednesday with main indices at the lowest level in a month while the FTSE 100 is about to end with a 0.70% decline.
Technical levels
-
16:08
USD/JPY remains subdued around 138.60s ahead of Friday’s US NFP
- USD/JPY remains trading within a narrow range as traders brace for August’s US NFP.
- The US ADP Employment change disappointed, but Chicago’s PMI exceeded estimates.
- The BOJ would conduct purchasing operations of 10-year JGB notes in September, further confirming its dovish stance.
The USD/JPY is almost in the North American session, unable to crack a fresh YTD high, amidst a dismal sentiment, with US data led by the ADP report below estimates, while the Chicago PMI exceeds estimates. Today’s data, alongside Tuesday’s JOLTs report and consumer confidence, justifies additional tightening by the Fed.
The USD/JPY opened near the day’s highs, around 138.80, and struck a daily low at 138.26. However, buyers stepped and lifted the major towards its daily high at 138.90 before retreating toward current exchange rates. At the time of writing, the USD/JPY is trading at 138.62.
USD/JPY unfazed amid a lack of catalyst
The US ADP report for August showed that private hirings rose by 132K, less than the previous month’s 270K jobs. Worth noting that it’s the first release under a new survey format, so it should not be viewed as a prelude to Friday’s Nonfarm Payrolls report. According to Nela Richardson, ADP Chief Economist, “our data suggest a recent shift towards a more conservative hiring pace,” companies are at an inflection point. She added that hirings could shift from “supercharged job gains” to a more regular cycle.
Later, the Chicago PMI for August increased more than estimated, topping 52.2 vs. 52 expected by analysts.
Earlier, Cleveland’s Fed President Loretta Mester crossed newswires, reiterated her view of the Federal funds rate (FFR) being above 4% by 2023 and “hold it there.” She commented that she does not “anticipate the Fed cutting the FFR next year.”
In the meantime, the US Dollar Index tumbles 0.25% down at 108.547, while the US 10-year benchmark note rate is unchanged at 3.106%, a headwind for the USD/JPY.
Elsewhere, during the Asian session, Japanese retail sales exceeded estimates in July in tandem with consumer and industrial production. Meanwhile, the Bank of Japan (BoJ) announced that it would conduct purchasing operations of 10-year JGB notes, committed to its ultra-loose monetary policy stance.
USD/JPY Key Technical Levels
-
15:30
United States EIA Crude Oil Stocks Change came in at -3.326M below forecasts (-1.483M) in August 26
-
14:51
Downside risks for GBP/USD to the 1.10 zone in the next few months – Scotiabank
How low can the pound go? The GBP/USD pair could dive as low as 1.10, in the opinion of economists at Scotiabank.
GBP will not react well to renewed equity market weakness
“Beyond the stagflation risk, the GBP will not react well to renewed equity market weakness as central banks persist with interest rate increases while the domestic political backdrop remains unhelpful (a new PM, Brexit issues unresolved and independence movements at home stirring again).”
“The broad, trade-weighted index (TWI) measure of the pound could fall another 4-5% broadly or so before reaching the lows seen around the 1992 Exchange Rate Mechanism debacle, the 2008 financial crisis, the 2016 Brexit vote and the 2020 pandemic. The fact that broad TWI losses stalled around 73.5 on each of those very different calamities for the pound suggests it is a point worth keeping a close eye on moving forward. A return to that point in this cycle might imply – roughly – downside risks for GBP/USD to the 1.10 zone and upside risks for EUR/GBP to the 0.90 area in the next few months.”
-
14:45
United States Chicago Purchasing Managers' Index above forecasts (52) in August: Actual (52.2)
-
14:45
EUR/USD to retest the 0.9900/10 zone on a sustained push under 0.9985 – Scotiabank
EUR/USD is capped at around 1.0050. Analysts at Scotiabank expect the world’s most popular currency pair to retest the 0.9900/10 area on a drop below 0.9985.
Swaps are not yet fully priced for a 75 bps hike
“After another failed test of 1.0050 earlier in the session (minor double top), a sustained push under 0.9985 (neckline trigger) will tilt risks towards a retest of the 0.9900/10 area.”
“Swaps are not yet fully priced for a 75 bps hike, reflecting 67 bps of tightening at the Sep meeting, but the trend is leaning towards the risk of a more aggressive hike which may provide the EUR with some underpinning below 1.00 for now.”
-
14:41
GBP/USD: The only major point of note is the 1.1425 low from 2020 – Scotiabank
GBP/USD is floundering in the low 1.16s. Economists at Scotiabank expect the pair to continue its slide.
GBP to retain a weak undertone
“Short, medium and long-term trend oscillators remain aligned bearishly against the GBP, implying that GBP rebounds are liable to remain shallow (1.17/1.18 range) and short-lived.”
“There is little in terms of notable support for the GBP below the market – the 1.16 and 1.15 points provide some psychological support but the only major point of note is the 1.1425 low from 2020.”
“Sterling is liable to retain a soft undertone at least until the new government team and its policies take shape.”
-
14:37
Gold Price Forecast: Every tick lower in XAU/USD is raising the risk of a capitulation event – TDS
Gold has come under renewed bearish pressure and hit a fresh monthly low below $1,710. Strategists at TD Securities note that any dip in the yellow metal increases the odds of a massive capitulation event in gold.
Silver prices are vulnerable
“Gold markets still feature an extremely concentrated and bloated position held by family offices and proprietary trading shops. Few traders are now holding an extremely bloated position. Further, this position does not appear to be associated with a stagflationary narrative. As prices approach this cohort's pandemic-era entry levels, the risk of a large-scale capitulation is growing. This fits well with the risk of a breakout in the broad dollar index, which could coincide with a meltdown below the $1,675 range.”
“Considering that industrial demand has also resumed its slump, after the mean-reversion in demand signals showed signs of overshooting, silver prices are also vulnerable given little exposure to the rise in supply risk premia that has supported the base metals complex.”
“While palladium also proved vulnerable to demand headwinds, a recent CTA selling program has been whipsawed, translating to modest buying support that should soon run out of steam. Unless prices break north of $2,133, we expect a CTA selling program to imminently weigh on palladium.”
-
14:33
EUR/USD leaves behind daily lows near 0.9970
- EUR/USD bounces off earlier lows in the 0.9970 zone.
- The dollar gives away part of the recent advance past 109.00.
- EMU flash inflation figures surprised to the upside in August.
Following a knee-jerk to the 0.9970 region, EUR/USD managed to regain traction and reclaim the parity zone on Wednesday.
EUR/USD meets support around 0.9970
EUR/USD now looks to add to the positive start of the week, although it remains at the mercy of inconclusive risk appetite trends for the time being.
In the meantime, higher-than-expected inflation figures in the euro area for the current month appear to have lent further conviction to the investors’ perception of a 75 bps rate hike at the ECB event in September, which seems to have lent some wings to the single currency.
In the US docket, the revised ADP report showed the US private sector added 132K jobs in August, less than initially estimated.
What to look for around EUR
EUR/USD now treads water amidst the renewed bid bias in the greenback as well as some worsening conditions in the risk complex.
So far, price action around the European currency is expected to closely follow dollar dynamics, geopolitical concerns, fragmentation worries and the Fed-ECB divergence. However, potential shifts to a more hawkish stance from ECB’s policy makers regarding the bank’s rate path could be a source of strength for the euro.
On the negatives for the single currency emerge the so far increasing speculation of a potential recession in the region, which looks propped up by dwindling sentiment gauges as well as an incipient slowdown in some fundamentals.
Key events in the euro area this week: EMU Flash Inflation Rate, Germany Unemployment Change, Unemployment Rate (Wednesday) – Germany Retail Sales, Final Manufacturing PMI, EMU Final Manufacturing PMI, EMU Unemployment Rate (Thursday) – Germany Balance of Trade (Friday).
Eminent issues on the back boiler: Continuation of the ECB hiking cycle. Italian elections in late September. Fragmentation risks amidst the ECB’s normalization of its monetary conditions. Impact of the war in Ukraine and the persistent energy crunch on the region’s growth prospects and inflation outlook.
EUR/USD levels to watch
So far, spot is losing 0.11% at 1.0001 and the breach of 0.9899 (2022 low August 23) would target 0.9859 (December 2002 low) en route to 0.9685 (October 2022 low). On the other hand, the next up barrier comes at 1.0090 (weekly high August 26) seconded by 1.0202 (high August 17) and finally 1.0223 (55-day SMA).
-
14:21
USD/CAD clings to modest gains near 1.3100 after Canada GDP data
- USD/CAD touched its highest level since mid-July above 1.3100.
- Canadian economy expanded at a softer pace than expected in Q2.
- Greenback struggles to gather strength after weak employment data.
The USD/CAD pair gathered bullish momentum and touched its highest level since mid-July at 1.3132 before erasing a portion of its daily gains. As of writing, the pair was up 0.1% on the day at 1.3107.
Canadian economy loses momentum
The data from Canada showed on Wednesday that the economy expanded at an annualized rate of 3.3% in the second quarter. This reading came in weaker than the market expectation for a growth of 4.4% and caused the loonie to lose interest.
On the other hand, the ADP reported that employment in the US private sector rose by 132,000 in August, missing the market expectation for an increase of 288,000 by a wide margin. This data caused the US Dollar Index (DXY) to lose its traction and made it difficult for USD/CAD to preserve its bullish momentum. Ahead of Wall Street's opening bell, DXY stays flat on the day at around 108.90.
Meanwhile, crude oil prices started to rebound, helping the commodity-related CAD show some resilience against its rivals. The barrel of West Texas Intermediate, which dropped to a nine-day low of $88.20 earlier in the day, was last seen trading above $90.
There won't be any other high-tier macroeconomic data releases in the remainder of the session but month-end flows toward the London fix could ramp up the market volatility.
Technical levels to consider
-
14:03
Chile Industrial Production (YoY) down to -5.1% in July from previous -1.5%
-
13:40
Canada: Annualized real GDP grows by 3.3% in Q2 vs. 4.5% expected
- Canadian economy expanded at a softer pace than expected in the second quarter.
- USD/CAD trades in positive territory above 1.3100 after the data.
Real Gross Domestic Product (GDP) in Canada expanded at an annualized rate of 3.3% in the second quarter, the data published by Statistics Canada showed on Wednesday. This print followed the 3.1% growth recorded in the first quarter and missed the market expectation of 4.5%.
On a quarterly basis, real GDP was up 0.8%. "Growth in the second quarter was moderated by declines in housing investment and household spending on durable goods and by a rise in imports that exceeded exports," Statistics Canada noted in its publication. "Final domestic demand rose by 0.7%, following a 0.9% increase in the first quarter."
Market reaction
The USD/CAD pair edged higher after this data and was last seen gaining 0.25% on the day at 1.3123.
-
13:32
Brazil Nominal Budget Balance registered at -22.498B above expectations (-36B) in June
-
13:32
Brazil Primary Budget Surplus came in at 20.44B below forecasts (21.4B) in June
-
13:30
Canada Gross Domestic Product Annualized (QoQ) below forecasts (4.4%) in 2Q: Actual (3.3%)
-
13:30
Canada Gross Domestic Product (MoM) in line with forecasts (0.1%) in June
-
13:20
USD/TRY inches higher and approaches 18.20
- USD/TRY extends the gradual march north to the 18.20 region.
- The better tone in the dollar lifts the pair to fresh YTD highs.
- Türkiye GDP expanded 7.6% YoY during the second quarter.
Further upside in the US dollar keeps USD/TRY near the 2022 tops in levels just shy of 18.20 on Wednesday.
USD/TRY still targets the all-time top around 18.25
In the meantime, the bullish bias is unlikely to abandon USD/TRY for the time being, with the immediate target at the all-time high around 18.25 (December 20 2021).
Furthermore, the pair posted gains in every month since the start of the year and the lira advanced in only one out of the last nine weeks vs. the dollar.
Positive news from the domestic docket also failed to lend some wings to the Turkish currency after GDP figures showed the economy expanded at an annualized 7.6% during the April-June period, surpassing expectations at the same time.
What to look for around TRY
The upside bias in USD/TRY remains unchanged and trades closer to the all-time high around 18.25. The uptrend in spot has been underpinned following the unexpected interest rate cut by the CBRT on August 18.
In the meantime, price action around the Turkish lira is expected to keep gyrating around the performance of energy and commodity prices - which are directly correlated to developments from the war in Ukraine - the broad risk appetite trends and the Fed’s rate path in the next months.
Extra risks facing the Turkish currency also come from the domestic backyard, as inflation gives no signs of abating (despite rising less than forecast in July), real interest rates remain entrenched well in negative territory and the political pressure to keep the CBRT biased towards low interest rates remains omnipresent.
In addition, there seems to be no other immediate alternative to attract foreign currency other than via tourism revenue, in a context where official figures for the country’s FX reserves remain surrounded by increasing skepticism among investors.
Key events in Türkiye this week: Economic Confidence Index, Trade Balance (Monday) – Q2 GDP (Wednesday) – Manufacturing PMI (Thursday).
Eminent issues on the back boiler: FX intervention by the CBRT. Progress of the government’s new scheme oriented to support the lira via protected time deposits. Constant government pressure on the CBRT vs. bank’s credibility/independence. Bouts of geopolitical concerns. Structural reforms. Presidential/Parliamentary elections in June 23.
USD/TRY key levels
So far, the pair is gaining 0.07% at 18.1741 and faces the immediate target at 18.1973 (2022 high August 29) seconded by 18.2582 (all-time high December 20) and then 19.00 (round level). On the other hand, a breach of 17.7586 (monthly low August 9) would pave the way for 17.5781 (55-day SMA) and finally 17.1903 (weekly low July 15).
-
13:17
Breaking: Private sector employment rises by 132,000 in August vs 288,000 expected
The data published by Automatic Data Processing (ADP) showed on Wednesday that private sector employment in the US rose by 132,000 in August. This reading came in weaker than the market expectation for an increase of 288,000.
Commenting on the report, “our data suggests a shift toward a more conservative pace of hiring, possibly as companies try to decipher the economy's conflicting signals,” said Nela Richardson, chief economist, ADP. “We could be at an inflection point, from super-charged job gains to something more normal.”
"Year-over-year change in annual pay was 7.6% in August, in line with monthly readings since Spring 2022," the ADP's publication further read. "In early 2021, annual pay increases were running at about 2%. While the pace of pay increases is elevated, its growth has flattened."
Market reaction
With the initial market reaction, the US Dollar Index edged lower and was last seen trading flat on the day at 108.85.
Developing story...
-
13:15
United States ADP Employment Change below expectations (288K) in August: Actual (132K)
-
13:08
ECB to hike 75 bps as inflation has not yet peaked, first response to be a stronger EUR – Nordea
The inflation rate in the eurozone rose further in August from 8.9% to 9.1%. Economists at Nordea now expect the European Central Bank (ECB) to hike by 75 bps next week – even if new staff projections for growth are approaching the downside scenario – lifting the euro.
ECB likely to deliver 75 bps in Sep
“Inflation remained almost unchanged at high levels in Aug, but will rise in the coming months as gas prices pass through.”
“ECB to deliver 75 bps in Sep. Risk of 75 bps again in Oct.”
“ECB’s staff projections nearing downside risk scenario, but no recession likely in forecast.”
“Given that a 75 bps rate hike is not fully in prices in financial markets and that the tone of the press conference is likely to be hawkish, we expect the first response in financial markets to be a higher rates, wider bond spreads and a stronger EUR.”
-
13:05
Fed's Mester: I don't anticipate Fed rate cuts next year
Cleveland Federal Reserve Bank President Loretta Mester said on Tuesday that she was not anticipating the Fed to cut rates next year, as reported by Reuters.
Additional takeaways
"We need to raise the policy rate to somewhat above 4% by early next year; hold it there."
"Real rates will need to move into positive territory; remain there for some time."
"Bringing down inflation will be painful in the near term; requires a lot of fortitude."
"I see the unemployment rate rising somewhat above 4% by the end of next year."
"Size of rate increases at each meeting depends on the inflation outlook."
"I have not incorporated recession into my base outlook for the US economy."
"Risks of recession over the next year or two have moved up."
"I expect inflation in the range of 5-6% for this year, then to make more progress back down over next 2 years."
"Wage pressures show little sign of abating."
"Without asset sales, reduction of the balance sheet could take 3 years or so."
"Far too soon to conclude inflation has peaked."
Market reaction
These comments don't seem to be having a significant impact on the dollar's valuation. As of writing, the US Dollar Index was up 0.15% at 109.00.
-
13:02
South Africa Trade Balance (in Rands) came in at 24.76B below forecasts (25.5B) in July
-
13:01
India Gross Domestic Product Quarterly (YoY) below expectations (15.2%) in 2Q: Actual (13.5%)
-
13:00
Brazil Unemployment Rate meets forecasts (9.1%) in July
-
13:00
India Infrastructure Output (YoY) dipped from previous 12.7% to 4.5% in July
-
13:00
Norges Bank will sell more NOK, this points towards a weaker krone ahead – Nordea
Norges Bank announced that they will raise their NOK selling to 3.5bn from 1.5bn NOK per day. This large shift points toward a weaker Norwegian krone ahead, according to economists at Nordea.
Norges Bank shifts gears, expect a weaker NOK
“We see EUR/NOK trading above 10.00 in the months to come.”
“Norges Bank will sell 3.5bn NOK/day going forward on behalf of the Government, due to a larger petroleum tax flow. At the same time, equity markets will likely continue to be choppy after the hawkish messages from central bankers, well-illustrated by Fed’s Kashari's comment that he was ‘happy’ with falling stocks. Both of these factors point towards a weaker NOK, while high energy prices should soften the blow.”
“We see EUR/NOK around 10.30 by year-end.”
-
12:20
Iran Foreign Minister: Carefully reviewing EU-drafted text for revival of 2015 nuclear pact
Iran's Foreign Minister Hossein Amirabdollahian said on Wednesday that Tehran is carefully reviewing the EU-drafted text for the revival of the 2015 nuclear pact, as reported by Reuters.
"We need stronger guarantees from the other party to have a sustainable deal," Amirabdollahian added. "The (U.N.) agency should close its politically-motivated probes."
Market reaction
Crude oil prices showed no immediate reaction to these comments. As of writing, the barrel of West Texas Intermediate was trading at $89.10, where it was down 3.5% on a daily basis.
-
12:00
United States MBA Mortgage Applications declined to -3.7% in August 26 from previous -1.2%
-
11:58
US Dollar Index Price Analysis: Next on the upside comes the 2022 peak
- DXY adds to Tuesday’s uptick and reclaims the area above 109.00.
- Immediately to the upside comes the cycle high at 109.47 (August 29).
DXY trades on a firmer note and extends the rebound past the 109.00 hurdle on Wednesday.
The index seems to have moved into a consolidative phase, with the lower bound in recent lows near 107.60 (August 26 low). On the other hand, further gains initially target the 2022 high at 109.47 (August 29) prior to the September 2002 top at 109.77 and the round level at 110.00.
In the meantime, while above the 6-month support line around 105.50, DXY is expected to keep the short-term positive stance.
Looking at the long-term scenario, the bullish view in the dollar remains in place while above the 200-day SMA at 100.87.
DXY daily chart
-
11:38
India Federal Fiscal Deficit, INR fell from previous 3518.71B to 3408.31B in June
-
11:22
EUR/JPY Price Analysis: Extra gains seen on a close above 140.00
- EUR/JPY sparks a corrective decline just above the 139.00 mark.
- Further advance looks likely once 140.00 is cleared.
EUR/JPY comes under downside pressure following three consecutive sessions with gains on Wednesday.
The continuation of the uptrend now shifts the focus to the key level at 140.00. Beyond this zone, the cross might attempt another test of the weekly peak at 142.32 (July 21), which is deemed as the latest defense of the 2022 high at 144.27 (June 28).
While above the 200-day SMA at 134.37, the prospects for the pair should remain constructive.
EUR/JPY daily chart
-
11:01
Portugal Gross Domestic Product (QoQ) rose from previous -0.2% to 0% in 2Q
-
11:01
Italy Producer Price Index (MoM) came in at 5%, above forecasts (2.9%) in July
-
11:01
Portugal Gross Domestic Product (YoY) rose from previous 6.9% to 7.1% in 2Q
-
11:01
Italy Producer Price Index (YoY) came in at 36.9%, above forecasts (33.5%) in July
-
10:58
USD/CAD Price Analysis: Bulls eye 1.3135 resistance ahead of US/Canadian data
- USD/CAD is underpinned by the USD rebound and WTI sell-off.
- Markets remain risk-averse ahead of key US ADP, Canadian GDP.
- Daily technical setup favors bulls, 1.3135 guards immediate upside.
USD/CAD is posting moderate gains in the European session this Wednesday, helped by widespread risk-aversion on increased bets of super-sized rate hikes by the ECB and the Fed.
Aggressive tightening by major global central banks to tame inflation could risk tipping their economies into recession. These fears are dominating and weighing negatively on investors’ risk appetite.
Fresh covid lockdowns and the energy crisis in China are also adding to the risk-off market environment and triggering a 3.50% sell-off in WTI prices. The oil price weakness is fuelling further upside in the major at the cost of the resource-linked CAD.
Markets also prefer to hold the safe-haven US dollar in the lead-up to the critical ADP jobs data and the Canadian Q2 GDP release. The data set could play a pivotal role in altering the Fed and Bank of Canada’s (BOC) rate hike pricing.
From a short-term technical perspective, USD/CAD is primed to challenge the horizontal trendline resistance marked at 1.3135, which is the first hurdle on the move higher.
The next relevant barrier is seen at the July 14 high of 1.3223. Ahead of that, bulls will challenge the 1.3200 round number.
The 14-day Relative Strength Index (RSI) is edging higher, comfortable above the midline, backing the bullish potential.
Further, the 21-Daily Moving Average (DMA) and 50 DMA bullish crossover remains in play, adding credence to the upside.
USD/CAD: Daily chart
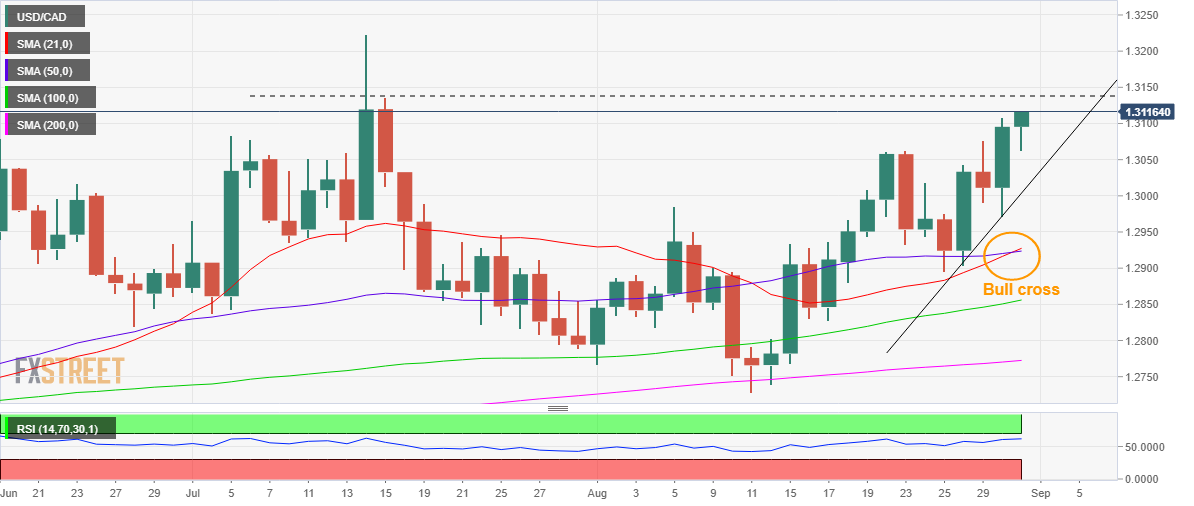
On the flip side, the immediate support is aligned at the 1.3100 threshold, below which sellers will need to take out the daily low of 1.3063.
A sharp sell-off below the latter could kick in, opening floors for a test of the rising trendline support at 1.3000.
USD/CAD: Additional levels to consider
-
10:42
ECB’s Nagel: We need a strong rate hike in September
The European Central Bank (ECB) “urgently needs to act decisively next week,” the central bank’s Governing Council member and German central bank head Joachim Nagel said on Wednesday.
“We need a strong rate hike in September,” Nagel added.
Separately, Germany’s Chancellor Olaf Scholz said that the government will present the next relief package soon.
Meanwhile, EUR/USD remains pressured below parity on these comments, down 0.18% on the day.
Related reads
- EUR/USD Price Analysis: Further range bound likely… until Payrolls?
- Eurozone Preliminary Inflation rises 9.1% YoY in August vs. 9.0% expected
-
10:40
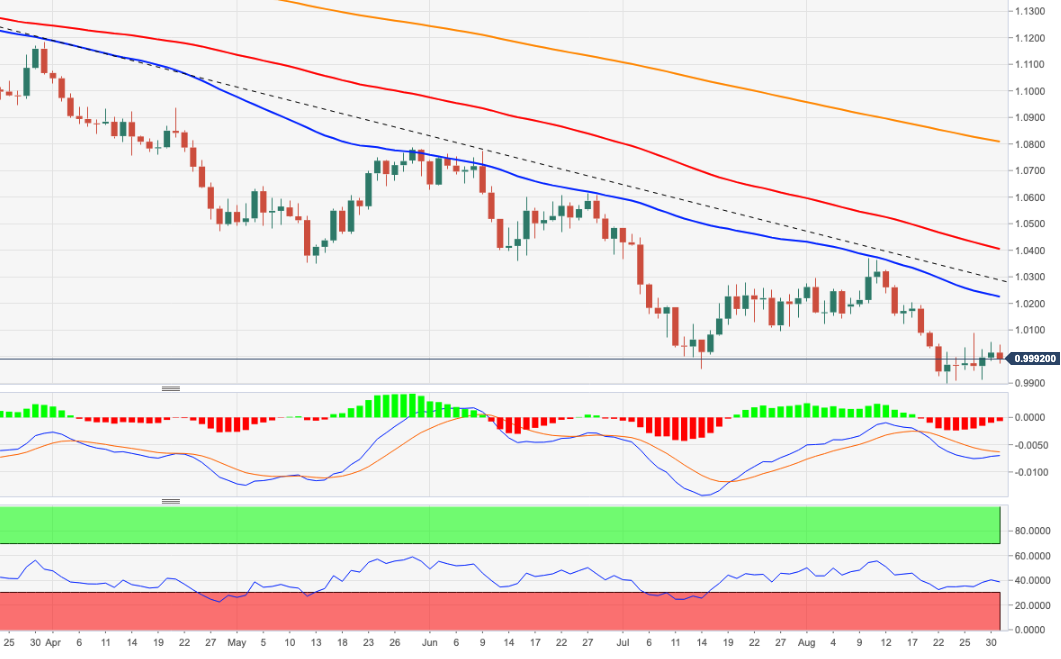
EUR/USD Price Analysis: Further range bound likely… until Payrolls?
- EUR/USD comes under some modest pressure below parity.
- Solid contention remains around the 0.9900 neighbourhood.
EUR/USD sheds some ground following Tuesday’s 2-day tops in the 1.0050/55 band.
Further consolidation looks the most likely scenario in EUR/USD for the time being, always within the 1.0100-0.9900 range. The pair is expected to keep this theme unchanged in the next couple of sessions, or at least until the key publication of US Nonfarm Payrolls (Friday).
The breakout of the weekly high at 1.0090 (August 26) could spark further gains to 1.0202 (August17 high) ahead of the 55-day SMA, today at 1.0222. Alternatively, the loss of the YTD low at 0.9899 (August 23) could put the December 2002 low at 0.9859 back on the radar.
In the longer run, the pair’s bearish view is expected to prevail as long as it trades below the 200-day SMA at 1.0807.
EUR/USD daily chart
-
10:34
Gold falls to fresh monthly low below $1,720
- Gold came under renewed bearish pressure in the European session Tuesday.
- The 10-year US Treasury bond yield is pushing higher, weighing on XAU/USD.
- The US Dollar Index gains traction ahead of the employment data.
After having spent the Asian session fluctuating in a relatively tight channel above $1,720, gold turned south during the European trading hours and fell to its lowest level in a month below $1,715.
Rising US yields, dollar strength weigh on gold
The renewed dollar strength amid the souring market mood seems to be weighing on XAU/USD on Wednesday. US stock index futures dropped into negative territory in the European session, suggesting that safe-haven flows are starting to dominate the market action. In turn, the US Dollar Index climbed above 109.00.
Meanwhile, the benchmark 10-year US Treasury bond yield is up nearly 1% on the day at 3.138%, not allowing gold to shake off the bearish pressure.
Moreover, investors grow increasingly worried about gold's demand outlook with China clinging to its zero-Covid policy and imposing renewed restrictions in a number of cities.
In the second half of the day, the ADP will release its private sector employment report for August. Fed policymakers have repeatedly said that they will assess the data before deciding on the size of the September rate hike. The CME Group FedWatch Tool shows that markets are currently pricing in a 71.5% probability of a 75 basis points rate increase at the next FOMC meeting. A stronger-than-expected ADP print could allow hawkish Fed bets to continue to drive the dollar's valuation ahead of Friday's highly-anticipated Nonfarm Payrolls (NFP) report.
Market participants will also pay close attention to the performance of Wall Street's main indexes after the opening bell. Unless there is a noticeable improvement in risk mood, the dollar is likely to preserve its strength during the American session.
Technical levels to watch for
-
10:33
GBP/USD turns south towards 1.1600 as dollar rebounds ahead of US ADP
- GBP/USD comes under fresh selling pressure as the USD firms up.
- UK energy crisis, soaring Fed big rate hike bets dent risk appetite.
- Cable bears remain on track to test the wedge support at 1.1570.
GBP/USD is trading on the back foot in the European session, undermined by an impressive rebound staged by the US dollar across its major rivals.
The renewed dollar strength comes on the back of a fresh round of risk-aversion, as investors continue to reprice aggressive ECB and Fed rate hike expectations, which raise concerns over higher borrowing costs at a time when the global economies are at risk of recession.
Additionally, the worsening energy crisis in the euro area and the UK, falling British business confidence and raging inflation exert downward pressure on the pound, in turn, dragging GBP/USD lower.
All eyes now turn towards the US ADP private sector employment data, which could bolster the dollar rally on an upside surprise in the job additions.
From a short-term technical perspective, GBP/USD remains on track to test the falling wedge support at 1.1570, below a sustained break of the 1.1600 round level.
The 14-day Relative Strength Index (RSI) is probing the oversold territory, suggesting that there is still room for additional declines.
GBP/USD: Daily chart
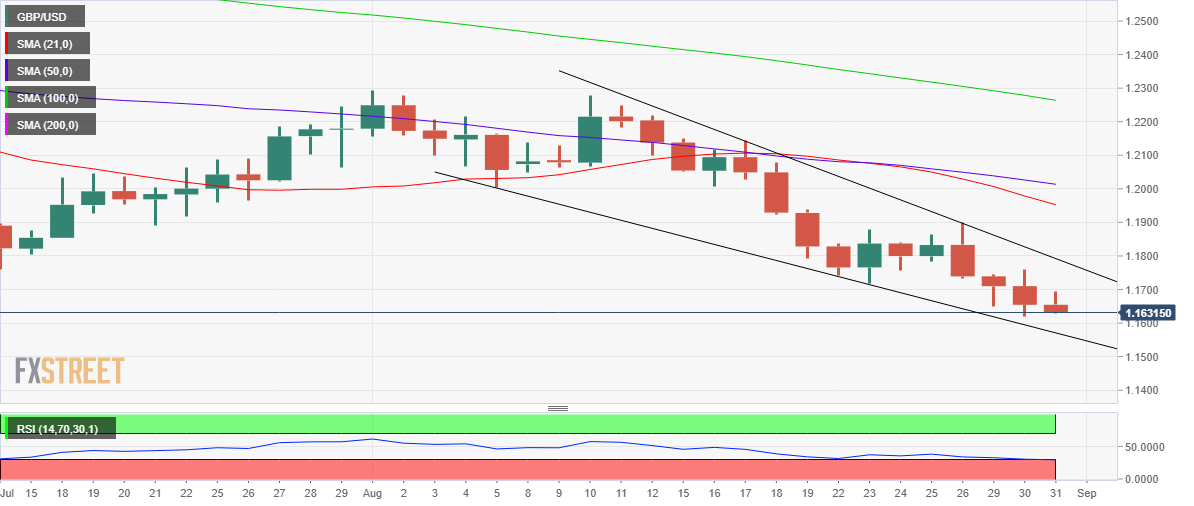
On the flip side, bulls need to crack the 1.1700 barrier to initiating any recovery momentum towards the 1.1750 psychological mark.
Further up, a fresh advance towards the wedge resistance at 1.1791 cannot be ruled out.
GBP/USD: Additional levels to consider
-
10:01
Breaking: Eurozone Preliminary Inflation rises 9.1% YoY in August vs. 9.0% expected
The annualized Eurozone Harmonised Index of Consumer Prices (HICP) rose by 9.1% in August vs. July’s 8.9%, the latest data published by Eurostat showed on Wednesday. The market forecast was for a 9.0% print.
The core figures jumped to 4.3% YoY in August when compared to 4.1% expectations and 4.0% recorded in July.
On a monthly basis, the old continent’s HICP accelerated to 0.5% in August vs. 1.1% expectations and 0.1% previous. The core HICP jumped 0.5% this month against 0.4% expected and -0.2% seen in July.
The Euro area figures are reported a day after Germany’s annual inflation for August, which rose to 8.8% and matched estimates following an 8.5% rise reported in July.
The bloc’s HICP figures hold significance, as it helps investors assess the European Central Bank’s (ECB) monetary policy normalization course. The ECB inflation target is 2%.
Key details (via Eurostat)
“Looking at the main components of euro area inflation, energy is expected to have the highest annual rate in August (38.3%, compared with 39.6% in July), followed by food, alcohol & tobacco (10.6%, compared with 9.8% in July), non-energy industrial goods (5.0%, compared with 4.5% in July) and services (3.8%, compared with 3.7% in July).”
EUR/USD reaction
The shared currency is little changed on the mixed Eurozone inflation data, as EUR/USD is holding the lower ground near 0.9980, down 0.30% on the day.
-
10:01
European Monetary Union HICP (MoM) registered at 0.5%, below expectations (1.1%) in August
-
10:01
European Monetary Union HICP-X F,E,A,T (MoM) registered at 0.5% above expectations (0.4%) in August
-
10:01
Greece Retail Sales (YoY): 1.2% (June) vs -4.2%
-
10:01
Italy Consumer Price Index (MoM) above forecasts (0.6%) in August: Actual (0.8%)
-
10:01
Italy Consumer Price Index (EU Norm) (MoM) above expectations (0.1%) in August: Actual (0.8%)
-
10:01
Belgium Gross Domestic Product (QoQ): 0.2% (2Q)
-
10:01
European Monetary Union HICP-X F,E,A,T (YoY) above expectations (4.1%) in August: Actual (4.3%)
-
10:01
European Monetary Union HICP (YoY) came in at 9.1%, above forecasts (9%) in August
-
10:01
Italy Consumer Price Index (YoY) registered at 8.4% above expectations (8%) in August
-
10:01
Italy Consumer Price Index (EU Norm) (YoY) registered at 9% above expectations (8.3%) in August
-
09:57
GBP/USD could target 1.1550 with a drop below 1.1620
GBP/USD has failed to shake off the bearish pressure. The near-term outlook suggests that the pair could suffer additional losses, FXSTreet’s Eren Sengezer reports.
Additional losses are likely
“The Relative Strength Index on the four-hour chart stays above 30, suggesting that there is more room on the downside before GBP/USD turns technically oversold. Additionally, the pair has returned within the descending regression channel coming from early August, confirming the sellers' willingness to retain control of the action.”
“1.1620 (multi-year lows, mid-point of the descending channel) aligns as first support. Below that level, 1.1600 (psychological level) could act as interim support before the pair could extend its losses toward 1.1550 (lower-limit of the descending channel).”
“On the upside, 1.1670 (upper-limit of the descending channel) forms key resistance. With a four-hour close above that hurdle, buyers could show interest and lift the pair toward 1.1700 (psychological level, 20-period SMA) and 1.1750 (static level, 50-period SMA).”
-
09:49
AUD/USD pares gains below 0.6900 as risk-aversion gathers steam
- AUD/USD bears making a comeback below 0.6900, as risk-off flows ramp up.
- US dollar extends rebound with yields, as rate hike fears and gas crisis spook markets.
- China’s PMIs-led upside appears elusive ahead of critical US ADP jobs data.
AUD/USD is paring back gains towards 0.6850, turning south following a rejection above the 0.6900 round figure. Bears are fighting back control amid strengthening risk-off flows in the European session.
The European stocks erased early gains and trade negative, as fears over the ECB and Fed aggressive tightening combined with the worsening European gas crisis spook markets. Investors seek refuge in the safe-haven US dollar at the expense of the higher-yielding aussie in times of market panic.
Concerns over fresh covid lockdowns in China compounded as many cities are under shutdown already due to the energy crisis in the world’s second-largest economy. The health of China’s economy is back under question, adding to the weight on the Chinese proxy, the AUD.
The aussie traders also refrain from placing any large bets ahead of the critical US ADP Employment Change data, as any upside surprise in the print could trigger a fresh dollar buying and catch AUD bulls off guard.
The ADP is likely to show an addition of 200K jobs in the American private sector this month. The data could be seen as a percussor to Friday’s NFP release and have a significant impact on the market’s pricing of the 75 bps September Fed rate hike, which now stands at 70%.
Earlier in the Asian session, AUD/USD caught a sold bid and briefly recaptured the 0.6900 level, as bulls cheered upbeat official Chinese Manufacturing and Services PMIs. Both the gauge surpassed market expectations and sparked hopes for a turnaround in Chinese business activity.
AUD/USD: Technical levels to consider
-
09:36
Portugal Consumer Price Index (YoY) down to 9% in August from previous 9.1%
-
09:36
Portugal Consumer Price Index (MoM): -0.3% (August) vs previous 0%
-
09:33
BOJ announces fixed-rate purchase plan for cheapest-to-deliver JGB notes
In a statement released on Wednesday, the Bank of Japan (BOJ) said it will conduct fixed-rate purchase operations for cheapest-to-deliver 357th Japanese government bonds (JGBs) notes for an extended period of time from September 1.
Additional details
Fixed-rate purchase operations for 356th 10-year JGBs to be conducted for consecutive days through Sept 20.
Decides to relax terms, and conditions for securities lending facility for cheapest-to-deliver JGB notes.
To increase the upper limit on consecutive-day purchases of cheapest-to-deliver issues to 75 business days from the current 50 days.
Relaxed terms, conditions to take effect from Sept 1.
Market reaction
USD/JPY is holding steady around 138.75, showing little to no reaction to the above headlines.
-
09:07
US Dollar Index: Reaching 110.00 in the coming days is still a tangible possibility – ING
The ADP report had been temporarily discontinued after the May release, and will now resume with an updated methodology and a wider range of data. All in all, economists at ING expect the US Dollar Index (DXY), which continues to move sideways below 109.00, to reach the 110.00 level in the coming days.
Eyes on new ADP methodology
“It will be interesting to see whether the alleged higher accuracy of the new APD index will trigger a larger-than-normal market reaction.”
“We think the dollar direction today may mostly hang on ADP figures, although the underlying narrative should continue to be a moderately bullish one if nothing else because the two major alternative markets to the US one – Europe and China – remain broadly unattractive despite the partial easing in gas prices and a slump in Chinese PMIs proved not as bad as expected this morning.”
“DXY reaching 110.00 in the coming days is still a tangible possibility.”
-
09:02
USD/CAD: Solid Canadian GDP report to fuel a loonie recovery – ING
Statistics Canada will release the second-quarter Gross Domestic Product (GDP) data later in the session, which is expected to show that the Canadian economy expanded at an annualized rate of 4.4% in the second quarter. The data could drag the USD/CAD pair below the 1.30 level, economists at ING report.
GDP numbers should endorse 75 bps hike by BoC
“CAD and NOK weakness looks unlikely to last long, as both currencies still have to fully benefit from the economic benefits of their positive terms of trade shock, which ultimately underpins sustained tightening by their local central banks.”
“Consensus is for +4.4% annualized quarterly growth. This may convince markets to fully price in a 75 bps rate hike by the Bank of Canada next week, a notion that should fuel a CAD recovery and send USD/CAD sustainably below 1.3000 despite some resilience in USD bullish momentum.”
-
09:01
Spain Current Account Balance: €0.04B (June) vs previous €2.85B
-
09:00
Switzerland ZEW Survey – Expectations climbed from previous -57.2 to -56.3 in August
-
08:58
EUR/USD and GBP/USD to reach 0.96 and 1.12 by year-end – UBS
The US Dollar Index (DXY) hit a new 20-year high last week. While it has since come off slightly, the index’s year-to-date rally remains over 13%. More near-term USD gains are likely, in the view of economists at UBS.
USD should top out over the next six months
“We think more short-term USD gains are likely and have recently revised our FX forecasts to reflect a stronger greenback in the near-term.”
“By year-end, we expect EUR/USD and GBP/USD to reach 0.96 and 1.12, respectively. We also forecast USD/CNY to hit 7.00 in the months to come.”
“But in the medium-term, we think that a richly-valued USD should top out over the next six months, with markets watching for any turn in the Fed’s hawkish stance, Europe’s energy crisis, and China’s growth woes.”
-
08:55
Germany Unemployment Change meets forecasts (28K) in August
-
08:55
Germany Unemployment Rate s.a. meets forecasts (5.5%) in August
-
08:55
EUR/USD may struggle to break above 1.0100 and faces downside risks – ING
EUR/USD started reconnecting with its higher short-term rate differential this week, but more good news on the European gas story will be needed to close the undervaluation gap, economists at ING report.
Nord Stream closure warns against EUR/USD bullishness
“As the Nord Stream pipeline closure raises fresh risks of a complete supply cutoff, that process of realignment of EUR/USD with its 2-year swap rate differential (which is at the highest since March) may well halt, or be easily reverted.”
“Our view for the remainder of the week is that EUR/USD may struggle to break above 1.0100 and faces downside risks (i.e. a return below 1.0000) as the end of the Nord Stream planned closure over the weekend inches closer.”
-
08:42
EUR/USD loses momentum and puts parity to the test, looks at EMU CPI
- EUR/USD gives away part of the earlier advance to 1.0045/50 band.
- Germany labour market report, EMU flash CPI next of note.
- US ADP report will take centre stage later in the NA session.
Alternating trends in the risk complex keeps dictating the price action in EUR/USD, which now puts the parity zone under some downside pressure.
EUR/USD keeps the attention on EMU inflation
EUR/USD fades the initial optimism following the improvement in the sentiment surrounding the risk complex, which was recently propped up by better-than-expected Chinese NBS Manufacturing PMI for the current month (49.4 act).
The persistent selling bias in the greenback has been also collaborating with the recent bounce in the pair amidst current speculation over the size of the next interest rate hikes by both the Federal Reserve and the ECB in September.
Later in the euro area, the German labour market report is due seconded by flash inflation figures in the Euroland for the month of August. Across the Atlantic, weekly MBA Mortgage Applications, the ADP report and the speech by FOMC’s L.Mester should also keep investors entertained later in the day.
What to look for around EUR
EUR/USD continues to edge higher on the back of the renewed offered bias in the greenback as well as the broad-based improvement in the risk-linked galaxy.
So far, price action around the European currency is expected to closely follow dollar dynamics, geopolitical concerns, fragmentation worries and the Fed-ECB divergence. However, potential shifts to a more hawkish stance from ECB’s policy makers regarding the bank’s rate path could be a source of strength for the euro
On the negatives for the single currency emerge the so far increasing speculation of a potential recession in the region, which looks propped up by dwindling sentiment gauges as well as an incipient slowdown in some fundamentals.
Key events in the euro area this week: EMU Final Consumer Confidence, Economic Sentiment, Germany Flash Inflation Rate (Tuesday) – France Flash Inflation Rate, Italy Flash Inflation Rate, EMU Flash Inflation Rate, Germany Unemployment Change, Unemployment Rate (Wednesday) – Germany Retail Sales, Final Manufacturing PMI, EMU Final Manufacturing PMI, EMU Unemployment Rate (Thursday) – Germany Balance of Trade (Friday).
Eminent issues on the back boiler: Continuation of the ECB hiking cycle. Italian elections in late September. Fragmentation risks amidst the ECB’s normalization of its monetary conditions. Impact of the war in Ukraine and the persistent energy crunch on the region’s growth prospects and inflation outlook.
EUR/USD levels to watch
So far, spot is losing 0.03% at 1.0007 and the breach of 0.9899 (2022 low August 23) would target 0.9859 (December 2002 low) en route to 0.9685 (October 2022 low). On the other hand, the next up barrier comes at 1.0090 (weekly high August 26) seconded by 1.0202 (high August 17) and finally 1.0223 (55-day SMA).
-
08:26
Italy’s Eni: Gazprom to deliver lower gas volumes on Wednesday
Eni, Italian energy company, said on Wednesday that Gazprom informed it will deliver gas volumes for approx. 20 mln cubic meters on Wednesday, down from daily deliveries of approx. 27 mln cubic meters in recent days.
A month ago, Eni reported that I would receive about 27 million cubic metres of gas from Gazprom.
This comes as the state-controlled Russian energy giant shut down its Nord Stream 1 pipeline from August 31-September 2 for a scheduled maintenance.
Related reads
- French Energy Minister: We have been ready and preparing for Russian gas cut-off
- Natural Gas Futures: Rebound in the offing?
-
08:16
USD/CNH: Further upside remains in the pipeline – UOB
Further upside in USD/CNH continues to target 6.9400 ahead of 6.9600, comment FX Strategists at UOB Group Lee Sue Ann and Quek Ser Leang.
Key Quotes
24-hour view: “We highlighted yesterday that USD ‘appears to have moved into a consolidation’ and we expected USD to ‘trade sideways between 6.9000 and 6.9300’. Our view was not wrong even though USD traded within a narrower range than expected (6.9045/6.9285). The price actions still appear to be part of a consolidation and we continue to expect USD to trade between 6.9000 and 6.9300.”
Next 1-3 weeks: “On Monday (29 Aug, spot at 6.9140), we highlighted that the rapid boost in momentum indicates that the USD strength could extend to 6.9400, possibly 6.9600. USD subsequently soared to 6.9325. There is no change in our view for now but USD could consolidate for a couple of days first. Overall, only a break of 6.8700 (no change in ‘strong support’ level from yesterday) would indicate that the USD strength that started two weeks ago has run its course.”
-
08:12
US Dollar Index treads water below 109.00 ahead of data, Fedspeak
- The index remains side-lined in the upper 108.00s so far.
- US yields appear apathetic near recent highs on Wednesday.
- The ADP report, Fed’s Mester next on tap in the US docket.
The greenback, in terms of the US Dollar Index (DXY), keeps the range bound theme unchanged near the 109.00 region midweek.
US Dollar Index focuses on data
The index alternates daily gains with losses so far this week, as the debate around the size of the next Fed’s rate hike and upcoming key results in US fundamentals remain at the centre stage and keep dictating the price action in the global markets.
Currently, and according to CME Group’s FedWatch Tool, the probability of a 75 bps rate hike in September is now at just above 68%, from around 28% a month ago.
In the US data space, the usual MBA Mortgage Applications are due in the first turn, while the ADP report is expected to update its data for the months of June, July and August ahead of the speech by Cleveland Fed L.Mester (voter, hawk).
What to look for around USD
The greenback remains within a consolidative phase under the 109.00 hurdle so far this week after retreating from Monday’s fresh cycle peaks around 109.50 when tracked by the US Dollar Index (DXY).
Bolstering the dollar’s strength appears the firm conviction of the Federal Reserve to keep hiking rates until inflation looks well under control regardless of a likely slowdown in the economic activity and some loss of momentum in the labour market. This view was recently reinforced by Chair Powell’s speech at the Jackson Hole Symposium.
Extra volatility in the dollar, however, should not be ruled out considering the ongoing debate around the size of the September’s interest rate hike by the Federal Reserve.
Looking at the more macro scenario, the greenback appears propped up by the Fed’s divergence vs. most of its G10 peers (especially the ECB) in combination with bouts of geopolitical effervescence and occasional re-emergence of risk aversion.
Key events in the US this week: MBA Mortgage Applications, ADP Employment Change (Wednesday) – Initial Claims, Final Manufacturing PMI, ISM Manufacturing, Construction Spending (Thursday) – Nonfarm Payrolls, Unemployment Rate, Factory Orders (Friday).
Eminent issues on the back boiler: Hard/soft/softish? landing of the US economy. Prospects for further rate hikes by the Federal Reserve vs. speculation over a recession in the next months. Geopolitical effervescence vs. Russia and China. US-China persistent trade conflict.
US Dollar Index relevant levels
Now, the index is retreating 0.08% at 108.73 and faces the next contention at 107.58 (weekly low August 26) seconded by 106.59 (55-day SMA) and then 104.63 (monthly low August 10). On the flip side, a break above 109.47 (2022 high July 15) would aim for 109.77 (monthly high September 2002) and then 110.00 (round level).
-
08:00
Turkey Quarterly Gross Domestic Product above forecasts (7.5%) in 2Q: Actual (7.6%)
-
07:58
EUR/HUF: Forint should benefit from MNB's new tools – ING
The National Bank of Hungary (MNB) moved the base rate by 100 bps to 11.75%. The newly announced measures to reduce excess liquidity will help to improve monetary transmission. Thus the way is up in short rates and the forint could maintain a strengthening trend, in the view of economists at ING.
Further front end gains and flattening for the coming days
“We affirm our call that the MNB will probably lower its step sizes in the next meetings as the just announced new measures will slowly but surely improve the monetary transmission. We see the gradual slowdown in the tightening cycle end in a 14% terminal rate with the last hike probably coming in December 2022. At the same time, as with inflation, we see upward risks in the case of interest rates as well. This could not just mean a higher terminal rate, but an extended rate hike cycle into 2023.”
“We anticipate further front-end gains and flattening for the coming days before the dust settles. However, the NMB hiking cycle is about to peak while the market boosts hawkish stance expectations. The priced in terminal rate has moved to 14.50%. Unless we see additional pressures on the forint or inflation, the curve should start to normalise later, i.e. steepening.”
“The forint has received positive support, but the long-term effect of the measures announced today is questionable and it is necessary to wait for details. Nevertheless, the forint should benefit from this decision in the coming days in any case. In the second half of September, however, we expect attention to return to the EU funds negotiations.”
-
07:57
USD/JPY bear’s return eyes 138.00 on sluggish yields, BOJ chatters ahead of US ADP
- USD/JPY renews intraday low, pulls back from six-week high.
- Yields remain sluggish despite firmer US data, hawkish Fedspeak.
- BOJ’s Nakagawa teases discussion over policy change in September, firmer Japan data adds strength to bearish bias.
- US ADP Employment Change appears the key ahead of Friday’s NFP.
USD/JPY bears tighten the grip as they refresh the daily bottom around 138.30 during early Wednesday morning in Europe. In doing so, the yen pair snaps the three-day uptrend while reversing from the highest levels since early July.
While tracing the moves, sluggish yields, firmer Japan data and concerns surrounding the Bank of Japan’s (BOJ) monetary policy change seem to gain major attention. Also likely to exert downside pressure on the quote could be the cautious optimism in the market and anxiety ahead of important US employment data.
Earlier in the day, Japan’s Industrial Production for July improved to -1.8% YoY versus -2.6% expected and -2.8% prior. On the same line were the Retail Trade numbers for the said period, up 2.4% YoY compared to 1.95 market forecasts and 1.5% prior.
Elsewhere, the US 10-year Treasury yields rose to the highest levels in two months before the latest pullback to 3.10%.
It’s worth noting that Bank of Japan (BOJ) monetary policy board member Junko Nakagawa recently mentioned that he hopes to discuss policy change in September based on data available.
On the other hand, the US Consumer Confidence for August improved to 103.2 versus 95.3 in July, per the Conference Board’s (CB) latest survey details. Also, US Housing Price Index (HPI) rose by 0.1% MoM in June compared to May's increase of 1.3% and market expectation of 1.1%. Further, the S&P/Case-Shiller Home Price Indices eased to 18.6% YoY during the stated month versus 19.5% forecast and 20.5% previous readings. It should be noted that the US JOLTS Job Openings grew to 11.239M in July versus 10.475M expected and 11.04M prior (revised from 10.698M).
Following the data, Richmond Federal Reserve Bank President Thomas Barkin said, "I don't expect inflation to come down predictably." On the same line was Atlanta Fed President Raphael Bostic who said, “Slowing inflation data 'may give us reason' to slow interest rate hikes.” Recently, New York Fed President John Williams said, per the WSJ, “We are not at restrictive policy yet.” The policymaker also added, “We need to get interest rates higher than longer run a neutral level.”
The firmer China PMI data and the market’s preparations for the US job numbers appear to underpin the latest optimism in the market. However, the European energy crisis, as well as the central bankers’ aggression, seem to challenge the upside momentum.
The US ADP Employment Change for August, the early signal for Friday’s Nonfarm Payrolls (NFP), expected 200K versus 128K prior, will be important to watch for fresh impulse. However, the monetary policy divergence between the Fed and the BOJ could keep the USD/JPY buyers hopeful unless any signals from the Japanese policymakers that target to tame the difference.
Also read: ADP Jobs Preview: Three reasons to expect the data to drive the dollar higher
Technical analysis
USD/JPY justifies the Doji candlestick formation, marked the previous day, as well as the RSI (14) pullback, while directing the intraday sellers towards the August 23 swing high near 137.70. However, the 10-DMA and a three-week-long support line, near 137.45-40, appear a tough nut to crack for the bears.
Alternatively, recovery moves could aim for the horizontal line surrounding 139.00 that comprises multiple tops marked since mid-July.
-
07:56
Forex Today: Eyes on European inflation data, US ADP report
Here is what you need to know on Wednesday, August 31:
Markets remain relatively muted mid-week as investors await the inflation data from the euro area. In the second half of the day, the ADP's new employment report for the private sector will be featured in the US economic docket. In the early European morning, US stock index futures are up more than 0.5% and the benchmark 10-year US Treasury bond yield holds steady at around 3.1%. After having closed the second straight day virtually unchanged on Tuesday, the US Dollar Index continues to move sideways below 109.00.
ADP Jobs Preview: Three reasons to expect the data to drive the dollar higher.
Earlier in the day, the data from China showed that the NBS Manufacturing PMI edged higher to 49.4 in August from 49 in July. Additionally, the Non-Manufacturing PMI arrived at 52.6, bettering the market expectation of 52.6. Despite the upbeat data, the Shanghai Composite Index was last seen losing nearly 1% on a daily basis. Investors grow increasingly concerned over a long-lasting slowdown in the Chinese economy after authorities decided to impose tougher coronavirus-related restrictions in cities including Shenzen, Chengdu and Dalian.
EUR/USD managed to hold above parity and registered small daily gains on Tuesday. The Annual Harmonised Index of Consumer Prices (HICP) in the euro area is expected to rise to 9% in August's flash estimate from 7.9% in July. Several European Central Bank (ECB) policymakers voiced their willingness to consider a 75 basis points rate hike in September and helped the shared currency stay resilient against its rivals. Meanwhile, with the Nord Stream pipeline shutting down for maintenance for three days, gas flows to Europe got fully halted and natural gas futures rose as much as 5% in the European morning. As of writing, EUR/USD was trading modestly higher on the day at 1.0020.
Eurozone Inflation Preview: Hotter HICP to cement a 75 bps ECB hike next week.
With crude oil prices falling nearly 5% on Tuesday, the USD/CAD pair gathered bullish momentum and climbed to the 1.3100 area before going into a consolidation phase below that level on Wednesday. Statistics Canada will release the second-quarter Gross Domestic Product (GDP) data later in the session, which is expected to show that the Canadian economy expanded at an annualized rate of 4.5% in the second quarter.
GBP/USD registered its lowest daily close since March 2020 at 1.1655 on Tuesday. The pair erased a portion of its daily losses early Wednesday but it continues to trade below 1.1700.
USD/JPY started to stretch lower following Tuesday's failed attempt to break above 139.00. The pair trades in negative territory below 138.50 in the European morning. "Bank of Japan decided to maintain its easy policy bias at July meeting, hope to discuss at September policy meeting whether it should continue doing so based on data available at the time," BOJ monetary policy board member Junko Nakagawa said earlier in the day.
Gold lost nearly 0.8% on Tuesday as the 10-year US T-bond yield held comfortably above 3%. XAU/USD is having a tough time reversing its direction and was last seen posting small daily losses at around $1,720.
Bitcoin failed to build on Monday's gains and lost more than 2% on Tuesday. Nevertheless, BTC/USD holds above $20,000 so far on Wednesday. Despite having closed in the red on Tuesday, Ethereum regathered its bullish momentum and was last seen rising nearly 4% on the day near $1,600.
-
07:55
UK ONS: Energy bill support won't feed into inflation statistics
The Office for National Statistics (ONS) ruled that the Energy Bills Support Scheme (EBSS) will not feed directly into the country's inflation statistics, per Reuters.
Key takeaways
“The energy bill rebate should be treated as increasing household income rather than reducing their expenditure.”
"Therefore... the payment will not affect either the Consumer Prices Index including owner occupiers' housing costs (CPIH), the Consumer Prices Index (CPI) or the Retail Prices Index (RPI).”
Market reaction
GBP/USD was last seen trading at 1.1675, adding 0.18% on the day, little changed on the above piece of news.
-
07:50
China’s GDP downgraded as economic woes persist – ANZ
Economists at ANZ Bank do not see any genuine growth driver that can lift GDP meaningfully in Q3 and Q4. They now expect China’sfull-year GDP growth at 3.0% in 2022.
External demand appears to falter
“Unless the economy revives strongly in September, our monthly tracker predicts that GDP growth will likely dip below 3.0% in Q3 this year.”
“The government is inclined to tighten its zero-COVID approach ahead of the 20th Communist Party Congress from 16 October. Domestic activity will likely be disrupted.”
“China’s export cycle is turning as port activity slows and global supply chain activities falter.”
“We have trimmed our 2022 GDP forecast to 3.0% from 4.0% as both domestic and external demand continue to weaken.”
-
07:46
France Consumer Price Index (EU norm) (MoM) below expectations (0.6%) in August: Actual (0.4%)
-
07:46
France Consumer Price Index (EU norm) (YoY) came in at 6.5%, below expectations (6.7%) in August
-
07:46
France Gross Domestic Product (QoQ) in line with expectations (0.5%) in 2Q
-
07:45
France Producer Prices (MoM) registered at 1.6% above expectations (1.4%) in July
-
07:45
France Consumer Spending (MoM) came in at -0.8% below forecasts (-0.3%) in July
-
07:45
EUR/HUF: Near-term positive reaction of the forint cannot be assumed to extend to the medium-term – Commerzbank
The Hungarian central bank raised its policy rate by another 100 bps on Tuesday, August 30 to 11.75% and kept a hawkish stance. EUR/HUF declined from higher than 407.00 early in the trading session to near 402.00 by the end. However, economists at Commerzbank are reluctant to change to a more optimistic bullish view.
QT does not tend to carry the same weight as straight rate hikes
“It is difficult to read from this one-day behaviour whether or not the market has truly revised its skeptical view of MNB’s policy stance. Neither the Polish nor the Czech central bank has faced the same magnitude of skepticism from the market when faced with similar circumstances. Last but not least, quantitative tightening does not tend to carry the same weight as straight rate hikes.”
“Given our past experience with market reaction to MNB’s policy changes, yesterday’s near-term (positive) reaction of the forint cannot be assumed to extend to the medium-term.”
-
07:40
FX option expiries for August 31 NY cut
FX option expiries for August 31 NY cut at 10:00 Eastern Time, via DTCC, can be found below.
- EUR/USD: EUR amounts
- 0.9925 1.18b
- 1.0000 1.6b
- 1.0035 307m
- 1.0100 1.8b
- 1.0150-60 1.18b
- GBP/USD: GBP amounts
- 1.1755 204m
- USD/JPY: USD amounts
- 136.00 1.51b
- 136.75-80 566m
- 137.50 695m
- 138.00 753m
- 138.50 320m
- 139.50 300m
- USD/CHF: USD amounts
- 0.9665 1.16b
- AUD/USD: AUD amounts
- 0.6785 719m
- 0.6875 397m
- 0.6970-80 346m
- 0.6990-00 410m
- 0.7090-00 1.05b
- EUR/GBP: EUR amounts
- 0.8500 226m
- EUR/JPY: EUR amounts
- 138.00 253m
-
07:38
EUR/USD: Not yet in a rush to change core bearish message – Credit Suisse
EUR/USD has managed to regain parity again. European Central Bank’s (ECB) 75 bps rate hike talk and positive European energy developments have supported the single currency. However, economists at Credit Suisse stick to their EUR/USD 0.9700 end-Q3 target.
Positive developments in European energy markets
“We acknowledge that if the ECB is serious about 75 bps rate hikes, and if the EU is serious about resolving energy difficulties, then two of our key reasons for being bearish on EUR/USD (rate differential dynamics and Europe’s energy malaise) become somewhat undermined.”
“Still, what doesn’t change is the terms-of-trade impact of still high gas prices on the euro area current account position. Nor the risk of further Russian gas supply cuts in coming months. Nor the risk of more risk-averse EUR pricing in the aftermath of the 25 Sep Italian election if a new right-wing government hits budget negotiation difficulties with the EU.”
“So while our EUR/USD 0.9700 end-Q3 target may now take longer to realise, we are not yet in a rush to change our core bearish message.”
-
07:33
USD/CAD: Disappointing Canadian GDP data to put additional pressure on the loonie – Commerzbank
The loonie continues to struggle to stand its ground against the USD. Today’s data on Canada’s Gross Domestic Product (GDP) for the second quarter (Q2) could put additional pressure on the CAD if the figures disappoint, economists at Commerzbank report.
Canadian GDP at expected 4.4% annualized
“The Bloomberg consensus expects growth of 4.4% QoQ (on a seasonally adjusted and annualized basis) suggesting that economic momentum improved further. For June consensus expects a rise of 0.1% (seasonally adjusted) month on month.”
“The forward-looking market does not usually focus on retrospective data, but in the current environment disappointing data might put additional pressure on the loonie.”
-
07:28
GBP/USD levels below 1.10 and or EUR/GBP levels near 0.90 become realistic – Credit Suisse
The broad USD rallied as might be expected after Powell’s hawkish speech at Jackson Hole last week. But unusually, the EUR outperformed the greenback and most other major currencies. Core targets such as GBP/USD 1.1500 and EUR/GBP 0.9000 are within reach, economists at Credit Suisse report.
GBP faces a vortex
“Pricing in rate hikes into the UK curve at this point is a clear case of ‘too little, too late’ given how behind the curve the Bank of England is perceived to be.”
“We now expect UK CPI to reach 15% in Q1 ’23. And yet we are so worried about growth risks that we can’t see the BoE hiking beyond 3.50% in 2023, despite the Jun ’23 Sonia future being priced at 4.35% at the time of writing. If the BoE has left it so late to hike in sufficient increments so as to not be able to face continuing to do so once a recession is in play, the consequences for GBP are grim.”
“Down the line, GBP/USD levels below 1.1000 and or EUR/GBP levels near 0.9000 become realistic.”
-
07:27
USD/JPY: Outlook remains positive so far – UOB
Further upside in USD/JPY looks likely, although the pair faces a tough resistance around 139.50, note FX Strategists at UOB Group Lee Sue Ann and Quek Ser Leang.
Key Quotes
24-hour view: “We expected USD to ‘consolidate and trade within a range of 138.15/139.00’. USD subsequently dropped to 138.03, popped briefly to 139.06 before easing off to end the day little changed at 138.79 (+0.07%). Despite the breach of 139.00, upward momentum has not improved. In other words, USD is unlikely to advance further. For today, we expect USD to trade sideways between 138.10 and 139.10.”
Next 1-3 weeks: “On Monday (29 Aug, spot 138.30), we turned positive USD and expected it advance to 139.00. After USD rose to 139.00, we highlighted yesterday (30 Aug, spot at 138.60) that further USD strength is not ruled even though the 139.00 level is a tough resistance and may be tough to break. We added, ‘a break of 139.00 would shift the focus to 139.50’. USD subsequently popped briefly above 139.00 (high of 139.06) before pulling back sharply. While upward momentum has barely improved, the outlook for USD is still positive. However, it may take a while before the major resistance at 139.50 would come into the picture. To look at it another way, USD could consolidate for a few days first. On the downside, a breach of 137.40 (no change in ‘strong support’ level from yesterday) would indicate that USD is unlikely to advance further.”
-
07:22
Natural Gas Futures: Rebound in the offing?
Preliminary readings from CME Group for natural gas futures markets noted investors trimmed their open interest positions by around 1.4K contracts on Tuesday, partially reversing the previous day’s build. Volume followed suit and dropped by around 57.5K contracts after two daily builds in a row.
Natural Gas looks propped up around $9.00
Prices of natural gas faded part of the upside seen at the beginning of the week on Tuesday. The daily pullback, however, was on the back of shrinking open interest and volume and opens the door to a potential rebound in the very near term. The commodity, in the meantime, remains underpinned by the $9.00 mark per MMBtu.
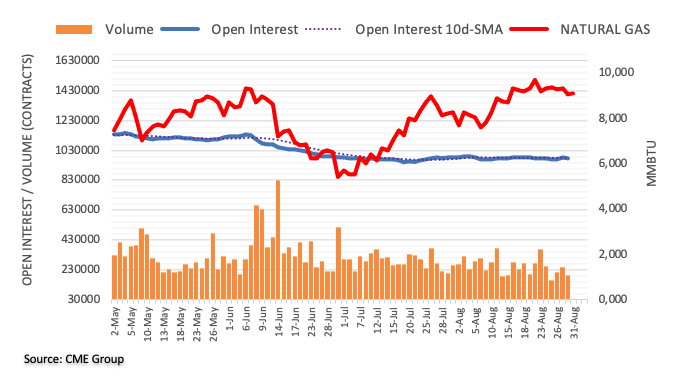
-
07:21
US dollar to remain strong as long as the labor market is doing well – Commerzbank
At the start of the month, there is no avoiding the US labour market report. A continued strong labour market supports a strong US dollar for the time being, economists at Commerzbank report.
Strong labour market, strong dollar
“The market expects the Fed to stick to a tighter monetary policy even if an economic slowdown also becomes apparent on the labor market. As long as the labor market is doing well, there is no reason to question this Fed outlook. And that means that nothing will change for the dollar for the time being.”
“Will the Fed stick to its decisive approach even once social tensions are on the rise or political pressure on the central bank mounts? The market remains sceptical and continues to price in rate cuts for the second half of 2023. This would weaken the dollar and is already limiting the dollar's appreciation potential. However, the longer the labour market remains strong the longer it will take until the Fed has to put its cards on the table. And until then the dollar is likely to remain strong.”
-
07:20
EUR/USD Price Analysis: Bulls brace for 1.0100 ahead of key EU/US data
- EUR/USD retreats from intraday high during three-day uptrend.
- Firmer oscillators, a clear break of 50-SMA favor buyers.
- 100-SMA, one-month-old horizontal area challenge further upside.
- Preliminary readings of EU inflation, US ADP Employment Change in focus.
EUR/USD bulls take a breather around 1.0035, after refreshing the daily top to 1.0046, as cautious mood probes initial optimism during Wednesday’s European session.
That said, the major currency pair’s recent pullback could be linked to the anxiety ahead of flash/preliminary readings of the Eurozone HICP for August, expected at 9.0% versus 8.9% prior. Following that, the US ADP Employment Change for August, the early signal for Friday’s Nonfarm Payrolls (NFP), expected 200K versus 128K prior, will also be important to watch for fresh impulse.
Also read: EUR/USD stays defensive above 1.0000 despite hawkish ECBspeak ahead of EU inflation
It’s worth noting, however, that the quote’s successful upside break of the 50-SMA, backed by firmer RSI (14) and bullish signals from the MACD, keeps EUR/USD buyers hopeful.
With this, a convergence of the 100-SMA and area comprising multiple levels marked since late July, near 1.0100, appears a tough nut to crack for the bulls.
Even if the quote rises past 1.0100, the 200-SMA hurdle surrounding 1.0150 may act as an upside filter.
On the flip side, the 50-SMA level near 0.9985 could restrict the immediate downside of the EUR/USD.
Following that, the weekly support line near 0.9935 and the 0.9900 round figure could regain the bear’s attention.
Overall, EUR/USD bulls are in control ahead of crucial data points.
EUR/USD: Four-hour chart
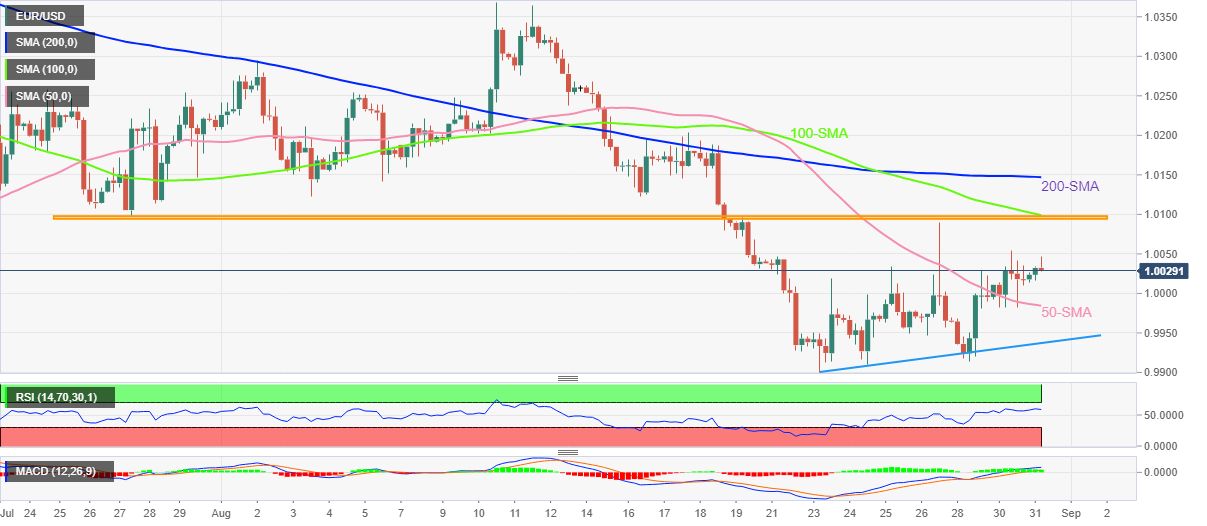
Trend: Limited upside expected
-
07:16
USD/CNY to break 7.00 over the coming weeks, ending the year around 7.10 – TDS
The Chinese yuan has fallen by around 2.7% vs. USD since 10 August and is primed for further depreciation in the weeks ahead. Economists at TD Securities forecast the USD/CNY pair at 7.10 by the end of the year.
Declining underlying support for CNY
“We now expect USD/CNY to break 7.00 over the coming weeks as pressure on the economy builds, ending the year around 7.10 (previously 6.80).”
“The growth outlook will undermine support for the currency. Weakening activity indicators and limited stimulus led us to downgrade our GDP forecast to 2.9% this year.”
“We think China's broad basic balance position will also weaken further in the months ahead, reducing the underlying support for the CNY.”
“Even if the USD turns lower we think China will limit the pace of any CNY appreciation, thus resulting in CNY depreciation on a trade-weighted basis.”
-
07:12
Gold Price Forecast: XAU/USD downside remains exposed towards $1,712 – Confluence Detector
- Gold price consolidates near monthly lows, not out of the woods yet.
- US dollar drops with yields as investors reposition ahead of US jobs report.
- XAU/USD faces a wall of strong resistance levels, downside remains favored.
Gold price is treading water near monthly lows, looking to extend the bearish streak seen so far this week. Investors refrain from placing any aggressive bets on the bright metal ahead of the all-important US employment data. In light of strong US Consumer Confidence data, encouraging jobs data could bolster the expectations of a 75 bps Fed rate hike in September. This could revive the US dollar rally, keeping the downtrend intact in the bullion. Additionally, the Eurozone inflation data could seal in an outsized ECB rate hike next week, exacerbating the pain in the non-interest-bearing gold. The US NFP data will hold the key ahead of the next inflation report.
Also read: Gold Price Forecast: Will US ADP deepen the pain for XAU/USD bulls?
Gold Price: Key levels to watch
The Technical Confluence Detector shows that the gold price is facing stiff resistance at $1,729, where the Fibonacci 38.2% one-day and the previous week’s low merge.
A sustained break above the latter will threaten the Fibonacci 38.2% one-month at $1,732. The next upside barrier is aligned at $1,736, the confluence of the Fibonacci 23.6% one-week and pivot point one-day R1.
Buying resurgence could propel XAU/USD towards powerful resistance around $1,742, the intersection of the SMA50 four-hour and Fibonacci 38.2% one-week.
Should sellers wake up from the slumber, the downside could be reopened towards the monthly lows of $1,720, below which the pivot point one-day S1 at $1,717 will be challenged.
The Fibonacci 23.6% one-month at $1,712 will be the line in the sand for XAU bulls before attacking the $1,700 psychological level.
Here is how it looks on the tool
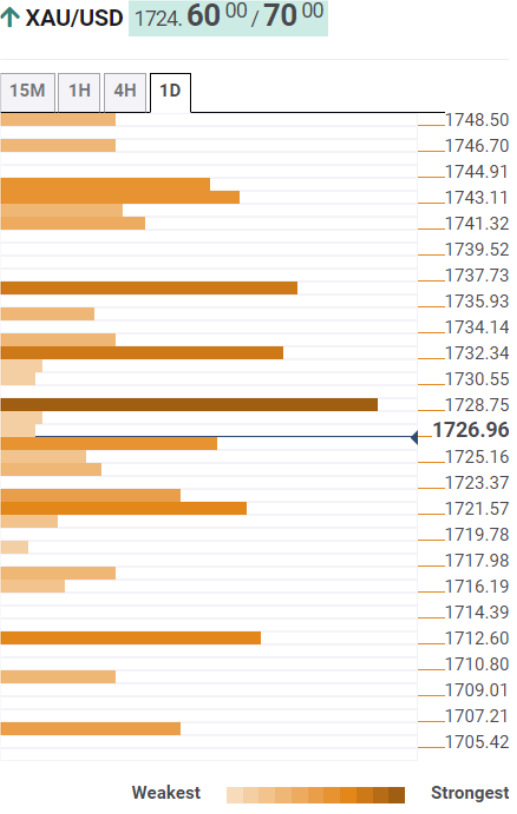
About Technical Confluences Detector
The TCD (Technical Confluences Detector) is a tool to locate and point out those price levels where there is a congestion of indicators, moving averages, Fibonacci levels, Pivot Points, etc. If you are a short-term trader, you will find entry points for counter-trend strategies and hunt a few points at a time. If you are a medium-to-long-term trader, this tool will allow you to know in advance the price levels where a medium-to-long-term trend may stop and rest, where to unwind positions, or where to increase your position size.
-
07:12
AUD/USD: Extra losses likely below 0.6815 – UOB
According to FX Strategists at UOB Group Lee Sue Ann and Quek Ser Leang, AUD/USD risks a deeper drop once 0.6815 is cleared.
Key Quotes
24-hour view: “We expected AUD to ‘trade between 0.6875 and 0.6935’ yesterday. We did not expect the increase in volatility as AUD rose to 0.6956 before plunging to 0.6846 (closed at 0.6854, -0.70%). The rapid drop from the high has room to extend but for today, any weakness is unlikely to break 0.6815 (there is another support at 0.6840). Resistance is at 0.6880 followed by 0.6900.”
Next 1-3 weeks: “On Monday (29 Aug, spot at 0.6870), we held the view that the risk is for AUD to weaken to 0.6815. Yesterday (30 Aug), AUD rose and cracked our ‘strong resistance’ level at 0.6945 (high of 0.6956) before dropping back down quickly. While the breach of the ‘strong resistance’ level has invalidated our view, the shorter-term bias still appears to be tilted to the downside. That said, AUD has to break the major support at 0.6815 before a sustained decline is likely.”
-
07:12
Little upside potential for EUR/USD – Commerzbank
Will the European Central Bank (ECB) hike by 50 or 75 bps in September? Regardless, the immediate outlook for the eurozone remains a fundamental minefield. Therefore, the EUR/USD pair is to remain under downside pressure, economists at Commerzbank report.
A fundamental disadvantage for the euro
“We don’t know whether and to what extent energy shortages will put pressure on the eurozone economy as this is largely dependent on the Russian President’s whims. However, what we do know is that this is a risk that the US economy is not facing in this shape.”
“The US key rate is 2.25 percentage points higher than in the eurozone with roughly similar inflation rates. So if the ECB hikes its key rate in line with the Fed in September (i.e. by 75 bps) that only means that it is not going to be left further behind. However, that does not put the euro into a relatively better position compared with the dollar.”
“For now, I see little upside potential for EUR/USD.”
-
07:08
Crude Oil Futures: Further weakness looks contained
CME Group’s flash data for crude oil futures markets, open interest resumed the downside and shrank by nearly 8K contracts on Tuesday. On the other hand, volume went up sharply by around 266.5K contracts, remaining choppy for yet another session.
WTI appears supported by $85.00
Tuesday’s strong retracement in prices of the barrel of WTI was accompanied by a decline in open interest, which leaves the prospects for a deeper correction somewhat curtailed. In the meantime, crude oil prices remain supported around the August lows near $85.00 per barrel.
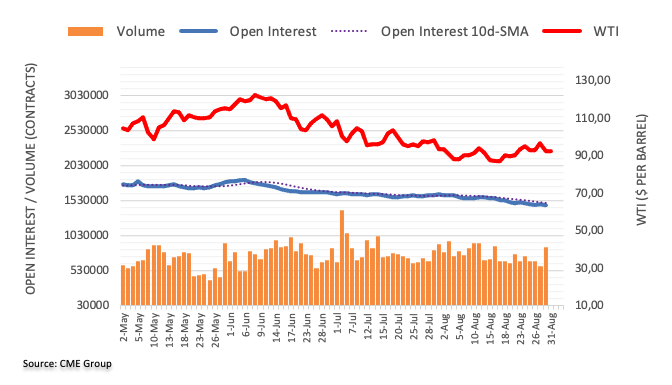
-
07:07
Gold Price Forecast: XAU/USD’s path of least resistance appears down, with eyes on $1,712 and $1,700
Gold price remains pressured near monthly lows. Will US ADP deepen the pain for XAU/USD bulls? FXStreet’s Dhwani Mehta reports.
XAU/USD exposed to additional downside risks
“The critical ADP Employment Change report will be published after a two-month break, potentially driving the next leg higher in the buck. An upside surprise in the ADP numbers cannot be ruled out, given the lower estimates at +200K in August. Gold’s next price direction remains south against a backdrop of higher rates and upbeat US data.”
“Sellers need a sustained move below monthly lows of $1,720 on their way towards the July 27 low of $1,712. The next significant downside target is seen at the $1,700 level.”
“Any recovery attempts will meet initial resistance at the $1,730 round figure. Bulls must find a firm foothold above the rising trendline support turned resistance at $1,743.”
-
07:00
Denmark Gross Domestic Product (YoY) declined to 3.6% in 2Q from previous 6.2%
-
07:00
Denmark Gross Domestic Product (QoQ) above forecasts (0.7%) in 2Q: Actual (0.9%)
-
07:00
Denmark Unemployment Rate came in at 2.3%, above forecasts (2.2%) in July
-
07:00
Germany Import Price Index (YoY) registered at 28.9%, below expectations (29.1%) in July
-
07:00
Germany Import Price Index (MoM) came in at 1.4% below forecasts (1.5%) in July
-
06:59
NZD/USD Price Analysis: Struggles around 0.6150, aims to recapture two-year low at 0.6020
- NZD/USD has sensed barricades around 0.6150, downside looks likely amid an overall bearish structure.
- The 20-and 50-EMAs have represented a bear cross, which adds to the downside filters.
- A decisive move below 40.00 by the RSI (14) will trigger a fresh sell.
The NZD/USD pair is struggling to cross the immediate hurdle of 0.6150 after a less-confident rebound from 0.6130 in the Asian session. Broadly, the asset is displaying sideways movement around 0.6140 and the short-lived pullback is likely to turn into a fresh sell ahead.
On the daily scale, the asset is declining towards the two-year low at 0.6023, recorded on July 14. The major is continuously following the lower-high lower-low structure, which bolsters the odds of more downside ahead.
A bear cross, represented by the 20-and 50-period Exponential Moving Averages (EMAs) at 0.6281 has triggered a fresh downside leg.
Meanwhile, the Relative Strength Index (RSI) (14) is hovering around 40.00 continuously for the past week. A decisive slippage below 40.00 will trigger the downside momentum, which will strengthen the greenback bulls.
A pullback move to near Aug 22 low at 0.6156 will trigger a bargain sell, which will drag the asset towards the round-level support at 0.6100, followed by a two-year low at 0.6023.
Alternatively, a break above Thursday’s high at 0.6252 will send the asset towards August 8 high at 0.6304. A breach of the latter will unleash the kiwi bulls for further upside towards August 1 high at 0.6353.
NZD/USD daily chart
-637975222811824421.png)
-
06:55
BOJ’s Nakagawa: Hope to discuss policy change at September based on data available
Bank of Japan (BOJ) monetary policy board member Junko Nakagawa is back on the wires, via Reuters, commenting on the monetary policy outlook.
Additional quotes
BOJ decided to maintain its easy policy bias at July meeting, hope to discuss at Sept policy meeting whether it should continue doing so based on data available at the time.
BOJ’s pandemic relief programme still being tapped to some extent but balance of loans decreasing.
Fate of BOJ’s pandemic relief programme isn't necessarily linked to decision on whether to tweak forward guidance on monetary policy.
Must remain vigilant to downward pressure on economy from pandemic.
Market reaction
USD/JPY is dropping in tandem with the US dollar and the yields, now losing 0.29% on the day at 138.38.
-
06:53
USD/TRY ignores CBRT move above 18.00, Turkish GDP, US ADP employment data eyed
- USD/TRY remains firmer around yearly top, up for the third consecutive day.
- CBRT raises forex to TRY conversion requirements for banks.
- Cautious mood restricts USD gains ahead of the key data.
- Turkish economy expected to grow by 7.5% in Q2, likely marking contraction in H2.
USD/TRY picks up bids to defend buyers around 18.20 heading into Wednesday’s European session. In doing so, the Turkish lira (TRY) fails to respect the Central Bank of the Republic of Türkiye (CBRT) action, as well as a softer US dollar, ahead of important statistics from Ankara and Washington.
“Turkey's central bank raised the minimum percentage of foreign exchange deposits that banks need to convert to Turkish liras, the Official Gazette showed on Wednesday, while hiking the forex required reserve ratios for those that remain below the limit,” reported Reuters. The news also mentioned that the minimum conversion limit will also be imposed on corporate accounts, from only individual accounts previously.
On the other hand, the US Dollar Index (DXY) bears the burden of the market’s indecision, or cautious optimism, as traders wait for the US employment numbers. That said, the greenback’s gauge versus the six major currencies drop 0.21% intraday to 108.60 by the press time.
It’s worth noting that firmer China PMI and hopes of more stimulus seem to have underpinned the cautious optimism of late. While portraying the mood, S&P 500 Futures refresh intraday high near 4,014, up 0.65% on a day by the press time. Also suggesting an absence of the risk-off mood is the steady US 10-year Treasury yields of around 3.11%, after rising to the two-month high the previous day.
Looking forward, Turkiye’s second quarter (Q2) Gross Domestic Product (GDP), expected 7.5% versus 7.3% prior, could offer immediate directions to the USD/TRY moves ahead of the US ADP Employment Change for August, the early signal for Friday’s Nonfarm Payrolls (NFP), expected 200K versus 128K prior.
Ahead of the Turkish GDP announcements, the Reuters poll challenges the optimism of the TRY traders by signaling a contraction of activities during the second half (H2) of 2022. The poll also quotes Turkish Finance Minister Nureddin Nebati who said on Tuesday that he expects growth in the second quarter to come in higher than the 7.3% recorded in the first quarter.
Technical analysis
Although RSI signals that the USD/TRY bulls are running out of steam, a three-week-old horizontal support area near the 18.00 threshold restricts the short-term downside of the pair. Meanwhile, the quote’s further upside momentum aims 2021 peak near 18.35.
-
06:49
GBP/USD: Next on the downside comes 1.1580 – UOB
In the opinion of FX Strategists at UOB Group Lee Sue Ann and Quek Ser Leang, GBP/USD still risks a deeper pullback in the short term.
Key Quotes
24-hour view: “Our expectations for GBP to ‘trade sideways’ yesterday was incorrect as it plummeted to a low of 1.1622 during NY session. While the rapid drop appears to be overdone, the weakness in GBP has not stabilized. In other words, GBP could weaken further but the chance for a break of 1.1610 is not high for now. The next support at 1.1580 is not expected to come under threat. Resistance is at 1.1688 but only a breach of 1.1715 would indicate that the weakness in GBP has stabilized.”
Next 1-3 weeks: “On Monday (29 Aug, spot at 1.1690), we noted that downward momentum has improved quickly and we held the view GBP could weaken towards 1.1630. Yesterday (30 Aug), GBP dropped to a low of 1.1622. Downward momentum has improved further, albeit not by much and the risk for GBP is still on the downside. The next level to watch is at 1.1580. On the upside, a break of 1.1755 (‘strong resistance’ level was at 1.1800 yesterday) would indicate that GBP is unlikely to weaken further.”
-
06:41
Gold Futures: Room for extra losses
Open interest in gold futures markets extended the uptrend on Tuesday, this time by around 1.6K contracts according to advanced prints from CME Group. Volume, instead, dropped for the second session in a row, now by around 22.5K contracts.
Gold keeps targeting $1,711 ahead of $1,700
Gold prices dropped further on Tuesday amidst rising open interest, which is indicative that the downtrend still has legs to go. Against that, there is an initial support at $1,711 (weekly low July 27) ahead of the key round level at $1,700.
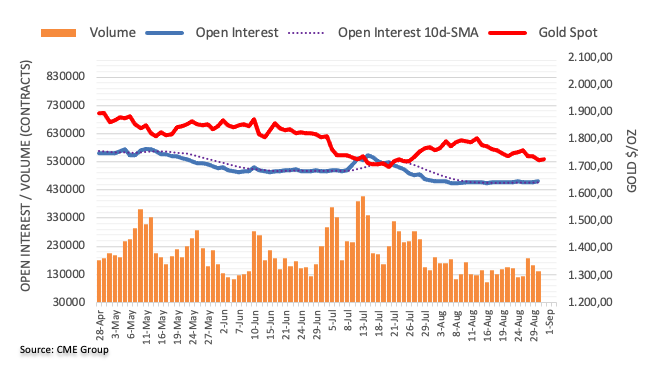
-
06:26
EUR/USD: Further decline still appears on the cards – UOB
FX Strategist Quek Ser Leang at UOB Group’s Global Economics & Markets Research noted that a test of the major support at 0.9670 looks unlikely for the time being.
Key Quotes
24-hour view: “On 06 Jul 2022 (when EUR/USD was trading at 1.0265), we highlighted in our Chart of the Day update that ‘the breach of the critical support at 1.0350 coupled with solid downward momentum is likely to lead to further EUR/USD weakness’. We added, ‘the next key level to monitor is at 1.0000’ and ‘only a break of declining trend-line resistance and the 55-day exponential moving average would indicate that the downtrend in EUR/USD from earlier this year has stabilized’.”
“Our view for EUR/USD to weaken turned out to be correct as it dropped to a low of 0.9950 in mid-Jul before rebounding. The rebound edged slightly above the 55-day exponential moving average but did not break the declining trend-line resistance (high of 1.0368 in midAug). EUR/USD dropped quickly from 1.0368 and last week, it took out the 0.9950 low. Despite breaking the support level, EUR/USD has not been able to make much headway on the downside (low has been 0.9899).”
“That said, the risk for EUR/USD is still on the downside but downward momentum is beginning to slow. The next support level of note is at the bottom of what appears to be a descending channel formation. At this stage, the chance for EUR/USD to decline to the bottom of the channel (currently at 0.9670) is not high. On a shorter-term note, 0.9900 is already a strong support level. Resistance wise, the 55-day exponential moving average, top of the descending channel and the bottom of the daily Ichimoku cloud are all near 1.0220. A break of this key (and formidable) resistance level would greatly diminish the odds of further EUR/USD weakness within these couple of months.”
-
06:23
GBP/USD marches towards 1.1700 on weaker DXY, focus is on US NFP
- GBP/USD is advancing towards 1.1700 as the DXY has extended losses.
- DXY’s investors have turned cautious on lower consensus for US NFP.
- Weaker US Average Hourly Earnings may create more problems for the Fed.
The GBP/USD pair is advancing gradually towards the round-level resistance of 1.1700 as the US dollar index (DXY) has surrendered Tuesday’s gains. The cable has extended its recovery after overstepping the immediate resistance of 1.1675 and has reached near 1.1685 while drafting the article. The asset is expected to extend its gains further as the DXY is expected to remain volatile further.
The DXY has given a downside break of the consolidation formed in a narrow range of 108.67-108.88 in the Asian session. As investors are turning cautious ahead of the US Nonfarm Payrolls (NFP) data, DXY’s strength is fading away. The preliminary forecast indicates that the US economy has created additional 300k jobs in August, lower than the prior release of 528k.
As the US economy is operating at full employment levels, 300k job additions seem satisfactory. However, the Average Hourly Earnings data may make the job laborious for the Federal Reserve (Fed) policymakers. Price pressures have already dented the sentiment of households, therefore higher paychecks are required to offset inflated payouts. And, the economic data is expected to improve marginally by 10 basis points (bps) to 5.3%.
On the UK front, a light economy calendar may shift more responsibility on the DXY for direction in the cable. Next week, investors will focus on Like-For-Like Retail Sales by the British Retail Consortium (BRC). Earlier, the economic data landed at 1.6% on an annual basis. The economic data is expected to remain higher as energy bills are soaring in the pound zone.
-
06:22
BOK: High inflation seen lasting longer than previously expected
There is a possibility of high inflation lasting longer than expected due to chances of a rebound in global commodity prices and continued inflation pressure on the demand side, South Korea's central bank, the Bank of Korea (BOK), said on Wednesday.
The central banks added that the South Korean won's recent weakness was driven by the Chinese yuan's depreciation and continuing trade deficits.
Meanwhile, the country’s President Yoon Suk-yeol said “the main risks to South Korea's worsening trade balance are sluggish exports to China, high global energy prices and weak semiconductor exports.”
Market reaction
The above comments exacerbate the pain in USD/KRW, as it corrects further from multi-year highs of 1,355.50 reached on Tuesday. At the time of writing, the pair sheds 0.87% on the day to trade at 1,338.73.
-
06:20
EUR/GBP Price Analysis: Pullback remains elusive beyond 0.8530
- EUR/GBP retreats from the highest levels since early July, snaps a three-day uptrend.
- Overbought RSI conditions signal further consolidation of gains.
- Previous resistance line, 50% Fibonacci retracement level challenge further downside.
EUR/GBP pares recent gains around a two-month high, keeps pullback from the multi-day top near 0.8590 ahead of Wednesday’s London open. In doing so, the cross-currency pair prints the first daily loss in four.
It’s worth noting that the overbought RSI conditions appear to have probed the EUR/GBP bulls at the eight-week high.
However, a convergence of the resistance-turned-support line from mid-June and the 50% Fibonacci retracement level of June-August downside, around 0.8530, appears the key support to watch during the pair’s further weakness.
Should the EUR/GBP prices drop below 0.8530, the odds of witnessing the pair’s south-run towards 0.8500 can’t be ruled out.
That said, the 61.8% Fibonacci retracement level near 0.8575 could restrict the quote’s immediate declines.
Meanwhile, recovery moves need to cross the latest peak of 0.8603 to convince buyers.
Even so, the 78.6% Fibonacci retracement level and July’s peak, respectively near 0.8630 and 0.8680, could test the EUR/GBP bulls before directing them to the yearly top marked in June around 0.8720.
EUR/GBP: Four-hour chart
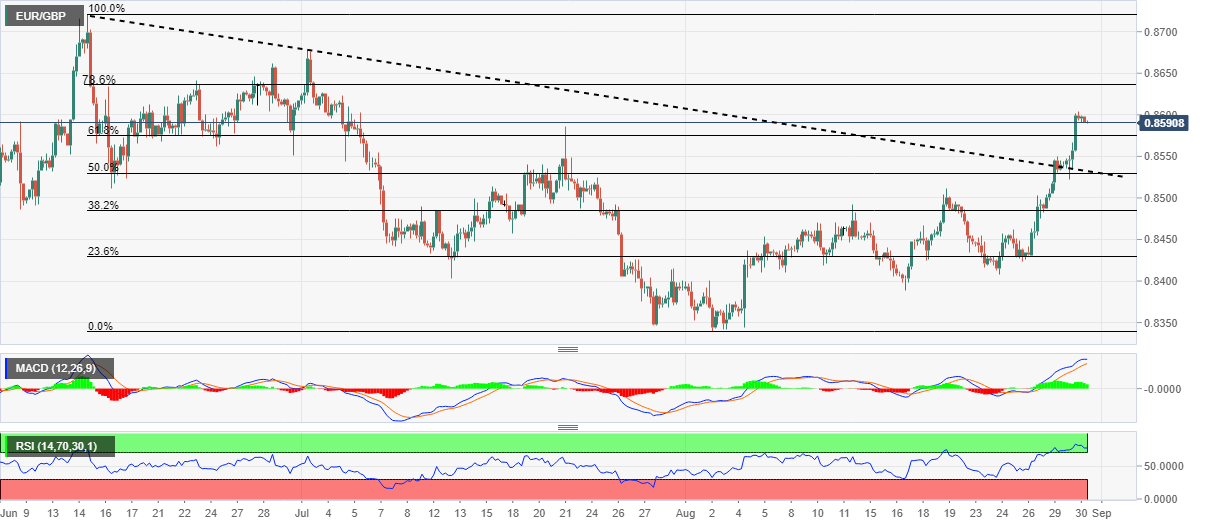
Trend: Limited downside expected
-
06:10
French Energy Minister: We have been ready and preparing for Russian gas cut-off
France's Energy Minister Agnès Pannier-Runacher said on Wednesday that Russia is using gas as a weapon of war "as we anticipated".
Additional quotes
Russia is further reducing French supplies based on that supposition.
France has been ready and preparing for such a scenario.
The country already reducing its exposure to Russian gas imports to 9% - down from roughly double the amount before the Russia-Ukraine conflict.
These comments come after Engie SA, a French multinational utility company, said on Tuesday that Russia’s Gazprom has informed them of a reduction in gas deliveries starting today due to disagreements between the parties over the application of several contracts.
However, later in the day, Russia's gas giant Gazprom announced that it will fully suspend natural gas supplies to Engie from September 1 until it receives all payments for gas in full.
Market reaction
The shared currency is unfazed by the European gas crisis, as EUR/USD is trading near-daily highs of 1.0045, up 0.30% on the day, in anticipation of a 9.0% surge in the Eurozone inflation.
-
06:04
USD/CAD slides towards 1.3050 as oil rebounds, DXY eases ahead of US/Canada data
- USD/CAD takes offers to refresh intraday low, extends pullback from a six-week high.
- Markets brace for US employment numbers, sluggish yields weigh on US dollar.
- China data favor oil buyers amid mixed supply-demand updates.
- Canada GDP, US ADP Employment Change appears important for the pair traders to watch for fresh impulse.
USD/CAD consolidates the latest gains while reversing from a 1.5-month high, refreshing intraday low near 1.3070 heading into Wednesday’s European session. In doing so, the Loonie pair takes clues from the softer prices of Canada’s main export item, i.e. WTI crude oil, as well as the US Dollar Index (DXY), as the pair traders await important statistics from Ottawa and Washington.
WTI crude oil prices consolidate the biggest daily fall in seven weeks by rising to $92.20 at the latest. The black gold seems to have benefited from the firmer China data and the market’s preparations for the US job numbers while ignoring mixed concerns over the US-Iran trade deal and Iraq’s supply concerns, not to forget Russia’s resistance to OPEC+ supply cut.
That said, China’s NBS Manufacturing PMI improved to 49.4 in August versus 49.2 expected and 49.0 prior whereas the Non-Manufacturing PMI also grew to 52.6 during the stated month compared to 52.2 market forecasts and 53.8 previous readings.
While portraying the mood, S&P 500 Futures refresh intraday high near 4,014, up 0.65% on a day by the press time. Also suggesting an absence of the risk-off mood is the steady US 10-year Treasury yields of around 3.11%, after rising to the two-month high the previous day.
It should be noted, however, that the fears emanating from hawkish Fedspeak and China’s covid conditions, as well as the Sino-American tension over Taiwan, seem to challenge the USD/CAD bears. On the same line could be the recently firmer Fed bets, as per the CME’s FedWatch Tool.
Looking forward, the US ADP Employment Change for August, the early signal for Friday’s US Nonfarm Payrolls (NFP), expected 200K versus 128K prior, will be important to watch for fresh impulse. Also crucial will be Canada’s Gross Domestic Product (GDP) for the second quarter (Q2), expected 4.5% annualized versus 3.1% prior. Additionally, the monthly Canadian GDP is expected to grow 0.1% versus 0.0% in previous readouts.
Also read: ADP Jobs Preview: Three reasons to expect the data to drive the dollar higher
Technical analysis
A daily closing beyond the 13-day-old ascending resistance line, near 1.3110 by the press time, appears necessary for the USD/CAD buyers to avoid visiting the 1.3000 psychological magnet.
-
06:02
Japan Construction Orders (YoY) below forecasts (8.7%) in July: Actual (2.8%)
-
06:01
Japan Housing Starts (YoY) below forecasts (-4.1%) in July: Actual (-5.4%)
-
06:01
Japan Annualized Housing Starts fell from previous 0.845M to 0.825M in July
-
06:00
Japan Consumer Confidence Index registered at 32.5 above expectations (31) in August
-
05:46
Asian Stock Market: Recovers early losses as S&P500 revives on subdued DXY, oil stabilizes
- Asian indices have revived significantly amid weaker DXY.
- China’s manufacturing activities unexpectedly escalated in August.
- Oil prices are expected to display a reversal as the correction period seems over.
Markets in the Asian domain have recovered a majority of their losses as overnight S&P500 futures have turned positive after a third consecutive decline on Tuesday. Asian equities are also responding to their respective economic data as Japan's Retail Trade data and China’s PMI have been released. Also, the US dollar index (DXY) is displaying a subdued performance ahead of US Automatic Data Processing (ADP) Employment Change data.
At the press time, Japan’s Nikkei225 0.52%, Hang Seng surrendered 0.46%, however, China A50 added 0.26%. Indian indices are closed on account of Ganesh Chaturthi.
After a gap-down opening, Japanese equities have recovered a majority of their losses amid upbeat Retail Trade data. Retail Trade data have improved to 2.4%, higher than the expectations of 1.9% and the prior release of 1.5% on an annual basis. Also, the monthly economic data has advanced to 0.8%. Meanwhile, the Industrial Production data has landed higher at 1.8% than the expectations and the former release of -2.6% and -2.8% respectively.
Meanwhile, the world’s second-largest economy, China is trading positive after firmer official manufacturing data. China’s NBS Manufacturing PMI has landed at 49.4, higher than the estimates of 49.2 and the prior release of 49.0. Also, the Non-Manufacturing data has released higher at 52.6 vs. the consensus of 52.2 but remained higher than the prior release of 53.8.
Losses in US tech stocks on Tuesday forced a third consecutive decline in Wall Street. As per the consensus, the US ADP is expected to report job additions by 200k, against 528k job additions reported in July. Investors believe that a halt in the recruitment process by various tech giants is responsible for a decline in additional jobs forecast. Also, it indicates a slowdown in the US economy.
On the oil front, oil prices have corrected to near $92.00 after a firmer rally. As demand is expected to remain downbeat amid the consequences of restrictive monetary policy by western central banks, investors are focusing more on production cuts announced by OPEC to fix the price imbalance. The oil prices are expected to revive firmly ahead.
-
05:40
USD/INR Price Analysis: Indian rupee buyers stay on the way to 79.40 support
- USD/INR holds onto the previous day’s downside break of the key support despite recent bounce.
- Bearish MACD signals direct pair sellers towards three-week-old support line.
- 50-SMA adds strength to the 79.85 hurdle, RSI challenges the downside.
- Holiday in India, cautious mood ahead of the key US employment data restrict immediate moves.
USD/INR picks up bids to consolidate intraday losses around 79.60 during Wednesday’s Asian session. Even so, the Indian rupee (INR) pair remains bearish for the second consecutive day amid a trading holiday in India. Also acting as a trading filter is the anxiety ahead of the early signal of Friday’s US Nonfarm Payrolls (NFP), namely ADP Employment Change for August.
Also read: ADP Jobs Preview: Three reasons to expect the data to drive the dollar higher
That said, a clear downside break of an upward sloping trend line from August 02, as well as the 50-SMA, joins bearish MACD signals to favor USD/INR bears.
However, the 61.8% Fibonacci retracement level of July 27 to August 02 downside, near 79.50, restricts immediate declines of the quote.
Also acting as the short-term important support is the three-week-old ascending trend line, at 79.40 by the press time.
It should be noted, however, that the RSI (14) is near the oversold territory and hence signals limited downside.
Alternatively, recovery moves need to cross the convergence of the 50-SMA and the previous support line, around 79.85, to convince USD/INR buyers.
Following that, the 80.00 threshold and the recent high around 80.20 appear crucial hurdles to watch.
USD/INR: Four-hour chart
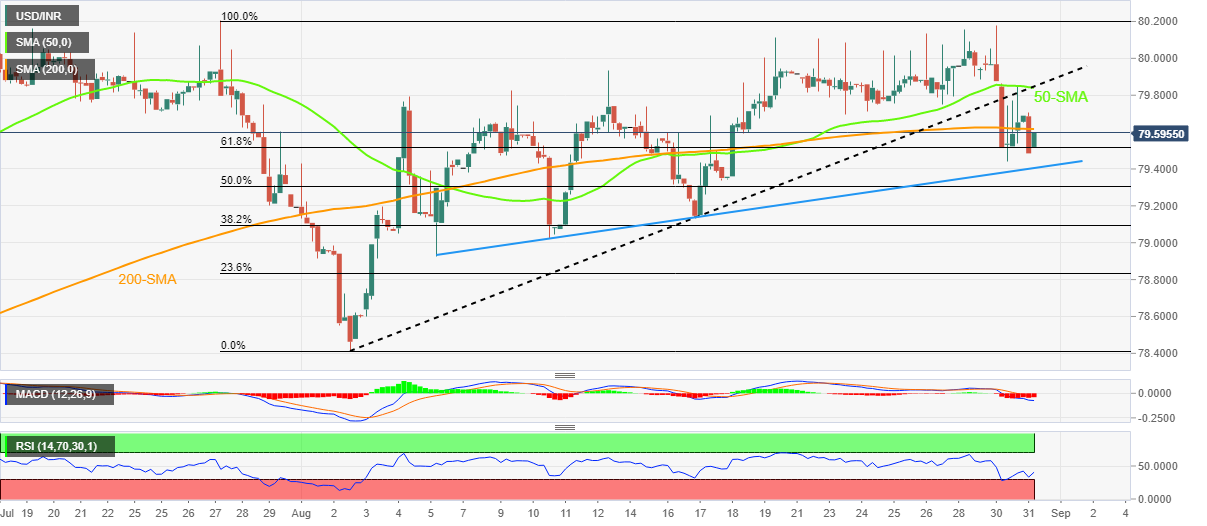
Trend: Limited downside expected
-
05:30
Netherlands, The Retail Sales (YoY) increased to 3.2% in July from previous 0.7%
-
05:23
Copper price rebounds from three-week low on softer DXY, upbeat China data
- Copper price snaps three-day downtrend, picks up bids of late.
- Firmer prints of China PMI, fears of more supply outage favor intraday buyers of late.
- Fears surrounding Taiwan, coronavirus probe upside momentum.
- Hawkish Fedspeak, firmer US data also challenge metal buyers ahead of US ADP, NFP.
Copper price prints the first daily gains in four as buyers cheer softer US dollar and the firmer China activity numbers during early Wednesday morning in Europe. The red metal’s latest weakness could also be linked to the market’s cautious optimism, as well as fears of more supply outages due to the covid-led lockdowns.
That said, the US Dollar Index (DXY) fades the previous day’s corrective pullback as it drops to 108.60, down 0.20% by the press time.
The greenback gauge’s latest weakness could be considered as the preparations for today’s US ADP Employment Change for August, expected 200K versus 128K prior. Also keeping traders on their toes is Friday’s US Nonfarm Payrolls (NFP).
While portraying the metal’s moves, copper futures on COMEX rise 0.60% intraday to $3.58 by the press time. Elsewhere, three-month copper on the London Metal Exchange (LME) moved up 0.4% to $7,896 a tonne, after a decline from the previous session.
It should be noted that China’s NBS Manufacturing PMI improved to 49.4 in August versus 49.2 expected and 49.0 prior whereas the Non-Manufacturing PMI also grew to 52.6 during the stated month compared to 52.2 market forecasts and 53.8 previous readings.
On the other hand, hopes of more demand from manufacturing units and covid-led lockdowns that lead to a supply crunch may keep the copper buyers hopeful. “China's southwestern Sichuan province resumed its power supply to industrial and residential usage, and factories there have restarted their production after being ordered to shut down since August 15,” said Reuters.
It should be noted that a jump in the copper scrap transactions also appears to underpin the metal’s corrective pullback. From August 22 to August 28, the copper scrap throughput of East China Nonferrous Metals City was about 22,000 metric tonnes, a week-on-week increase of 29.15%, according to the SMM data shared by Reuters.
Looking forward, the US ADP Employment Change for August, the early signal for Friday’s US Nonfarm Payrolls (NFP), expected 200K versus 128K prior. headlines surrounding the Sino-American tussles, China’s covid conditions and global recession fears are also important for the near-term market directions.
-
05:08
Steel prices extend losses on growth concerns, revival is on cards
- Steel prices have displayed a vulnerable performance after a cautious stance by western central banks.
- China’s NBS Manufacturing PMI has improved to 49.4 vs. 49.2 as expected.
- The conclusion of the monsoon season and supportive PBOC may revive steel demand.
Steel prices have remained vulnerable this week after the hawkish stance by Western central banks at the Jackson Hole Economic Symposium trimmed growth prospects. The asset is declining like a house of cards as central banks have preferred taming inflation over declining manufacturing activities.
Delegates at the Jackson Hole highlighted the risk of soaring price pressures in the world economy. Households are facing the wrath of higher prices and also Earnings before Interest and Depreciation and Amortization (EBITDA) margins in the corporate have trimmed dramatically.
There is no denying the fact that declining liquidity from the market is also impacting the private sector but bringing price stability is the foremost priority as earnings data is still vulnerable and households are facing difficulty in offsetting the higher payouts.
Meanwhile, China’s official indicator of manufacturing PMI is indicating higher usage of steel last month. China’s NBS Manufacturing PMI has landed at 49.4, higher than the estimates of 49.2 and the prior release of 49.0. This indicates that demand for steel should have been decent in August. Also, the concluding monsoon season may accelerate demand in the world’s second-largest economy.
Monsoon season is known for halting construction activities and eventually demand for metals too. As monsoon season is concluded in major provinces of China, demand for steel is expected to heat up again. Also, supportive monetary policy by the People’s Bank of China (PBOC) will revive steel as expenditure on automobiles, infrastructure, and other construction activities will scale up again.
-
05:04
AUD/USD Price Analysis: Bounces off 61.8% golden ratio towards 0.6900
- AUD/USD picks up bids to rebound from the key Fibonacci retracement support.
- 12-day-old resistance line, 200-SMA join bearish MACD signals to challenge recovery.
- The mid-July swing high can acts as additional support during the south-run to yearly low.
AUD/USD renews intraday high around 0.6880 during early Wednesday morning in Europe. In doing so, the Aussie pair rebounds from the 61.8% Fibonacci retracement level of the July-August upside.
Given the recovery moves from an important Fibonacci ratio, as well as the broad US dollar weakness, AUD/USD is likely to stretch the latest run-up towards the 50% Fibonacci retracement level near 0.6910.
However, a downward sloping resistance line from August 15, around 0.6930 at the latest, restricts short-term advances of the pair.
Following that, the 200-SMA level surrounding 0.6950 may act as the last defense of the AUD/USD bears.
Meanwhile, pullback moves may have to successfully break the 61.8% golden ratio around 0.6850 to convince sellers.
Even so, the mid-July swing high and the 78.6% Fibonacci retracement levels, respectively near 0.6800 and 0.6880, could test the AUD/USD sellers before directing them to the yearly low marked in July near 0.6680.
To sum up, AUD/USD is likley to remain firmer but the upside room appears limited.
AUD/USD: Four-hour chart
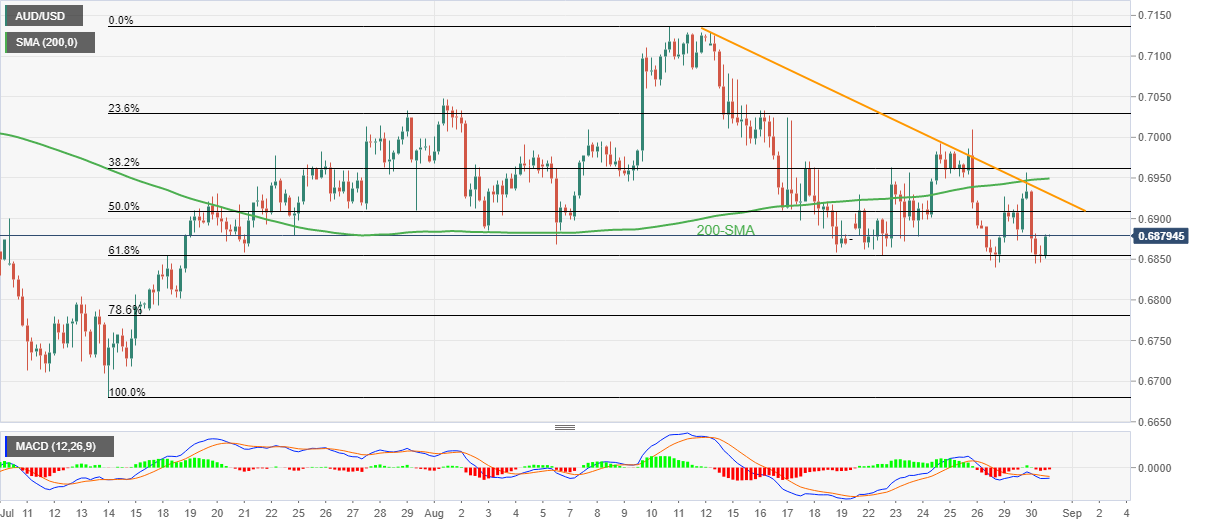
Trend: Limited upside expected
-
04:32
EUR/USD establishes above 1.0000 ahead of Eurozone inflation
- EUR/USD is firmly auctioning above the magical figure of 1.000 ahead of Eurozone HICP.
- The Eurozone HICP is seen higher at 9% vs. 8.9% reported earlier.
- Energy supply cuts from Nord Stream 1 pipeline to Germany could accelerate the energy crisis.
The EUR/USD pair has defended the immediate support of 1.0017 and is now expected to attempt a break above the critical resistance of 1.0030. The asset is broadly trading sideways in a 0.9982-1.0056 range and may deliver a decisive move after the release of the European Central Bank (ECB)’s preferred inflation tool. The eurozone Harmonized Index of Consumer Prices (HICP) is seen higher at 9%, than the prior release of 8.9%.
Soaring energy prices in the eurozone after the restricted deliveries from Russia are responsible for accelerating price pressures. Also, higher expectations for inflation rate are strengthening the odds of a bumper rate hike by the ECB in its monetary policy meeting next week.
Also Read: Eurozone Inflation Preview: Hotter HICP to cement a 75 bps ECB hike next week
Meanwhile, unscheduled maintenance of the Nord Stream 1 pipeline under the Baltic Sea from Russia has escalated the odds of an energy crisis in Germany. The German energy market is already vulnerable and more energy supplies cut for three days will worsen it further. Investors should be aware of the fact that Germany is a core member of the European Union (EU) and the energy crisis in Germany could dampen investors’ appetite for the shared currency.
Meanwhile, the US dollar index (DXY) is displaying a subdued performance on lower consensus for US Automatic Data Processing (ADP) Employment Change data. The economic data is expected to land at 200k while the US economy added 528k jobs last month. As the US economy is operating at full employment levels, room for more job additions is squeezed and the addition of decent payrolls is still satisfactory.
-
04:00
Gold Price Forecast: XAU/USD flirts with $1,717 support ahead of US employment data
- Gold price holds lower ground despite recently bouncing off intraday low.
- Fears surrounding hawkish Fed, recession and China weigh on XAU/USD.
- China PMI favored corrective pullback but firmer yields, upbeat US data keep bears hopeful.
- US ADP Employment Change, NFP will be in the spotlight for clear directions.
Gold price (XAU/USD) stays defensive after a two-day downtrend, printing mild losses of around $1,723 by the press time of early Wednesday morning in Europe. In doing so, the metal traders portray the market’s indecision amid mixed clues, as well as a cautious mood ahead of the key US employment data.
While highlighting the risk profile, S&P 500 Futures print mild gains despite Wall Street’s losses but the US 10-year Treasury yields remain intact around the highest levels in two months, close to 3.11% at the latest.
Firmer China PMI should have probed the market bears but the fears surrounding the Fed’s aggression, economic slowdown and the US-China tussles seem to exert downside pressure on the XAU/USD prices. That said, China’s NBS Manufacturing PMI improved to 49.4 in August versus 49.2 expected and 49.0 prior whereas the Non-Manufacturing PMI also grew to 52.6 during the stated month compared to 52.2 market forecasts and 53.8 previous readings.
Alternatively, Taiwan’s firing of the warning shots for 1st time at a Chinese drone, per Reuters, as well as the Wall Street Journal’s news stating that the US Army grounds entire fleet of Boeing-made Chinook helicopters highlight escalating woes. Also challenging the sentiment are the coronavirus fears as mainland China had confirmed 243,081 cases with symptoms as of August 30, per Reuters. The news also mentioned that China's capital Beijing and the financial hub of Shanghai reported one new local symptomatic case each while China's southern technology hub of Shenzhen reported 37 new locally transmitted COVID-19 infections on Tuesday, up from 35 a day earlier.
It should be noted that the firmer US data allowed the Fed policymakers to defend their aggressive bias toward the rate hike.
On Tuesday, US Consumer Confidence for August improved to 103.2 versus 95.3 in July, per the Conference Board’s (CB) latest survey details. Also, US Housing Price Index (HPI) rose by 0.1% MoM in June compared to May's increase of 1.3% and market expectation of 1.1%. Further, the S&P/Case-Shiller Home Price Indices eased to 18.6% YoY during the stated month versus 19.5% forecast and 20.5% previous readings. It should be noted that the US JOLTS Job Openings grew to 11.239M in July versus 10.475M expected and 11.04M prior (revised from 10.698M).
Following the data, Richmond Federal Reserve Bank President Thomas Barkin said, "I don't expect inflation to come down predictably." On the same line was Atlanta Fed President Raphael Bostic who said, “Slowing inflation data 'may give us reason' to slow interest rate hikes.” Recently, New York Fed President John Williams said, per the WSJ, “We are not at restrictive policy yet.” The policymaker also added, “We need to get interest rates higher than longer run a neutral level.”
Moving on, the US ADP Employment Change for August, the early signal for Friday’s US Nonfarm Payrolls (NFP), expected 200K versus 128K prior.
Technical analysis
Gold price prints a falling wedge bullish chart pattern as bears approach the lower line of the wedge, at $1,717 by the press time.
That said, the bearish MACD signals and the sustained downside break of an ascending support line, now resistance around $1,745, keep the XAU/USD bears hopeful.
However, RSI (14) is near the oversold territory and hence signals limited downside room, which in turn suggests a rebound from the $1,717 support.
Should the quote fail to bounce off $1,717 support, the 78.6% Fibonacci retracement level of July-August upside, near $1,707, will precede the $1,700 threshold to restrict short-term XAU/USD downside.
Alternatively, the support-turned-resistance around $1,745 precedes the upper line of the stated wedge, close to $1,750 at the latest, to restrict the short-term downside of gold price.
Following that, the 200-EMA level near $1,760 appears the last defense of bears before challenging the monthly high near $1,808.
Gold: Four-hour chart

Trend: Limited downside expected
-
03:32
USD/JPY Price Analysis: Justifies Tuesday's bearish Doji around mid 138.00s
- USD/JPY snaps three-day uptrend while reversing from 1.5-month high.
- RSI retreat, bearish candlestick formation favor short-term sellers.
- Convergence of 10-DMA, three-week-old support line challenges further downside.
- Bulls need sustained trading beyond 139.00 to bolster the moves.
USD/JPY takes offers to refresh intraday low near 138.50 as it extends the previous day’s pullback from the six-week high during Wednesday’s Asian session. In doing so, the yen pair prints the first daily loss in four.
The quote’s latest weakness could be linked to the pair’s Doji candlestick formation, marked the previous day, as well as the RSI (14) pullback.
With this, the intraday sellers can aim for the August 23 swing high near 137.70. However, the 10-DMA and a three-week-long support line, near 137.45-40, appear a tough nut to crack for the bears.
Should the USD/JPY prices decline below 137.40, the early month high near 135.60-55 will be in focus.
Alternatively, recovery moves could aim for the horizontal line surrounding 139.00 that comprises multiple tops marked since mid-July.
Following that, the 140.00 threshold may act as an additional upside filter before portraying the USD/JPY rally.
Overall, USD/JPY is likely to witness further downside but the bears are far from retaking the control.
USD/JPY: Daily chart
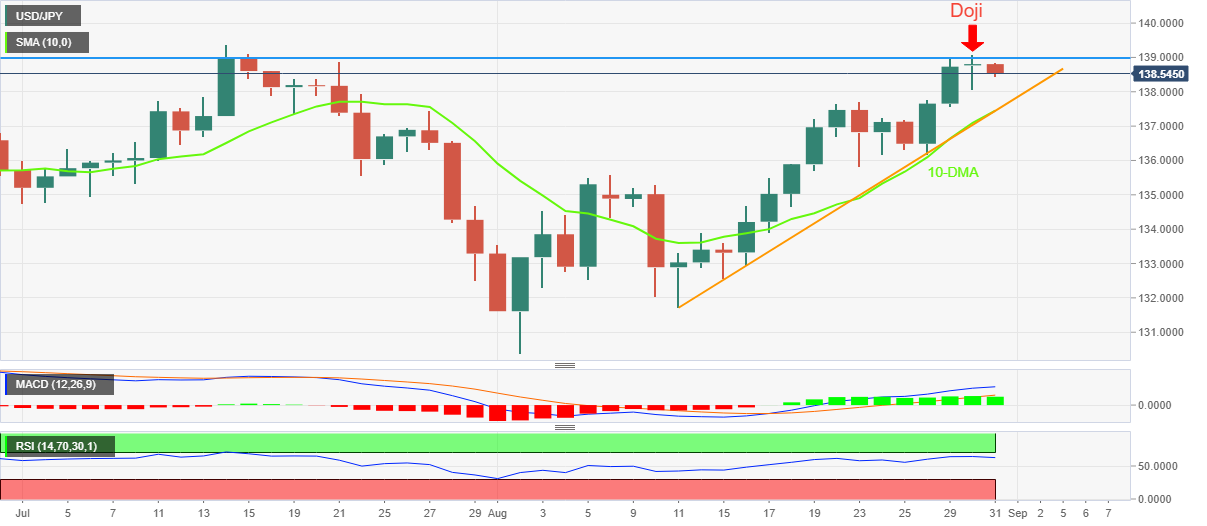
Trend: Limited downside expected
-
03:30
Commodities. Daily history for Tuesday, August 30, 2022
Raw materials Closed Change, % Silver 18.434 -1.85 Gold 1724.43 -0.78 Palladium 2085.42 -2.8 -
03:28
Australian sovereign fund lashes central banks over inflation - Reuters
Citing Peter Costello, the chair of the Future Fund, which covers pension liabilities for Australian public servants, Reuters reports, criticized the Reserve Bank of Australia (RBA) for giving "wrong" inflation guidance.
Key quotes
"It's our belief that monetary authorities both in the US and Australia were caught napping with the surge in inflation, and now the rate rises are going to have to be much more significant than if they had begun to act earlier.”
"As rates rise, over the course of this year and into next year, we would expect that equity markets will be soft.”
“Australia "came late to the tightening of (monetary) policy.”
The RBA's earlier guidance that rate increases would not be needed until 2024 was "wrong".
The money the RBA spent buying bonds to intervene on the bond market was "wasted".
“It wasn't a very good chapter for the Reserve Bank. We hold governments to account. We've got to hold central banks to account too.”
-
03:17
USD/CNH drops below 6.9200 on China PMI, recession woes, hawkish Fedspeak test bears
- USD/CNH prints the first daily negative in four but bears remain cautious.
- China’s official PMI came in firmer for August but fears surrounding covid conditions, Taiwan challenge CNH bulls.
- Firmer US data, hawkish Fedspeak underpin US dollar’s demand ahead of the key NFP data.
- US ADP Employment Change, risk catalysts may entertain traders.
USD/CNH remains pressured around the intraday low of 6.9135 after China flashed upbeat activity data for August during Wednesday’s Asian session. In doing so, the offshore Chinese yuan (CNH) pair snaps a three-day uptrend around the highest levels in two years.
That said, the headline NBS Manufacturing PMI improved to 49.4 in August versus 49.2 expected and 49.0 prior whereas the Non-Manufacturing PMI also grew to 52.6 during the stated month compared to 52.2 market forecasts and 53.8 previous readings.
Firmer data from China also joined cautious optimism in the markets to weigh on the USD/CNH prices. However, challenges emanating from China’s covid conditions and the Sino-American tussles over Taiwan and the hawkish Fed seem to keep the pair buyers hopeful.
Taiwan’s firing of the warning shots for 1st time at a Chinese drone, per Reuters, as well as the Wall Street Journal’s news stating that the US Army grounds entire fleet of Boeing-made Chinook helicopters highlight escalating woes. Also challenging the sentiment are the coronavirus fears as mainland China had confirmed 243,081 cases with symptoms as of August 30, per Reuters. The news also mentioned that China's capital Beijing and the financial hub of Shanghai reported one new local symptomatic case each while China's southern technology hub of Shenzhen reported 37 new locally transmitted COVID-19 infections on Tuesday, up from 35 a day earlier.
On the other hand, firmer US data allowed the Fed policymakers to defend their aggressive bias toward the rate hike.
On Tuesday, US Consumer Confidence for August improved to 103.2 versus 95.3 in July, per the Conference Board’s (CB) latest survey details. Also, US Housing Price Index (HPI) rose by 0.1% MoM in June compared to May's increase of 1.3% and market expectation of 1.1%. Further, the S&P/Case-Shiller Home Price Indices eased to 18.6% YoY during the stated month versus 19.5% forecast and 20.5% previous readings. It should be noted that the US JOLTS Job Openings grew to 11.239M in July versus 10.475M expected and 11.04M prior (revised from 10.698M).
Following the data, Richmond Federal Reserve Bank President Thomas Barkin said, "I don't expect inflation to come down predictably." On the same line was Atlanta Fed President Raphael Bostic who said, “Slowing inflation data 'may give us reason' to slow interest rate hikes.” Recently, New York Fed President John Williams said, per the WSJ, “We are not at restrictive policy yet.” The policymaker also added, “We need to get interest rates higher than longer run a neutral level.”
While the S&P 500 Futures and the US 10-year Treasury yields portray mildly positive sentiment and favor USD/CNH bears, the pair’s further weakness hinges on the US ADP Employment Change for August, the early signal for Friday’s US Nonfarm Payrolls (NFP), expected 200K versus 128K prior.
Technical analysis
USD/CNH pullback remains elusive until breaking a three-week-old support line, near 6.8830 by the press time.
-
02:53
NZD/USD: Mildly bid around 0.6150 on upbeat China PMI, mixed NZ data ahead of US ADP, NFP
- NZD/USD stays defensive around 1.5-month low, pares recent losses.
- China flashed upbeat prints of NBS Manufacturing PMI, Non-Manufacturing PMI for August, New Zealand’s ANZ sentiment numbers also improved.
- Market sentiment dwindles amid recession fears, hawkish Fed bets.
- US ADP Employment Change can direct intraday moves, NFP is the key.
NZD/USD prints mild gains as it takes rounds to 0.6135-30 after China’s upbeat PMIs for August, published during Wednesday’s Asian session. Also, firmer data from New Zealand’s (NZ) Australia and New Zealand Banking Group (ANZ) and cautious optimism in the market failed to impress buyers amid risks emanating from China, as well as from the US.
China’s headline NBS Manufacturing PMI rose to 49.4 in August versus 49.2 expected and 49.0 prior whereas the Non-Manufacturing PMI also grew to 52.6 during the stated month compared to 52.2 market forecasts and 53.8 previous readings.
At home, ANZ Activity Outlook improved to -4.0% versus -8.9% market forecasts and -8.7% prior whereas ANZ Business Confidence also rose to -47.8 from -55.0 expected and -56.7 prior.
Risk appetite remains sluggish, despite mildly positive S&P 500 Futures and the US 10-year Treasury yields. The reason could be linked to Taiwan’s firing of the warning shots for 1st time at a Chinese drone, per Reuters, as well as the Wall Street Journal’s news stating that the US Army grounds entire fleet of Boeing-made Chinook helicopters. Also challenging the sentiment are the coronavirus fears as mainland China had confirmed 243,081 cases with symptoms as of August 30, per Reuters. The news also mentioned that China's capital Beijing and the financial hub of Shanghai reported one new local symptomatic case each while China's southern technology hub of Shenzhen reported 37 new locally transmitted COVID-19 infections on Tuesday, up from 35 a day earlier.
Above all, the recently cautious Reserve Bank of New Zealand (RBNZ) and the hawkish comments from the Fed policymakers exert downside pressure on the NZD/USD prices. That said, Richmond Federal Reserve Bank President Thomas Barkin said, "I don't expect inflation to come down predictably." On the same line was Atlanta Fed President Raphael Bostic who said, “Slowing inflation data 'may give us reason' to slow interest rate hikes.” Recently, New York Fed President John Williams said, per the WSJ, “We are not at restrictive policy yet.” The policymaker also added, “We need to get interest rates higher than longer run a neutral level.”
Moving on, the US ADP Employment Change for August, the early signal for Friday’s US Nonfarm Payrolls (NFP), expected 200K versus 128K prior, will also be important to watch for fresh impulse.
Technical analysis
The NZD/USD pair’s pullback from the 10-DMA level surrounding 0.6185, as well as the bearish MACD signal, keep bears hopeful of revisiting the 0.6110-6100 support region comprising multiple lows marked since early July.
-
02:44
AUD/USD rebounds firmly to near 0.6860 on upbeat China PMIs, RBA in focus
- AUD/USD has defended the critical support of 0.6860 on better China’s PMI data.
- The show-stopper event for the UD/USD pair will be the RBA policy.
- A third consecutive 50 bps rate hike is expected from the RBA.
The AUD/USD pair has picked significant bids around 0.6860 after the release of upbeat China data. The NBS Manufacturing PMI has landed at 49.4, higher than the forecasts of 49.2 and the prior release of 49. However, the Non-Manufacturing data has released lower at 52.6 vs. the prior release of 53.8 but remained higher than the consensus of 52.2. The economic data is considered a leading indicator to gauge the extent of economic activities in China.
Broadly, investors’ focus will remain on the interest rate decision by the Reserve Bank of Australia (RBA), which is due next week. Scrutiny of ongoing price pressures in the Australian economy indicates that RBA Governor Philip Lowe will announce the third consecutive 50 basis points (bps) interest rate hike.
An occurrence of the same will escalate the Official Cash Rate (OCR) to 2.35%. As the Australian Consumer Price Index (CPI) was recorded at 6.1% for the second quarter, more restrictive measures are highly likely.
Meanwhile, the US dollar index (DXY) has bounced back firmly after picking bids around its immediate support of 108.70 in the early Tokyo session. The DXY is expected to recapture Tuesday’s high at 109.11 as risk sentiment is not lucrative for the risk-perceived assets.
This week, the US Nonfarm Payrolls (NFP) event will hog the limelight. As the US economy is operating at full-employment levels, a satisfactory addition is expected in the US labor market by 300k. Also, the Unemployment Rate is seen as stable at 3.5%.
-
02:40
BOJ’s Nakagawa: Will decide fate of remaining pandemic-relief programme at Sept meeting
Bank of Japan (BOJ) monetary policy board member Junko Nakagawa said on Wednesday that “the BOJ will decide the fate of the remaining pandemic-relief programme at its September meeting, with an eye on the impact of the pandemic on financial conditions.”
Additional quotes
BOJ’s policy response has had the desired results.
Japan's consumer inflation has surpassed 2%, but simply reaching 2% will not suffice.
What BOJ is aiming at is positive cycle in which wages, inflation rise sustainably driven by increase in corporate profits, improvements in labour market.
BOJ must continue monetary easing to achieve inflation target in sustained, stable manner backed by positive economic cycle.
Japan's economy, mainly consumption, continuing to pick up as pandemic impact subsides.
Japan's output, exports showing weaknesses due to parts shortages, global supply constraints.
Sales prices in Japan not rising as quickly as raw material costs.
Market reaction
USD/JPY is off the lows, trading 0.14% lower on the day at 138.60, as of writing. Upbeat Japanese Industrial Production and Retail Sales data helped put a bid under the yen, sending the pair lower.
-
02:35
AUD/JPY: Defensive near 95.00 despite firmer China PMI as yields, Japan data tease bears
- AUD/JPY holds lower ground after reversing from 12-week high.
- China’s NBS Manufacturing PMI, Non-Manufacturing PMI both crossed market forecasts in August.
- Japan’s Industrial Production, Retail Sales flashed upbeat results for July, yields keep pullback from two-month top.
- Risk catalysts will be more important for fresh impulse.
AUD/JPY struggles to justify upbeat China activity data while defending the 95.00 threshold, despite recently picking up bids to 95.10 during Wednesday’s Asian session. The reason could be linked to the market’s cautious mood and firmer statistics from Japan, as well as downbeat yields.
China’s headline NBS Manufacturing PMI rose to 49.4 in August versus 49.2 expected and 49.0 prior whereas the Non-Manufacturing PMI also grew to 52.6 during the stated month compared to 52.2 market forecasts and 53.8 previous readings.
At home, Australia's second quarter (Q2) Construction Work Done dropped to -3.8% versus 0.9% market forecasts and -0.9% prior. Further, Aussie Private Sector Credit eased in July to 0.7% MoM from 0.9% prior while staying intact at 9.1% YoY.
On the other hand, Japan’s Industrial Production for July improved to -1.8% YoY versus -2.6% expected and -2.8% prior. On the same line were the Retail Trade numbers for the said period, up 2.4% YoY compared to 1.95 market forecasts and 1.5% prior.
Elsewhere, the US 10-year Treasury yields rose to the highest levels in two months before the latest pullback to 3.10%. The retreat in the bond yields could be linked to the market’s cautious mood ahead of this week’s key data, namely Eurozone inflation and the US Nonfarm Payrolls (NFP).
It’s worth noting that the AUD/JPY pair is often considered the risk barometer and hence the market’s indecision also exerts downside pressure on the quote. While portraying the mood, the Asia-Pacific equities trade mixed and the S&P 500 Futures print mild gains after Wall Street closed in the red.
While talking about challenges to risk, Taiwan’s firing of the warning shots for 1st time at a Chinese drone, per Reuters, joined the Wall Street Journal’s news stating that the US Army grounds entire fleet of Boeing-made Chinook helicopters to weigh on the market sentiment. Also challenging the risk appetite, as well as the AUD/JPY prices are the coronavirus fears as mainland China had confirmed 243,081 cases with symptoms as of August 30, per Reuters. The news also mentioned that China's capital Beijing and the financial hub of Shanghai reported one new local symptomatic case each while China's southern technology hub of Shenzhen reported 37 new locally transmitted COVID-19 infections on Tuesday, up from 35 a day earlier.
Above all, growing fears of recession and the recent softness in the Reserve Bank of Australia’s (RBA) tone seem to weigh on the AUD/JPY prices. However, the monetary policy divergence between the RBA and the Bank of Japan (BOJ) could keep buyers hopeful.
That said, headlines surrounding the Sino-American tussles, China’s covid conditions and global recession fears could entertain AUD/JPY traders.
Technical analysis
Failure to cross the 95.70-75 hurdle, comprising the tops marked during April and July, keeps AUD/JPY bears hopeful of revisiting an upward sloping support line from August 03, close to 94.70 by the press time.
-
02:35
China data beats expectations fuelling a bid in AUD
The Chinese Manufacturing Purchasing Managers Index (PMI) and the official non-manufacturing PMI, released by China Federation of Logistics and Purchasing (CFLP) have been released as follows, bringing the August official composite PMI at 51.7 to, bullish for AUD crosses:
- China August official manufacturing PMI at 49.4 (Reuters poll 49.2) vs 49.0 in July.
- China August official services PMI falls to 52.6 vs 53.8 in July.
AUD/USD has popped to highs of 0.6866 on the data.

(10min chart)

(Houlry chart)
The data has given the Aussie a boost which is now extending the bullish impulse and moving away from the W-formation;'s neckline as illustrated on the hourly chart above. The resistance in the 0.6870s/80s is eyed for the sessions ahead.
Why it matters to traders?
The monthly manufacturing PMI is released by China Federation of Logistics and Purchasing (CFLP) on the last day of every month. The official PMI is released before the Caixin Manufacturing PMI, which makes it even more of a leading indicator, highlighting the health of the manufacturing sector, considered as the backbone of the Chinese economy. The data is of high relevance for the financial markets throughout several asset classes, given China’s influence on the global economy.
-
02:35
EUR/GBP displays volatility contraction around 0.8600 ahead of Eurozone Inflation
- EUR/GBP is hovering below 0.8600 as investors await Eurozone HICP.
- Eurozone may follow the footprints of Germany and will release its HICP higher at 9%.
- Germany is facing an energy crisis amid temporary supply cuts from Nord Stream 1 pipeline.
The EUR/GBP pair is juggling below 0.8600 as investors have shifted to the sidelines ahead of the eurozone inflation. The cross has turned sideways after delivering a sheer upside from the past week and is expected to continue its lackluster performance.
As per the preliminary estimates, the eurozone Harmonized Index of Consumer Prices (HICP) is seen higher by 10 basis points (bps) at 9%. The Eurozone could be the third western leader, which will enter into the 9% inflation category after the UK and the US. As price pressures in the shared currency region are not displaying signs of exhaustion, the European Central Bank (ECB) will tighten its policy measures and may announce a bumper rate hike.
Hawkish commentary from ECB policymaker Klass Knot underpinned the shared currency bulls. ECB policymaker sees a rate hike announcement by 75 basis points (bps). The price rise index is advancing firmly and the deployment of tightening measures is highly required despite soaring recession fears.
Also, the release of the German inflation on Tuesday has strengthened the odds of a higher inflation rate in eurozone. Meanwhile, the German economy is facing an energy crisis as Nord Stream 1 pipeline under the Baltic Sea is under unscheduled maintenance for the last two days. It is worth noting that Germany is a core member of the European Union and more pain for the German economy could weaken the eurozone bulls.
On the UK front, soaring electricity and energy prices are creating havoc for the Bank of England policymakers. The UK economy is tackling multiple headwinds such as political instability after UK PM Boris Johnson's resignation, the energy supply crisis, and higher projections for the inflation rate.
-
02:31
Australia Private Sector Credit (YoY) remains at 9.1% in July
-
02:30
China NBS Manufacturing PMI came in at 49.4, above expectations (49.2) in August
-
02:30
Australia Private Sector Credit (MoM) declined to 0.7% in July from previous 0.9%
-
02:30
China Non-Manufacturing PMI above expectations (52.2) in August: Actual (52.6)
-
02:30
Australia Construction Work Done came in at -3.8% below forecasts (0.9%) in 2Q
-
02:22
USD/CHF Price Analysis: Retreats from monthly top towards 0.9700 on overbought RSI
- USD/CHF takes offers to renew intraday low, snaps three-day uptrend.
- Three-week-old bullish channel keeps buyers hopeful near 1.5-month high.
- 200-SMA adds to the downside filters, 0.9800 guards immediate recovery.
USD/CHF snaps a three-day uptrend as it refreshes daily lows near 0.9730 during Wednesday’s Asian session. In doing so, the Swiss currency (CHF) pair justifies the RSI (14) retreat from the overbought territory.
However, an ascending trend channel formation since August 11 joins bullish MACD signals to keep the pair buyers hopeful.
That said, a pullback towards the 61.8% Fibonacci retracement level of July-August downside, at 0.9690, appears to immediate support for the quote.
Though, a confluence of the stated channel’s support line and the 50% Fibonacci retracement, close to 0.9630, seems a tough nut to crack for the USD/CHF bears afterward.
Even if the quote breaks the 0.9630 support confluence, the 200-SMA level surrounding 0.9590 could challenge the sellers before giving them control.
On the contrary, the USD/CHF pair’s further upside could aim for the channel’s top, close to the 0.9800 threshold by the press time.
Should the pair buyers manage to cross the 0.9800 hurdle, the odds of witnessing a run-up towards the previous monthly peak near 0.9885 can’t be ruled out.
USD/CHF: Four-hour chart
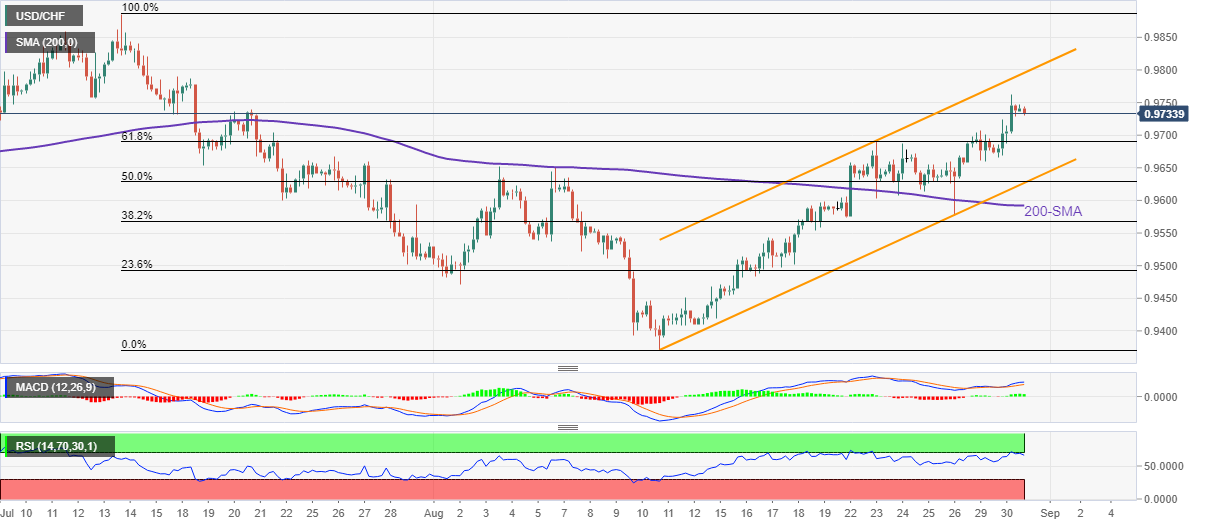
Trend: Pullback expected
-
02:19
USD/CNY fix: 6.8906 vs. the previous fix of 6.8802
In recent trade today, the People’s Bank of China (PBOC) set the yuan (CNY) at 6.8906 vs. the previous fix of 6.8802 and the prior close of 6.9101.
About the fix
China maintains strict control of the yuan’s rate on the mainland.
The onshore yuan (CNY) differs from the offshore one (CNH) in trading restrictions, this last one is not as tightly controlled.
Each morning, the People’s Bank of China (PBOC) sets a so-called daily midpoint fix, based on the yuan’s previous day's closing level and quotations taken from the inter-bank dealer.
-
02:17
USD/CAD Price Analysis: Bears on the prowl at key resistance
- USD/CAD bears could start to emerge from a strong level of hourly resistance.
- The bearish formations are compelling for a significant move to the downside.
USD/CAD is decelerating on the bid which leaves the emphasis on the bearish Gartley pattern. Should the bears commit, the first area of support will be pressured to open up the prospects of a significant downside correction as the following illustrates.
USD/CAD daily chart
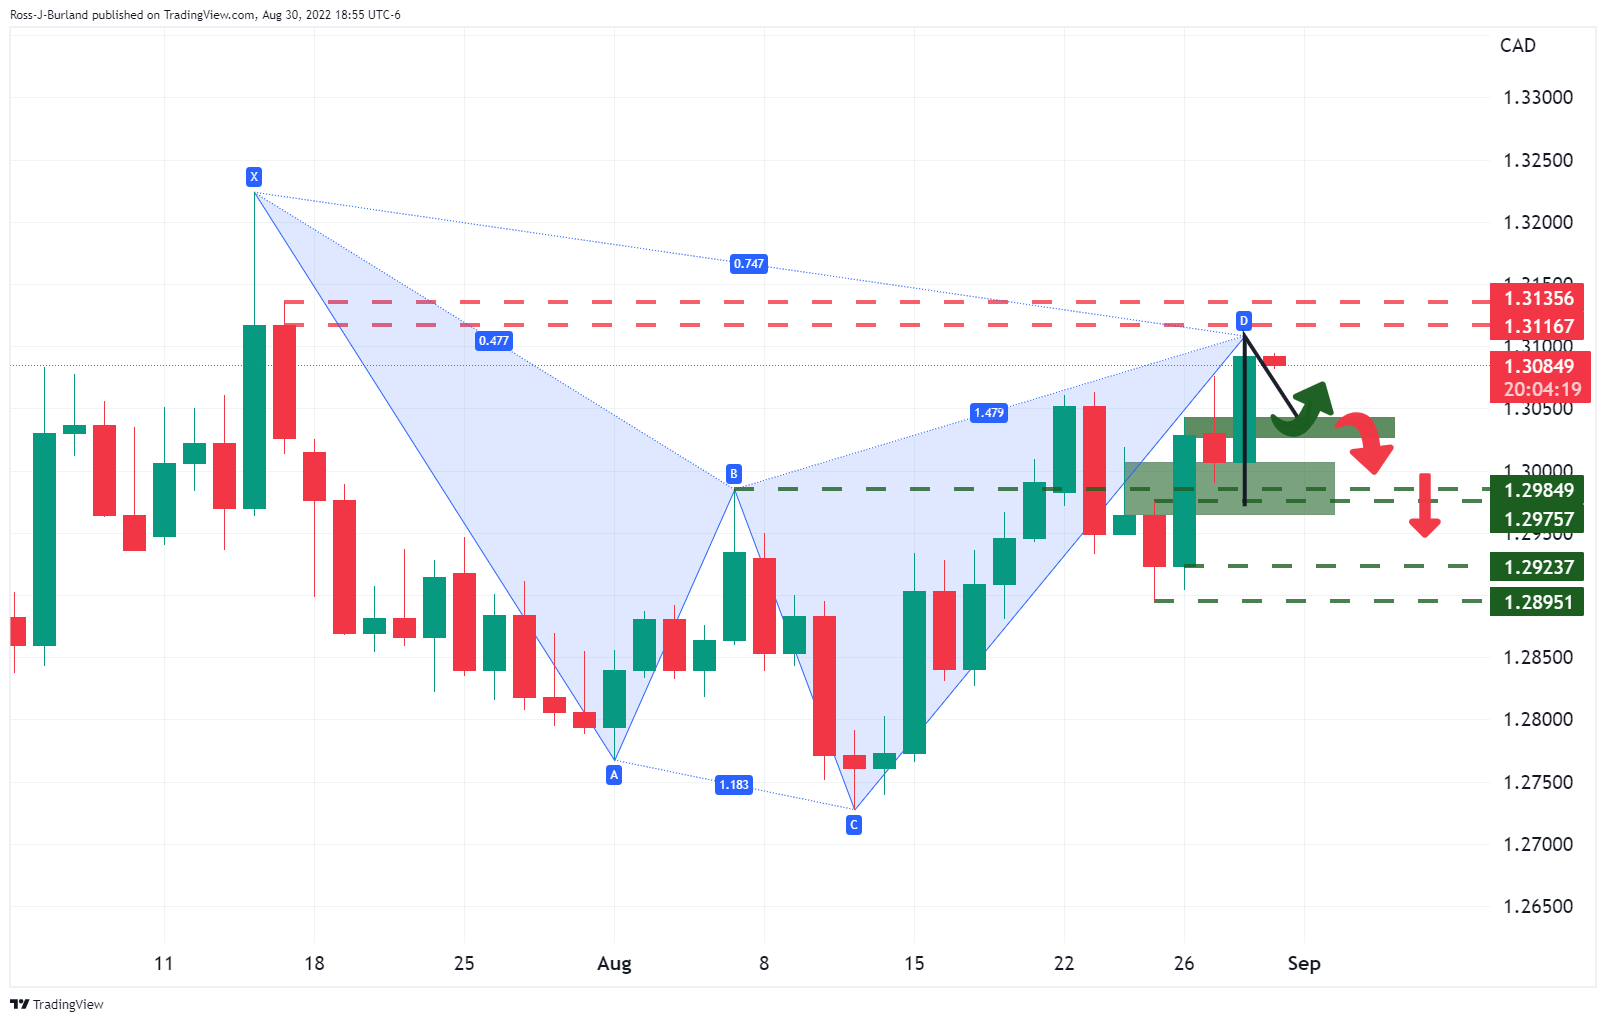
The first area of defence is located at 1.3050. Thereafter, 1.2980 and 1.2920 before 1.2800 as the psychological round number.
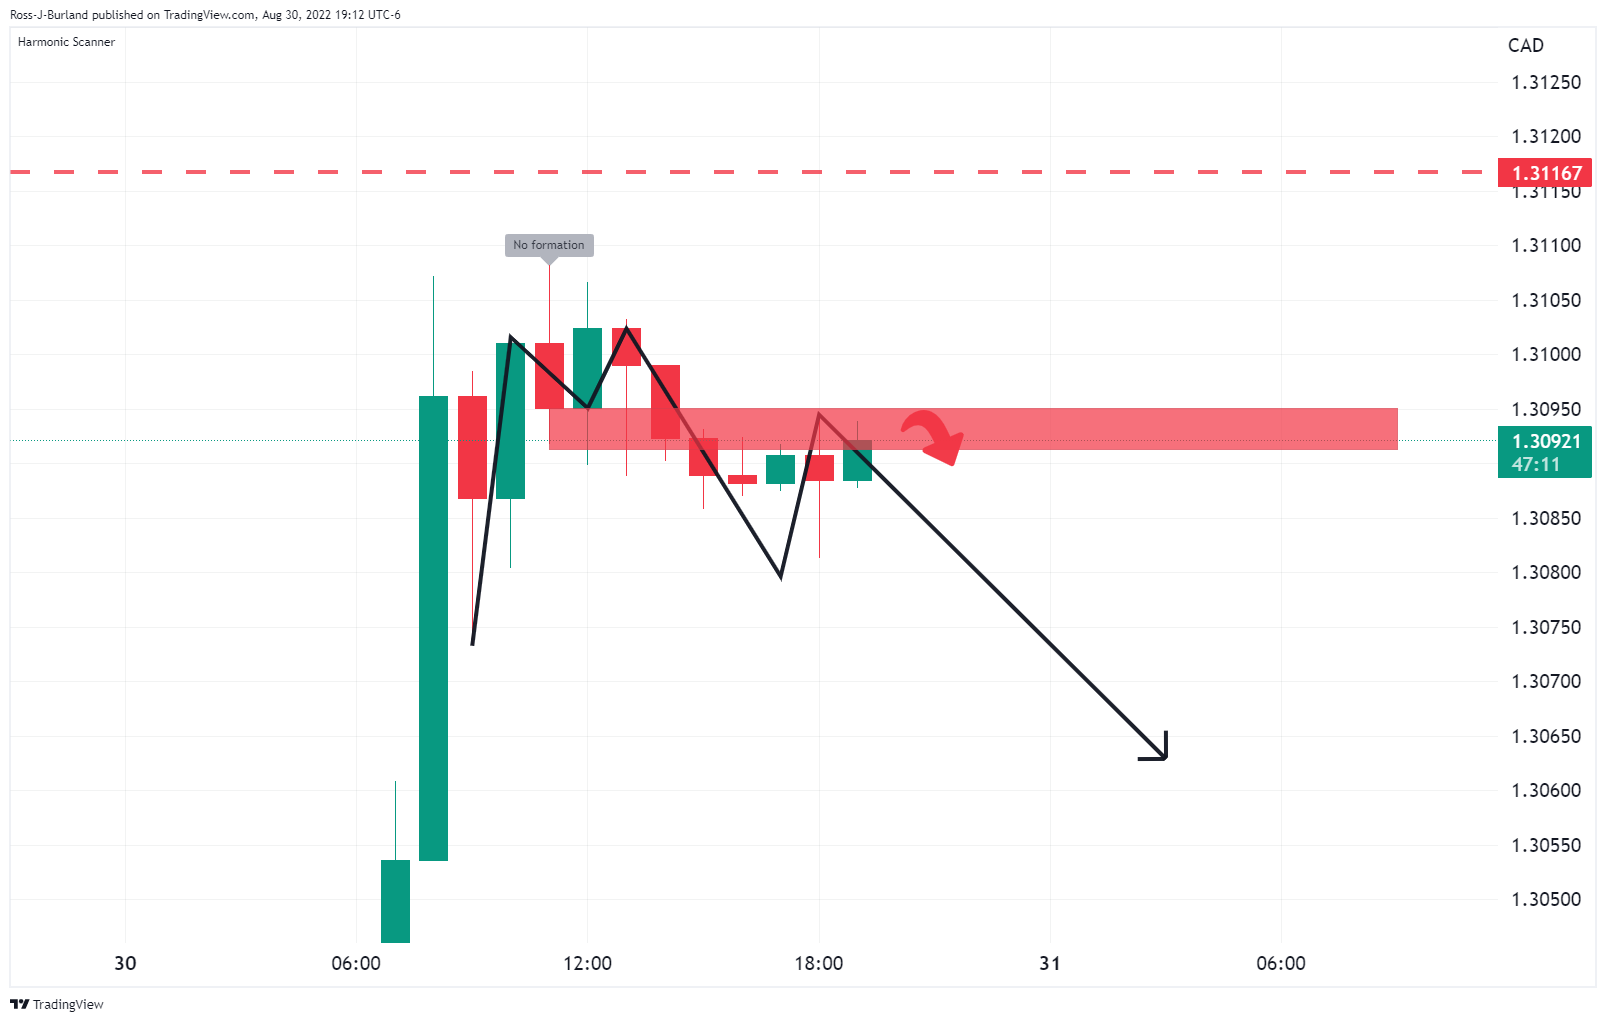
The hourly M-formation could offer resistance at the neckline to spark the downside for the sessions ahead.
-
02:00
New Zealand ANZ Business Confidence came in at -47.8, above expectations (-55) in August
-
02:00
New Zealand ANZ Activity Outlook above expectations (-8.9%) in August: Actual (-4%)
-
01:48
EUR/JPY slides beneath 139.00 on softer yields, upbeat Japan data ahead of EU inflation
- EUR/JPY takes offers to refresh intraday low while extending pullback from monthly top.
- Yields remain pressured after retreating from two-month high the previous day.
- Japan’s Industrial Production, Retail Sales came in firmer for July.
- Preliminary readings of Eurozone CPI will be important for immediate directions, risk catalysts are crucial too.
EUR/JPY snaps a three-day uptrend at the monthly top surrounding 139.00 as yields dropped and Japan’s statistics flashed upbeat data on Wednesday’s Asian session. The cross-currency pair’s retreat, however, remains doubtful ahead of the Eurozone Consumer Price Index (CPI) and the Harmonised Index of Consumer Prices (HICP) for the bloc.
Japan’s Industrial Production for July improved to -1.8% YoY versus -2.6% expected and -2.8% prior. On the same line were the Retail Trade numbers for the said period, up 2.4% YoY compared to 1.95 market forecasts and 1.5% prior.
Elsewhere, the US 10-year Treasury yields rose to the highest levels in two months before the latest pullback to 3.10%. The retreat in the bond yields could be linked to the market’s cautious mood ahead of this week’s key data, namely Eurozone inflation and the US Nonfarm Payrolls (NFP).
It should be noted that the yen’s safe-haven status also appears to weigh on the EUR/JPY prices, especially amid the recession woes and the hawkish central bank comments.
However, the monetary policy divergence between the European Central Bank (ECB) and the Bank of Japan (BOJ) could keep EUR/JPY bulls hopeful.
On Tuesday, Germany’s Consumer Price Index (CPI) rose to 7.9% YoY in August from 7.5% in July, compared to the market expectation of 7.8%. Further, the Harmonised Index of Consumer Prices (HICP) for the nation, the ECB’s preferred gauge of inflation, rose to 8.8% from 8.5% as expected. Following the data, Reuters mentioned that near 50-Year high German inflation strengthens the case for a larger ECB rate rise.
That said, policymaker Klaas Knot said on Tuesday that he was leaning toward a 75 basis points rate hike in September and also added that he was open to discussion. On the same line, ECB Chief Economist Philip Lane said on Tuesday, “We need to keep raising interest rates.” Further, ECB Governing Council member Madis Muller told Reuters on Tuesday that he thinks 75 basis points should be among the options for September given that the inflation outlook has not improved. Additionally, ECB member Joachim Nagel also said, “We shouldn’t delay the next interest-rate steps for fear of a potential recession”.
Looking forward, the flash/preliminary readings of the Eurozone HICP for August, expected at 9.0% versus 8.9% prior, will be crucial for the EUR/JPY pair buyers amid talks of higher rates and recession.
Technical analysis
A daily closing beyond a two-month-old resistance line, around 139.10 by the press time, becomes necessary for the EUR/JPY bulls to keep control. Otherwise, a pullback towards an early-month swing high near 138.40 appears imminent.
-
01:42
US Dollar Index hovers around critical support of 108.70, US NFP eyed
- The DXY is auctioning around the immediate support of 108.70 ahead of US NFP data.
- Fed policymaker has maintained a hawkish stance on interest rates.
- The US NFP is expected to land at 300k vs. 528k reported for July.
The US dollar index (DXY) is displaying topsy-turvy moves at open and is hovering around the immediate cushion of 108.70 in the early Tokyo session. The asset is oscillating in a tad wider range of 108.66-108.87 on a broader note. Investors should be aware of the fact that the asset has turned sideways after a downside move from 109.11, therefore, investors should brace for a volatile session ahead.
Fed Williams sees interest rates above 3.5%
Inflationary pressures have remained major headwinds for the Federal Reserve (Fed) and households in the US economy this year. Well, the Fed has already accelerated its interest rates to 2.25-2.50% this year to combat price pressures. The price rise index has not displayed a meaningful response yet and demands more restrictive measures. New York Fed Bank President John Williams sees interest rates a little above 3.5% to scale down the inflation rate to near 2.5-3% by next year.
Upbeat Consumer Confidence supports DXY
The DXY displayed a stellar performance on Tuesday after the US Conference Board released the Consumer Confidence at 103.2, significantly higher than the prior release of 95.3, recorded in July. An improvement in the confidence of consumers warrants more retail demand further, which will underpin the DXY ahead.
US NFP hogs limelight
As per the preliminary estimates, the US Nonfarm Payrolls (NFP) is seen at 300k, lower than the prior release of 528k. Also, the Unemployment Rate is expected to remain stable at 3.5%. The economic data which could impact the greenback is the Average Hourly Earnings, which is likely to shift higher by 10 basis points (bps) at 5.3%. As price pressures are advancing dramatically, earnings have remained subdued.
Key data this week: ADP Employment Change, Initial Jobless Claims, ISM PMI, Nonfarm Payrolls (NFP), Unemployment Rate, and Average Hourly Earnings.
-
01:33
GBP/USD licks wounds below 1.1700 as UK shop price inflation jumps, focus on US ADP, NFP
- GBP/USD picks up bids to print a corrective pullback from 29-month low.
- UK’s BRC shop price inflation increased in July, business confidence hit.
- Political jitters, recession woes weigh on the prices amid broad US dollar strength on hawkish Fed bets.
- US ADP Employment Change can entertain traders ahead of Friday’s US NFP.
GBP/USD renews intraday high near 1.1670 as it consolidates the weekly losses around the lowest levels since March 2020 during Wednesday’s Asian session. In doing so, the cable pair takes clues from the recently firmer UK data, as well as a pullback in the US dollar ahead of the ADP Employment Change release.
That said, Reuters quoted the British Retail Consortium (BRC) data while stating that shops and supermarkets in Britain increased prices by 5.1% in the 12 months to August, the largest rise in records dating back to 2005, reflecting a jump in food costs caused by the war in Ukraine.
Additionally, UK PM Boris Johnson’s readiness for signing off on the £30 billion Sizewell C nuclear power station, per the UK Times, also seemed to have favored the GBP/USD pair’s latest rebound.
However, Lloyds Bank released the latest survey results while saying, “Confidence among British businesses has sunk to its lowest since March 2021 as companies worry about fast-rising inflation.” The details also mentioned that the pay pressures stabilized after a recent rise.
It should be noted that the Financial Times (FT) quoted Rishi Sunak, Tory leadership contender, as he warned that it would be “complacent and irresponsible” to ignore the risk of markets losing the faith in the UK economy.
On the other hand, firmer US data allowed the Fed policymakers to sound hawkish and renew the US dollar buying before the latest retreat. the US Consumer Confidence for August improved to 103.2 versus 95.3 in July, per the Conference Board’s (CB) latest survey details. Also, US Housing Price Index (HPI) rose by 0.1% MoM in June compared to May's increase of 1.3% and market expectation of 1.1%. Further, the S&P/Case-Shiller Home Price Indices eased to 18.6% YoY during the stated month versus 19.5% forecast and 20.5% previous readings. It should be noted that the US JOLTS Job Openings grew to 11.239M in July versus 10.475M expected and 11.04M prior (revised from 10.698M).
Following the data, Richmond Federal Reserve Bank President Thomas Barkin said, "I don't expect inflation to come down predictably." On the same line was Atlanta Fed President Raphael Bostic who said, “Slowing inflation data 'may give us reason' to slow interest rate hikes.” Recently, New York Fed President John Williams said, per the WSJ, “We are not at restrictive policy yet.” The policymaker also added, “We need to get interest rates higher than longer run a neutral level.”
Amid these plays, the US 10-year Treasury yields rose to the highest levels in two months and Wall Street closed in the red. However, the S&P 500 Futures print mild gains by the press time.
Given the corrective pullback in the market, GBP/USD may extend its recovery but the risk catalysts the US ADP Employment Change for August, the early signal for Friday’s US Nonfarm Payrolls (NFP), expected 200K versus 128K prior, will be important to watch for fresh impulse.
Technical analysis
A clear U-turn from July’s low of 1.1760 keeps GBP/USD bears hopeful of refreshing the multi-month low.
-
01:30
Stocks. Daily history for Tuesday, August 30, 2022
Index Change, points Closed Change, % NIKKEI 225 316.62 28195.58 1.14 Hang Seng -74.19 19949.03 -0.37 KOSPI 24.04 2450.93 0.99 ASX 200 32.8 6998.3 0.47 FTSE 100 -65.67 7361.63 -0.88 DAX 68.15 12961.14 0.53 CAC 40 -12.06 6210.22 -0.19 Dow Jones -308.12 31790.87 -0.96 S&P 500 -44.45 3986.16 -1.1 NASDAQ Composite -134.53 11883.14 -1.12 -
01:28
Gold Price Forecast: XAU/USD bulls are dwindling as price continues to bleedout
- Gold is pressured and the bears are focused on $1,710 for the sessions ahead.
- Analysts are anticipating a capitulation event in gold driven by the unwind of a bloated position.
The gold price has held near the lows of the prior sessions, pressured by the strength of the US dollar and higher US yields as investors get positioned for a period of high-interest rates. At the time of writing, XAU/USD is trading at $1,723.51.
Spot gold hit a one-month low of $1,719.56 on Monday and has struggled to recover given the force of the rejection from a key technical area on the daily charts.
The prospects of higher interest rates and a jump in yields took the US dollar to a fresh two-decade peak at 109.478 on Monday after Powell stated that the central bank would raise rates as high as needed to restrict growth, and would keep them there "for some time" to bring down inflation that is running at more than three times the Fed's 2% goal.
A capitulation on the gold price took effect on the back of his comments, chipping its way through the August lows and the week ahead could offer further catalysts from key economic data and Fed speakers. To start, embedding the hawkish sentiment, on Monday, in response to the market's reaction to last week's Jackson Hole, Minneapolis Federal Reserve Bank President Neel Kashkari crossed the wires emphasizing a seriousness about getting inflation back to 2%.
We heard from Fed speakers on Tuesday. New York Fed President John Williams told Wall the Wall Street Journal that inflation expectations in the US were well anchored but added that it would take a few years to bring inflation back to 2%. Richmond Federal Reserve Bank President Thomas Barkin said on Tuesday that the United States is facing "post-war-like" inflation.
Most traders now expect a 75-basis-point hike in September which is bolstering the greenback. A stronger dollar makes bullion expensive for overseas buyers. With central bankers making it clear they will do everything to tame inflation, interest rates are likely to rise sharply in coming months and Chair Powell's speech at Jackson Hole has catalyzed a re-pricing in risk assets associated with market expectations for a rate-cut cycle to immediately follow the hiking cycle. ''In this context, we are anticipating a capitulation event in gold driven by the unwind of a bloated position held by a few prop-shops and family offices, which should also sap investment demand for industrial metals,'' analysts at TD Securities argued.
Gold technical analysis
Meanwhile, the price closed heavily in the red at the end of the week and there has been a follow-through towards $1,720 on the way to $1,710 support. The price has also recovered 50% of the prior bearish impulse which adds further weight to the downside outlook. If the bears commit to the course, a move below the said support area opens the risk of a test of the 2021 lows as far down as $1,678. On the flip side, $1,745 should be key.
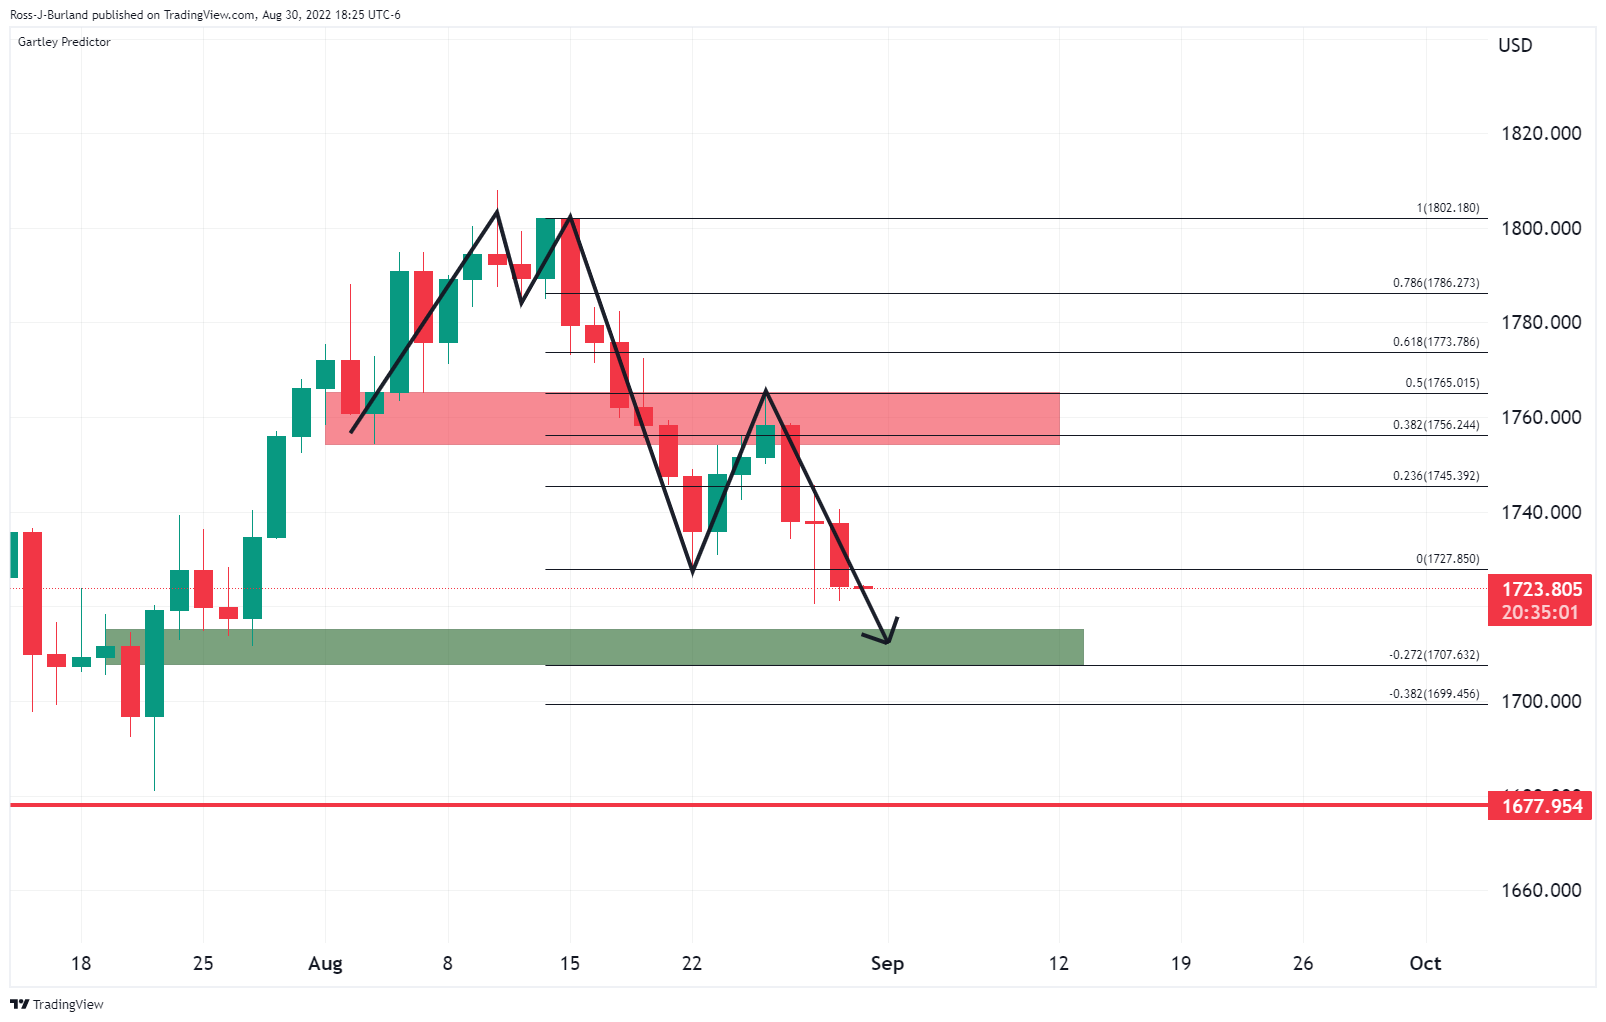
-
01:15
Currencies. Daily history for Tuesday, August 30, 2022
Pare Closed Change, % AUDUSD 0.68532 -0.74 EURJPY 138.981 0.19 EURUSD 1.00162 0.15 GBPJPY 161.699 -0.41 GBPUSD 1.16532 -0.45 NZDUSD 0.61276 -0.41 USDCAD 1.30912 0.64 USDCHF 0.97411 0.64 USDJPY 138.755 0.04 -
01:14
EUR/USD Price Analysis: Recovery approaches fortnight-old hurdle near 1.0040
- EUR/USD remains firmer for the third consecutive day buyers attack short-term key resistance line.
- Impending bull cross on the MACD and a sustained break of the 10-DMA also favor upside momentum.
- 50-DMA appears the key resistance, bears can retake control by breaking July’s low.
EUR/USD picks up bids to extend the weekly gains to 1.0025 during Wednesday’s Asian session. In doing so, the major currency pair prints a three-day uptrend while justifying the first daily close above the 10-DMA since August 15.
However, a two-week-long descending trend line, around 1.0040 by the press time, guards the quote’s immediate recovery moves. Following that, a run-up towards the 1.0100 threshold can’t be ruled out.
Even so, the EUR/USD bulls need a successful closing beyond the 50-DMA hurdle surrounding 1.0195 to retake control.
That said, the looming bull cross of the MACD and steady RSI appears to favor the short-term upside of the quote.
Alternatively, pullback moves remain elusive beyond the 10-DMA support near the parity level of 1.0000.
Following that, July’s bottom near 0.9950 could entertain bears before directing them to the recently flashed 19-year low of 0.9900.
Overall, EUR/USD is up for grabs by the intraday bulls but the risk to the downside can’t be ignored due to the presence of the inflation data on the calendar.
Also read: EUR/USD stays defensive above 1.0000 despite hawkish ECBspeak ahead of EU inflation
EUR/USD: Daily chart
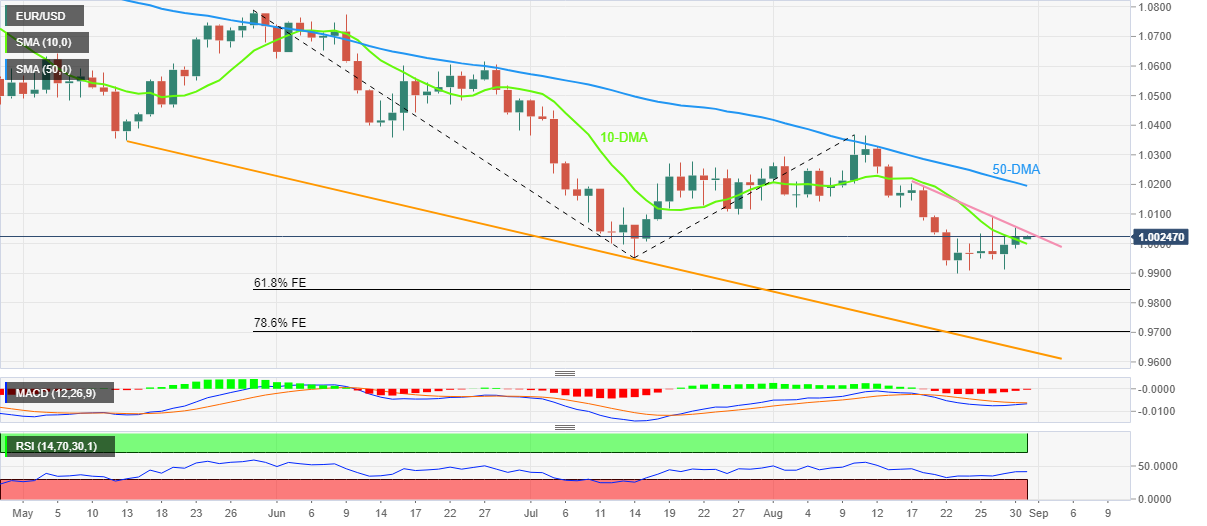
Trend: Limited upside expected
-
01:09
USD/JPY declines towards 138.50 amid upbeat Japan Retail Trade data
- USD/JPY is scaling lower gradually on higher Japan’s Retail Trade and Industrial Production data.
- An improvement in US Consumer Confidence and hawkish Fed supported the DXY.
- The US NFP is expected to land at 300k, lower than the prior release of 528k.
The USD/JPY pair has witnessed mild selling pressure and is declining towards 138.50 after the release of upbeat economic data. Japan’s Retail Sales have improved to 2.4%, higher than the expectations of 1.9% and the prior release of 1.5% on an annual basis. Also, the monthly Retail Trade has advanced to 0.8%. Meanwhile, the Industrial Production data has landed higher at 1.8% than the expectations and the former release of -2.6% and -2.8% respectively.
On a broader note, the asset has remained in the grip of bulls as the US dollar index (DXY) has displayed a stellar performance. The DXY is aiming to recapture its two-decade high at 109.29 after upbeat Consumer Confidence data and hawkish commentary from Federal Reserve (Fed) policymakers.
The Conference Board (CB) Consumer Confidence data improved significantly to 103.2, significantly higher than the prior release of 95.3, recorded in July. An improvement in the confidence of consumers in the economy results in more retail demand and eventually supports the respective currency. Also, the guidance from New York Fed Bank President John Williams infused fresh blood into the DXY.
Fed Williams is expecting an escalation in the interest rates above 3.5% by this year as it is highly required to slow down the ramping up inflation. He added that the inflation rate could come down to 2.5-3% by next year.
This week, investors’ focus will remain on the US Nonfarm Payrolls (NFP) data, which will release on Friday. Despite, a halt in the recruitment process by various tech giants and consequences of shrinkage in liquidity, the job additions data is expected to remain satisfactory. The economic data is seen at 300k, lower than the prior release of 528k.
-
00:54
US 10-year inflation expectations refresh one-week low
US inflation expectations, as per the 10-year breakeven inflation rate per the St. Louis Federal Reserve (FRED) data, fades the week-start rebound while extending the pullback from a 10-week high to 2.55% by the end of Tuesday’s North American trading session.
In doing so, the inflation precursor declined to the lowest levels in over a week even as the US data printed the firmer outcomes the previous day. That said, the Conference Board’s (CB) latest survey details. Also, US Housing Price Index (HPI) rose by 0.1% MoM in June compared to May's increase of 1.3% and market expectation of 1.1%. Further, the S&P/Case-Shiller Home Price Indices eased to 18.6% YoY during the stated month versus 19.5% forecast and 20.5% previous readings. It should be noted that the US JOLTS Job Openings grew to 11.239M in July versus 10.475M expected and 11.04M prior (revised from 10.698M).
It should be noted that the softer inflation expectations failed to push back hawkish Fedspeak as Richmond Federal Reserve Bank President Thomas Barkin said, "I don't expect inflation to come down predictably." On the same line was Atlanta Fed President Raphael Bostic who said, “Slowing inflation data 'may give us reason' to slow interest rate hikes.” Recently, New York Fed President John Williams said, per the WSJ, “We are not at restrictive policy yet.” The policymaker also added, “We need to get interest rates higher than longer run a neutral level.”
Amid these plays, CME’s FedWatch Tool hints at the 68.5% chance of a 75 basis points (bps) rate hike by the Fed in September.
Hence, the latest weakness in the US 10-year inflation expectations fails to compress the risk-on mood, as well as the US dollar strength.
Also read: EUR/USD stays defensive above 1.0000 despite hawkish ECBspeak ahead of EU inflation
-
00:53
Japan Industrial Production (YoY) came in at -1.8%, above forecasts (-2.6%) in July
-
00:52
Japan Retail Trade s.a (MoM) above forecasts (-0.5%) in July: Actual (0.8%)
-
00:52
Japan Large Retailer Sales in line with expectations (2.8%) in July
-
00:52
Japan Industrial Production (MoM) came in at 1%, above forecasts (-0.5%) in July
-
00:50
Japan Retail Trade (YoY) came in at 2.4%, above expectations (1.9%) in July
-
00:45
WTI drops back towards weekly low past $90.00 on API stockpiles, Iran/OPEC news
- WTI takes offers to refresh intraday low, fades bounce off one-week bottom.
- API inventories registered surprise build, Russian media hints at no plans discussed to cut OPEC+ output.
- US-Iran oil deal, Iraq’s readiness for more oil supplies to Europe join recession fears, hawkish Fedspeak to exert downside pressure.
- China PMI, US ADP and EIA numbers to entertain traders ahead of the key NFP data.
WTI crude oil retreats to $91.75, after a failed attempt to consolidate the biggest daily loss in seven weeks, as recession woes and supply concerns weigh on the black gold during Wednesday’s Asian session. In doing so, the commodity prices remain pressured near the weekly low.
Recently exerting downside pressure on the energy benchmark is the weekly prints of the American Petroleum Institute’s (API) Crude Oil Stock data. That said, the weekly inventories for the period ended on August 26 rose to 0.593M versus -5.632M prior.
Elsewhere, the statements from Iraq's State Organization for Marketing of Oil (SOMO) eased supply crunch fears and weighed on the WTI crude oil prices late on Tuesday. Iraq’s SOMO unveiled plans to travel to Germany for oil export talks. “Iraq ready to boost oil exports to Europe, if asked,” adds Iraq’s SOMO.
On the same line could be the headlines from OPEC and its allies, the group known as OPEC+, which stated, per the Russian news TASS, “Potential OPEC+ output cuts not under discussion now.” Also weighing on the black gold prices were expectations that Iran may release more oil.
Furthermore, chatters surrounding the US-Iran oil deal appeared to have battled the oil bears.
It should be noted, however, that the fears of recession and hawkish central bank chatters exert downside pressure on the oil prices. Adding to the economic slowdown concerns are the latest US-China tension over Taiwan and China’s covid woes.
Alternatively, recently firmer US data and Gazprom’s halting of the gas supplies to Europe keep buyers hopeful.
Moving on, China’s NBS Manufacturing PMI for August, expected 49.2 versus 49.0 prior, could offer an intermediate rebound to the black gold. After that, the US ADP Employment Change for August, the early signal for Friday’s US Nonfarm Payrolls (NFP), expected 200K versus 128K prior, will be important to watch for fresh impulse.
Also read: ADP Jobs Preview: Three reasons to expect the data to drive the dollar higher
Technical analysis
A clear downside break of the previous resistance line from early July, around $90.00 by the press time, appears necessary to direct bears towards the monthly low near $85.50. Meanwhile, oil buyers need a successful break of the 50-DMA, around $96.00 by the press time, to retake control.
-
00:30
AUD/NZD eyes more weakness below 1.1170 as focus shifts to RBA interest rate decision
- AUD/NZD is expected to display more downside below 1.1170 amid weaker Aussie Building Permits.
- Next week, an interest rate decision by the RBA will be keenly watched.
- The RBNZ will announce two more interest rate hikes this year.
The AUD/NZD pair has displayed a less-confident pullback after printing a fresh four-day low below 1.1700. The cross witnessed an intense sell-off on Tuesday after surrendering the crucial support of 1.1200. The asset is expected to display more weakness after slipping below the immediate support of 1.1170 as investors are turning cautious ahead of the interest rate decision by the Reserve Bank of Australia (RBA).
The aussie bulls weakened on Tuesday after the release of the downbeat Australian Building Permits data. The economic data landed at -25.9%, lower than the prior release of -17.2%. Also, the monthly data slipped dramatically to -17.2% vs. -0.6% recorded earlier.
On Tuesday, RBA policymakers will discuss over the decision of the fourth consecutive 50 basis points (bps) interest rate hike. Price pressures in the Australian economy have not displayed a sigh of relief yet. Currently, the Australian Consumer Price Index (CPI) is at 6.1%, recorded in the second quarter, and to scale it down more rate hikes are highly likely ahead. Apart from that, guidance from RBZ Governor Philip Lowe over the Official Cash Rate (OCR) will be of utmost importance.
On the NZ front, upbeat Building Permits data have supported the kiwi bulls. The economic data landed at 5%, significantly higher than the prior release of -2.2%. On a broader note, investors are still in a hangover after the announcement of two more interest rate hikes by the Reserve Bank of New Zealand (RBNZ) going forward this year. RBNZ Governor Adrian Orr announced at Jackson Hole Economic Symposium, last week, that the central bank is committed to cooling down the red-hot inflation and will announce a couple of more interest rates against the same.
-
00:17
AUD/JPY Price Analysis: Bulls are moving in at a key support area
- AUD/JPY bulls have started to move in for the sessions ahead.
- The price is testing a trendline support area.
The price has ducked into the daily trendline line support and should the bulls commit, then the probability is compelling for an upside extension for the days ahead. The following illustrates this from a daily perspective supported by an hourly bullish Cypher pattern.
AUD/JPY daily chart
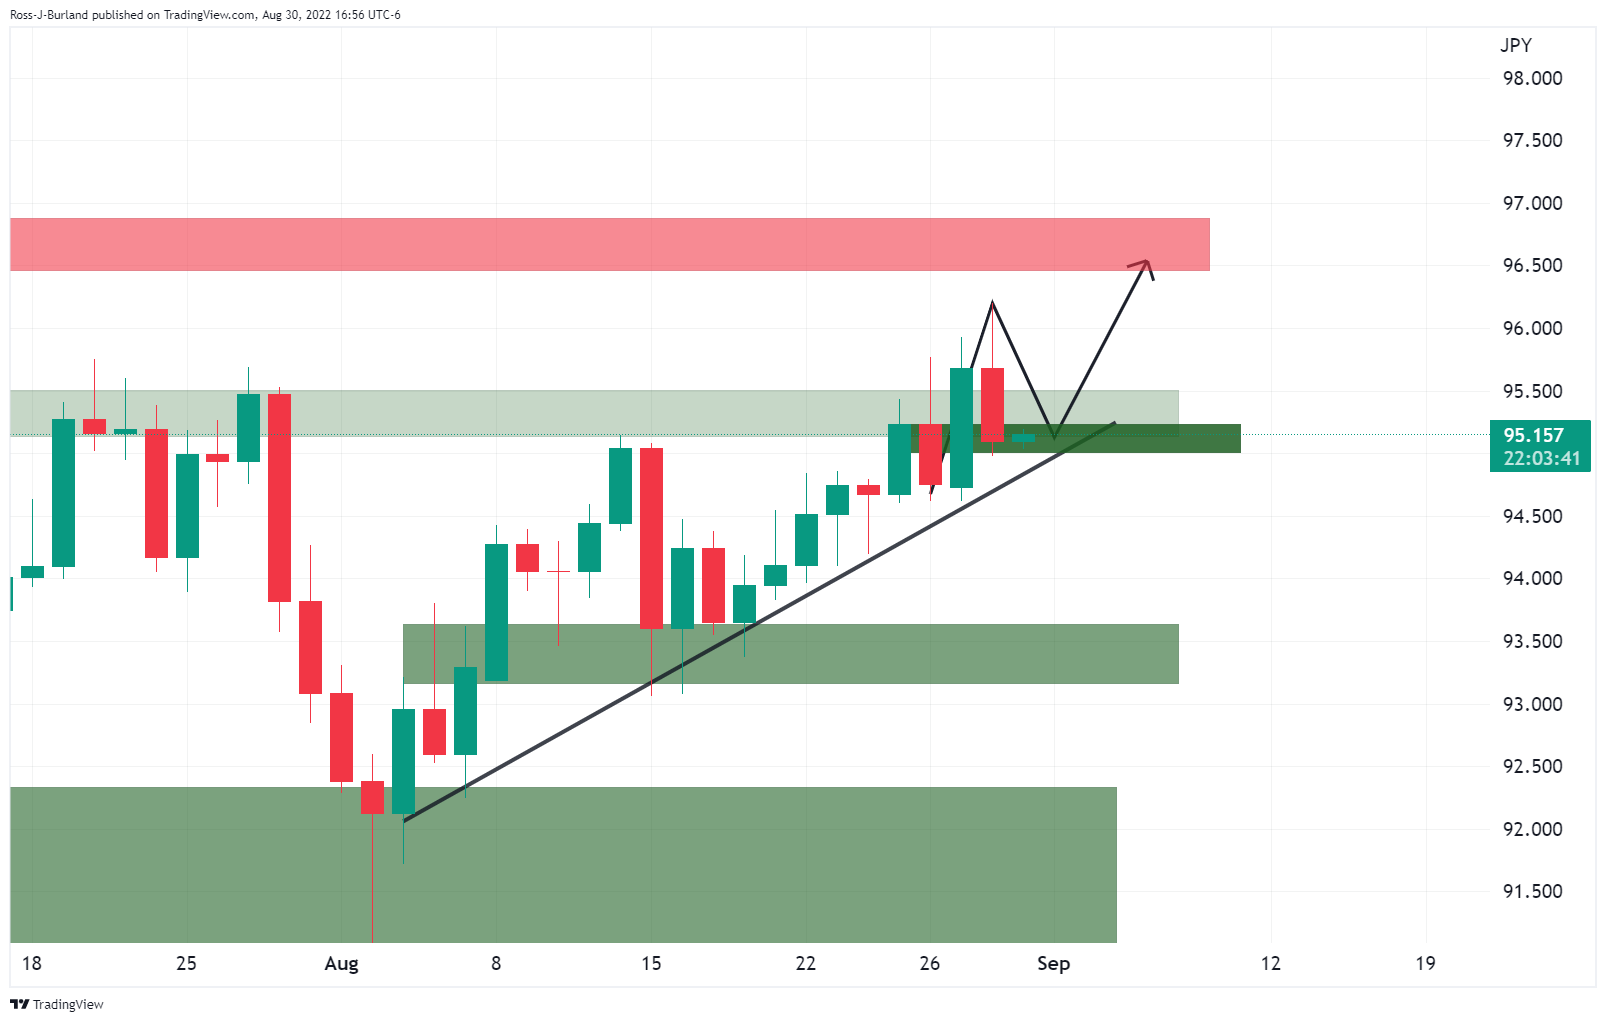
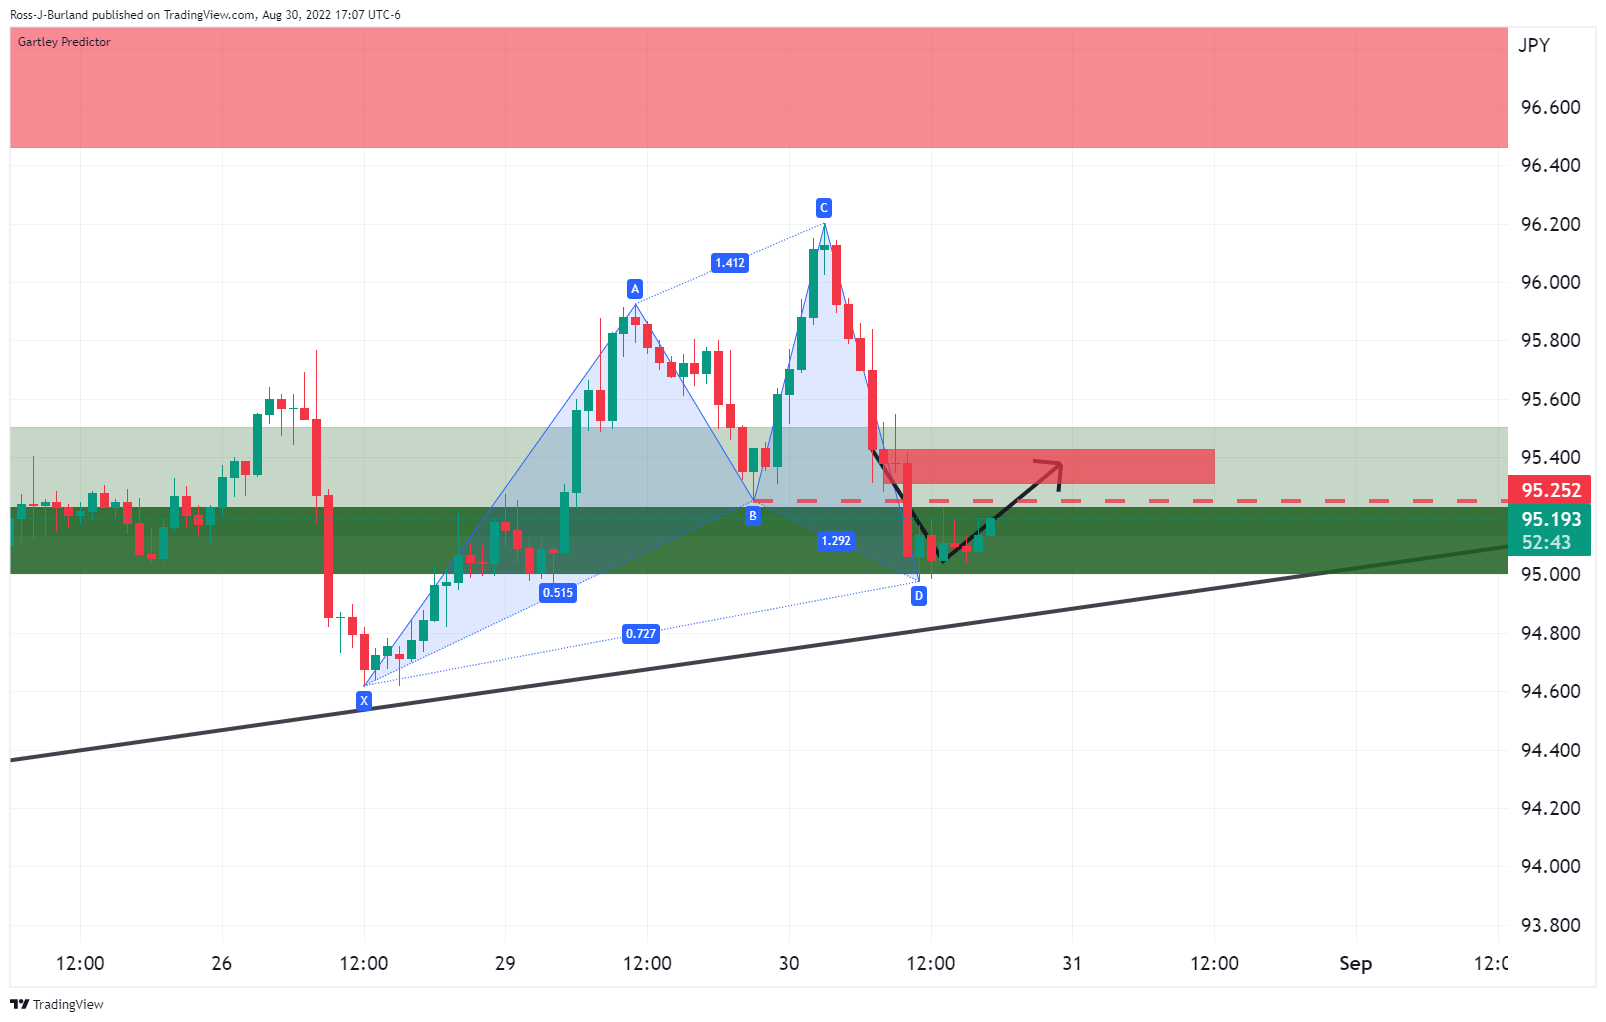
The Cypher Pattern strategy is a reversal strategy and there is a completion of the XC leg with the price consolidating at key support with a bullish bias outlined on the chart above.
-
00:15
NZD/USD Price Analysis: Bears approach 0.6100 horizontal support
- NZD/USD extends pullback from 10-DMA, stays pressured of late.
- Two-month-old horizontal support tests sellers amid bearish MACD signals.
- RSI drops towards oversold territory to challenge further downside.
- Bulls have a bumpy road to return unless breaking 0.6455 hurdle.
NZD/USD holds lower ground near 0.6130, after reversing the bounce off a six-week low the previous day, as bears approach the key horizontal support during Wednesday’s Asian session.
That said, firmer prints of New Zealand Building Permits for July, up 5.0% MoM versus -2.3% prior, couldn’t favor the Kiwi pair buyers.
In doing so, the quote keeps the previous day’s U-turn from the 10-DMA hurdle, around 0.6185 by the press time.
The NZD/USD pullback from the 10-DMA also takes clues from the bearish MACD signal to aim for the 0.6110-6100 support region comprising multiple lows marked since early July.
Following that, the yearly low marked in the last month around 0.6025 and the 0.6000 psychological magnet may test the bears. It’s worth noting that the RSI (14) is speedily approaching the oversold territory and hence challenge the pair’s further downside.
Meanwhile, recovery moves beyond the 10-DMA immediate hurdle, close to 0.6185 by the press time, need validation from the latest swing high near 0.6255 to convince even the intraday buyers.
In that case, the month-start peak and the downward sloping resistance line from April 26, respectively near 0.6355 and 0.6450 will be in focus.
NZD/USD: Daily chart
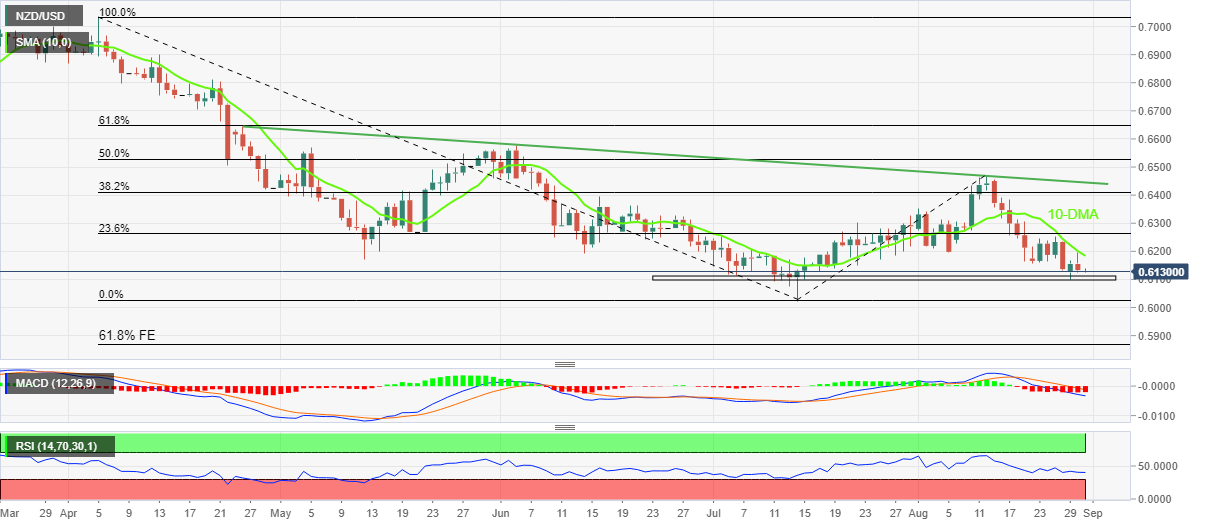
Trend: Further weakness expected
-
00:02
United Kingdom BRC Shop Price Index (YoY) increased to 5.1% in July from previous 4.4%
-
00:00
South Korea Service Sector Output above forecasts (-0.1%) in July: Actual (0.3%)
-
00:00
South Korea Industrial Output Growth below expectations (-0.1%) in July: Actual (-1.3%)
-
00:00
South Korea Industrial Output (YoY) below forecasts (2.9%) in July: Actual (1.5%)
-