Notícias do Mercado
-
23:58
NZD/USD ignores NZ trade numbers below 0.6100 with eyes on US NFP
- NZD/USD defends the late Friday’s corrective pullback from seven-week low despite downside data.
- New Zealand’s Q2 Terms of Trade Index dropped to -2.4% versus -1.3% expected.
- China concerns, strong yields exert downside pressure amid a light calendar at home.
- US NFP will be the key as DXY refreshed the 20-year high ahead of the release.
NZD/USD holds onto the corrective bounce from the 1.5-month low near 0.6080 despite downbeat New Zealand (NZ) trade data during early Friday in Asia. In doing so, the Kiwi pair portrays the consolidation ahead of the key US Nonfarm Payrolls (NFP) while snapping a three-day downtrend.
As per the latest trade numbers from the Statistics New Zealand, the Terms of Trade fell 2.4% in the second quarter (Q2), reported Reuters. The details mentioned that Export prices rose 3.7 percent, while imports increased 6.5 percent. Economists were expecting the index to show a 1.3 percent fall, with export prices rising 0.8 percent and imports up 2.5 percent, according to a Reuters poll.
Although the quote remains ignorant of the data while taking rounds to 0.6080, it stays near the lowest levels in seven weeks as markets love the US dollar amid broad pessimism and hawkish Fed bets. Also, sour sentiment surrounding the world’s largest commodity user China exerts additional downside pressure on the NZD/USD prices.
A covid-led lockdown in China’s Chengdu city joins downbeat Caixin Manufacturing PMI to portray grim conditions for the world’s second-largest economy. On the same line could be the escalating geopolitical tension between Beijing and Washington, via Taiwan.
On the other hand, the hawkish Fedspeak and firmer US data underpins the US dollar demand. That said, Atlanta Fed President Raphael Bostic said that the Fed has work to do with inflation, a 'long way' from 2%. Also, the newly appointed Dallas Fed President Lory Logan joined the lines of hawkish fellow US central bankers while saying, “Restoring price stability is No. 1 priority.”
US ISM Manufacturing PMI reprinted the 52.8 figure for August versus the market expectations of 52.0. Further, the final reading of S&P Manufacturing PMI for August rose past 51.3 initial estimates to 51.5, versus 52.2 prior final for July. On the same line, US Initial Jobless Claims dropped to 232K versus 248K forecast and 237K prior. Further, the Unit Labor Cost rose 10.2% QoQ during the second quarter (Q2) versus 10.7% expected while Labor Productivity dropped by 4.1% during Q2 versus the anticipated fall of 4.5% and -4.6% prior.
Against this backdrop, Wall Street closed mixed but the US 10-year Treasury yields rose to the highest levels since late June. More importantly, the 02-year counterpart jumped to the 15-year top. It should be noted that the CME’s FedWatch Tool signals 72% chance of the Fed’s 75 basis points of a rate hike in September versus nearly 69% previously.
Technical analysis
Unless bouncing back beyond the August 22 swing low, around 0.6155, NZD/USD remains vulnerable to refreshing the yearly bottom, currently surrounding 0.6060. In doing so, the 0.6000 psychological magnet and a downward sloping trend line from late January, near 0.5900 will be in focus.
-
23:45
New Zealand Terms of Trade Index registered at -2.4%, below expectations (-1.3%) in 2Q
-
23:38
USD/CHF turns sideways above 0.9800 after a minor correction, US NFP buzz
- USD/CHF is juggling in a 16-pips range as the focus shifts to US NFP data.
- Investors should brace for a third consecutive 75 bps rate hike by the Fed.
- Less-than-expected Real Retail Sales data have weakened the Swiss franc.
The USD/CHF pair is displaying back-and-forth moves in a narrow range of 0.9807-0.9823 in the Asian session. The asset has witnessed a time-based correction after printing a fresh six-week high at 0.9861. The pair is expected to resume its upside journey as the US dollar index (DXY) is displaying a stellar performance on a broader note.
Inflationary pressures in the US economy have already displayed signs of exhaustion after overstepping 9% for once as the inflation rate has scaled down to 8.5% in its prior reading. However, the ongoing rate is still extremely far from the desired rate of the Federal Reserve (Fed), which is 2%.
Therefore, the Fed will continue its path of hiking interest rates and a third consecutive rate hike by 75 basis points (bps) is highly likely in September monetary policy meeting.
In today’s session, investors’ entire focus will be on the more comprehensive and considered US Nonfarm Payrolls (NFP) data, which is expected to land at 300k for August vs. 528k, recorded in July.
Earlier, the US Automatic Data Processing (ADP) reported 132k job additions with the deployment of unconventional methodology for employment scrutiny. Considering the cues from US ADP, a vulnerable performance is expected from the US NFP data ahead.
Meanwhile, less-than-expected Real Retail Sales data have weakened the Swiss franc. The economic data landed at 2.6%, lower than the consensus of 3.3% but remained higher than the prior release of 0.7%. Also, the Consumer Price Index (CPI) has improved to 3.5% against expectations and the former print of 3.4% on an annual basis.
-
23:36
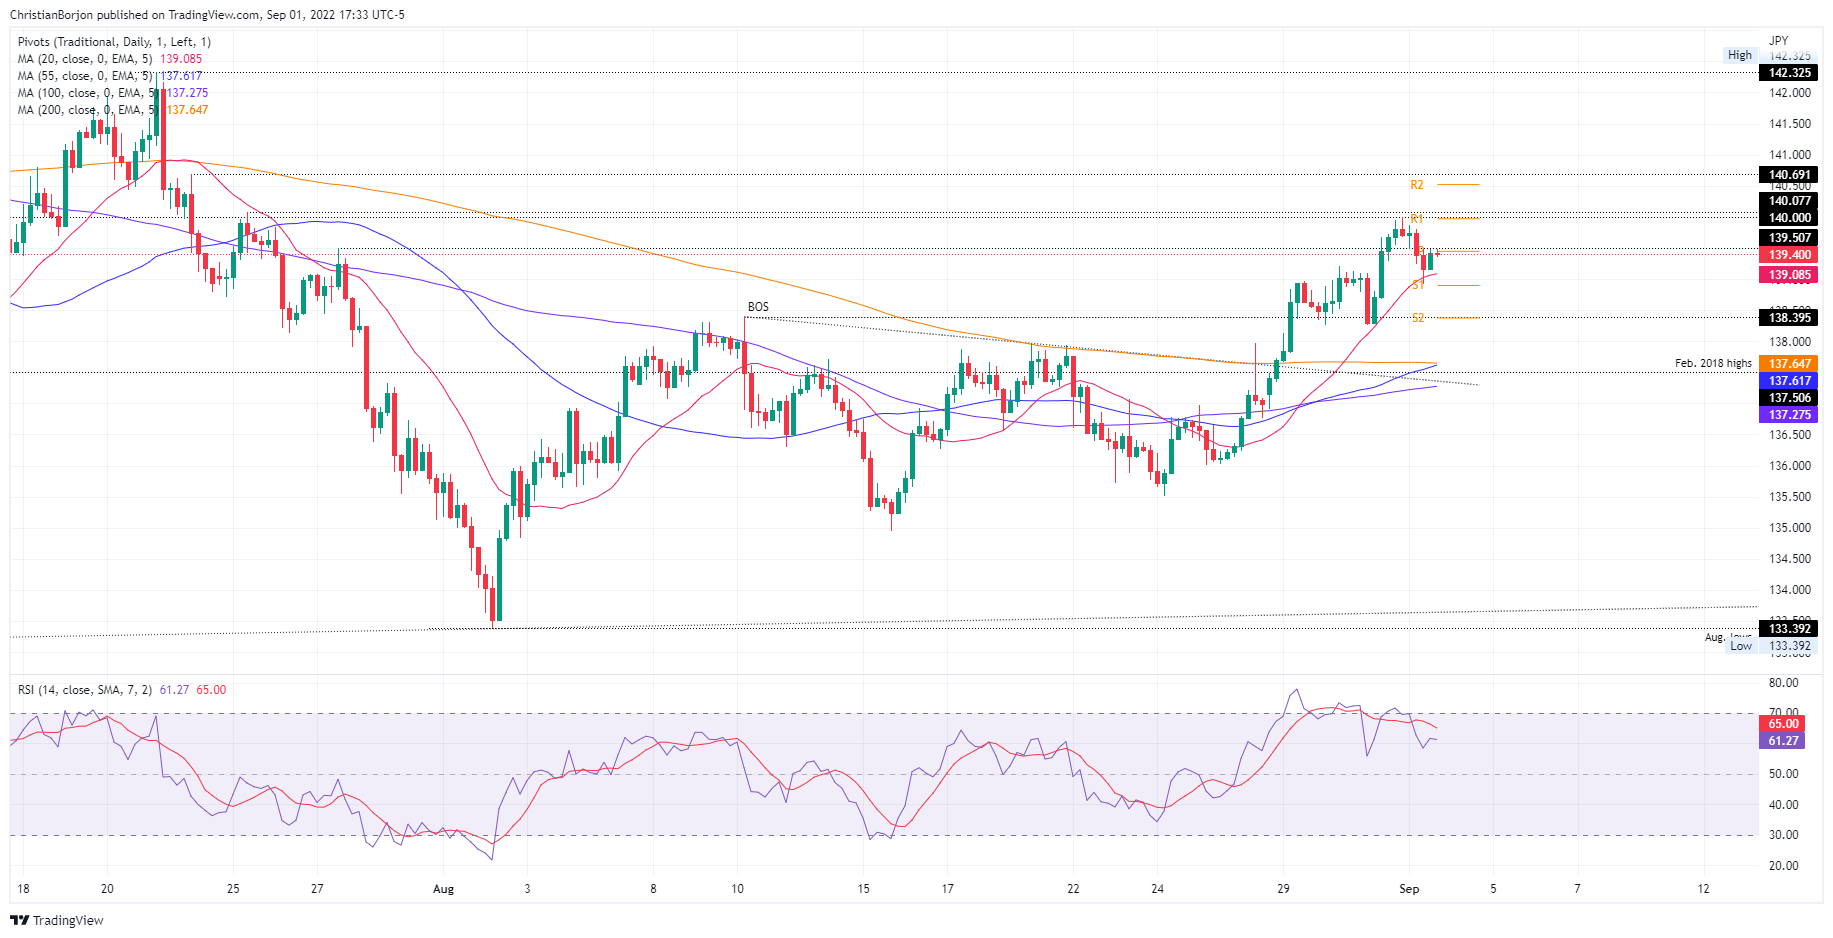
EUR/JPY Price Analysis: Meanders around 139.40 after hitting a weekly high at 139.99
- EUR/JPY snapped four days of gains on Thursday, losing 0.18%.
- A risk-off impulse bolstered the appetite for safe-haven, so the yen rose.
- Negative divergence in the 4-hour chart opens the door for a EUR/JPY pullback towards 138.00.
EUR/JPY refreshes a five-week high, for the fifth consecutive trading day, at around 139.99, but erased some gains as risk appetite decreased on China’s recession fears, alongside a tranche of positive US economic data that increased the odds of a 75 bps Fed rate hike. At the time of writing, the EUR/JPY is trading at 139.40 as the Asian Pacific session begins.
EUR/JPY Price Analysis: Technical outlook
The EUR/JPY daily chart portrays buyers’ failure to conquer the 140.00 mark. The cross-currency retreated towards the 50-day EMA at 138.83, a place sought by longs, which lifted the pair back above the 139.00 figure. Therefore, the EUR/JPY bias, from a daily scale perspective, is bullish.
Short term, the EUR/JPY is trending up on the four-hour scale. Still, the Relative Strength Index (RSI), shows buyers’ exhaustion, with the oscillator registering successive series of lower highs, contrarily to price action, printing higher highs. Hence, negative divergence on this time frame might deter EUR bulls from opening fresh longs positions ahead of a likely pullback toward lower prices.
Therefore, the EUR/JPY first support would be the S1 daily pivot at 138.92. Once cleared, the following support levels would be the S2 daily pivot point at 138.38, followed by the 200-EMA at 137.64.
EUR/JPY Key Technical Levels
-
23:32
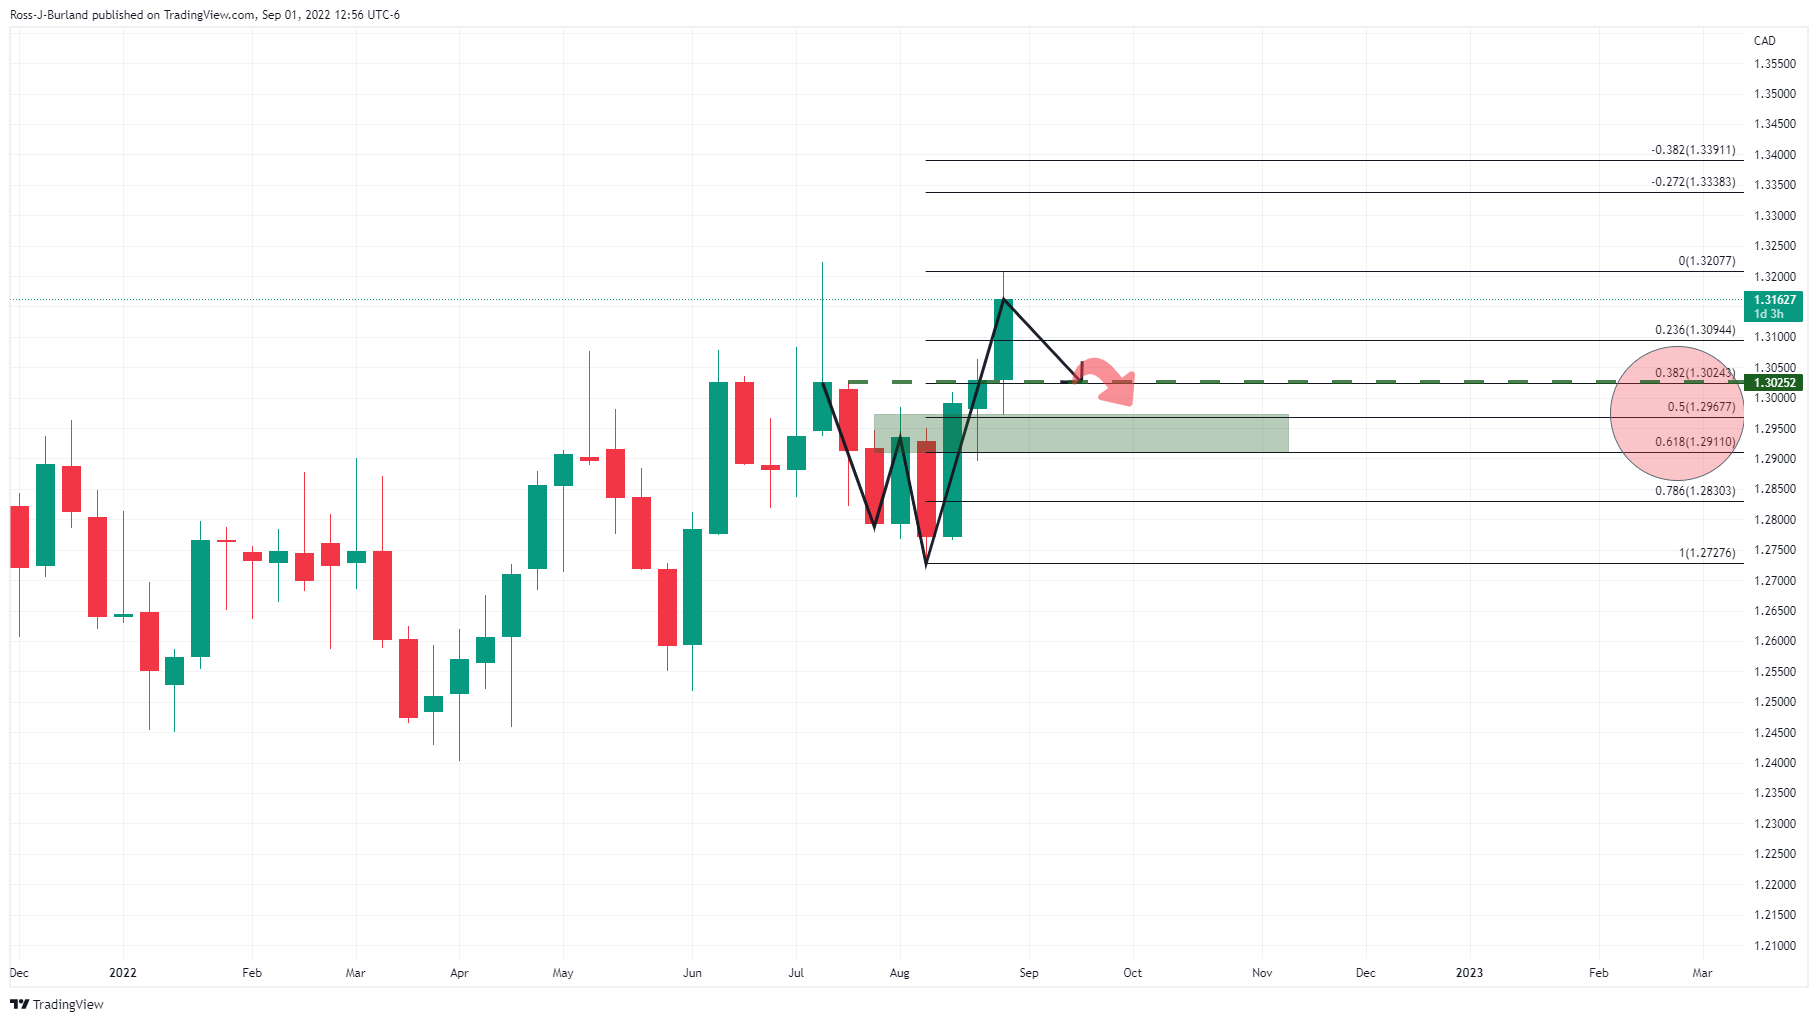
USD/CAD dribbles around mid-1.3100s even as options market flashes bullish signs
USD/CAD seesaws around a seven-week high while pausing a three-day uptrend near the yearly peak marked in July. That said, the Loonie pair takes rounds to 1.3150-60 during Friday’s initial Asian session.
It should be noted that the softer prices of Canada’s main export WTI crude oil join the broadly firmer US dollar ahead of the US employment report for August to underpin the Loonie pair’s bullish bias. That said, the quote’s latest inaction could be linked to the pre-data inaction.
One-month risk reversal (RR) on USD/CAD, a measure of the spread between call and put prices, braces for the biggest weekly gain since mid-June per the data source Reuters.
A call option gives the holder the right but not the obligation to buy the underlying asset at a predetermined price on or before a specific date. A put option represents a right to sell. That said, the weekly RR jumps to 0.312 by the press time of early Friday. That said, the daily RR also rose during the last consecutive three days with the latest print being 0.057.
Also read: Nonfarm Payrolls Preview: Five reasons to expect a win-win release for the dollar
-
23:23
AUD/USD bears stay in dominant position below 0.6800, US NFP, RBA eyed
- AUD/USD holds lower ground after refreshing multi-day bottom, pauses three-week fall.
- Grim concerns surrounding China, downbeat data at home lead the bears.
- Strong yields, upbeat US statistics propel hawkish Fed bets and underpin US dollar demand.
- No major data at home but US jobs report for August will be crucial ahead of next week’s RBA.
AUD/USD licks its wounds at the lowest levels since mid-July as traders await the key US jobs report during early Friday morning in Asia. In doing so, the Aussie pair pauses the three-day downtrend while taking rounds to 0.6780-90 of late.
In addition to the strong run-up in the US Treasury yields, grim concerns from China and downbeat Aussie data offered an extra bearish blow to the AUD/USD prices. That said, the pair’s latest inaction could be linked to the pre-event anxiety.
A covid-led lockdown in China’s Chengdu city joins downbeat Caixin Manufacturing PMI to portray grim conditions for the world’s second-largest economy. On the same line could be the escalating geopolitical tension between Beijing and Washington, via Taiwan.
At home, the final readings of Australia’s S&P Global Manufacturing PMI for August dropped below 54.5 initial estimates to 53.8. Before that, the nation’s AiG Performance of Manufacturing Index marked the first activity contraction in seven months with 49.3 numbers, versus 52.5 prior, for the said month.
It should be noted that the firmer prints of the US ISM Manufacturing PMI and the last prints of the S&P Manufacturing PMI for August joined hawkish Fedspeak to propel the bets on the Fed’s next big rate hike, which in turn fuelled the US Treasury yields towards the fresh multi-month top.
The US ISM Manufacturing PMI reprinted the 52.8 figure for August versus the market expectations of 52.0. Further, the final reading of S&P Manufacturing PMI for August rose past 51.3 initial estimates to 51.5, versus 52.2 prior final for July. On the same line, US Initial Jobless Claims dropped to 232K versus 248K forecast and 237K prior. Further, the Unit Labor Cost rose 10.2% QoQ during the second quarter (Q2) versus 10.7% expected while Labor Productivity dropped by 4.1% during Q2 versus the anticipated fall of 4.5% and -4.6% prior.
Elsewhere, Atlanta Fed President Raphael Bostic said that the Fed has work to do with inflation, a 'long way' from 2%. Also, the newly appointed Dallas Fed President Lory Logan joined the lines of hawkish fellow US central bankers while saying, “Restoring price stability is No. 1 priority.”
Amid these plays, Wall Street closed mixed but the US 10-year Treasury yields rose to the highest levels since late June. More importantly, the 02-year counterpart jumped to the 15-year top.
Looking forward, the markets are likely to witness anxiety ahead of the key US Nonfarm Payrolls (NFP) and Unemployment Rate for August, expected 300K and 3.5% versus 528K and 3.5% respective priors. Should the job report print firmer data, the odds of witnessing further US dollar strength can’t be ruled out.
Following that, the next week’s monetary policy meeting of the Reserve Bank of Australia (RBA) will be important amid recent downbeat concerns for Canberra.
Also read: Nonfarm Payrolls Preview: Five reasons to expect a win-win release for the dollar
Technical analysis
AUD/USD pair’s sustained trading below May’s low surrounding 0.6830-25 directs the bears towards the yearly low near 0.6680. However, the 0.6760 and the 0.6700 threshold may offer intermediate halts during the south run.
-
22:56
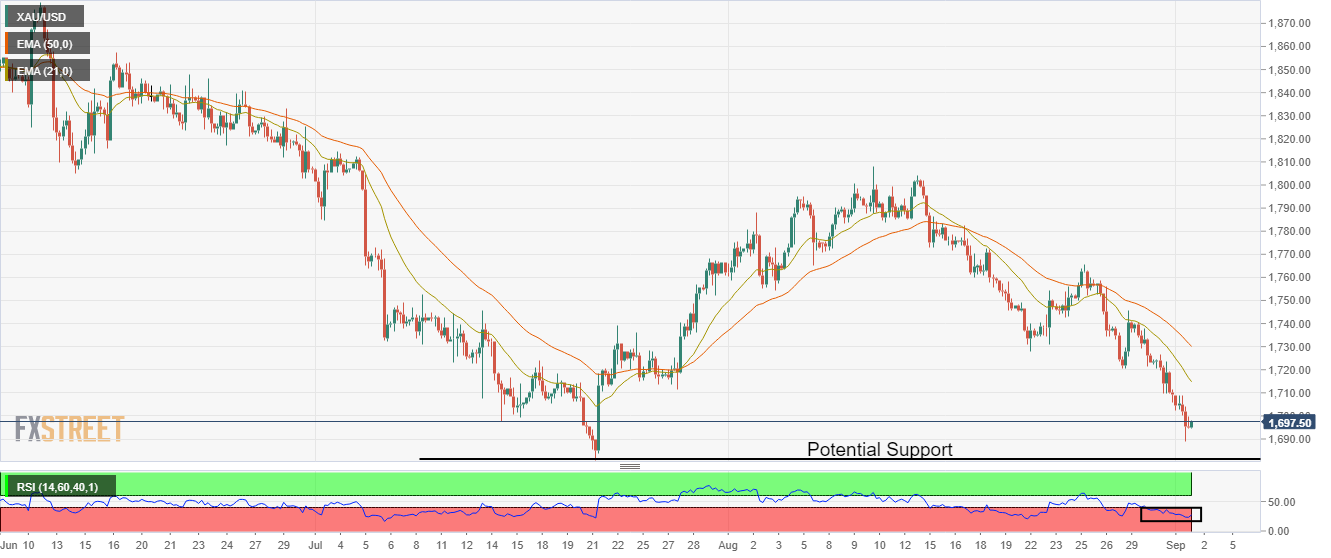
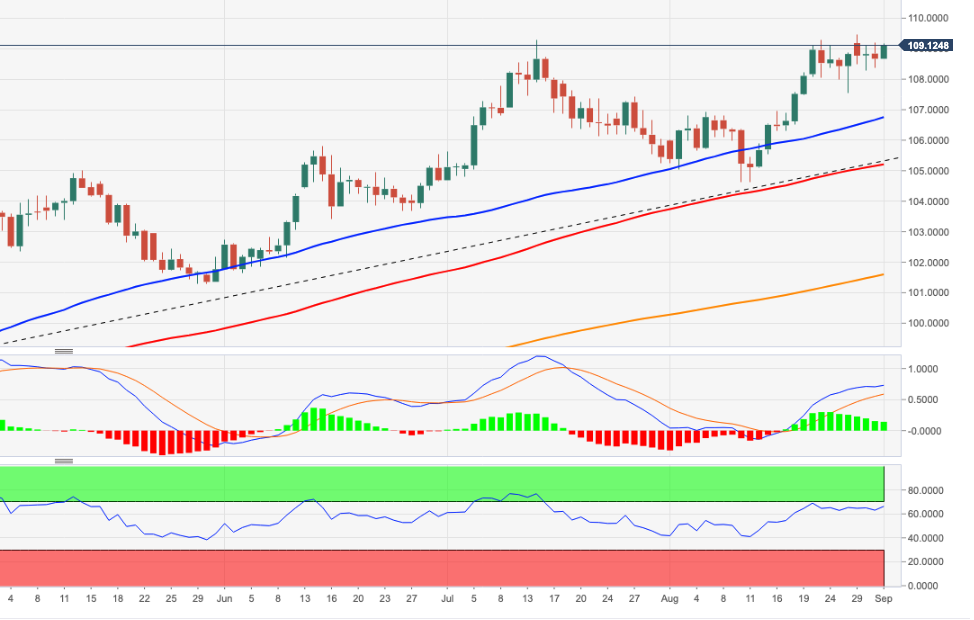
Gold Price Forecast: XAU/USD aims for a pullback above $1,700 on lower consensus for US NFP
- Gold price has faced the wrath amid a juggernaut rally in the DXY.
- A lower consensus for US NFP will result in a pullback move in the gold prices.
- Weaker earnings data could dampen the DXY’s dream rally.
Gold price (XAU/USD) has attempted to build a cushion around $1,690.00 on Thursday after displaying a sheer downside move. The precious metal is eyeing a pullback move, which might push the gold prices above the psychological resistance of $1,700.00. However, the downside will remain favored as the US dollar index (DXY) is hovering around its fresh two-decade high at 109.98.
The gold prices are facing wrath despite the lower consensus for the US Nonfarm Payrolls (NFP) data. According to the estimates, the US economy generated 300k jobs in August, lower than the prior release of 528k. Also, the Unemployment Rate is seen as stable at 3.5%. As the US economy is operating at full employment, room for more job additions has squeezed dramatically.
Apart from that, US corporate has also ditched the recruitment process due to an expectation of a slowdown in the overall demand.
Meanwhile, the DXY has turned sideways after remaining short of hitting the psychological resistance of 110.00. The catalyst that could halt the DXY’s dream rally is the Average Hourly Earnings, which is expected to improve by 10 basis points (bps) to 5.3%. Price pressures are soaring in the US economy and households need higher paychecks to offset higher payouts. Therefore, a subpar improvement in earnings data seems not lucrative for the DXY bulls.
Gold technical analysis
Gold prices are declining firmly towards the monthly lows placed at $1,680.91, recorded on July 21. The 20-and 50-period Exponential Moving Averages (EMAs) at $1,715.12 and $1,730.00 respectively are scaling towards the south, which adds to the downside filters.
Also, the Relative Strength Index (RSI) (14) has shifted into the bearish range of 20.00-40.00, which indicates more weakness ahead.
Gold four-hour chart
-
22:36
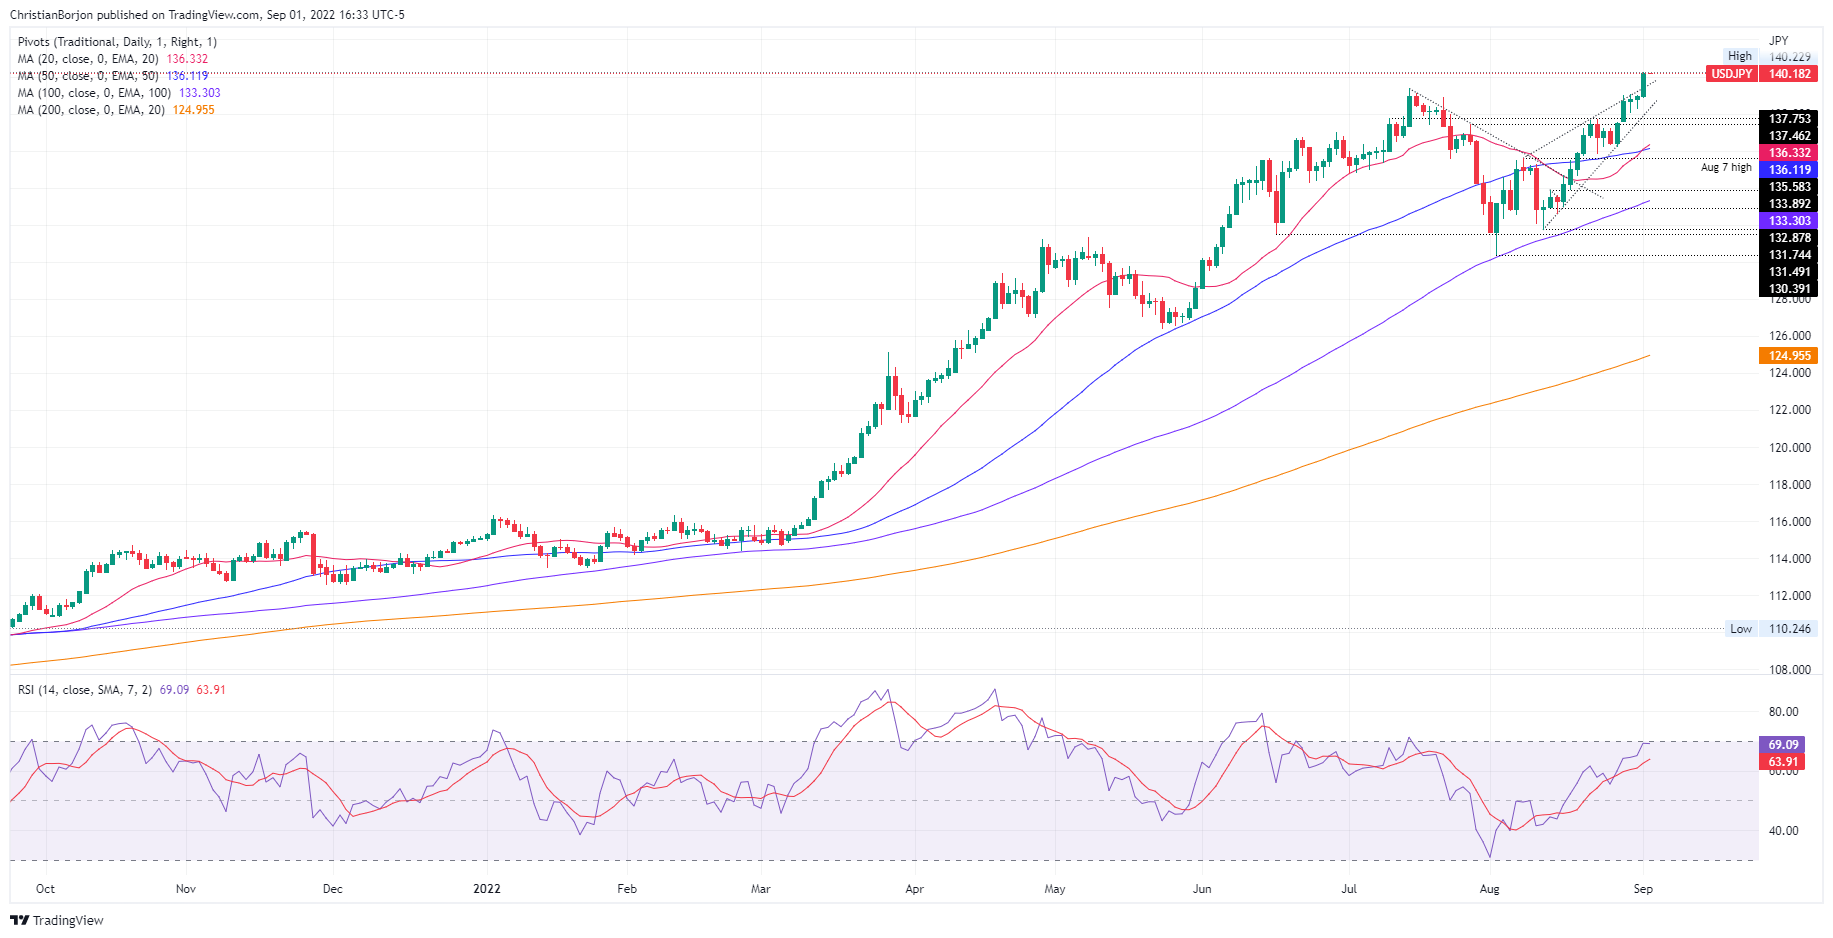
USD/JPY Price Analysis: Trades at 24-year highs above 140.00, eyeing August 1998 highs
- The USD/JPY extended its gains during the week, up by almost 2%.
- The major’s first resistance would be 141.00, which, once cleared, would pave the way towards 147.67.
The USD/JPY rose to fresh 24-year highs on Thursday, spurred by a risk-off impulse and higher US Treasury bond yields, produced by higher expectations that the US Federal Reserve would further tighten monetary conditions. Therefore, the USD/JPY climbs 0.90% and exchanges hands at 140.20.
USD/JPY Price Analysis: Technical outlook
The USD/JPY daily chart illustrates the strong uptrend, which began in March of 2022. On its first leg up, the major rallied towards the 130.00 area before registering a pullback towards 128.00, ahead of the most significant move towards the 139.39 previous YTD highs, reached July 14. Worth noting that a negative divergence between the Relative Strength Index (RSI) registering a successive series of lower highs, contrarily to price action, triggered the pullback towards the August 2 swing low at 130.39.
At the time of writing, the USD/JPY broke above the 140.00 mark, finishing Thursday’s session at around 140.19. The Relative Strength Index (RSI) is at the door of reaching overbought conditions, though it should be noted that the major retreated when the RSI reached 71.20.
The USD/JPY next resistance would be the psychological 141.00 figure. Once cleared, the USD/JPY next stop would be the August 1998 highs at 147.67.
USD/JPY Key Technical Levels
-
22:31
Fed’s Bostic: Fed has work to do with inflation, 'long way' from 2%
Atlanta Fed President Raphael Bostic said in an essay published on Tuesday, "I don't think we are done tightening. Inflation remains too high."
''That said, incoming data, if they clearly show that inflation has begun slowing - might give us reason to dial back ... We will have to see how those data come in."
A slowing of inflation in July "represented a reprieve," Bostic said.
"Moving either too aggressively or too timidly has downsides," Bostic wrote, with entrenched higher inflation looming if the Fed does not squeeze it from the economy, and lost growth and higher unemployment the outcome of "severe policy tightening."
The US dollar, meanwhile, was sent to a 20-year high on Thursday, and notched a 24-year peak against the rate-sensitive Japanese yen, after US data showed a resilient economy, giving the Federal Reserve more room to aggressively hike interest rates to quell inflation. The US dollar index, DXY, which measures the greenback against a basket of six currencies touched 109.99, its highest since June 2002.
-
22:27
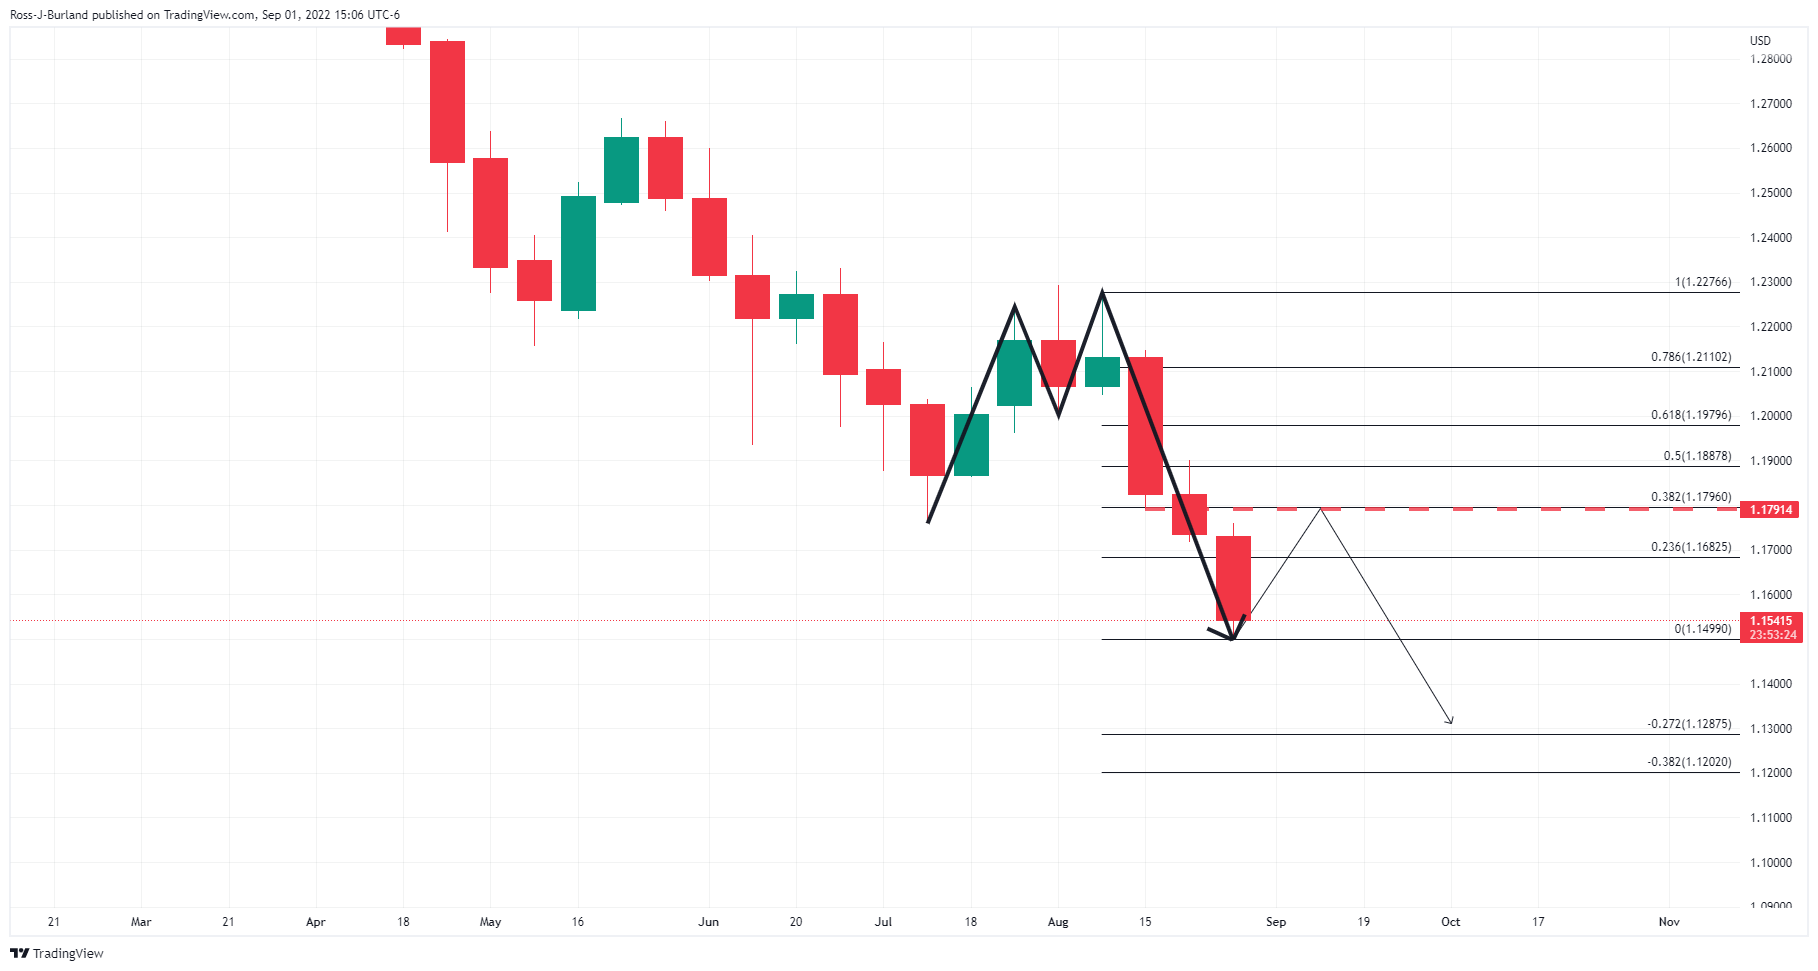
GBP/USD Price Analysis: Bulls are coming up for air but face strong bearish pressure
- GBP/USD bulls are taking up the baton but vs. string bearish momentum.
- Bears are pushing the bulls to the edge of the abyss on the longer-term time frames.
GBP/USD has been pushed into cycle lows on Thursday ahead of major data from the US on Friday. While there are no signs of an imminent correction on the longer time frames, the 4-hour chart is starting to pull back which gives rise to a potential opportunity to the upside.
The following illustrates the price action and structures on the weekly, daily and 4-hour charts.
GBP/USD weekly chart
The weekly chart has left an M-formation behind from the past few weeks of price action. This is a reversion pattern that would be expected to pull the price back towards the neckline in due course. Currently, prior lows of mid-August business align with a 38.25 Fibonacci level.
GBP/USD daily chart
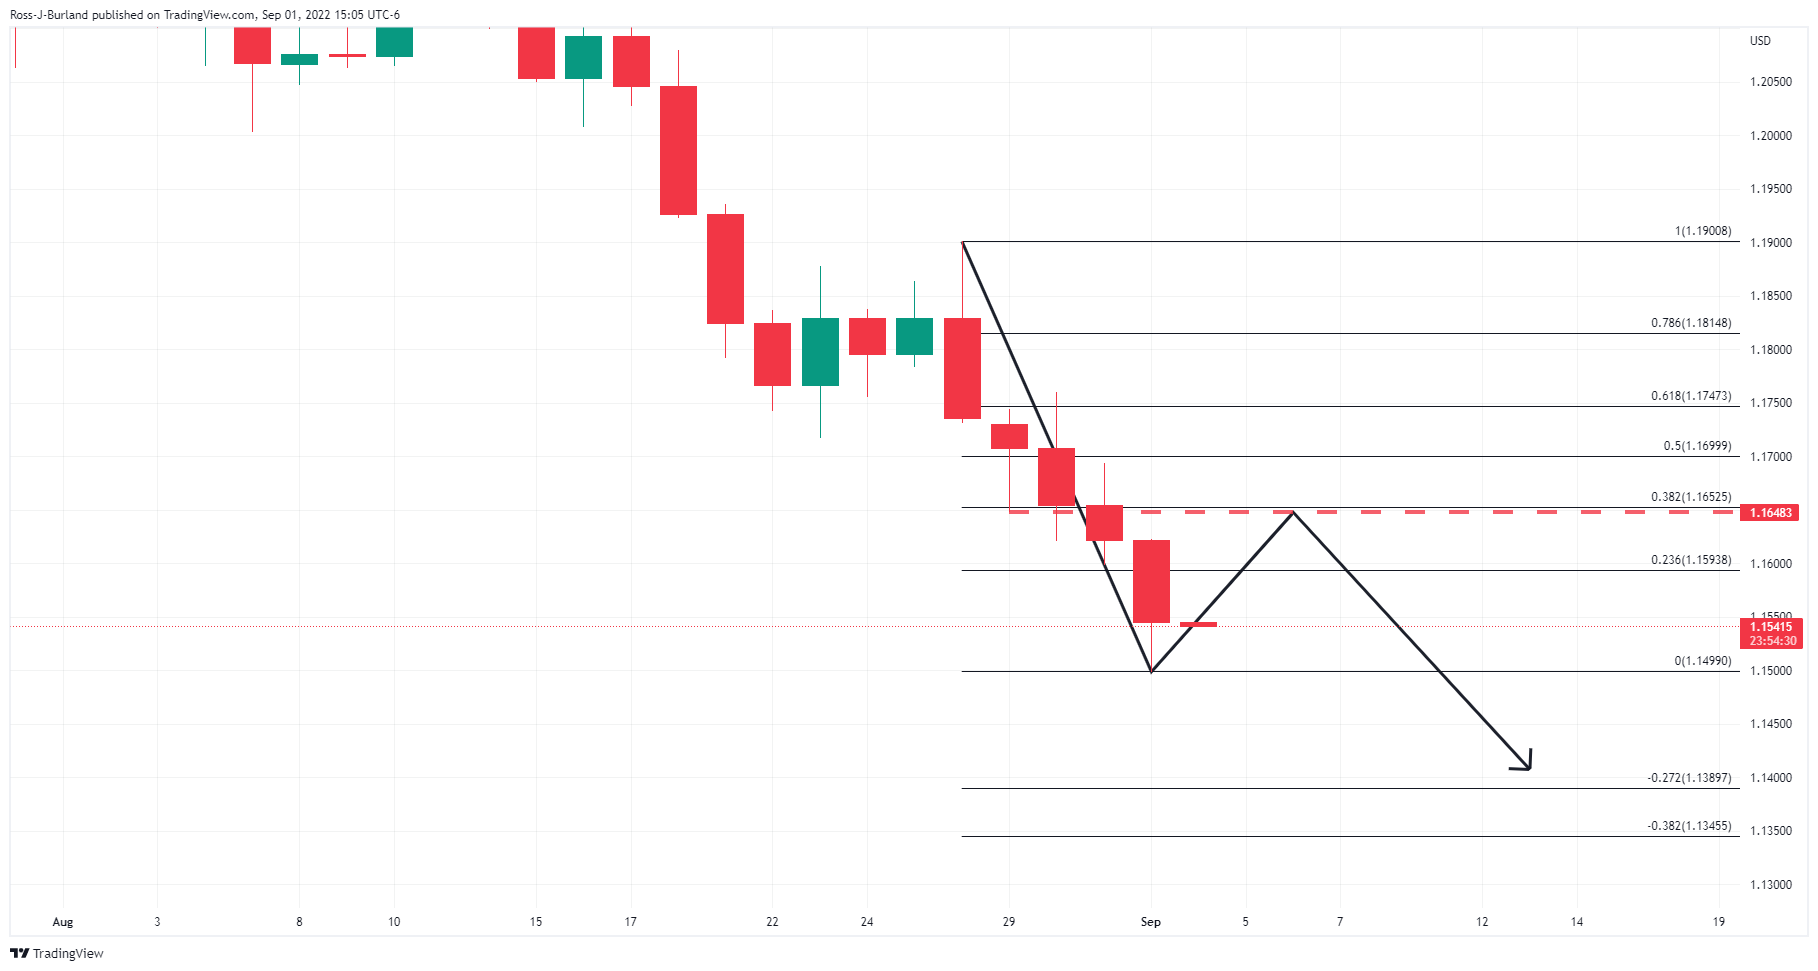
From a daily perspective, the M-formation is over-extended and has started to correct the price higher.
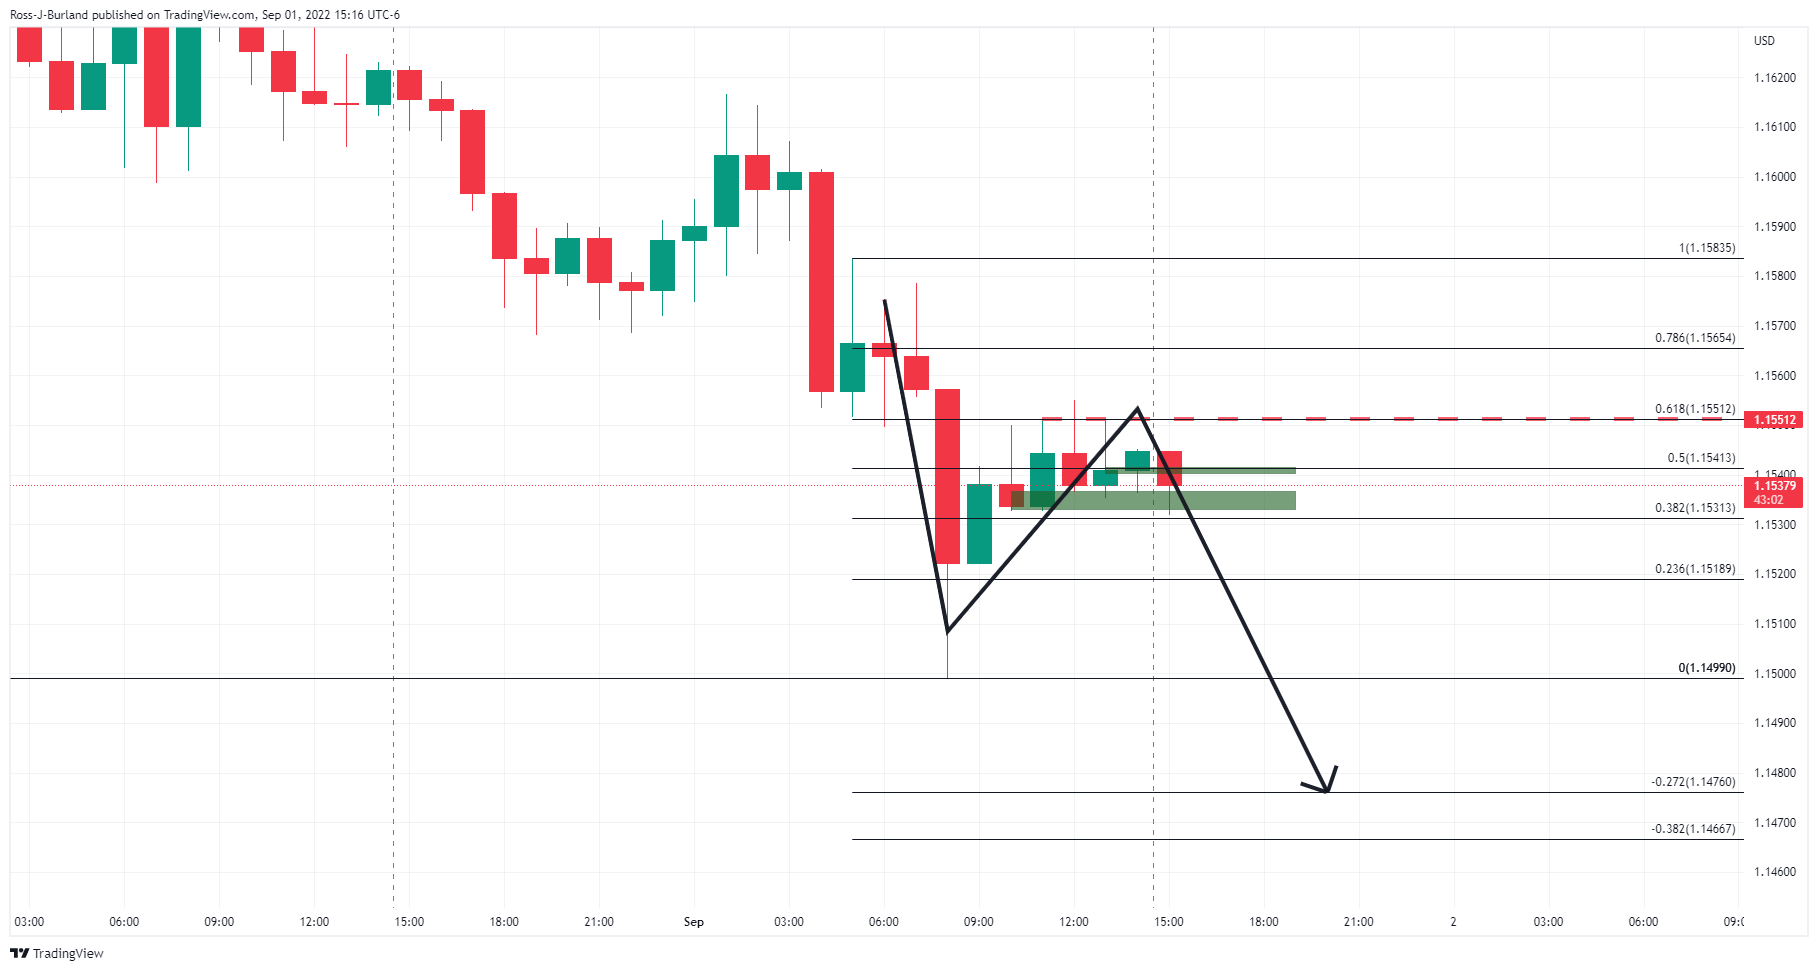
GBP/USD H4 chart
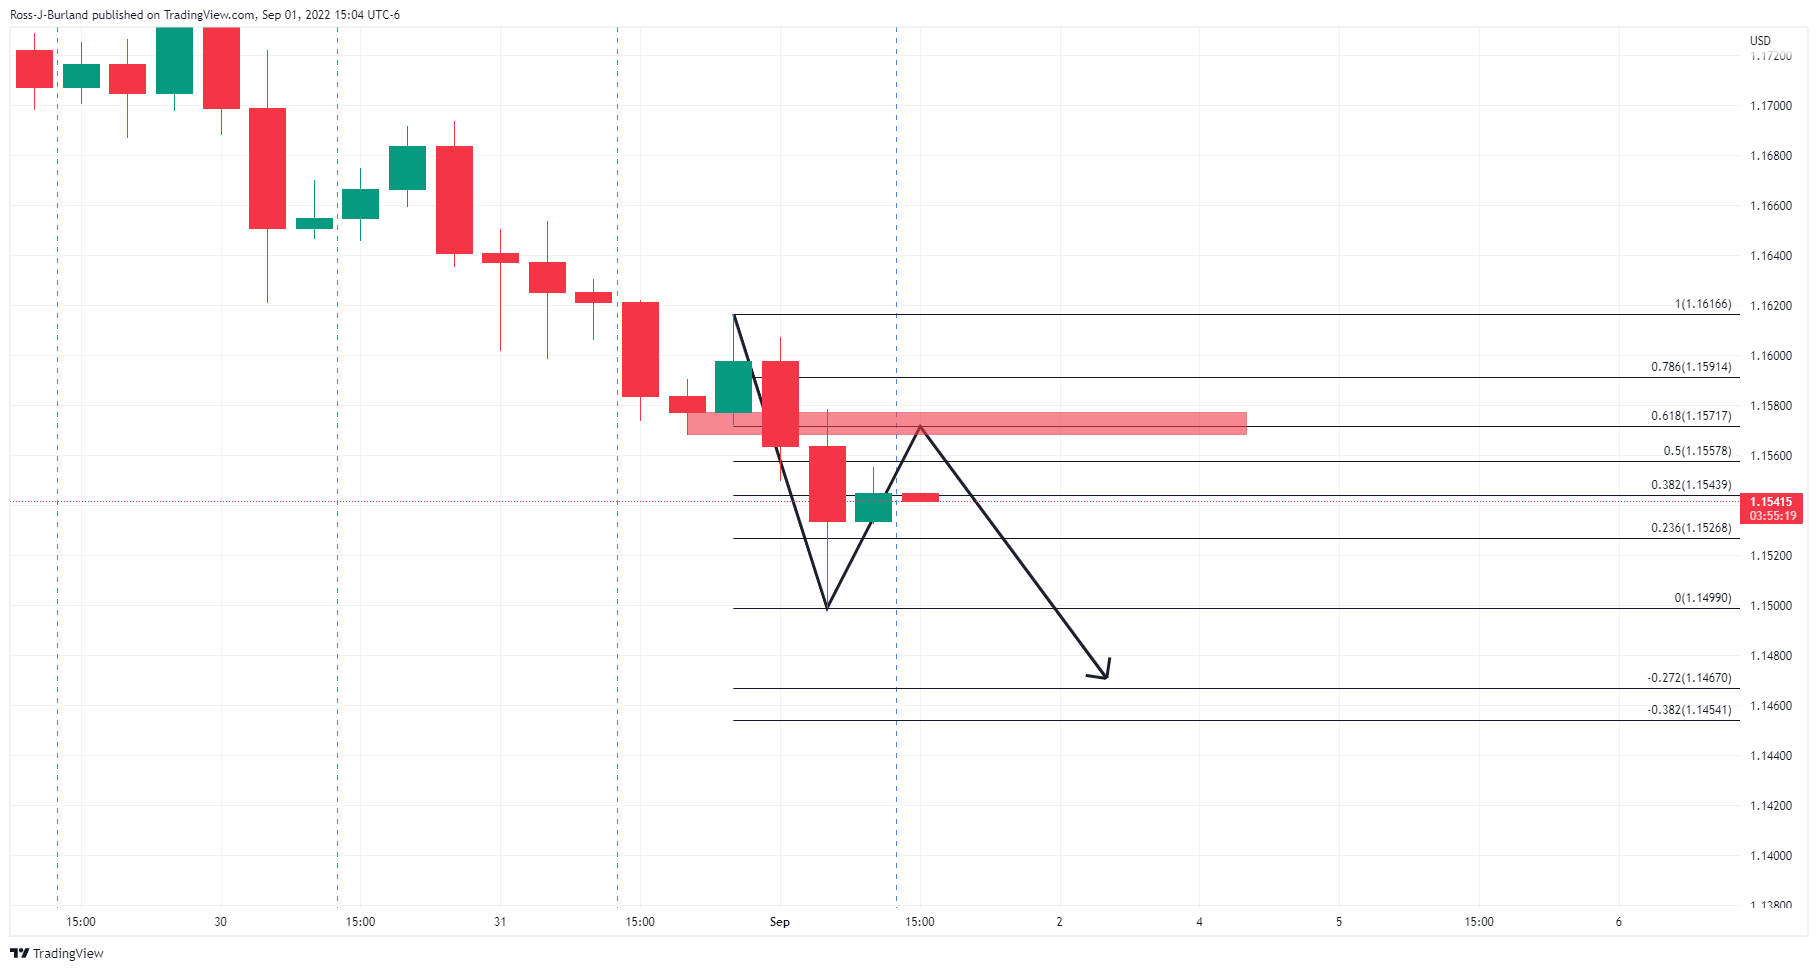
The 4-hour chart sees the price moving in towards a prior support level that currently aligns with the 61.8% Fibonacci retracement level near 1.1570 which could be targetted for the day ahead.
However, the bulls will need to get over the 61.8% ratio on the hourly time frame first or face a potential downside continuation the forthcoming sessions:
-
21:45
NZD/USD re-tested YTD lows around 0.6060 post-upbeat US economic data, ahead of NFP
- NZD/USD stumbles below 0.6100 on risk-aversion after positive US data.
- Fed odds of a 75 bps increase increased to 91%, as shown by money market futures STIRs.
- New Zealand’s Trade data and US Nonfarm Payrolls report. Eyed.
The NZD/USD slides to multi-week lows around 0.6060 on Thursday as the New York session winds down, after US data portrays solid factory activity while the labor market continues to be robust, keeping Fed policymakers “hopeful” of achieving a soft landing, despite tightening conditions.
The NZD/USD is trading below its opening price after hitting a daily high of 0.6122. Still, it fell below the 0.6100 figure on sentiment shifting sour, spurred by weaker-than-estimated China’s Caixin Manufacturing PMI, dropping towards “recessionary” territory. At the time of writing, the NZD/USD is trading at 0.6075.
Wall Street finished the Thursday session paring losses, with a late jump on US equities. Meanwhile, expectations that the US Federal Reserve will tighten 75 bps at September’s monetary policy meeting increased, with odds lying at a 92% chance, after solid US employment and ISM figures.
The US Department of Labor reported that Weekly Initial Jobless Claims for the last week, which ended on August 27, declined. Later, the Institute for Supply Management (ISM) revealed that August’s Manufacturing PMI was unchanged, at 52.3, higher than forecasts Worth noting that the Price Index sub-component decelerated from 60 to 52.5, signaling that elevated prices are getting down.
Elsewhere, the US Dollar Index, a gauge of the buck’s value, hit a 20-year high at 109.997 during the day, though at press time, it is up 0.91%, at 109.675.
The abovementioned factors were a headwind for the NZD/USD, which leaned on the dynamics of the greenback and market sentiment due to the lack of NZ economic data. Worth noting the major tested the YTD low reached on July 14, but buyers moved in, and recovered some ground.
What to watch
The New Zealand economic calendar will feature Terms of Trade, and Export Volumes, alongside Import/Export Prices. On the US front, the docket will reveal the US Nonfarm Payrolls report, alongside the Unemployment Rate and Factory Orders.
NZD/USD Key Technical Levels
-
21:23
EUR/USD is pushed to the edge of the abyss ahead of NFP
- The single currency has been thrown under a bus in a risk-off environment.
- EUR/USD now depends on the US NFP data on Friday.
EUR/USD has been offered on the day and remains on the back foot into the final hour of trade in the North American forex session. At the time of writing, the single unit is down over 1% at 0.9947 and has fallen from a high of 1.0054 to a low of 0.9910 so far on the day.
Global quities and bonds continued to decline as hawkish central bank rhetoric and a shutdown in China further roiled investor jitters, supporting the US dollar. Pessimism on the news that Chengdu has become the latest Chinese city to be locked down as Beijing continues to pursue its controversial "zero-Covid" policy weighed on risk sentiment. Beijing's drive to ensure "zero Covid" has been accused of stifling economic growth and this has added to worries over high inflation and interest rate hikes.
As for domestic data, the EU manufacturing PMI slipped further below the breakeven point to a 26-year low in August, with similar declines in Spain, Italy, and Germany. However, other data showed that the EU Unemployment rate declined slightly in July. Meanwhile, the European Central Bank is still expected to raise rates by at least 50 basis points, and perhaps more, at its next meeting on Sept. 9. Nevertheless, that has done little to support the single currency of late.
In the US, in the countdown to the US Nonfarm Payrolls data, the highlights of Thursday's busy data schedule were an unchanged reading in the ISM's Manufacturing report for August, a decline in Initial Jobless claims and a drop in the monthly layoff intention totals from Challenger.
The ISM manufacturing index held steady at 52.8 in August, with higher readings for new orders and employment and lower readings for production and prices, though all still indicated expansion. The initial and continuing claims levels continued to rise in August, but at a slower pace than in previous months. Initial jobless claims decreased by 5,000 to 232,000 in week ended Aug. 27, a third straight decline that lowered the four-week moving average by 4,000. Insured claims rose by 26,000 to 1.438 million in the week ended Aug. 20.
As for growth expectations in the US, the Atlanta Fed GDP nowcast estimate for third-quarter growth has been revised up to 2.6% from the 1.6% pace in the previous calculation on Aug. 26. The next update is scheduled for Sept. 7.
For the showdown this week, as one of the most pivotal before the September FOMC meeting, the August Nonfarm payrolls report will be out on Friday. This data could be the tipping point that will cement a 75bps hike from the Fed should the number of new jobs beat the 300k consensus estimate.
NFP expectations
The jobless rate is projected to remain unchanged at 3.5% while the labour participation rate is seen ticking up to 62.2% from 62.1% the month prior. Average hourly earnings are expected to increase by 0.4% in August after a 0.5% gain in July, but the year-over-year rate would rise to 5.3% from 5.2% in the previous month due to base effects. The average workweek is expected to remain at 34.6 hours.
''We look for payrolls to have continued to advance strongly in August (TD: 370k), but at a more moderate pace following the eye-popping July increase,'' analysts at TD Securities said. ''We look for the solid gain in employment to be reflected in another decline in the UE rate to 3.4%. We are also forecasting wage growth to slow modestly to a still robust 0.4% MoM.''
''We think the market is priced for a strong report, investors penciling in 69bp of hikes in September and a terminal rate of 3.98%. Markets are likely to react more to a weaker report.''
-
20:53
Forex Today: Dollar on the loose
What you need to take care of on Friday, September 2:
Financial markets kick-started September on the back foot as recession-related concerns were exacerbated by China announcing Chengdu, a city of roughly 21 million people, has been put on coronavirus lockdown. The American dollar surged, helped by upbeat local data and the dismal market mood.
In Europe, the focus remains on the energy crisis. The EU Commission is working on a market intervention to cap energy prices and cut electricity demand after Russia slashed gas deliveries to the Union. President Ursula Von der Leyen will speak on the matter next September 14.
Meanwhile, Russian Deputy Prime Minister Alexander Novak noted the country might increase oil production this year, supporting OPEC+ deal extension beyond 2022. At the same time, Gazprom is cutting gas provision to France, while Germany fears the company will shut down the Nord Stream 1 pipeline once again by mid-October.
The EUR/USD pair trades around 0.9950, while GBP/USD plunged to 1.1497, now trading around 1.1540. Commodity-linked currencies finished the day mixed, as AUD/USD is down to 0.6780 while USD/CAD is steady at around 1.3160. The USD/JPY pair surged to 140.22, its highest in over twenty years, now trading a handful of pips below the level.
Stocks remained under pressure, although Wall Street’s losses were moderate. The DJIA managed to post a modest intraday advance. Nevertheless, the DXY soared to a multi-year high, while government bond yields also rose.
On Friday, the focus will be on the US Nonfarm Payrolls report. The country is expected to have added 300K new jobs in August, while the Unemployment Rate is foreseen steady at 3.5%.
Top 3 Price Prediction Bitcoin, Ethereum, Ripple: What Wall Street doesn't want you to know pt.2
Like this article? Help us with some feedback by answering this survey:
Rate this content -
20:17
USD/CAD Price Analysis: Bears move in for the kill at key hourly structure
- USD/CAD bears are moving in for a test below key hourly structure.
- The weekly W-formation could be a key feature for the days ahead.
As per the prior analysis, USD/CAD Price Analysis: Bulls take on critical resistance, the price has continued to chip away at the resistance. Still, there are now higher prospects of a move lower as the following charts illustrate:
USD/CAD, daily chart prior analysis
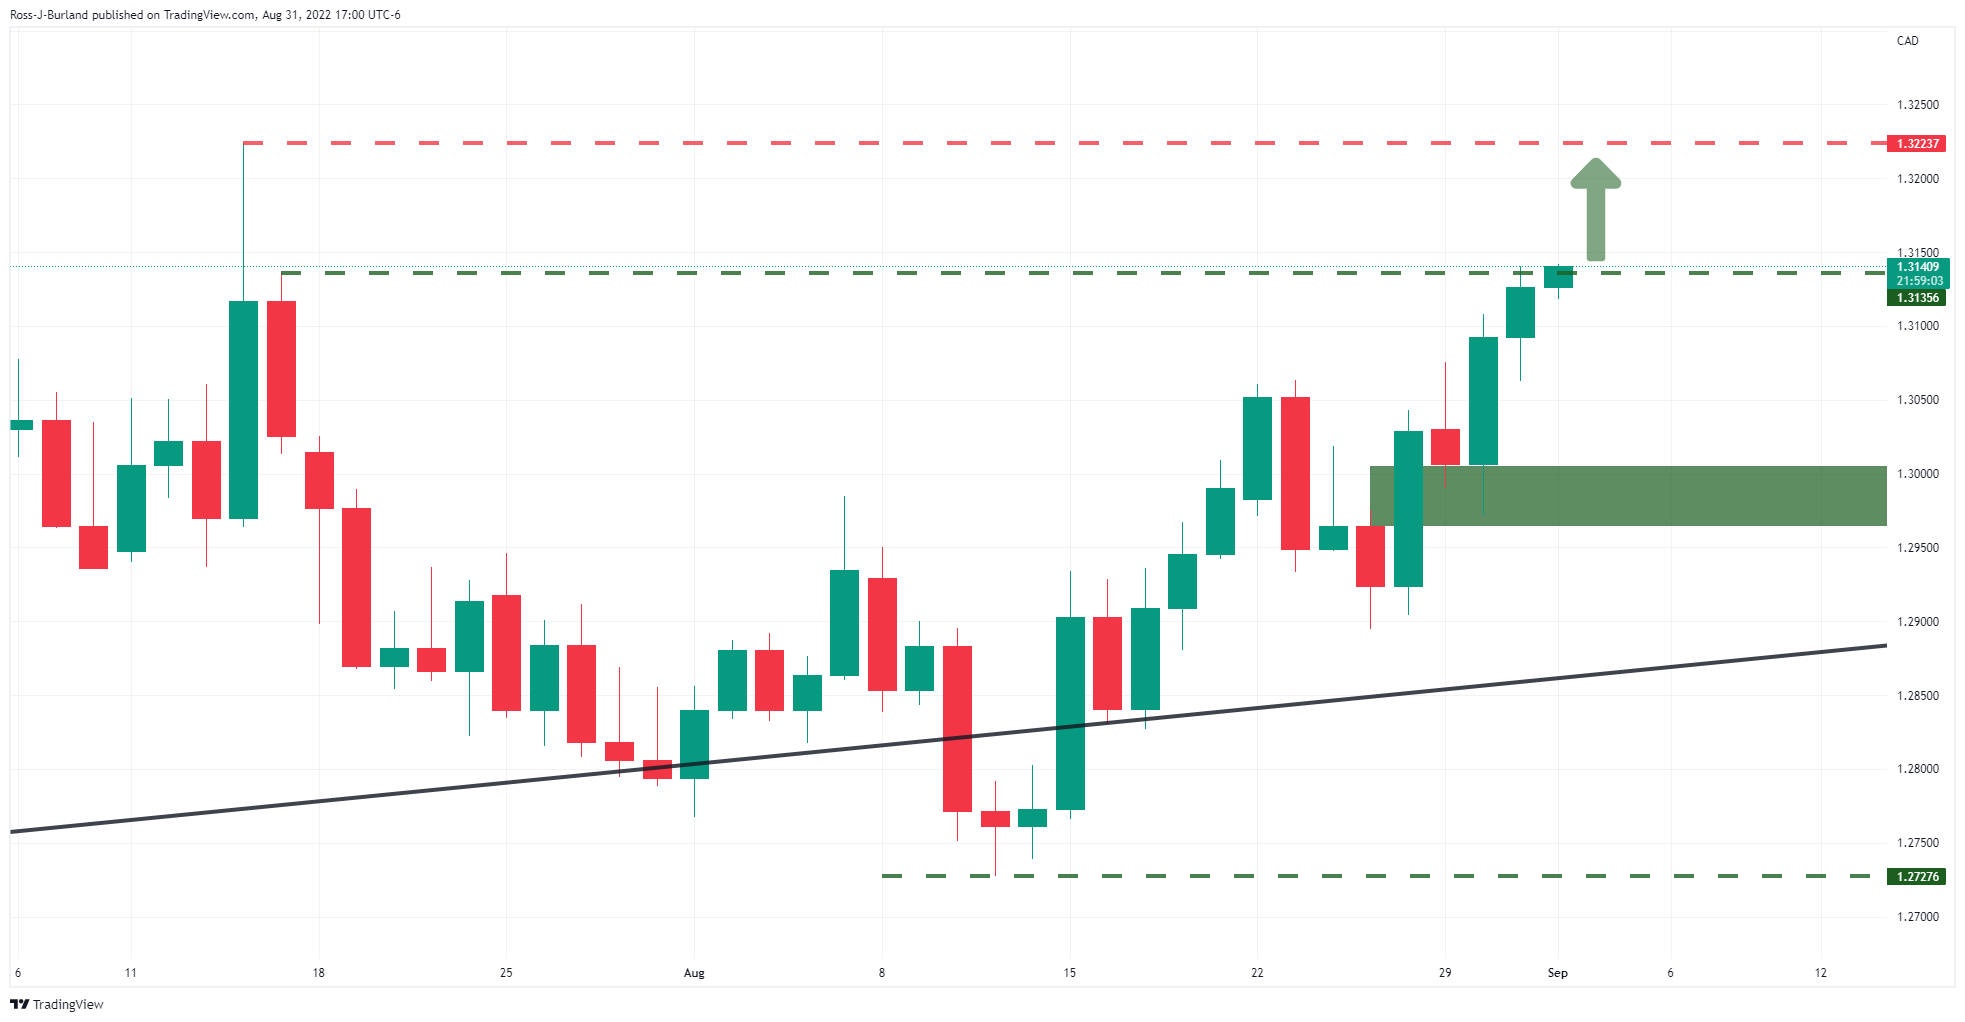
It was explained that from the daily time-frame perspective, there was still room to go until prior highs were met and the break of the last highs of 1.3135 left the bulls with the baton.
We have since seen an extension of the upside on Thursday to test above 1.3200. However, as the chart below demonstrates, the bears are attempting to take over:
USD/CAD weekly chart
The weekly chart, as its stands, leaves a bearish bias given the W-formation which is a reversion pattern. Should the bears commit at this juncture, then there will be the scope of a significant correction for days ahead forgetting the 38.25 Fibonacci retracements of the current bull leg that meets prior resistance looking left. Below there, we have the 50% and 61.8% ratios aligning with the neckline of the pattern.
USD/CAD H1 chart
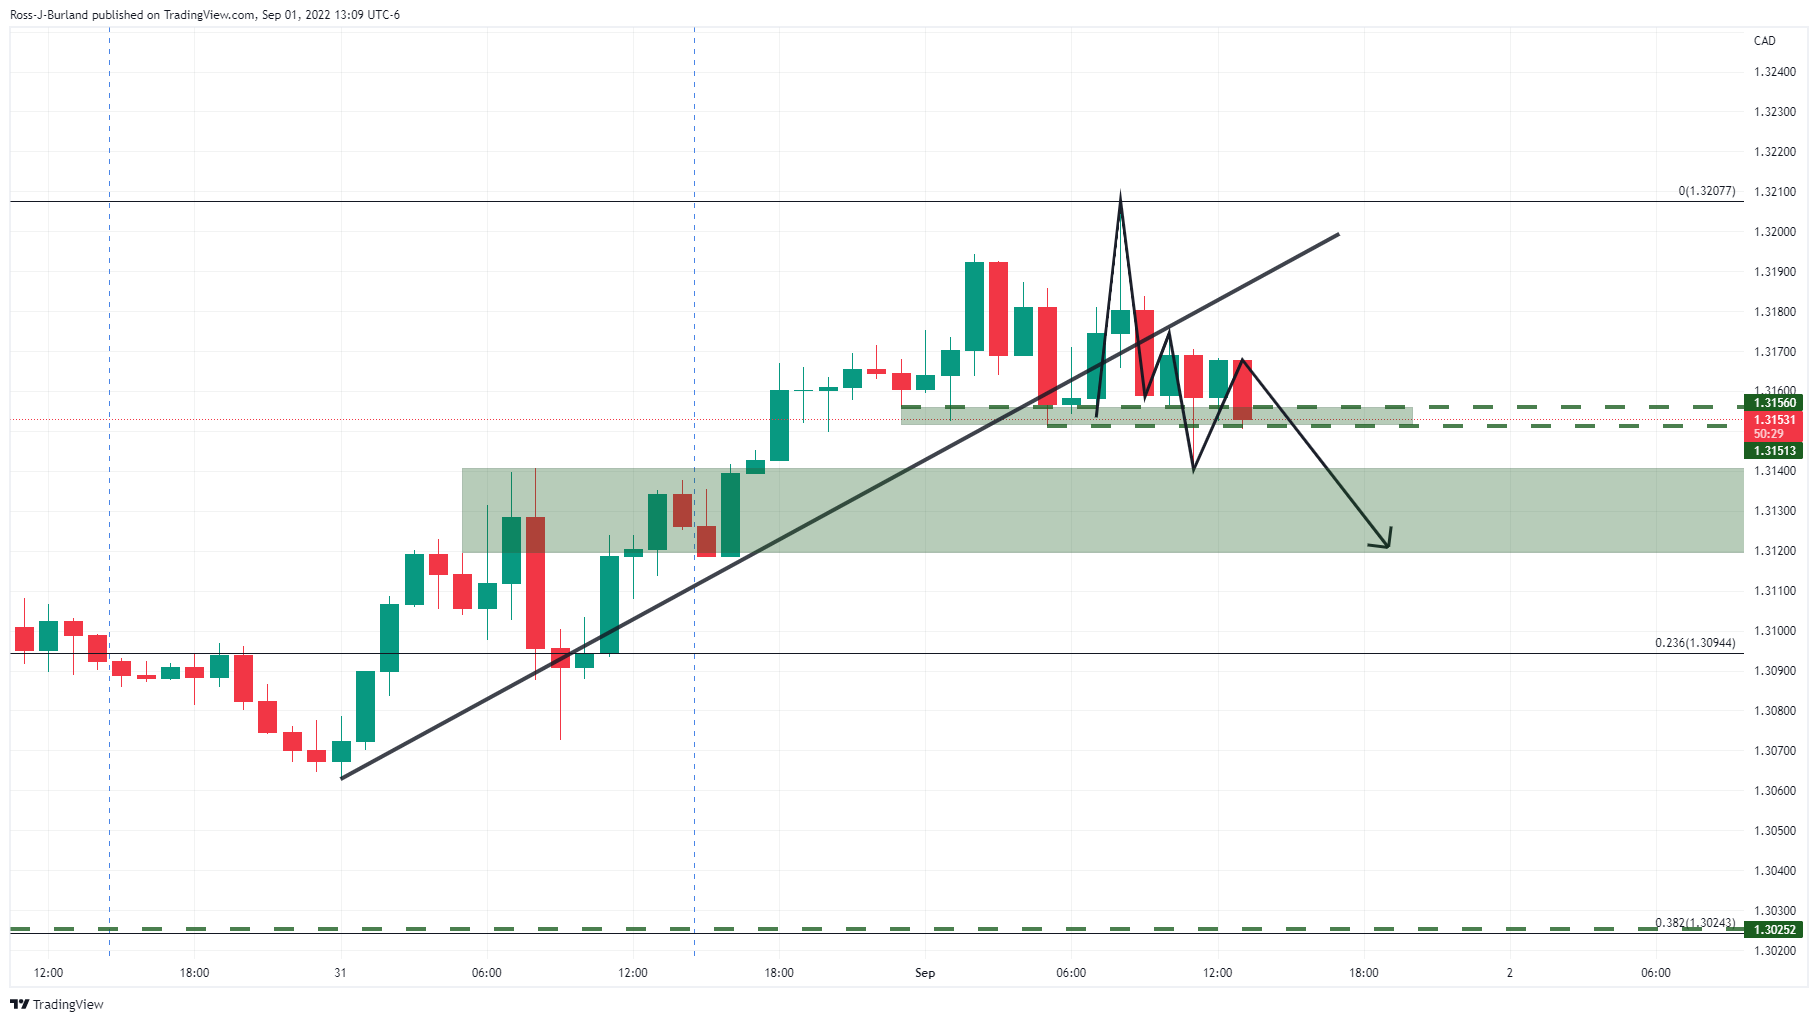
From a nearer-term perspective, the hourly chart shows that the price is attempting a bearish breakout below the structure at 1.3150/56. A break here opens risk of a breakout to the downside as per the weekly chart above.
-
19:19
WTI bears move in for fresh lows below critical weekly structure
- Oil is marking fresh lows on the day as commodities take a hit on China's covid and lockdown risks.
- Global growth concerns and the Iran deal are weighing on the black gold.
Oil prices are carving out further downside on Thursday as a combination of the lockdowns in China and concerns over global growth take hold amid fading supply concerns. At the time of writing, the black gold is trading lower by some 3.1% having hit a fresh low for the session of $86.04bbls West Texas Intermediate (WTI).
West Texas Intermediate tumbled from a high of $89.63 on the day as Pessimism over demand took hold following news that Chengdu has become the latest Chinese city to be locked down as Beijing continues to pursue its controversial "zero-Covid" policy. Beijing's drive to ensure "zero Covid" has been accused of stifling economic growth and this has added to worries that high inflation and interest rate hikes are denting fuel and oil demand while supplies are expanding incrementally.
Factory activity slumped in August as China's zero-COVID curbs and cost pressures continued to hurt businesses. The PMIs released by CFLP (China Federation of Logistics & Purchasing) showed a second consecutive month of contraction in the manufacturing sector while the non-manufacturing outlook also moderated in August.
''China’s growth forecasts are poised for further downgrade as hopes for a turnaround in the coming months fade. We thus revise down our 2022 GDP growth forecast for China to 3.3% from 4.1% with 3Q22 at 3.4% YoY and 4Q22 at 4.5% YoY,'' analysts at UOB explained.
Commodity prices, in general, have moved lower this week following last Friday's hawkish speech from Federal Reserve chair Jerome Powell. He advocated for ongoing rate hikes until inflation is under control despite the costs to growth and jobs in the economy.
However, the price of oil is also falling as markets price the rising odds of an imminent resolution on the Iran file.''Wild gyrations in our gauge of energy supply risks, which extracts information from market prices, are overwhelmingly being driven by the potential for an Iran deal. This is the silver bullet that can kill the bull market in petroleum products, as it would immediately build the world's spare capacity, which in turn allows other producers to play catch-up in building a spare capacity buffer,'' analysts at TD Securities explained.
WTI technical analysis

The price is breaking a key structure level around 89.00 on the weekly chart and a breakout is set to target the $85.39 prior swing highs on the downside. This would be leaving behind an M-formation that could see the price retest the $89 level before a full breakdown into the $70s would occur for the rest of the year.
-
19:19
AUD/USD grinds lower, below 0.6800 ahead of US NFP
- AUD/USD continues to trade in the red, so far down 1.90%.
- Worldwide factory activity slowed down, except for the US, which is still in expansionary territory.
- AUD/USD: It could form an inverse head-and-shoulders if buyers keep prices above 0.6881; otherwise, 0.6402 is the next target.
AUD/USD falls to seven-week lows on Thursday amidst a risk-off impulse, while the US dollar, as shown by a measure of the greenback’s value against a basket of peers, namely the US Dollar Index, rises to 20-year highs around 109.997. At the time of writing, the AUD/USD exchanges hands at 0.6786.
US equities remain downbeat, a reflection of investors’ mood. US economic data led by the ISM Manufacturing PMI for August, which measures factory activity in the US, rose by 52.3, aligned with the previous month’s readings, above estimates, bolstering the greenback to new YTD highs. Also, US unemployment claims, known as Initial Jobless Claims, rose by 232K, lower than the 248K foreseen by analysts.
The AUD/USD plunged from around 0.6830 to the day’s lows at 0.6771. US employment indicators cement the Fed’s intentions of hiking rates aggressively at the September meeting.
Another factor weighing on risk sentiment and the Australian dollar is China’s Covid-19 lockdowns in Chengdu, which put 21.2 million residents in lockdown. Furthermore, China’s Caixin PMI for August. Contracted, fueling expectations that its economic slowdown could spread worldwide, a sign that could trigger a global recession.
What to watch
An absent Australian economic docket would leave AUD/USD traders leaning on US dollar dynamics. The US calendar will feature August’s Nonfarm Payrolls report, alongside the Unemployment Rate, and Average Hourly Earnings
AUD/USD Price Analysis: Technical outlook
The AUD/USD extended its losses for the third straight day, approaching a five-month-old downslope trendline, broken around July 27, which would turn support. If AUD/USD buyers stop the losses above the YTD low at 0.6681, an inverse head-and-shoulders chart pattern could form. Otherwise, the downtrend would resume, and AUD/USD sellers will target the May 15, 2020, lows at 0.6402.
-
19:00
Brazil Trade Balance came in at 4.2B, above expectations (3.8B) in August
-
17:46
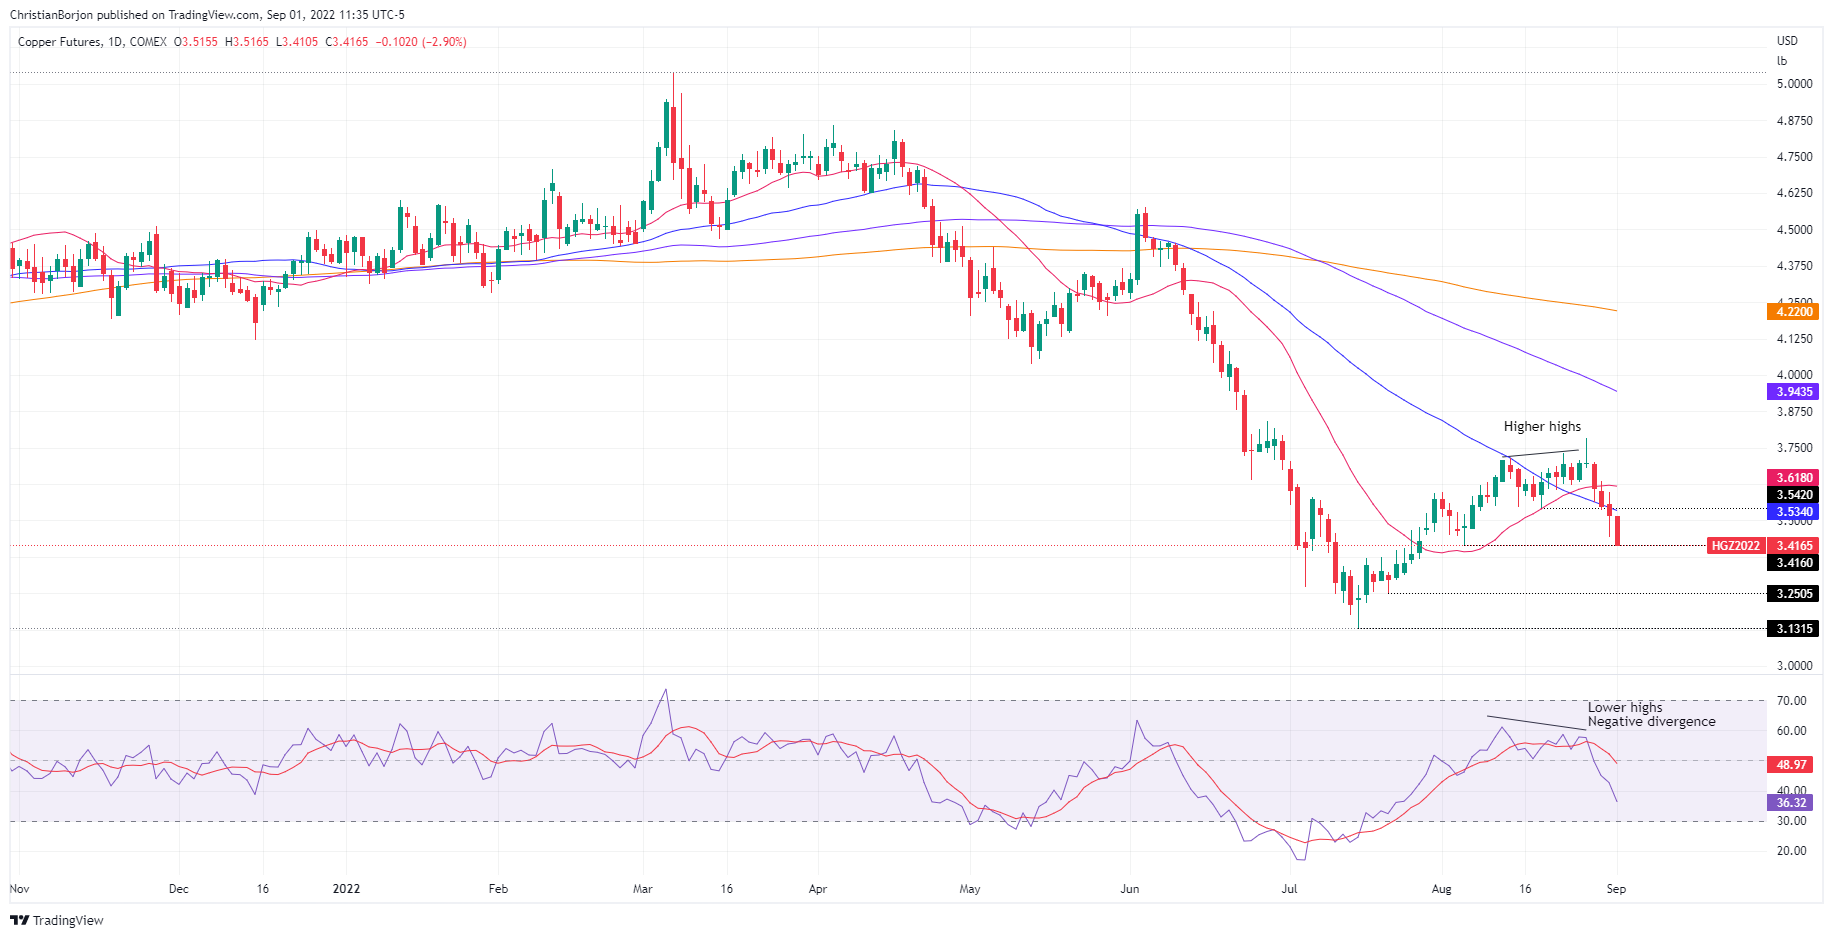
Copper Price Analysis: Sinks almost 3%, eyeing a fall towards $3.2505 ahead of YTD lows
- Copper futures are nosediving due to fears of a worldwide economic slowdown, weighed by China’s PMI and other lockdowns in a 21.1 million city.
- Negative divergence in Copper’s daily chart, alongside fundamental, sent prices below the 20 and 50-DMA.
Copper futures are dropping to two-month lows at $3.4165, down almost 3%, on fears that China’s manufacturing activity contracted for the first time in three months, alongside expectations of a US economic deceleration prompted by the US Federal Reserve tightening monetary policy conditions.
Additionally, broad US dollar strength, alongside newswires that China’s Chengdu announced a lockdown of its 21.2 million residents, is a headwind for the red metal.
Also read: Copper drops from two-month highs due to global economic slowdown, speculators’ shorts
Copper Price Analysis: Technical outlook
The Copper daily chart depicts the pair as neutral-to-downward biased. It’s worth noting that the last copper article that I wrote noted that “the Relative Strength Index (RSI) recorded a successive series of lower highs, contrary to price action, meaning that prices are about to edge lower.” Since then, Copper tumbled below the 20 and 50-day EMAs, from around $3.6970. to $3.4105.
If Copper achieves a daily close below the August 4 daily low at 3.4160, it could send the red metal towards the July 21 swing low at $3.2505, followed by the YTD low at $3.1315. On the flip side, if Copper buyers reclaim the 50-day EMA at $3.6340, a re-test of the 20-day EMA at $3.6175 is on the cards.
-
17:03
USD/INR: Risks of crossing above 80.000 remain – MUFG
Analysts at MUFG Bank forecast the USD/INR pair will trade at 80.50 by the end of the third quarter, at 81.000 by the end of the year and at 80.50 by the first quarter of next year.
Key Quotes:
“The Indian rupee extended its losses against the US dollar in August, weighed down by US dollar strength as EUR/USD fell below parity as well as a surge in oil buying by local oil importers when oil prices dipped. USD/INR remained largely below the 80.000 mark in August, in part due to suspected RBI intervention as reported by newswires and a strong resurgence of net inflows into both Indian equities and bonds.”
“Renewed optimism in Indian risk assets may reflect market expectations of a slower pace of rate hikes by the RBI, further deceleration in India’s headline CPI, and the potential inclusion of Indian government bonds into the JPM GBI-EM Index for the first time. If this trend persists, net inflows into Indian equities could help dampen downward pressure on the rupee stemming from extended US dollar strength and India’s widening trade deficits.”
“India’s high reliance on China for imported raw and intermediate materials used as manufacturing inputs is also likely to keep India’s non-energy trade deficit elevated.”
-
16:57
ECB cannot disappoint at next week’s meeting – Rabobank
The European Central Bank (ECB) will have its monetary policy next week. Analysts at Rabobank now expect a 75 basis points rate hike, but risk of 50bp remains significant.
Key Quotes:
“The hawkish shift in the ECB’s communication has led to a sharp repricing in EUR money markets, and we have subsequently changed our near-term call for a 75bp hike next week. However, Mrs. Lagarde will stress that this is not a precursor to more jumbo hikes.”
“Inflation expectations were already a key concern at the previous ECB meeting, and with yet another inflation surprise the risk of de-anchoring is growing. The ECB has to show that it will do what is necessary to return to 2% inflation, or it risks the much costlier challenge of having to re-anchor expectations. This means the ECB cannot disappoint at next week’s meeting, lest it risks giving off the impression that growth risks do still outweigh inflation in their decision making. At current market pricing, this means that the ECB has to deliver a 75bp hike.”
-
16:56
Gold Price Forecast: XAU/USD plummets to new two-month lows below $1690
- Gold price is plunging during the week by almost 2.50%.
- The US Dollar Index rises to 2-decade highs, 109.977, underpinned by higher US Treasury yields.
- Robust US data justifies a super-size 75 bps rate hike by the Fed.
Gold price drops sharply to two-month lows, under the $1700 figure, after upbeat US economic data justifies the Federal Reserve’s intentions to hike rates 75 bps in the September meeting. At the time of writing, the XAU/USD fluctuates around the $1688-$1690s area, below its opening price.
Global equities remain under pressure while the US dollar rises to 20-year highs, per the US Dollar Index. Positive US economic data, led by S&P Global and ISM Manufacturing PMIs for August, reinforced what Fed officials expressed: the US economy remained strong. The Institute for Supply Management (ISM) reported that the PMI was unchanged at 52.8, above 51.9 expectations. Meanwhile, the S&P Global PMI was at 51.5, above forecasts and the previous reading of 51.3.
Earlier, the US Department of Labor revealed that unemployment claims for the week that ended on August 27 increased by 232K, less than the 248K estimated.
Gold traders should be aware that US employment data released during the week support the idea of the Fed going for a 75 bps rate hike for the third straight meeting. JOLTs data, reporting 11 million vacancies, unemployment claims dropping, and US ISM manufacturing PMI comments about hiring increments the Fed’s soft landing possibilities.
Elsewhere, the US Dollar Index, a gauge of the buck’s value against a basket of peers, climbs 0.94%, refreshing 2-decade highs at 109.716, underpinned by high US T-bond yields. Also, a headwind for the yellow metal is the US 10-year Treasury Inflation-Protected Securities (TIPS), a proxy for real yields, which is rising eight bps, to 0.796%, after hitting a daily high at 0.823%.
What to watch
The US economic docket will feature the US Nonfarm Payrolls for August on Friday. Economists predict that the economy will add 298K jobs, and the Unemployment Rate will remain at 3.5%.
Gold Key Technical Levels
-
16:47
US: Atlanta Fed GDPNow for Q3 rises to 2.6%
According to the Federal Reserve Bank of Atlanta's GDPNow model, the US economy is expected to grow at an annualized rate of 2.6% in the third quarter, up from 1.6% in the previous estimate.
"After this morning’s construction spending release from the US Census Bureau and this morning’s Manufacturing ISM Report On Business from the Institute for Supply Management, the nowcasts of third-quarter real personal consumption expenditures growth and third-quarter real gross private domestic investment growth increased from 2.0% and -5.4%, respectively, to 3.1% and -3.5%, respectively," Atlanta Fed explained in its publication.
Market reaction
The US Dollar Index showed no immediate reaction to this report and was last seen rising nearly 1% on the day at 109.75.
-
16:37
US: August ISM Manufacturing offers plenty to like for Fed officials – Wells Fargo
The ISM Manufacturing PMI report showed better-than-expected numbers, helping dollar's rally. According to analysts at Wells Fargo, the report is very welcome by policymakers at the Federal Reserve. They point out the prices paid measure fell sharply to a more than two-year low, while the orders and employment components both returned to expansion territory.
Key Quotes:
“Manufacturing output rose 0.7% in July, the biggest monthly increase since March as motor vehicles and parts production surged 6.6% after back-to-back monthly declines in May and June. That had been presaged somewhat by shorter wait-times revealed in the trend decline in the supplier deliveries component of the ISM index and incipient signs of improvement with supply chains.”
“The ISM index was unchanged in August at 52.8, the slowest pace of expansion since June 2020. Still, the outcome was better than the 51.8 that had been expected by the consensus. Of particular interest to financial markets is the fact that the employment component rose 4.3 points to 54.2. That is the best number since March for this manufacturing job-market bellwether and increases the prospect of a fifth-straight upside surprise versus the consensus in tomorrow's August jobs report.”
-
16:33
United States 4-Week Bill Auction: 2.47% vs 2.31%
-
16:21
GBP/USD prints fresh 2-year lows below 1.1500 as US dollar soars
- US dollar strengthens following ISM Manufacturing PMI, ahead of NFP.
- GBP/USD drops for the fifth consecutive day.
- The multi-decade low waits at 1.1409 (March 2020).
A stronger US Dollar pushed GBP/USD to levels under 1.1500 for the first time since March 2020. The greenback is rising sharply following upbeat US economic data, amid risk aversion and higher yields. The pair bottomed at 1.1497 and then rebounded toward 1.1550, trimming losses.
The US Dollar Index is at the highest level since 2002, up 1% for the day. The dollar was trading in positive ground and rose further following the US ISM Manufacturing August report that showed better-than-expected numbers, including a recovery in the employment index and a slowdown in prices. Earlier, the weekly jobless claims report also came in above expectations. Attention now turns to the Non-farm payrolls report to be released on Friday.
The economic figures weighed on the demand for Treasuries sending US yields further to the upside. The US 10-year yield stands at 3.28%, a level last seen in June.
The last leg to the downside in GBP/USD was driven by the rally of the dollar across the board. Cable is falling for the fifth consecutive day on Thursday headed toward the lowest weekly close since 1985.
Despite showing some signs of stabilization, like a retreat in EUR/GBP, the pound remains among the weakest currencies of the G10 affected by the deteriorating outlook for the UK economy. Also market participants show concerns about the next prime minister. Liz Truss is holding the lead in the polls over Rishi Sunak. The winner of the Tory will be announced on Monday and will succeed PM Boris Johnson.
Despite the turmoil, there are still expectations of a 75 basis points rate hike from the Bank of England in September to curb inflation that, according to some a Goldman Sachs reports could reach 22% next year.
Technical levels
-
15:50
EUR/USD plummets below 0.9920 post upbeat US ISM/Jobs data justify Fed 75 bps hike
- EUR/USD collapses almost 1% after upbeat US economic data.
- The US ISM Manufacturing PMI shows the US economy remains in expansion territory.
- Money market futures odds of a 75 bps rate hike by the Fed lie at 75%.
EUR/USD breaks below parity, extending its losses after hitting on Wednesday a weekly high at 1.0079, but better-than-expected US S&P Global and ISM Manufacturing PMI further cement the case for a Fed’s jumbo 75 bps rate hike in the September meeting.
The EUR/USD opened near the highs of the day at 1.0050s but dived below the parity on the release of upbeat US economic data, which put recession fears in the backseat. Therefore, the EUR/USD trades around the day’s lows at 0.9910s, below its opening price.
EUR/USD plunges on goodish US economic data
Risk aversion keeps global equities tumbling. The US ISM Manufacturing report for August came aligned with July’s figure at 52.8, topping the street’s estimates of 51.9- Even though the data was positive, it’s the second lowest reading since June 2020. The Price Index sub-component edged 7.5 percentage points lower, to 52.5 from 60, portraying the effect of the Federal Reserve tightening policy.
Timothy R. Fiore, Chair of the ISM, “The US manufacturing sector continues expanding at rates similar to the prior two months,” and commented that new orders returned to expansion levels. He added that companies continued to hire at strong rates in August, with few indications of lay-offs.
Coincidentally, the US Initial Jobless Claims for the week ending on August 27 rose by 232K, lower than estimates of 248K, as the Department of Labor reported.
For two consecutive days, US employment data reinforces the Fed’s thesis that the US, even though in a technical recession, as shown by the GDP, the economy is strong. Wednesday’s JOLTs report, with vacancies above 11 million, alongside unemployment claims diminishing and ISM Manufacturing PMI hiring comments, could be a prelude to a solid US Nonfarm Payrolls report on Friday.
On Friday, the US Bureau of Labor (BLS) is expected to unveil additional employment data. Economists predict that the economy will add 298K jobs, and the Unemployment Rate will remain at 3.5%.
Meanwhile, expectations for a 75 bps rate hike in the September Federal Reserve monetary policy meeting pointed to a 75% chance of such an increase.
During the European session, most European countries’ Manufacturing PMIs revealed by S&P Global were in contractionary territory, except for France. German Retail Sales YoY exceeded estimates of -6.6%, dropped by -2.6%, while the EU’s unemployment rate was unchanged.
What to watch
The EU’s economic docket will feature the German Trade Balance alongside the common bloc Producer Price Index (PPI). On the US front, the US Nonfarm Payrolls report for August, alongside Unemployment Rate, will shed some light on the direction of the EUR/USD.
EUR/USD Key Technical Levels
-
15:43
USD/JPY hits levels above 140.00 for the first time since 1998
- US Dollar rises sharply across the board on higher yields, and upbeat US data.
- Japanese yen manages to hold steady versus other currencies amid risk aversion.
- USD/JPY holds bullish tone, but unable to consolidate above 140.00.
The USD/JPY reached levels above 140.00 for the first time since August 1998. The pair peaked at 140.12 and then pulled back to 139.70, amid an increase in volatility. A stronger US dollar across the board boosted the pair.
Another upbeat economic report from the US triggered more losses in Treasuries and boosted the dollar. The US Dollar Index is at 109.78, a level not seen in 20 years.
The US 10-year yield rose to 3.28%, the highest since June. The last report was the ISM Manufacturing which remained at 52.8 in August against expectations of a decline to 52. The Employment Index of the report jumped from 49 to 54.4. On Friday, the US official employment report is due, with market consensus suggesting an increase of 300K in payrolls.
Despite the rally in USD/JPY to fresh multi-decade highs the Japanese yen strengthened versus other currencies amid risk aversion. In Wall Street, the Dow Jones is falling by 0.75% and the Nasdaq drops by 1.70%.
Technical levels
-
15:35
USD/CAD to advance nicely towards next resistance at 1.3220 – Scotiabank
The USD/CAD’s grind higher extended to near 1.32. Economists at Scotiabank expect the pair to continue its advance.
Key support is 1.3075
“There is no letup in the USD’s broader drive higher on the short run charts and broader (daily, weekly) trend strength signals are aligned with intraday oscillators which tilt risks clearly towards more USD gains and limited losses in the short run at least.”
Support is 1.3140/50 intraday. Key support is 1.3075.”
“Resistance is 1.3220 and 1.3330.”
-
15:32
GBP/USD: There is little in terms of clear support ahead of the 2020 spike low at 1.1415 – Scotiabank
GBP/USD has nosedived to 1.15. Economists at Scotiabank expect the pair to remain under significant downside pressure.
Price action is weak and unrelenting
“Against the gloomy domestic context, defined by higher energy costs and the cost-of-living crisis that is bearing down on activity and the economic outlook, more equity market volatility can only mean more pressure on the GBP in a broad sense.”
“We are trading close to our year-end forecast of 1.15 and there are no clear reasons at this point to expect a significant improvement in the outlook.”
“Price action is weak and unrelenting; trend oscillators are aligned bearishly for the GBP across short, medium and long run DMIs and there is little in terms of clear support for the pound ahead of the 2020 spike low at 1.1415.”
-
15:30
United States EIA Natural Gas Storage Change came in at 61B, above forecasts (58B) in August 26
-
15:11
NFP Preview: Forecasts from eight major banks, employment growth still strong
The US Bureau of Labor Statistics (BLS) will release the August jobs report on Friday, September 2 at 12:30 GMT and as we get closer to the release time, here are the forecasts by the economists and researchers of eight major banks regarding the upcoming employment data.
Expectations are for a 300K rise in Nonfarm Payrolls following the 528K increase in July. Meanwhile, the Unemployment Rate is expected to remain steady at 3.5%.
Commerzbank
“We expect job growth in August to be lower than in July, but still in the range of previous months at a still high 375K and the unemployment rate to remain at just 3.5%. The labor market would thus remain tight, signaling to the Fed that further significant rate hikes are necessary to curb inflation.”
Westpac
“Come August, we again expect a materially softer outcome for nonfarm payrolls (250K), while recognising that risks remain to the upside. For the next few months, the unemployment rate can hold around 3.5%; but from the end of the year, it is likely to begin to trend higher as employment growth slows and participation rises as households seek relief from the loss of real spending capacity.”
ING
“A 250K would still be very respectable and will certainly keep the Fed in hiking mode. With the unemployment rate set to remain at 3.5% and wages continuing to push higher we favour a 50 bps hike on 21 September rather than 75 bps. However, should the economy add substantially more jobs, say 350K+, and the wage number posts a second consecutive 0.5% month-on-month increase, or higher, then it could swing the argument in favour of 75 bps.”
TDS
“We expect the series to have continued to advance strongly in August (370K), but at a more moderate pace following the eye-popping 528K increase registered in July, which was a five-month high. We look for the solid gain in employment to also be reflected in another decline in the unemployment rate to 3.4% (second consecutive one-tenth decline). We are assuming an improvement in the participation rate to 62.2% after falling to 62.1% in July. We are also looking for wage growth to slow modestly to a still robust 0.4% MoM after registering an unexpected 0.5% jump last month. The MoM leap should result in a one-tenth increase in the YoY measure to 5.3% in August.”
SocGen
“We project a 300K increase for August non-farm jobs. A gain near our forecast of 300K implies either a return of workers back into the workforce or further declines in the unemployment rate. We look for the unemployment rate to hold steady at 3.5%. The return of workers should lift the labor force participation rate from the 62.1 level posted for July.”
NBF
“Payroll growth may have come down to just 75K. The household survey is expected to show a stronger gain, a development which could leave the unemployment rate unchanged at 3.5%, assuming the participation rate increased one tick to 62.2%.”
CIBC
“After a stellar performance in July, the US labor market is poised for a slowdown in August, in line with the cooling in interest-sensitive sectors. The likely creation of 250K jobs would still be a healthy print, however, and that could leave the unemployment rate at a tight 3.5%, assuming some increase in labor force participation. We expect hiring to slow ahead as higher interest rates weigh on activity, something that is a precursor for the Fed to slow the pace of rate hikes. Market impact. We’re below the consensus which could be negative for the USD and see bond yields fall.”
Citibank
“Following a significant upside surprise to nonfarm payrolls in July, we expect a more moderate increase of 305K in August, with mostly balanced risks. Overall, the trend of job growth is likely to slow into the end of the year and 2023 as demand for labor moderates. We expects a 0.4% MoM increase in average hourly earnings in August, a modestly softer increase than in July and the base case is for the unemployment rate to fall further to 3.4% in August after a decline in July to 3.5%.”
-
15:05
US: ISM Manufacturing PMI unchanged at 52.8 in August vs. 52 expected
- US ISM Manufacturing PMI stayed unchanged at 52.8 in August.
- US Dollar Index climbed to a fresh multi-decade high after the data.
The ISM Manufacturing PMI arrived at 52.8 in August, showing that the business activity continued to expand at the same pace as it did in July. This data came in better than the market expectation of 52.
Key takeaways
"The New Orders Index registered 51.3%, 3.3 percentage points higher than the 48% recorded in July."
"The Production Index reading of 50.4% is a 3.1-percentage point decrease compared to July's figure of 53.5%."
"The Prices Index registered 52.5%, down 7.5 percentage points compared to the July figure of 60%; this is the index's lowest reading since June 2020 (51.3%)."
"The Backlog of Orders Index registered 53%, 1.7 percentage points above the July reading of 51.3%".
"After three straight months of contraction, the Employment Index expanded at 54.2%, 4.3 percentage points higher than the 49.9% recorded in July."
Market reaction
The US Dollar Index extended its daily rally after this data and was last seen trading at its strongest level in nearly two decades at 109.68.
-
15:01
United States ISM Manufacturing Prices Paid below forecasts (55.5) in August: Actual (52.5)
-
15:00
United States Construction Spending (MoM) below forecasts (-0.1%) in July: Actual (-0.4%)
-
15:00
United States ISM Manufacturing PMI above expectations (52) in August: Actual (52.8)
-
15:00
United States ISM Manufacturing New Orders Index above forecasts (48.5) in August: Actual (51.3)
-
15:00
United States ISM Manufacturing Employment Index came in at 54.2, above forecasts (49) in August
-
14:57
AUD/USD remains depressed near multi-week low amid stronger USD, risk-off mood
- AUD/USD remains depressed near a multi-week low and is pressured by a combination of factors.
- Hawkish Fed expectations, elevated US bond yields lift the USD back closer to a two-decade high.
- The risk-on mood further underpins the safe-haven buck and weighs on the risk-sensitive aussie.
The AUD/USD pair struggles to capitalize on its intraday bounce from sub-0.6800 levels, or the lowest level since June 18 and remains depressed through the early North American session. The pair is currently placed around the 0.6820 region and seems vulnerable to prolonging the recent descending trend witnessed over the past three weeks or so.
The US dollar regains positive traction on Thursday and inches back closer to a 20-year peak touched earlier this week amid hawkish Fed expectations. The markets seem convinced that the US central bank will stick to its aggressive policy tightening path to tame inflation and have been pricing in a 75 bps rate hike move in September. This remains supportive of a further rise in the US Treasury bond yields and continues to underpin the greenback, which, in turn, is seen exerting downward pressure on the AUD/USD pair.
In fact, the yield on the 2-year US government bond, which is highly sensitive to Fed rate hike expectations, hits a 15-year high. Apart from this, better-than-expected US Weekly Initial Jobless Claims data and the prevalent risk-off environment offers additional support to the safe-haven buck. The market sentiment remains fragile amid growing worries about a deeper global economic downturn. The fears were further fueled by Thursday's disappointing release of the Caixin/Markit Chinese Manufacturing PMI, which fell to 49.5 in August.
Furthermore, economic headwinds from fresh COVID-19 lockdowns temper investors' appetite for perceived riskier assets. This is evident from a generally weaker tone around the equity markets, which further contributes to the offered tone surrounding the risk-sensitive aussie. The fundamental backdrop suggests that the path of least resistance for the AUD/USD pair is to the downside and any attempted recovery could be seen as a selling opportunity. Traders now look to the US ISM Manufacturing PMI for short-term opportunities.
The focus, however, remains glued to the closely-watched US monthly employment details, due for release on Friday. The popularly known NFP will provide a fresh insight into the economy's health in the face of rising rates and stubbornly high inflation. This, in turn, will play a key role in influencing the near-term USD price dynamics and help determine the next leg of a directional move for the AUD/USD pair.
Technical levels to watch
-
14:51
US: S&P Manufacturing PMI declines to 51.5 (final) in August vs. 51.3 expected
- US S&P Manufacturing PMI edged lower to 51.5 in August.
- US Dollar Index continues to stretch higher toward 109.50.
The business activity in the US manufacturing sector expanded at a softer pace in August than it did in July with the S&P Manufacturing PMI falling to 51.5 from 52.2. This print came in slightly higher than the flash estimate and the market expectation of 51.3.
Commenting on the data, "US factory production was down for a second month running in August, with demand for goods having now fallen for three straight months amid the ongoing impact of soaring inflation, supply constraints, rising interest rates and growing economic uncertainty about the economic outlook," Chris Williamson, Chief Business Economist at S&P Global Market Intelligence, said.
Market reaction
The US Dollar Index preserves its bullish momentum after this data and was last seen gaining 0.65% on a daily basis at 109.39.
-
14:45
United States S&P Global Manufacturing PMI registered at 51.5 above expectations (51.3) in August
-
14:41
USD/TRY finally reaches 18.20 and beyond, new 2022 highs
- USD/TRY remains bid and advances above 18.20.
- Türkiye Manufacturing PMI improved to 47.40 in August.
- Markets’ attention remains on the CPI release next week.
The Turkish lira extends its march south and encourages USD/TRY to print fresh 2022 peaks above the 18.20 level on Thursday.
USD/TRY: The hunt for the all-time high at 18.25
USD/TRY posts gains for the second straight session on Thursday, this time surpassing the 18.20 level and recording fresh YTD highs. It is worth noting that the lira loses nearly 38% vs. the dollar so far this year and starts the ninth consecutive month with gains.
In the meantime, further strength in the dollar, which in turn remains propped up by expectations of extra tightening by the Federal Reserve in its battle to tame inflation, continues to underpin the relentless move higher in the pair.
In the Turkish calendar, the Manufacturing PMI improved to 47.40 in August (from 46.90). Despite the better reading, the manufacturing sector still navigates in the contraction territory (<50).
What to look for around TRY
The upside bias in USD/TRY remains unchanged and approaches the all-time high around 18.25. The uptrend in spot has been intensified following the unexpected interest rate cut by the CBRT on August 18.
In the meantime, price action around the Turkish lira is expected to keep gyrating around the performance of energy and commodity prices - which are directly correlated to developments from the war in Ukraine - the broad risk appetite trends and the Fed’s rate path in the next months.
Extra risks facing the Turkish currency also come from the domestic backyard, as inflation gives no signs of abating (despite rising less than forecast in July), real interest rates remain entrenched well in negative territory and the political pressure to keep the CBRT biased towards low interest rates remains omnipresent.
In addition, there seems to be no other immediate alternative to attract foreign currency other than via tourism revenue, in a context where official figures for the country’s FX reserves remain surrounded by increasing skepticism among investors.
Key events in Türkiye this week: Manufacturing PMI (Thursday).
Eminent issues on the back boiler: FX intervention by the CBRT. Progress of the government’s new scheme oriented to support the lira via protected time deposits. Constant government pressure on the CBRT vs. bank’s credibility/independence. Bouts of geopolitical concerns. Structural reforms. Presidential/Parliamentary elections in June 23.
USD/TRY key levels
So far, the pair is gaining 0.09% at 18.2013 and faces the immediate target at 18.2060 (2022 high September 1) seconded by 18.2582 (all-time high December 20) and then 19.00 (round level). On the other hand, a breach of 17.7586 (monthly low August 9) would pave the way for 17.5948 (55-day SMA) and finally 17.1903 (weekly low July 15).
-
14:34
Canada: S&P Manufacturing PMI drops to 48.7 in August vs. 53.6 expected
- Canada S&P Global Manufacturing PMI fell into contraction territory below 50 on in August.
- USD/CAD clings to daily gains above 1.3150 after the data.
The business activity in Canada's manufacturing sector contracted in August with the S&P Global Manufacturing PMI dropping to 48.7 from 52.5 in July. This reading missed the market expectation of 53.6 by a wide margin.
Commenting on the data, "latest PMI data highlighted further concern for Canada's manufacturing sector midway through Q3 as high inflation and concerns over the long-term outlook hit demand hard," said Shreeya Patel, Economist at S&P Global Market Intelligence. "Both output and new orders fell at quicker rates while employment levels declined for the first time since the start of the pandemic over two years."
Market reaction
The USD/CAD pair edged slightly higher with the initial reaction to the disappointing data and was last seen rising 0.3% on the day at 1.3167.
-
14:30
Canada S&P Global Manufacturing PMI below forecasts (53.6) in August: Actual (48.7)
-
14:23
Fed will be forced to hike US economy into a recession in 2023 – Danske Bank
Despite the recession fears, the US economy performed relatively well over the summer. But in the view of economists at Danske Bank, the Federal Reserve continues to guide the US economy toward a recession.
Labour market shows few signs of cooling
“Despite falling into a technical recession during H1, the recent easing in gasoline prices will support positive real private consumption growth during H2.”
“Headline inflation has peaked, but labour market and underlying price pressures remain strong. Fed will be forced to hike US economy into a recession in 2023.”
“We adjust the GDP forecasts to +1.6% in 2022 (from +2.4%) and -0.2% for 2023 (from +0.1%). The downward revision for 2022 largely reflects the weaker-than-expected growth during H1, but risks remain tilted to the downside for 2023.”
-
14:08
When is the US ISM Manufacturing PMI and how could it affect EUR/USD?
US ISM Manufacturing PMI overview
The Institute of Supply Management (ISM) will release its latest manufacturing business survey result, also known as the ISM Manufacturing PMI at 14:00 GMT this Thursday. The index is anticipated to have edged down to 52 in August from 52.8 in the previous month. The gauge will provide a fresh update on the manufacturing sector activity amid rising borrowing costs and growing worries about a deeper economic downturn.
According to Valeria Bednarik, Chief Analyst at FXStreet: “Among the sub-components of the report, the most interesting forecast is that for Prices Paid as it reflects business sentiment around future inflation. The index is expected to retreat sharply from 60 in the previous month to 55.5. While lower-than-previous figures are usually understood as negative for the dollar, easing price pressures are for sure good news for the US.”
How could it affect EUR/USD?
Ahead of the key release, the US dollar climbs back closer to a two-decade high amid hawkish Fed expectations and attracts fresh selling around the EUR/USD pair on Thursday. A stronger-than-expected report will be enough to reaffirm bets for a supersized 75 Fed rate hike move in September. This, in turn, should provide an additional lift to the already elevated US Treasury bond yields and continue to boost the USD.
Conversely, softer data is more likely to be overshadowed by the prevalent risk-off environment, which should continue to lend some support to the safe-haven greenback. Apart from this, concerns over an extreme energy crisis in Europe might continue to undermine the shared currency. This, in turn, suggests that the path of least resistance for the EUR/USD pair is to the downside and any attempted move up should get sold into.
Eren Sengezer, Editor at FXStreet, offers a brief technical overview and writes: EUR/USD stayed above 1.0020 (Fibonacci 23.6% retracement of the latest downtrend, 20-period SMA). Additionally, the Relative Strength Index (RSI) indicator on the four-hour chart started to edge higher after having retreated to the 50 area earlier in the day, confirming the bullish tilt in the near-term technical outlook.”
Eren also outlines important technical levels to trade the EUR/USD pair: “On the upside, 1.0080 (Fibonacci 38.2% retracement, 100-period SMA) aligns as next resistance before 1.0130 (Fibonacci 50% retracement) and 1.0145 (200-period SMA). Supports are located at 1.0020, 1.0000 (psychological level, static level) and 0.9980 (50-period SMA).”
Key Notes
• US ISM Manufacturing PMI Preview: Slowing growth or recession?
• EUR/USD Forecast: Euro bears remain hesitant
• EUR/USD to decline towards the 0.95 over the coming month – Rabobank
About the US ISM manufacturing PMI
The Institute for Supply Management (ISM) Manufacturing Index shows business conditions in the US manufacturing sector. It is a significant indicator of the overall economic condition in the US. A result above 50 is seen as positive (or bullish) for the USD, whereas a result below 50 is seen as negative (or bearish).
-
14:00
Gold Price Forecast: XAU/USD to meltdown below the $1,675 mark – TDS
With every downtick, the risk of capitulation in gold is rising. Economists at TD Securities expect the yellow metal to slump below the $1,675 level.
China's appetite for gold has remained resilient
“The top players in Shanghai markets continue to add to their gold length, despite a depreciating CNY. These flows, alongside central bank demand, have likely kept gold from melting in a liquidity vacuum amid a hawkish Fed narrative, Nonetheless, the risk of capitulation from bloated prop-shop positioning is growing with every tick lower in prices as we approach this cohort's pandemic-era entry levels.”
“The downtrend in gold is gaining steam, as the breadth of technical signals short continues to firm.”
“The risk of a breakout in the broad dollar index could coincide with a meltdown below the $1,675 range in gold.”
-
14:00
Brazil S&P Global Manufacturing PMI registered at 51.9, below expectations (54.1) in August
-
14:00
Russia Central Bank Reserves $ dipped from previous $574B to $566.8B
-
13:52
USD/CNY to rise to 7 in the first quarter of next year – Rabobank
Between April 15 and end-August USD/CNY rose no less than 8.5% to a rate of 6.89. Economists at Rabobank expect the pair to hit 7 in the fisr quarter of 2023.
Chinese inflation to rise to 3.1% during the end of 2022
“After more promising data in June, China’s economy appeared to show signs of early recovery. However, this turned out to be a short-lived one.”
“We expect to see a USD/CNY exchange rate of 6.95 by year-end and expect USD/CNY to rise to 7 in the first quarter of next year.”
“Inflation is expected to rise to 3.1% during the end of 2022.”
-
13:50
Gold Price Forecast: XAU/USD weakens below $1,700 for the first time since July
- Gold slides below the $1,700 mark on Thursday, hitting its lowest level since July 21.
- Aggressive Fed rate hike bets, rising US bond yields and stronger USD exert pressure.
- The risk-off mood fails to impress bullish traders or lend any support to the commodity.
Gold prolongs this week's bearish trend for the third straight day on Thursday and drops to its lowest level since July 21 during the early North American session. The XAU/USD slips below the $1,700 round-figure mark and seems vulnerable to extending the downward trajectory.
Firming expectations that the Fed will continue to tighten its monetary policy more aggressively to tame inflation turns out to be a key factor driving flows away from the non-yielding gold. In fact, the markets are pricing in a greater chance of a 75 bps Fed rate hike at the September meeting and the bets were reaffirmed by Fed Chair Jerome Powell's hawkish remarks last Friday.
This, in turn, leads to an extended sell-off in the US debt markets and pushes the yield on the 2-year government bond, which is highly sensitive to rate hike expectations, to a nearly 15-year high. Elevated US Treasury bond yields lift the US dollar back closer to a two-decade peak touched earlier this week, which is exerting additional pressure on the dollar-denominated gold.
The ongoing downward trajectory, meanwhile, seems rather unaffected by the risk-off environment, which tends to benefit the traditional safe-haven gold. The market sentiment remains fragile amid worries about a deeper global economic downturn. The fears were further fueled by Thursday's disappointing release of the Caixin/Markit Chinese Manufacturing PMI, which fell to 49.5 in August.
Adding to this, headwinds stemming from fresh COVID-19 lockdowns in China further temper investors' appetite for perceived riskier assets. This is evident from a generally weaker tone around the equity markets, though did little to impress bullish traders or lend any support to gold. This, in turn, suggests that the path of least resistance for spot prices is to the downside.
Next on tap will be the release of the US ISM Manufacturing PMI, which might influence the USD and provide some impetus to gold. The focus, however, will remain on the closely-watched US monthly jobs report on Friday. The popularly known NFP will provide a fresh insight into the economy's health in the face of rising rates and stubbornly high inflation. This will play a key role in driving the near-term USD demand and help determine the next leg of a directional move for the yellow metal.
Technical levels to watch
-
13:46
EUR/USD Price Analysis: Solid support lies around 0.9900
- EUR/USD sees its rebound trimmed and returns to sub-parity levels.
- Firm contention is expected near the 0.9900 zone.
EUR/USD comes under renewed and marked downside pressure, slipping back below the key parity zone on Thursday.
Further consolidation looks the most likely scenario in EUR/USD for the time being, always within the 1.0100-0.9900 range. The pair is expected to keep this theme unchanged in the next hours, or at least until the key publication of US Nonfarm Payrolls (Friday).
The breakout of the weekly high at 1.0090 (August 26) could spark further gains to 1.0202 (August17 high) ahead of the 55-day SMA, today at 1.0213. Alternatively, the 0.9900 neighbourhood is expected to hold the bearish impulse for the time being.
In the longer run, the pair’s bearish view is expected to prevail as long as it trades below the 200-day SMA at 1.0801.
EUR/USD daily chart
-
13:41
US: Unit Labor Costs rise 10.2% in Q2 vs. 10.7% expected
- Unit Labor Costs rose at a softer pace than expected in Q2.
- US Dollar Index stays in positive territory above 109.00.
Unit Labor Costs in the nonfarm business sector increased by 10.2% in the second quarter of 2022, the US Bureau of Labor Statistics (BLS)reported on Thursday. This reading came in lower than the market expectation of 10.7%.
Further details of the publication revealed that Labor Productivity in the nonfarm business sector declined by 4.1% in the second quarter of 2022.
"From the same quarter a year ago, nonfarm business sector labor productivity decreased 2.4%," the BLS said. "This is the largest decline in the series, which begins in the first quarter of 1948."
Market reaction
The dollar continues to outperform its rivals in the early American session with the US Dollar Index clinging to strong daily gains at 109.30.
-
13:34
US: Weekly Initial Jobless Claims decline to 232K vs. 248K expected
- Initial Jobless Claims fell by 5,000 in the week ending August 27.
- US Dollar Index continues to push higher toward 109.50.
There were 232,000 initial jobless claims in the week ending August 27, the weekly data published by the US Department of Labor (DOL) showed on Thursday. This print followed the previous week's print of 237,000 (revised from 243,000) and came in better than the market expectation of 248,000.
Further details of the publication revealed that the advance seasonally adjusted insured unemployment rate was 1% and the 4-week moving average was 241,500, a decrease of 4,000 from the previous week's unrevised average.
"The advance number for seasonally adjusted insured unemployment during the week ending August 20 was 1,438,000, an increase of 26,000 from the previous week's revised level," the DOL said.
Market reaction
The US Dollar Index extended its rally after this data and was last seen rising 0.6% on the day at 109.32.
-
13:31
United States Unit Labor Costs registered at 10.2%, below expectations (10.7%) in 2Q
-
13:31
United States Nonfarm Productivity registered at -4.1% above expectations (-4.5%) in 2Q
-
13:31
Chile IMACEC: 1% (July) vs previous 3.7%
-
13:30
United States Continuing Jobless Claims in line with expectations (1.438M) in August 19
-
13:30
United States Initial Jobless Claims below forecasts (248K) in August 26: Actual (232K)
-
13:30
United States Initial Jobless Claims 4-week average down to 241.5K in August 26 from previous 247K
-
13:30
Canada Building Permits (MoM) registered at -6.6%, below expectations (-0.5%) in July
-
13:17
EUR/USD to decline towards the 0.95 over the coming month – Rabobank
On Wednesday, EUR/USD closed at its highest level since mid-August. Nevertheless, economists at Rabobank expect the pair to slide towards 0.95 in the next month.
USD strength to remain in place for a further six months or so
“Going into the Jackson Hole meetings, the market was pricing in a full 1 ppt of ECB rate hikes by the October meeting and these expectations have only increased since then. However, rate hikes will do little to prop up the EUR vs. the USD given that investors are likely to remain focused on stagflation risks in the Eurozone and given the USD’s haven function.”
“We continue to expect broad-based USD strength to remain in place for a further six months or so.”
“We maintain our target of EUR/USD 0.95 on a one-month view.”
-
13:16
US Dollar Index Price Analysis: Further upside likely above 105.60
- DXY extends the upside and rises to 3-day highs near 109.20.
- Extra gains remain in place above the 105.60 region.
DXY reverses Wednesday’s downtick and resumes the buying interest north of the 109.00 mark on Thursday.
The prospects for extra rebound look well and sound while above the 7-month support line, today around 105.60. Against that, the breakout of the 2022 high at 109.47 (August 29) should pave the way for a challenge of the September 2002 top at 109.77 and the round level at 110.00.
Looking at the long-term scenario, the bullish view in the dollar remains in place while above the 200-day SMA at 100.93.
DXY daily chart
-
13:12
GBP/USD: There is more room on the downside amid risk-aversion
GBP/USD has failed to shake off the bearish pressure. The pair is likely to suffer additional losses with safe-haven flows dominating the markets, FXStreet’s Eren Sengezer reports.
Technical outlook shows sellers retain control of cable’s action
“The risk-averse market environment is not allowing the British pound to find demand and the near-term technical outlook shows that there is more room on the downside for the pair.”
“On the downside, 1.1550 (static level, mid-point of the descending channel) aligns as first support ahead of 1.1500 (psychological level).”
“Resistances are located at 1.1600 (psychological level, upper-limit of the descending channel) 1.1650 (20-period SMA) and 1.1700 (psychological level, static level).”
-
13:08
US Dollar Index set to test the 109.478 cycle high from earlier this week – BBH
Following Wednesday's volatile trading amid month-end flows, the US Dollar Index has risen above 109.00. Economists at BBH expect DXY to test the 109.478 cycle high from earlier this week.
The dollar is firm as the new month begins
“We believe yesterday’s dollar selling was due largely to month-end rebalancing going into the fix. With that out of the way, fundamentals suggest the rally is back on track.”
“DXY should soon test the 109.478 cycle high from earlier this week.”
-
13:00
Brazil Gross Domestic Product (QoQ) registered at 1.2% above expectations (0.9%) in 2Q
-
13:00
Brazil Gross Domestic Product (YoY) above forecasts (2.8%) in 2Q: Actual (3.2%)
-
12:47
EUR/JPY Price Analysis: Rising bets for another visit to 142.30
- EUR/JPY comes under pressure soon after hitting the 140.00 area.
- Extra gains could put a test of 142.32 back on the radar.
EUR/JPY retreats from recent peaks in the 140.00 neighbourhood on Thursday.
Gains in the cross could accelerate once it clears the 140.00 zone. Beyond this area, another test of the weekly peak at 142.32 (July 21) should re-emerge on the horizon ahead of the 2022 high at 144.27 (June 28).
While above the 200-day SMA at 134.42, the prospects for the pair should remain constructive.
EUR/JPY daily chart
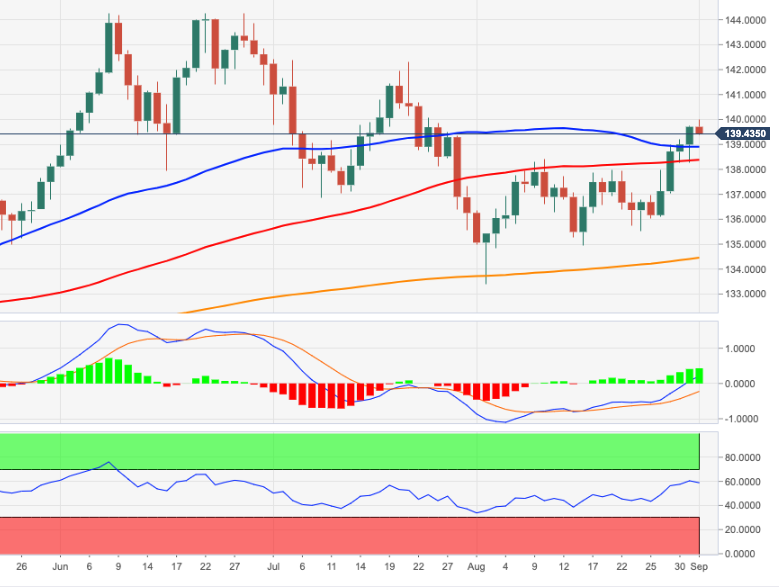
-
12:43
ECB's Centeno: Decision-makers should not rush to take pro-cyclical measures
Decision-makers should not rush to take pro-cyclical measures as inflation is expected to slowly diminish in the longer run, European Central Bank (ECB) Governing Council member Mario Centeno said on Thursday, as reported by Reuters.
Market reaction
This comment doesn't seem to be having a noticeable impact on the shared currency's performance against its major rivals. As of writing, the EUR/USD pair was down 0.4% on a daily basis at 1.0017.
Meanwhile, markets remain risk-averse with US stock index futures losing between 0.5% and 0.8% ahead of Wall Street's opening bell.
-
12:30
United States Challenger Job Cuts dipped from previous 25.81K to 20.485K in August
-
11:58
Silver Price Analysis: XAG/USD drops to over two-year low, oversold RSI warrants caution for bears
- Silver continues drifting lower for the fifth straight day and hits over a two-year low on Thursday.
- A convincing break and acceptance below the $18.00 mark support prospects for further losses.
- A slightly oversold RSI (14) on the daily charts warrants caution for aggressive bearish traders.
Silver is prolonging a nearly three-week-old bearish trend and losing ground for the fifth successive day on Thursday. The downward trajectory extends through the first half of the European session and drags the white metal to the $17.65 area, or its lowest level since June 2020.
Given the overnight break through the previous YTD low, subsequent weakness and acceptance below the $18.00 round figure favour bearish traders. That said, RSI (14) on the daily chart is already flashing oversold conditions and makes it prudent to wait for some near-term consolidation before the next leg down.
Nevertheless, the XAG/USD seems poised to extend the bearish trajectory and aim toward testing the $17.00 round-figure mark. Some follow-through selling has the potential to drag spot prices further towards the next relevant support near the $16.60-$16.50 horizontal zone.
On the flip side, any attempted recovery might confront resistance and attract fresh sellers near the $18.00 mark. This, in turn, should cap the XAG/USD near the $18.15-$18.25 support breakpoint, now turned stiff barrier. The latter should now act as a pivotal point, which if cleared might trigger a short-covering bounce.
The XAG/USD might then accelerate the move towards the $18.70-$18.75 intermediate resistance, above which bulls might aim to reclaim the $19.00 mark. Some follow-through buying will suggest that spot prices have formed a near-term bottom and set the stage for some meaningful recovery in the near term.
Silver daily chart
-637976260294584850.png)
Technical levels to watch
-
11:47
South Africa Total New Vehicle Sales up to 47420 in August from previous 43593
-
11:45
China: PMIs surprised to the downside – UOB
UOB Group’s Economist Ho Woei Chen, CFA, reviews the latest results from Chinese PMIs.
Key Takeaways
“The PMIs released by CFLP (China Federation of Logistics & Purchasing) showed a second consecutive month of contraction in the manufacturing sector while non-manufacturing outlook also moderated in Aug.”
“With 1 ½ months to China’s 20th Party Congress on 16 Oct, COVID curbs are expected to be tightened and thus increasing risks to business and supply chains disruption. High sustained global inflation driving more aggressive monetary policy tightening and weaker global demand as well as further slide in the Chinese property market and geopolitical tensions are also weighing down the recovery outlook for China. The support measures targeting infrastructure spending and improving credit demand are unlikely to negate the downside factors.”
“As such, China’s growth forecasts are poised for further downgrade as hopes for a turnaround in the coming months fade. We thus revise down our 2022 GDP growth forecast for China to 3.3% from 4.1% with 3Q22 at 3.4% y/y and 4Q22 at 4.5% y/y. Our forecast for 2023 will also be adjusted lower to 4.8% from 5.0%, taking into account of the increasing external risks next year.”
-
11:27
GBP/USD struggles below 1.1600 mark, remains vulnerable near 2-½ year low
- GBP/USD remains depressed for the fifth straight day and drops to a two-and-half-year low.
- A bleak outlook for the UK economy continues to weigh on sterling and act as a headwind.
- Aggressive Fed rate hike bets, a weaker risk tone benefits the USD and contributes to the slide.
The GBP/USD pair recovers a few pips from a two-and-half-year low touched earlier this Thursday, albeit seems struggling to capitalize on the move. The pair remains on the defensive through the first half of the European session and is currently placed just below the 1.1600 round-figure mark.
The British pound continues with its relative underperformance amid the deteriorating outlook for the UK economy and political uncertainty. Market participants seem concerned that if Liz Truss was named as the next UK Prime Minister, her government’s policies would diverge from the Bank of England. This, to a larger extent, overshadows bets for a 75 bps rate hike by the BoE in September. This, along with the underlying bullish tone surrounding the US dollar, drags the GBP/USD pair lower for the fifth successive day.
The greenback remains well supported by firming expectations that the Fed will stick to its aggressive policy tightening path to curb stubbornly high inflation. In fact, the markets have priced in a supersized 75 bps rate hike at the September FOMC meeting and the bets were reaffirmed by the recent hawkish comments by several Fed officials. This, in turn, pushes the yield on the 2-year US government bond, which is highly sensitive to rate hike expectations, to a 15-year high and continues to underpin the greenback.
Apart from this, the prevalent risk-off environment - as depicted by a weaker trading sentiment around the equity markets - is offering additional support to the safe-haven buck. Investors remain concerned about a deeper global economic downturn and the fears were further fueled by Thursday's disappointing Chinese Manufacturing PMI for August. Adding to this, headwinds stemming from fresh COVID-19 lockdowns in China temper investors' appetite for riskier assets and seem to benefit traditional safe-haven assets.
The fundamental backdrop suggests that the path of least resistance for the GBP/USD pair is to the downside amid absent relevant market-moving macro data from the UK. Later during the early North American session, traders might take cues from the US economic docket - featuring Weekly Initial Jobless Claims and the ISM Manufacturing PMI. This, along with the US bond yields and the broader risk sentiment, might influence the USD and provide some impetus to the GBP/USD pair ahead of the US jobs report (NFP) on Friday.
Technical levels to watch
-
10:30
USD/CAD climbs to 1.3200 neighbourhood amid sliding oil prices, modest USD strength
- USD/CAD gains traction for the third successive day and climbs to a fresh multi-week high.
- Weaker oil prices undermine the loonie and remain supportive amid a modest USD strength.
- Aggressive Fed rate hike bets and the risk-off mood continues to benefit the safe-haven buck.
The USD/CAD pair prolongs its bullish move for the third straight day on Thursday and climbs to its highest level since July 14 during the first half of the European session. The strong momentum is sponsored by a combination of factors, which bulls now awaiting a sustained move beyond the 1.3200 mark.
Investors remain worried that a deeper global economic downturn, along with fresh COVID-19 restrictions in China, will dent fuel demand. This, in turn, drags crude oil prices to a one-and-half-week low on Thursday and undermines the commodity-linked loonie. Apart from this, the underlying bullish sentiment surrounding the US dollar act as a tailwind for the USD/CAD pair.
Firming expectations that the Fed will stick to its aggressive policy tightening path remain supportive of a further rise in the US Treasury bond yields. In fact, the yield on the 2-year US government bond, which is highly sensitive to rate hike expectations, rose to a 15-year high. Apart from this, the prevalent risk-off mood continues to benefit the safe-haven buck.
The fundamental backdrop seems tilted firmly in favour of the USD bulls and supports prospects for a further near-term appreciating move for the USD/CAD pair. Hence, a subsequent strength back towards resting the YTD peak, around the 1.3225 region touched in July, remains a distinct possibility. Moreover, any corrective pullback could be seen as a buying opportunity.
Market participants now look forward to the US economic docket, featuring the release of Weekly Initial Jobless Claims and the ISM Manufacturing PMI. This, along with the US bond yields and the risk sentiment, will influence the USD and provide a fresh impetus to the USD/CAD pair. Traders might also take cues from oil price dynamics to grab short-term opportunities.
Technical levels to watch
-
10:16
G-7 to discuss cap on price of Russian oil in bid to ease prices – Bloomberg
Group of Seven (G7) finance ministers will hold talks on Friday to discuss allowing global purchases of Russian oil at a capped price, per Bloomberg.
A US official said, “Treasury Secretary Janet Yellen and her counterparts will discuss the measure further in a session on Friday.”
Although It’s not clear what the price cap would be or which countries would join the effort.
Meanwhile, European Commission President Ursula von der Leyen said that Brussels will outline ideas for energy price caps on 14 September.
Market reaction
WTI is little affected by these above headlines, keeping its recovery mode intact. The US oil was last seen trading at $87.70, down 1% on a daily basis.
-
10:15
USD/CNH: Further strength remains on the cards – UOB
FX Strategists at UOB Group Lee Sue Ann and Quek Ser Leang expect USD/CNH to edge higher and revisit the 6.9400 and 6.9600 levels in the next weeks.
Key Quotes
24-hour view: “We expected USD to ‘trade sideways between 6.9000 and 6.9300’ yesterday. However, USD dropped to 6.8911 before rebounding. The rebound has gathered momentum and USD is likely to trade with an upward bias towards 6.9325. The major resistance at 6.9400 is unlikely to come into the picture. Support is at 6.9020 followed by 6.8920.”
Next 1-3 weeks: “On Monday (29 Aug, spot at 6.9140), we highlighted that the rapid boost in momentum indicates that the USD strength could extend to 6.9400, possibly 6.9600. USD subsequently soared to 6.9325. There is no change in our view for now but USD could consolidate for a couple of days first. Overall, only a break of 6.8700 (no change in ‘strong support’ level from yesterday) would indicate that the USD strength that started two weeks ago has run its course.”
-
10:10
EUR/USD comes under pressure and retreats from daily highs near 1.0050
- EUR/USD sees its upside trimmed following tops near 1.0050.
- Germany, EMU final Manufacturing PMI were revised lower in August,
- US ISM Manufacturing next of relevance across the pond.
The single currency kicks in the new month on the back foot and forces EUR/USD to give away the initial bull run to the 1.0050/55 band on Thursday.
EUR/USD remains side-lined ahead of key data
EUR/USD now slips back to the negative territory after three consecutive daily advances on the back of further improvement in the greenback and some loss of momentum in the risk complex.
In the meantime, German 10y Bund yields keep intact its march north and already test the 2.90% region, an area last traded back in late June. The move in the German money markets mimics the one in the US cash markets, where yields remain on the rise across the curve.
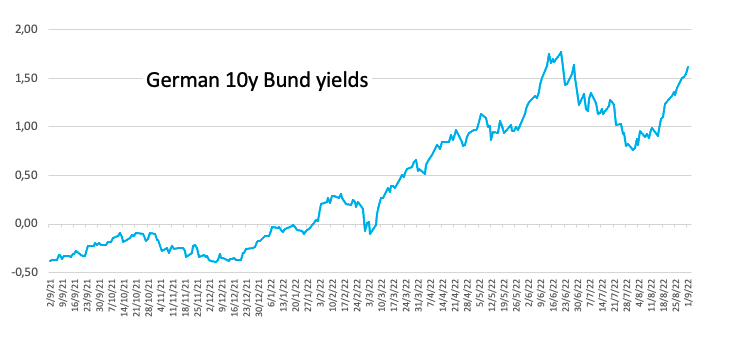
In the meantime, market participants continue to closely follow the developments around the next moves by both the ECB and the Federal Reserve when it comes to interest rate hikes, all amidst the continuation of the hawkish tone from policy makers.
In the domestic calendar, final Manufacturing PMIs in Germany and the Euroland came a tad lower than the preliminary results at 49.1 and 49.6, respectively, for the month of August. In addition, the Unemployment Rate in the euro bloc ticked lower to 6.6% in July (from 6.7%). Earlier in the session, Germany Retail Sales contracted 2.6% in the year to July.
Across the ocean, all the attention will be on the release of the ISM Manufacturing for the month of August along with the final S&P Global Manufacturing PMI, July’s Construction Spending at the speech by FOMC’s R.Bostic.
What to look for around EUR
EUR/USD sees its upside compromised around 1.0050 on the back of the renewed bid bias in the greenback as well as the broad-based loss of traction in the risk-linked galaxy.
So far, price action around the European currency is expected to closely follow dollar dynamics, geopolitical concerns, fragmentation worries and the Fed-ECB divergence. However, potential shifts to a more hawkish stance from ECB’s policy makers regarding the bank’s rate path could be a source of strength for the euro.
On the negatives for the single currency emerge the so far increasing speculation of a potential recession in the region, which looks propped up by dwindling sentiment gauges as well as an incipient slowdown in some fundamentals.
Key events in the euro area this week: Germany Retail Sales, Final Manufacturing PMI, EMU Final Manufacturing PMI, EMU Unemployment Rate (Thursday) – Germany Balance of Trade (Friday).
Eminent issues on the back boiler: Continuation of the ECB hiking cycle. Italian elections in late September. Fragmentation risks amidst the ECB’s normalization of its monetary conditions. Impact of the war in Ukraine and the persistent energy crunch on the region’s growth prospects and inflation outlook.
EUR/USD levels to watch
So far, spot is losing 0.11% at 1.0041 and the breach of 0.9899 (2022 low August 23) would target 0.9859 (December 2002 low) en route to 0.9685 (October 2022 low). On the other hand, the next up barrier comes at 1.0090 (weekly high August 26) seconded by 1.0202 (high August 17) and finally 1.0214 (55-day SMA).
-
10:00
Italy Gross Domestic Product (YoY) came in at 4.7%, above expectations (4.6%) in 2Q
-
10:00
European Monetary Union Unemployment Rate meets forecasts (6.6%) in July
-
10:00
Italy Gross Domestic Product (QoQ) registered at 1.1% above expectations (1%) in 2Q
-
10:00
France 10-y Bond Auction increased to 2.21% from previous 1.43%
-
09:49
BOE Survey: UK business inflation expectations rise in August
The Bank of England’s (BOE) Decision Maker Panel survey of chief financial officers showed on Thursday, British businesses' expectations for consumer price inflation rose in August.
Key takeaways
Expected year-ahead annual output price inflation was 6.5% in the three months to august, up from 6.3% the previous month.
Over the next 12 months, firms expected unit cost growth to be 8.3%.
DMP members expected cpi inflation to be 8.4% one-year ahead, up from 7.3%.
Expected year-ahead employment growth was 2.2% in the three months to august, down from 2.4%.
Overall business uncertainty edged up in August.
Uncertainty relating specifically to the conflict in Ukraine and to Brexit also increased.
Market reaction
GBP/USD remains vulnerable near 1.1600 amid risk-aversion, US dollar strength and UK political woes. The spot is down 0.25% on the day.
-
09:44
Spain 3-y Bond Auction: 1.808% vs 1.416%
-
09:44
Spain 30-y Bond Auction up to 3.334% from previous 3.192%
-
09:44
Spain 10-y Obligaciones Auction rose from previous 1.98% to 2.813%
-
09:36
EUR/USD: Sellers remain on the sidelines for the time being
EUR/USD has gone into a consolidation phase above parity. As FXStreet’s Eren Sengezer notes, euro bears remain hesitant.
1.0080 aligns as next resistance
“In case safe-haven flows dominate the financial markets in the second half of the day, EUR/USD could stay under bearish pressure.”
“On the upside, 1.0080 (Fibonacci 38.2% retracement, 100-period SMA) aligns as next resistance before 1.0130 (Fibonacci 50% retracement) and 1.0145 (200-period SMA).”
“Supports are located at 1.0020, 1.0000 (psychological level, static level) and 0.9980 (50-period SMA).”
-
09:36
EUR/GBP holds steady just below two-month high after recovering from modest intraday losses
- EUR/GBP stalls its intraday corrective pullback from a two-month high touched on Thursday.
- The UK’s bleak economic outlook continues to weigh on the British pound and offers support.
- Modest USD strength and worries about an energy crisis in Europe seem to cap the upside.
The EUR/GBP cross attracts some dip-buying near the 0.8630-0.8625 area and stalls its intraday pullback from a two-month high touched earlier this Thursday. The cross is currently placed around mid-0.8600s, nearly unchanged for the day.
The British pound's relative underperformance comes amid the deteriorating outlook for the UK economy, which turns out to be a key factor acting as a tailwind for the EUR/GBP cross. This, along with the UK political uncertainty, overshadows bets for a 75 bps rate hike by the Bank of England and might continue to weigh on sterling.
Market participants seem concerned that if Liz Truss is named as the next UK Prime Minister, her government’s policies would diverge from the BoE. The shared currency, on the other hand, is drawing support from expectations for a more aggressive policy tightening by the Fed, reaffirmed by Wednesday's hotter Eurozone inflation figures.
That said, the underlying bullish sentiment surrounding the US dollar might hold back the euro bulls from placing aggressive bets. Apart from this, economic headwinds stemming from the possibility of an extreme energy crisis in Europe might also contribute to keeping a lid on any meaningful upside for the EUR/GBP cross, at least for the time being.
The mixed fundamental backdrop warrants some caution before positioning for an extension of the recent strong upward trajectory witnessed over the past week or so. Furthermore, the slightly overbought RSI (14) on the daily chart makes it prudent to wait for some near-term consolidation before placing fresh directional bets around the EUR/GBP cross.
Technical levels to watch
-
09:30
United Kingdom S&P Global/CIPS Manufacturing PMI came in at 47.3, above expectations (46) in August
-
09:19
USD/JPY faces a potential move beyond 140.00 – UOB
Extra gains could lift USD/JPY back above the 140.00 level in the near term according to FX Strategists at UOB Group Lee Sue Ann and Quek Ser Leang.
Key Quotes
24-hour view: “We expected USD to ‘trade sideways between 138.10 and 139.10’ yesterday. USD subsequently traded between 138.25 and 139.00 before closing at 138.96. USD soared above 139.00 during early Asian hours. The rapid improvement in momentum is likely to lead to further USD strength towards 140.00. A breach of this major resistance is not ruled out. The next resistance is at 140.50. The upside risk is intact as long as USD does not move below 139.60 (minor support is at 138.90).”
Next 1-3 weeks: “We turned positive USD early this week. In our latest narrative from yesterday (31 Aug, spot at 138.65), we indicated that the outlook for USD is still positive but the major resistance at 139.50 may not come into the picture so soon. USD subsequently closed at 138.96 before jumping above 139.00 during early Asian hours today. The surge in momentum suggests that USD could advance to 140.00, 140.50. On the downside, a breach of 138.00 (‘strong support’ level was at 137.40 yesterday) would indicate that USD is unlikely to advance further.”
-
09:15
US Dollar Index looks bid near 109.00 ahead of key data
- The index regains the smile and flirts with the 109.00 region.
- US yields look to extend the ongoing uptrend on Thursday.
- ISM Manufacturing will be the salient event later in the docket.
The greenback extends the choppy performance so far this week and now lifts the US Dollar Index (DXY) back to the 109.00 neighbourhood on Thursday.
US Dollar Index looks to ISM results
The index leaves behind Wednesday’s pullback and resumes the upside in the 109.00 region helped by the knee-jerk in the risk-associated galaxy and the continuation of the march north in US yields across the curve.
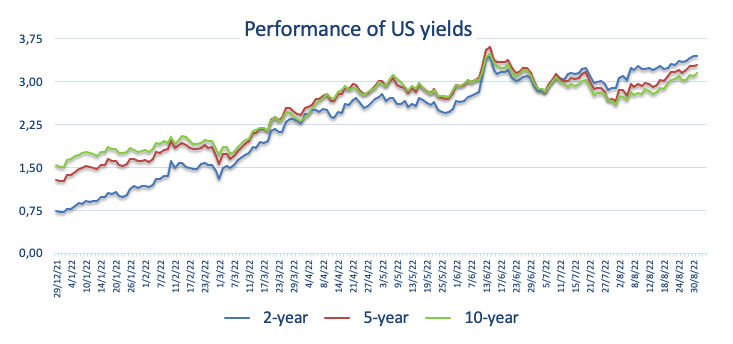
In fact, the index manages well to keep the trade within a side-lined theme in the upper end of the recent range, always underpinned by rising expectation around the Fed’s tightening plans, while recession chatter usually limiting the upside potential.
Data wise in the US, usual weekly Claims are due in the first turn ahead of the always-relevant ISM Manufacturing for the month of August, the final S&P Global Manufacturing PMI and Construction Spending.
In addition, Atlanta Fed R.Bostic (2024 voter, centrist) is also due to speak.
What to look for around USD
The greenback remains within a consolidative phase around the 109.00 zone so far this week after retreating from Monday’s fresh cycle peaks around 109.50 when tracked by the US Dollar Index (DXY).
Bolstering the dollar’s strength appears the firm conviction of the Federal Reserve to keep hiking rates until inflation looks well under control regardless of a likely slowdown in the economic activity and some loss of momentum in the labour market. This view was recently reinforced by Chair Powell’s speech at the Jackson Hole Symposium.
Extra volatility in the dollar, however, should not be ruled out considering the ongoing debate around the size of the September’s interest rate hike by the Federal Reserve.
Looking at the more macro scenario, the greenback appears propped up by the Fed’s divergence vs. most of its G10 peers (especially the ECB) in combination with bouts of geopolitical effervescence and occasional re-emergence of risk aversion.
Key events in the US this week: Initial Claims, Final Manufacturing PMI, ISM Manufacturing, Construction Spending (Thursday) – Nonfarm Payrolls, Unemployment Rate, Factory Orders (Friday).
Eminent issues on the back boiler: Hard/soft/softish? landing of the US economy. Prospects for further rate hikes by the Federal Reserve vs. speculation over a recession in the next months. Geopolitical effervescence vs. Russia and China. US-China persistent trade conflict.
US Dollar Index relevant levels
Now, the index is advancing 0.22% at 108.92 and a break above 109.47 (2022 high July 15) would aim for 109.77 (monthly high September 2002) and then 110.00 (round level). On the other hand, the next contention turns up at 107.58 (weekly low August 26) seconded by 106.59 (55-day SMA) and then 104.63 (monthly low August 10).
-
09:15
Austria Unemployment Rate: 5.9% (August) vs 5.6%
-
09:15
Austria Unemployment up to 249K in August from previous 235.5K
-
09:00
Greece S&P Global Manufacturing PMI fell from previous 49.1 to 48.8 in August
-
09:00
European Monetary Union S&P Global Manufacturing PMI registered at 49.6, below expectations (49.7) in August
-
09:00
Italy Unemployment registered at 7.9%, below expectations (8.1%) in July
-
08:55
Germany S&P Global/BME Manufacturing PMI below expectations (49.8) in August: Actual (49.1)
-
08:50
France S&P Global Manufacturing PMI came in at 50.6, above expectations (49) in August
-
08:45
Italy S&P Global Manufacturing PMI in line with expectations (48) in August
-
08:45
NZD/USD rebounds from multi-week low and retakes 0.6100, upside potential seems limited
- NZD/USD stages a modest short-covering bounce from a multi-week low touched on Thursday.
- Hawkish Fed expectations continue to underpin the USD and should act as a headwind for the pair.
- Recession fears might also contribute to capping any meaningful recovery for the risk-sensitive kiwi.
The NZD/USD pair stalls its intraday slide near the 0.6075 region and recovers a few pips from the lowest level since July 14 touched this Thursday. Spot prices move back above the 0.6100 mark during the early European session, though any meaningful upside still seems elusive.
The US dollar struggles to gain any meaningful traction and prolongs its consolidative price move just below the 20-year peak set earlier this week. Apart from this, the slightly oversold RSI on the 1-hour chart offers some support to the NZD/USD pair and contributes to the modest bounce. That said, hawkish Fed expectations continue to act as a tailwind for the USD. This, along with the prevalent risk-off mood, should keep a lid on any meaningful recovery for the major, at least for the time being.
The markets seem convinced that the Fed will stick to its aggressive policy tightening path and have been pricing in a supersized 75 bps rate hike at the September FOMC meeting. The bets were reaffirmed by the recent hawkish remarks by several Fed officials, which remain supportive of a further rise in the US Treasury bond yields. In fact, the yield on the 2-year US government bond, which is highly sensitive to rate hike expectations, rose to a 15-year high and favours the USD bulls.
Apart from this, growing worries about a deeper global economic downturn might further contribute to capping the upside for the risk-sensitive kiwi. Thursday's disappointing release of the Caixin/Markit Chinese Manufacturing PMI, which fell to 49.5 in August, added to recession fears and weighed on investors' sentiment. This, in turn, suggests that the path of least resistance for the NZD/USD pair is to the downside and any subsequent move up might still be seen as a selling opportunity.
Market participants now look forward to the US economic docket, featuring Weekly Initial Jobless Claims and the ISM Manufacturing PMI. This, along with the US bond yields and the broader risk sentiment, will influence the USD price dynamics and provide some impetus to the NZD/USD pair. The market focus, however, will remain glued to the closely-watched US monthly employment details for August, popularly known as the NFP report, scheduled for release on Friday.
Technical levels to watch
-
08:32
Forex Today: Dollar starts September on a firm footing
Here is what you need to know on Thursday, September 1:
Following Wednesday's volatile trading amid month-end flows, the greenback gathered strength early Thursday with the US Dollar Index rising above 109.00. Although the dollar lost some interest after the data from the US showed that employment in the private sector grew at a much softer pace than expected in August, the risk-averse market helped the currency find demand. July Unemployment Rate data from the euro area will be looked upon for fresh impetus later in the session. The US economic docket will feature weekly Initial Jobless Claims, second-quarter Unit Labor Costs data and the ISM's Manufacturing PMI survey for August.
US ISM Manufacturing PMI Preview: Slowing growth or recession?
Wall Street's main indexes suffered heavy losses on Wednesday and US stock index futures are down between 0.4% and 1.2% in the European morning on Thursday, suggesting that safe-haven flows continue to dominate the market action. Meanwhile, Shanghai Composite lost 0.5% despite the fact that China’s cabinet said that Beijing will publish detailed steps for a set of newly-announced policy measures in early September.
After the data from the euro area showed that the annual Harmonised Index of Consumer Prices (HICP) rose to 9.1% from 8.9% in July, the shared currency managed to stay resilient against the dollar and EUR/USD closed the day at its highest level since mid-August. According to Reuters eurozone money markets now price in roughly an 80% chance of 75 basis points ECB rate hike next week, compared to just over 50% earlier in the week. Despite hawkish ECB bets, EUR/USD trades in negative territory below 1.0050 early Thursday.
GBP/USD extended its slide and touched its weakest level in over two years below 1.16000 on Thursday. The British pound struggles to find demand amid risk aversion and renewed interest in the euro.
USD/JPY surged to fresh multi-decade highs above 139.50 during the Asian trading hours but retreated toward 139.00 in the European morning. The benchmark 10-year US Treasury bond yield gained nearly 3% on Wednesday and climbed above 3.2% for the first time in two months, fueling USD/JPY's rally.
Pressured by rising US yields, gold registered large losses for the second straight day on Wednesday and was last seen trading in negative territory below $1,710.
Bitcoin is having a difficult time making a decisive move in either direction and continues to trade in a narrow channel at around $20,000. Ethereum climbed above $1,600 on Wednesday but erased a large portion of its daily gains in the second half of the day. ETH/USD was last seen losing more than 1% on the day at $1,530.
-
08:30
Switzerland SVME - Purchasing Managers' Index came in at 56.4 below forecasts (56.8) in August
-
08:30
Japan’s Matsuno: Sudden FX fluctuations are not desirable
Japanese Chief Cabinet Secretary Hirokazu Matsuno joined the chorus to warn against the unexpected rapid moves in the exchange rate value.
Also read: Japan’s Finance Ministry Official: Sudden fx fluctuations not desirable
Key quotes
Sudden FX fluctuations are not desirable.
No comment on day-to-day FX moves.
But watching with a high sense of urgency.
It is desirable for currency to move stably reflecting economic fundamentals.
Market reaction
USD/JPY is keeping its corrective mode intact around 139.20, having hit the highest level in 24 years at 139.68 earlier in the Asian trades. The spot is up 0.16% on the day.
-
08:15
Spain S&P Global Manufacturing PMI came in at 49.9, above forecasts (48.5) in August
-
08:12
Further US dollar strength in the near-term – MUFG
Hawkish Federal Reserve has driven the US dollar higher. Economists at MUFG Bank expect the greenback to remain strong in the near-term.
Fed to deliver a third consecutive 75 bps hike this month
“Market participants are becoming more confident that the Fed will deliver a third consecutive 75 bps hike this month (69 bps is currently priced in), and for the policy rate to reach a peak of close to 4.00% next year.”
“The labour market will have to show more acute weakness to materially alter the Fed’s plans for further tightening, and heighten US recession fears. In these circumstances, we continue to expect further US dollar strength in the near-term.”
-
08:09
Gold Price Forecast: XAU/USD bears flirt with $1,700 ahead of US PMI, NFP
- Gold price dribbles after refreshing six-week low earlier in the day.
- Risk-aversion, firmer yields underpin US dollar ahead of the key data.
- China-linked headlines exert additional downside pressure on the XAU/USD.
Gold price (XAU/USD) holds lower ground near $1,707, after refreshing the 1.5-month low, during the early European morning on Thursday. In doing so, the yellow metal appears to struggle between the technical signals and the fundamentals.
That said, the technical analysis hints at a short-term rebound amid RSI divergence while the fundamentals suggest risk-aversion, a firmer US dollar and the pessimism about China weighing on the XAU/USD prices.
While portraying the mood, US 10-year Treasury yields refresh a two-month high of around 3.21% while the two-year bond coupons jump to the highest levels since 2007, near 3.20% and 3.50% respectively at the latest. Also portraying the sour sentiment is the S&P 500 Futures’ 0.56% intraday fall to the lowest levels since late July, at 3,930 by the press time.
Among the key catalysts, hawkish Fedspeak despite the softer US ADP Employment Change gained major attention as it fuels the market bets over the Fed’s aggressive rate hikes in September. As highlighting the hawkish bias, the CME’s FedWatch Tool signals a 74.0% chance of a 75 basis points Fed rate hike in September, versus 73.0% the previous day. Additionally, Reuters mentioned that Eurozone money markets now price in a roughly 80% chance of a 75 basis-point ECB rate hike next week, versus just over 50% on Wednesday.
Elsewhere, the grim covid conditions in China and the Sino-American tussles over Taiwan, as well as downbeat China Caixin Manufacturing PMI, appear to exert more downside pressure on the sentiment, mainly due to China’s status as one of the biggest gold consumers.
Moving on, the risk catalysts and movements of the bond market, as well as interest rate futures, will be crucial for gold traders to watch for fresh impulse. Additionally, the US ISM Manufacturing PMI for August, expected 52.8 versus 52.0 prior, can direct XAU/USD traders ahead of Friday’s US Nonfarm Payrolls (NFP).
Technical analysis
Gold price bounces off the support line of the weekly bearish channel amid an oversold RSI (14) on the hourly. The rebound also takes clues from the bullish divergence as the prices make lower low but the RSI prints higher low.
Even so, the recovery remains elusive until the quote remains below the $1,715 resistance confluence including the stated channel’s upper line and the support-turned-resistance from August 22.
Following that, a run-up towards the 200-HMA level near $1,738 can’t be ruled out.
Meanwhile, the stated channel’s support line, at the $1,700 round figure restricts the quote’s immediate downside, a break of which could quickly direct the XAU/USD bears towards the yearly low surrounding $1,680.
Gold: Hourly chart
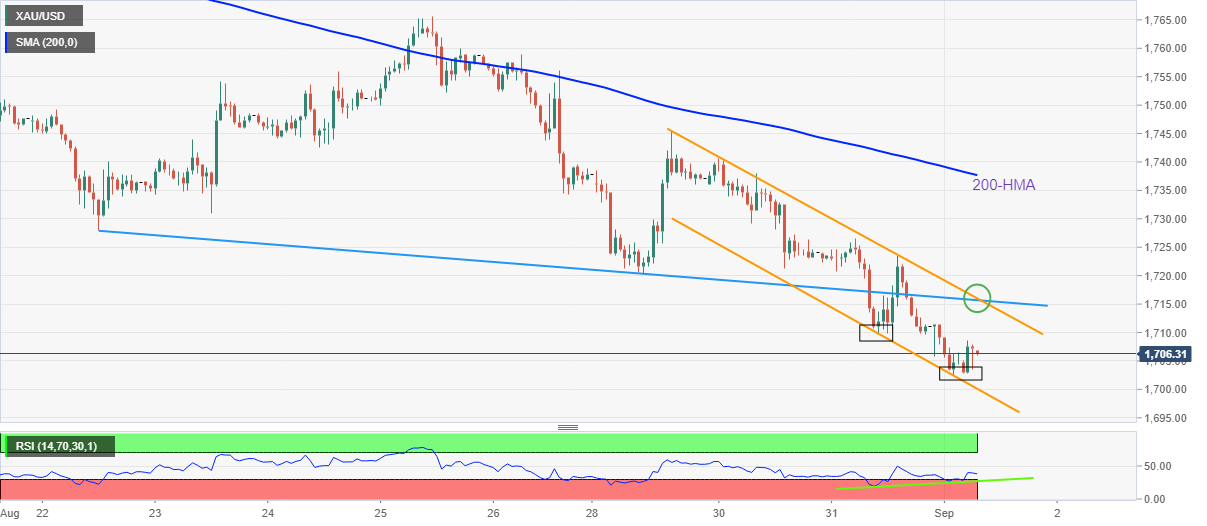
Trend: Corrective rebound expected
-
08:09
Front-loaded tightening from the ECB unlikely to lift the euro – MUFG
Another upside inflation surprise reinforces speculation over a 75 bps hike by the European Central Bank (ECB) at its next week's meeting. Nonetheless, economists at MUFG Bank do not expect the euro to profit from that front-loaded tightening.
Eurozone recession risks remain elevated
“Market participants are currently pricing in 71 bps of hikes by the 8th September policy meeting, and for the ECB to keep raising rates up to 1.50% by year-end.”
“Market expectations for more front-loaded tightening have been encouraged by hawkish comments from ECB policymakers since Jackson Hole, and the release yesterday of another upside inflation surprise in the eurozone.”
“We are not convinced that front-loaded tightening will support a sustainable rebound for the euro while eurozone recession risks remain elevated.”
-
08:07
NZD/USD: Sustained decline expected below 0.6100 – UOB
NZD/USD could drop to 0.6060 once 0.6100 is cleared in the near term, comment FX Strategists at UOB Group Lee Sue Ann and Quek Ser Leang.
Key Quotes
24-hour view: “Our expectations for NZD to test 0.6100 did not materialize as it dropped to 0.6115 before settling at 0.6120 (-0.14%). Downward momentum is beginning to build and but for today, any decline is likely limited to a test of 0.6080. Resistance is at 0.6125 followed by 0.6145.”
Next 1-3 weeks: “We highlighted on yesterday (31 Aug, spot at 0.6135) that downward momentum has eased and NZD is likely to trade between 0.6100 and 0.6200 for now. We added, NZD has to close below 0.6100 before a sustained decline is likely. That said, shorter-term downward momentum has improved and the chance for NZD to close below 0.6100 is on the high side. Overall, only a breach of 0.6165 would indicate that the risk of a sustained decline in NZD has dissipated. Looking ahead, the next support is at 0.6060.”
-
08:03
US Dollar Index could make a run at 110.00 at any time – ING
The US Dollar Index (DXY) remains close to its highs of the year above 109. Economists at ING expect the DXY to test the 110 level.
Energy crisis pulls rug from under the big exporting nations
“It is fair to say the dollar remains very well bid across the board. Two key factors remain at work here. The first is the Fed. Here pricing in US money markets of the Fed policy curve continues to move higher and flatter. The second factor is the energy crisis, which wiped out traditional trade surpluses for the big energy importers in Europe and Asia.”
“For today we will see US ISM manufacturing and the initial jobless claims numbers. We doubt these can put too much of a dent in the dollar's rally ahead of tomorrow's US jobs report.”
“DXY to stay bid above 109.00 and could make a run at 110.00 at any time.”
-
08:02
USD/JPY eases from 24-year peak, still well bid around 139.35-139.40 area
- USD/JPY climbs to a fresh 24-year high on Thursday amid the Fed-BoJ policy divergence.
- The widening of the US-JPY yields differential weighs on the JPY and remains supportive.
- Speculations about an intervention by authorities hold back bulls from placing fresh bets.
The USD/JPY pair trims a part of its intraday gains to a fresh 24-year high touched this Thursday and retreats to the 139.35-139.40 area during the early European session. The pair, however, manages to hold in the positive territory, up over 0.30% for the day and seems poised to prolong its recent bullish trajectory.
Firming expectations that the Fed will stick to a more aggressive policy tightening path continue to push the US Treasury bond yields higher. This results in a further widening of the US-Japan rate differential, which is seen weighing on the Japanese yen amid the Bank of Japan’s reluctance to tighten monetary policy.
The markets have been pricing in the possibility of a supersized 75 bps Fed rate hike move at the September policy meeting. The bets were reaffirmed by the recent hawkish remarks by several Fed officials. This, in turn, pushes the yield on the rate-sensitive 2-year US government bond to a 15-year high on Thursday
This marks a big divergence in comparison to a more dovish stance adopted by the Japanese central bank. In fact, the BoJ has repeatedly said that it will stick to its easing policy stance until wages and prices rise in a stable and sustainable manner. This, in turn, supports prospects for further gains for the USD/JPY pair.
That said, speculations that authorities could interfere and take more concrete action, to stall the recent decline in the JPY, capped the upside. Investors also seem reluctant and prefer to wait for the US monthly jobs report (NFP) on Friday. Nevertheless, the fundamental backdrop seems tilted firmly in favour of bulls.
Market participants now look forward to the US economic docket, featuring Weekly Initial Jobless Claims and the ISM Manufacturing PMI. This, along with the US bond yields, will influence the USD and provide a fresh impetus to the USD/JPY pair. Apart from this, the broader risk sentiment should allow traders to grab short-term opportunities.
Technical levels to watch
-
08:01
Austria Gross Domestic Product (QoQ) up to 1.5% in 2Q from previous 0.5%
-
08:00
Netherlands, The Markit Manufacturing PMI dipped from previous 54.5 to 52.6 in August
-
08:00
Natural Gas Futures: Further consolidation appears in the pipeline
According to preliminary readings from CME Group for natural gas futures markets, open interest dropped for the second session in a row on Wednesday, this time by just 582 contracts. Volume, instead, resumed the uptrend and rose by around 8.8K contracts and partially reversed the previous strong decline.
Natural Gas poised to extend the range bound near $9.00
Wednesday’s volatile price action and small gains in natural gas was amidst shrinking open interest, which leaves the prospects for further gains somewhat curtailed for the time being. Against that, the commodity could extend the side-lined mood with support in the $9.00 region per MMBtu.
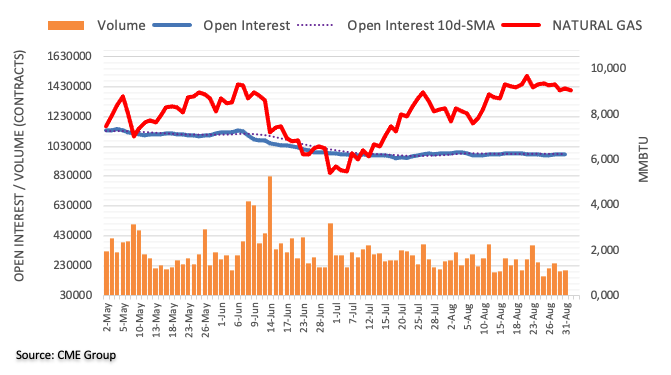
-
07:59
GBP/USD to retest the March 2020 flash-crash low of 1.1415 – ING
This is getting serious. Economists at ING note that the GBP/USD pair could tumble to retest the March 2020 low of 1.1415.
A fiscal risk premium looks to be going into GBP
“We note some worrying developments in the Gilt market – where underperformance of Gilts versus GBP swaps suggests some independent concerns mounting over Gilts, be it quantitative tightening plans from the BoE or perhaps even some fears over what Britain's next prime minister plans to do with the nation's balance sheet.”
“Cable retesting the March 2020 flash-crash low of 1.1415 low looks the path of least resistance. And 0.8720 is the bias for EUR/GBP.”
-
07:55
EUR/USD to stay offered in a 0.9900-1.0100 range – ING
Economists at ING doubt an extra 25 bps of European Central Bank (ECB) tightening this autumn makes much of a difference to the soft EUR/USD profile. The pair is set to remain within a 0.99-1.01 range.
ECB hawks may struggle to generate euro lift-off
“Markets now price 69bp of hikes at the September meeting, a total of 130 bps by the October meeting, and a total of 167 bps by year-end. However, the recent narrowing in EUR: USD two-year swap spreads may have run its course, and a reversal – should the ECB not deliver on this new hawkish pricing – could send EUR/USD to fresh lows next week.”
“EUR/USD to stay offered in a 0.9900-1.0100 range.”
-
07:46
UK’s Truss: Will deliver immediate energy bill support for households
“I will deliver "immediate support" to ensure people are not facing unaffordable fuel bills going into the winter,” Britain's Foreign Minister and a frontrunner in the UK’s laeadership race, Liz Truss, wrote in the Sun newspaper in an article published late on Wednesday.
She added, “I will also deliver immediate support to ensure people are not facing unaffordable fuel bills. I will be robust in my approach.”
Her comments come ahead of next Monday’s announcement of the new prime minister and as the country battles the deeepening energy crisis.
Market reaction
GBP/USD is keeping its range below 1.1600, down 0.28% on the day. The pair hit the lowest level since March 2020 at 1.1569 earlier in the Asian session amid notable US dollar strength.
-
07:46
Germany could run out of gas in early 2023 – ANZ
Europe has made the most of a seasonal lull in demand to fill gas storage facilities well ahead of schedule. However, the energy crisis is far from over. Germany is still at risk of running out of gas this winter, according to strategists at ANZ Bank.
Risks of energy shortages worsening are high
“The situation in Germany is perilous. Its gas inventories can cover two months of peak demand. As temperatures fall through Autumn, demand for heating fuels will rise significantly above the current supply. As it stands, the country could run out of gas in early 2023.”
“Risks of energy shortages worsening are also high. Russian gas producer Gazprom has highlighted that several other turbines on the Nord Stream require maintenance. Ultimately Germany would need to be successful in cutting natural gas consumption by 15% to keep gas storage facilities from running empty.”
-
07:41
Silver Price Analysis: XAG/USD to suffer further falls towards the $15.56 support – Credit Suisse
Silver (XAG/USD) is falling to fresh YTD lows. In the view of strategists at Credit Suisse, the precious metal could suffer further losses towards the $15.56 support.
Immediate resistance remains seen at the 55-DMA of $19.76
“Silver maintains a large top and with the market now again below the crucial 61.8% retracement support of the whole 2020/21 upmove at $18.65/15, we expect further downside from here towards the $15.56 support from a technical analysis perspective.”
“Immediate resistance remains seen at the 55-day average, currently at $19.76. Above $21.39 remains needed to negate the top.”
-
07:38
USD/CHF retreats from seven-week high towards 0.9750 on mixed Swiss data
- USD/CHF pares intraday gains at 1.5-month high, probes five-day uptrend.
- Swiss Consumer Price Index rose 0.3% MoM, 3.5% YoY in July, Real Retail Sales eased 2.6% YoY in July.
- Risk-off mood, hawkish Fed bets keep DXY on the front foot.
- US ISM Manufacturing PMI, NFP will be crucial for clear directions.
USD/CHF renews intraday low near 0.9765 after a surprise positive Swiss statistics during the early Thursday morning on Thursday. In doing so, the Swiss currency (CHF) pair probes a four-day uptrend near the highest levels since July 15.
Swiss Consumer Price Index (CPI) grew by 0.3% MoM and 3.5% YoY versus 0.2% and 3.4% expected respectively for August. That said, the nation’s Real Retail Sales for July eased below 3.3% expected to 2.6% while crossing the downwardly revised 0.7% prior.
Even so, the risk-off mood and firmer Treasury yields underpin the US dollar. That said, the US Dollar Index (DXY) prints the biggest daily gains in over a week while picking bids near 109.10 at the latest. In doing so, the greenback’s gauge versus the six major currencies appears to ignore the softer US ADP Employment Change that grew by 132K versus 288K expected and 270K prior. The reason could be linked to the average wage increases for August that rose 7.6% y/y and the same kept the Fed policymakers hawkish.
Hawkish Fedspeak could be held responsible for the latest increase in the market’s bets of a 0.75% Fed rate hike in September, which in turn keeps the USD/CHF on a firmer footing. The CME’s FedWatch Tool portrays a 74.0% chance of a 75 basis points Fed rate hike in September, versus 73.0% the previous day.
The grim covid conditions in China and the Sino-American tussles over Taiwan appear to exert more downside pressure on the sentiment, while also favoring the USD/CHF bulls.
Amid these plays, US 10-year Treasury yields refresh a two-month high of around 3.21% while the two-year bond coupons jump to the highest levels since 2007, near 3.20% and 3.50% respectively at the latest. Also portraying the sour sentiment is the S&P 500 Futures’ 0.56% intraday fall to the lowest levels since late July, at 3,930 by the press time.
Given the risk-off mood and firmer US dollar-driven USD/CHF run-up, the pair’s further advances hinge on the US ISM Manufacturing PMI for August, expected 52.8 versus 52.0 prior, ahead of Friday’s US Nonfarm Payrolls (NFP).
Technical analysis
The overbought RSI conditions join the upper line of the three-week-long bullish channel, near 0.9820, to challenge the USD/CHF buyers. Alternatively, the pullback moves may initially test the 50% Fibonacci retracement level of 0.9715 before highlighting the 100-DMA support near 0.9680-75.
-
07:37
Significant pressure on the zloty if NBP were not escalate to a 50 bps hike in September – Commerzbank
Poland has seen another upside Consumer Price Index (CPI) surprise in August. This print should weigh on the zloty if the Narodowy Bank Polski (NBP) refrains from hiking rates by 50 bps in September, economists at Commerzbank report.
Inflation accelerates further
“Polish CPI surprised sharply to the upside again in August, registering 0.8% MoM increase vs. expectation of 0.2% MoM. Markets should view this as new development. Meanwhile, market expectations regarding further rate hikes from NBP are minimal (possibly +25 bps on 7 September).”
“There is likely to be significant pressure on the zloty if NBP were not to react in any manner to this CPI print (in other words, at least not escalate to a 50 bps hike in September).”
-
07:31
Australia RBA Commodity Index SDR (YoY) came in at 21.7%, above expectations (21.5%) in August
-
07:31
Sweden Purchasing Managers Index Manufacturing (MoM) below forecasts (52.7) in August: Actual (50.6)
-
07:30
Switzerland Real Retail Sales (YoY) came in at 2.6%, below expectations (3.3%) in July
-
07:30
Switzerland Consumer Price Index (YoY) came in at 3.5%, above expectations (3.4%) in August
-
07:30
Switzerland Consumer Price Index (MoM) came in at 0.3%, above expectations (0.2%) in August
-
07:30
Gold Price Forecast: Closing break below $1,691/76 to turn the risks lower over the next 1-3 months – Credit Suisse
Gold is under renewed pressure. A major “double top” continues to threaten, which would turn the risks lower over at least the next 1-3 months, strategists at Credit Suisse report.
Convincing break above the 55-DMA at $1,766 to confirm further ranging
“We continue to stress that a closing break below $1,691/76 would be sufficient to complete a large ‘double top’, which would turn the risks lower over at least the next 1-3 months. We note that the next support should this top be triggered is seen at $1,618/16, then $1,560 and eventually $1,451/40.”
“Only a convincing break above the 55-day average at $1,766 would confirm further ranging in the two-year range, with next resistance then seen at the even more important 200-day average, currently at $1,837.”
-
07:26
EUR/USD: Euro bulls will probably have to be patient for some time yet – Commerzbank
The likelihood has risen that the European Central Bank (ECB) might really take action, rather than just talk, and might hike its key rate by an impressive 75 bps next week. Nonetheless, the market would probably sell the euro in an initial reaction, according to economists at Commerzbank.
ECB still has some convincing to do in its comments to ensure its credibility with the markets
“I see a chance that the euro might find some support in case of a 75 bps rate step next week. However, the ECB still has some convincing to do in its comments to ensure its credibility with the markets, proving that it will also tolerate economic pain to effectively deal with price risks. Only at that point would the euro be able to actually benefit from the ECB’s monetary policy in a more sustainable manner.”
“In a crisis, the market would probably sell the euro in an initial reaction due to recession fears. The ECB’s determination to fight inflation would likely only have a positive effect on the single currency at a later stage – if the ECB really were to stick to its approach at that point. That means the euro bulls will probably have to be patient for some time yet.”
-
07:21
GBP/USD: Sustained move below 1.1350 to warn of potential fall to the 1985 low at 1.0520/1.0483 – Credit Suisse
GBP/USD is declining sharply again. Economists at Credit Suisse assess the next major support levels should the pair break below their long-held core bearish objective at 1.1500/1.1409.
Resistance at 1.1902 ideally caps
“GBP/USD has seen a clear break of the 1.1760 July low as expected and we stay bearish for a move to our core objective of the key low of 2020 and long-term trend support stretching back to 1985 at 1.1500/1409. We would then look for a fresh temporary floor here.”
“GBP/USD below the 1.1409 low of 2020 and certainly potential trend support at 1.1350 would be seen to mark a further significant deterioration with support seen next at 1.1285, ahead of 1.1020/00 and potentially back to the 1985 lows at 1.0520/1.0483.”
“Resistance at 1.1902 now ideally caps although a close above the 55-day average at 1.2040 is needed to open the door to a consolidation phase.”
-
07:20
GBP/USD could slip back to 1.1530 – UOB
The breach of 1.1580 could motivate GBP/USD to revisit the 1.1530 region in the short term, suggest FX Strategists at UOB Group Lee Sue Ann and Quek Ser Leang.
Key Quotes
24-hour view: “We highlighted yesterday that GBP ‘could weaken further but the chance for a break of 1.1610 is not high for now’. The anticipated weakness exceeded our expectations as GBP dropped to 1.1599 before closing on a soft note at 1.1622 (-0.27%). While downward momentum has not improved by much, GBP is still weak. For today, GBP could dip below 1.1580 but the next support at 1.1530 is likely out of reach. Resistance is at 1.1635 followed by 1.1665. A break of 1.1665 would indicate that the weakness in GBP has stabilized.”
Next 1-3 weeks: “Yesterday (31 Aug, spot at 1.1655), we indicated that while downward momentum has not improved by much, the risk for GBP is still on the downside. We indicated the next level to watch is at 1.1580. GBP subsequently dropped to 1.1599 before settling at 1.1622 (-0.27%). The downside risk is still intact and a break of 1.1580 would shift the focus to 1.1530. On the upside, a break of 1.1700 (‘strong resistance’ level was at 1.1755 yesterday) would indicate that GBP is not weakening further.”
-
07:18
Crude Oil Futures: Weakness looks overdone
Considering advanced prints from CME Group for crude oil futures markets, open interest shrank for the second session in a row on Wednesday, this time by around 2K contracts. Volume followed suit and went down by nearly 123K contracts, keeping the choppy performance unchanged for yet another session.
WTI faces support near $85.00
Prices of the barrel of WTI remained under pressure amidst declining open interest and volume on Wednesday. Against that, the likelihood of a deeper drop appears diminished for the time being, while solid support remains around the $85.00 mark.
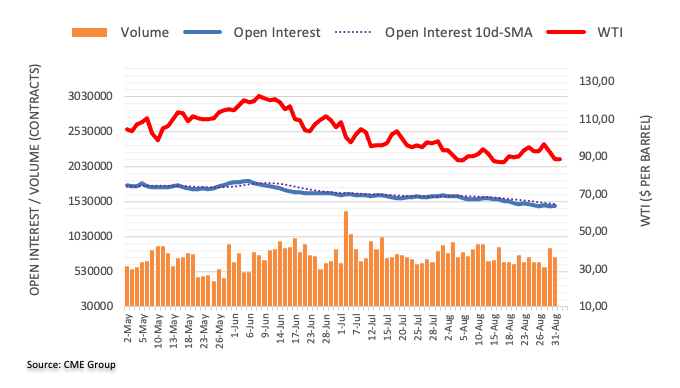
-
07:16
Italian risk is poorly priced by financial markets – Natixis
Could the likely victory of far-right parties in Italy’s parliamentary elections on 25 September trigger a crisis in Italian financial markets? In the view of analysts at Natixis, Italy gives more cause for concern than financial markets suggest.
Will Italian financial markets withstand Draghi’s departure?
“The election of a far-right government in Italy would run the risk of Halting the reform process set in motion by Mario Draghi, which is a prerequisite for Italy to receive funds under Next Generation EU; A highly expansionary fiscal policy, making the trajectory of public finances incompatible with public debt sustainability. This would make Italy ineligible for the Transmission Protection Instrument.”
“If Italy lost eligibility for both Next Generation EU and the TPI, Italian financial markets (government bond market, equity market) would deteriorate considerably from their current level. Perhaps the new government will take on board this risk.”
-
07:15
FX option expiries for Sept 1 NY cut
FX option expiries for Sept 1 NY cut at 10:00 Eastern Time, via DTCC, can be found below.
- EUR/USD: EUR amounts
- 0.9975 259m
- 1.0000-10 756m
- 1.0090-00 517m
- USD/JPY: USD amounts
- 137.75-80 580m
- 138.10 740m
- USD/CHF: USD amounts
- 0.9850 250m
- AUD/USD: AUD amounts
- 0.6865 873m
- 0.6900 381m
- USD/CAD: USD amounts
- 1.2950 785m
- 1.3000 332m
-
07:14
EUR/USD set to slump towards 0.96 and even lower – Credit Suisse
EUR/USD may extend its consolidation above 0.9900. Nevertheless, analysts at Credit Suisse stay bearish for 0.9600 and probably lower.
Resistance is seen at 1.0090/97 initially
“We maintain our core and long-held bearish view for an eventual break below 78.6% retracement support at 0.9900 for a move to our 0.9609/.9592 next objective. Whilst we would look for a fresh consolidation phase here, we would see no reason not to look for a break below here in due course, with support seen next at .9330.”
“Resistance is seen at 1.0090/97 initially, with the 55-day average at 1.0235 now ideally capping further strength if seen.”
-
07:11
NZD/USD struggles as market backdrop does seem to favour the greenback – ANZ
NZD/USD drops to the fresh seven-week low during a three-day downtrend. As analysts at ANZ Bank note, the overall FX market backdrop does seem to favour the USD.
RBNZ might be done after a couple more hikes
“With global recession fears percolating, FX markets attuned to a risk-off vibe, UK gripped by political/energy/inflation woes, Europe struggling under the weight of energy prices, drought and a war on its back doorstep, and the Bank of Japan resolute in its desire to maintain easy policy, markets will naturally be attracted to the USD, and in blunt terms, that is where the risks lie for the kiwi.”
“The idea that the RBNZ might be done after a couple more hikes isn’t helping either (we think the risks are skewed to more, but the market doesn’t think that).”
-
07:08
WTI sees more downside below $88.00 as recession fears soar, US ISM PMI eyed
- Oil prices are facing the wrath of soaring recession fears.
- Weaker Caixin Manufacturing PMI has infused fresh blood in bears.
- Western central banks are gearing up for a fresh rate hike cycle.
West Texas Intermediate (WTI), futures on NYMEX, is on the verge of delivering a downside break of the consolidation, which has formed in a narrow range of $88.54-89.32 in the Tokyo session. The asset has surrendered the psychological support of $90.00 as western central banks are gearing up for a fresh rate hike cycle to fix the inflation chaos.
Price pressures are soaring in the global markets. The European Central Bank (ECB)’s preferred inflation tool Harmonized Index of Consumer Prices (HICP) has crossed the whooping figure of 9% amid soaring energy bills.
The inflation rate in the US economy displayed exhaustion signals but still operates near 8.5%, which is extremely deviated from the desired rate of 2%. And, the UK economy is the major victim of inflationary pressures. As per a Citi survey, long term-inflation expectations have soared to 4.8%, much higher than the long-term target of the Bank of England (BOE) at 2%.
Meanwhile, the downbeat Caixin Manufacturing PMI data has also weakened the oil prices. The economic data has been trimmed to 49.5 against the consensus of 50.2 and the prior release of 50.4. It is worth noting that China is the largest importer of oil and a decline in oil consumption by the largest importer is sufficient to drag the black gold into a negative trajectory.
Also, the black gold has failed to capitalize on a decline in oil stockpiles reported by the Energy Information Administration (EIA) for the past week. The oil inventories have declined by 3.326 million barrels vs. a decline of 3.282 million barrels reported earlier.
In today’s session, the US ISM Manufacturing PMI carries significant importance. As per the consensus, the economic data is seen at 52.0 against the former figure of 52.8. An occurrence of the same will put more pressure on oil prices as recession fears will strengthen further.
-
07:05
US Dollar Index: Scope to reach the 121.02 high of 2011 – Credit Suisse
The US Dollar Index (DXY) may yet see longer consolidation at key resistance, but economists at Credit Suisse maintain their core bullish outlook.
Support is seen moving to 107.59 initially
“The DXY is seeing a concerted retest of major resistance and our interim upside objective at 109.25/110.25. With the market also back at the upper end of its ‘typical’ extreme (9% above the 40-week average), a fresh pause from here should be allowed for.”
“Big picture, with a five-year bull ‘triangle’ completed in April, we continue to look for an eventual break higher with resistance seen next at 111.31, ahead of 115.30 and eventually the 121.02 high of 2001.”
“Support is seen moving to 107.59 initially with 106.31 now ideally holding.”
-
07:02
German Retail Sales drop 2.6% YoY in July vs. -6.5% expected
- German Retail Sales arrived at -2.6% YoY in July vs. -6.5% expected.
- Retail Sales in Germany stood at 1.9% MoM in July vs. 0% expected.
Germany's Retail Sales jumped by 1.9% MoM in July versus 0% expected and -1.6% previous, the official figures released by Destatis showed on Thursday.
On an annualized basis, the bloc’s Retail Sales came in at -2.6% in July versus -6.5% expected and an 8.8% slump recorded in June.
FX implications
The euro is little changed on the upbeat German data. At the time of writing, the major trades at 1.0020, shedding 0.37% so far.
About German Retail Sales
The Retail Sales released by the Statistisches Bundesamt Deutschland is a measure of changes in sales of the German retail sector. It shows the performance of the retail sector in the short term. Percent changes reflect the rate of changes of such sales. The changes are widely followed as an indicator of consumer spending. Positive economic growth is usually anticipated as "bullish" for the EUR, while a low reading is seen as negative, or bearish, for the EUR.
-
07:01
Silver Price Analysis: XAG/USD ignores oversold RSI to renew two-year low below $18.00
- Silver price drops for the fifth consecutive day as it renews multi-month low, pares daily loss of late.
- Oversold RSI could trigger recovery but July’s bottom guards immediate upside.
- 61.8% and 78.6% FE levels lure bears, $19.00 holds the key for bull’s conviction.
Silver price (XAG/USD) bounces off the lowest levels since June 2020, marked earlier in the day, as bears lick their wounds after a five-day downtrend. That said, the bright metal drops 1.0% intraday despite the latest rebound to $17.82.
Oversold RSI (14) could be linked to the XAG/USD’s corrective pullback targeting the $18.00 threshold. However, the previous multi-month low marked in July, around $18.15, could challenge the metal’s further advances.
Even if the silver price rises past $18.15, a convergence of the 10-DMA and a downward sloping trend line from August 15 could challenge the upside moves around $18.75.
It’s worth noting, however, that a seven-week-old support-turned-resistance, near $19.00 by the press time, appears a tough nut to crack for the commodity buyers.
Alternatively, the 61.8% Fibonacci Expansion (FE) of the metal’s moves between April 29 and August 15, close to $17.40, could lure the silver bears.
Following that, a south-ward trajectory towards the June 2020 low near $17.00 and the 78.6% FE level surrounding $16.55 could challenge the XAG/USD sellers.
If at all the metal price remains weak past $16.55, a descending support line from May 13, close to $16.30, could become the last defense of the buyers.
Silver: Daily chart
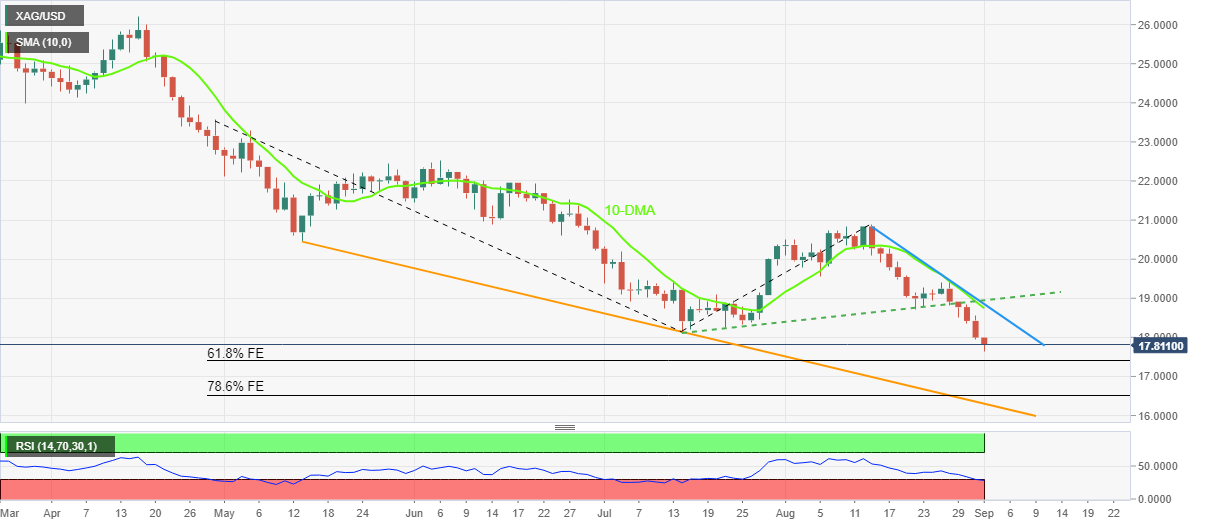
Trend: Corrective pullback expected
-
07:01
Germany Retail Sales (MoM) above expectations (0%) in July: Actual (1.9%)
-
07:01
Gold Price Forecast: XAU/USD’s path of least resistance appears down, eyes on 2022 lows of $1,681
Gold price stays vulnerable. For how long can XAU/USD defend $1,700 support? FXStreet’s Dhwani Mehta reports.
More losses remain in the offing
“Sellers need a daily close below the $1,700 threshold to bring the 2022 low of $1,681 back in the spotlight. However, the $1,690 support area could impede the bearish momentum.”
“The immediate resistance is seen at the previous day’s low of $1,710, above which, $1,720 – the previous intermittent lows will be probed. Buyers will seek control above the latter, adding strength to the recovery towards the rising trendline support-turned-resistance at $1,745.”
-
07:01
Russia S&P Global Manufacturing PMI climbed from previous 50.3 to 51.7 in August
-
07:00
Germany Retail Sales (YoY) above expectations (-6.5%) in July: Actual (-2.6%)
-
07:00
Sweden Current Account (QoQ) came in at 36B below forecasts (65.4B) in 2Q
-
07:00
United Kingdom Nationwide Housing Prices s.a (MoM) above expectations (0.1%) in August: Actual (0.8%)
-
07:00
United Kingdom Nationwide Housing Prices n.s.a (YoY) registered at 10% above expectations (8.9%) in August
-
06:59
Gold Futures: Scope for a deeper retracement
CME Group’s flash data for gold futures markets noted traders extended the uptrend in open interest by just 399 contracts on Wednesday. In the same line, volume went up by nearly 49.1K contracts after two consecutive daily pullbacks.
Gold looks supported near $1,700
Gold prices accelerated its downside on Wednesday amidst rising open interest and volume, suggesting that the current bearish trend appears unchanged for the time being. Against that, the $1,700 region still offers decent contention.
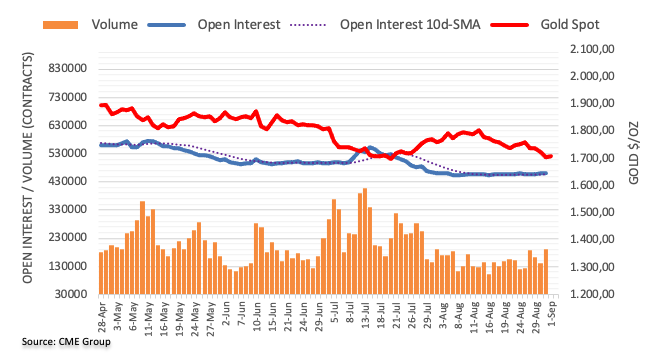
-
06:44
EUR/USD keeps the consolidative theme near term – UOB
FX Strategists at UOB Group Lee Sue Ann and Quek Ser Leang noted EUR/USD is expected to navigate within the 0.9940-1.0125 range in the next few weeks.
Key Quotes
24-hour view: “EUR traded between 0.9972 and 1.0078 yesterday, wider than our expected sideway-trading range of 0.9985/1.0060. The price actions offer no fresh clues and we expect EUR to trade within a range of 0.9980/1.0080 for today.”
Next 1-3 weeks: “Two days ago (30 Aug, spot at 0.9995), we highlighted that EUR is likely to consolidate and trade between 0.9900 and 1.0085. EUR rose to a high of 1.0078 yesterday and while upward momentum has improved somewhat, EUR does not appear to be ready to head higher in a sustained manner. That said, EUR could move above 1.0085 but the next resistance at 1.0125 is unlikely to come into the picture. Overall, the price action suggests EUR is still consolidating, albeit at a higher range of 0.9940/1.0125.”
-
06:39
AUD/USD picks bids around 0.6800 despite weak Caixin PMI, US ISM PMI, RBA in focus
- AUD/USD has sensed buying interest after slipping below the round-level support of 0.6800.
- Caixin Manufacturing PMI has landed lower at 49.5 vs. expectations of 50.2.
- The DXY is broadly firmer despite lower consensus for US ISM Manufacturing PMI.
The AUD/USD pair has witnessed a decent buying interest below 0.6800 in the early European session. The asset is attempting a break above its prior high volume area, which is placed in a narrow range of 0.6805-0.6822. On a broader note, the pair witnessed a perpendicular downside move after surrendering the immediate support of 0.6840.
The major has attracted bids despite the release of the downbeat Caixin Manufacturing PMI data. The economic data has been trimmed to 49.5 against the consensus of 50.2 and the prior release of 50.4. The Chinese economy is facing the headwinds of a resurgence in Covid-19 cases, and lockdown curbs by the Chinese administration have soared recession fears.
It is worth noting that Australia is a leading trading partner of China and dismal Chinese economic activities could put significant pressure on the aussie dollar.
Meanwhile, the US dollar index (DXY) is displaying signs of exhaustion as the asset has failed to sustain above 109.10. However, the upside remains favored as the Federal Reserve (Fed) seems bound to hike interest rates in September to bring price stability. In today’s session, the release of the US ISM Manufacturing PMI data holds significant importance. August manufacturing activities are seen lower at 52.0 vs. 52.8 reported earlier.
On the Aussie front, investors are awaiting the announcement of the interest rate decision by the Reserve Bank of Australia (RBA), which is due next week. RBA Governor Philip Lowe is expected to announce a fourth consecutive 50 basis points (bps) hike in its Official Cash Rate (OCR).
-
06:35
EUR/USD drops back to parity as DXY bulls cheer risk-aversion, hawkish Fed bets
- EUR/USD takes offers to refresh intraday low, snaps three-day uptrend.
- Yields underpin US dollar run-up amid fears emanating from central banks’ aggression, China.
- Mixed data fails to push back the traders’ hawkish bias as policymakers keep pushing for higher rates.
- Eurozone Unemployment Rate, US ISM Manufacturing PMI should be watched ahead of Friday’s NFP.
EUR/USD bears poke the 1.0000 psychological magnet, also known as the parity level, as traders rush towards the US dollar in search of risk safety. Also underpinning the bearish bias is the US Federal Reserve policymakers’ aggression towards interest rate hikes despite recently mixed data. With this, the major currency pair prints the first daily negatives in four heading into Thursday’s Asian session.
US Dollar Index (DXY) prints the biggest daily gains in over a week while picking bids near 109.10 at the latest. In doing so, the greenback’s gauge versus the six major currencies appears to ignore the softer US ADP Employment Change that grew by 132K versus 288K expected and 270K prior. The reason could be linked to the average wage increases for August that rose 7.6% y/y and the same kept the Fed policymakers hawkish.
Following the data, Cleveland Federal Reserve Bank President Loretta Mester said on Tuesday that she was not anticipating the Fed to cut rates next year, as reported by Reuters. Further, the newly appointed Dallas Fed President Lory Logan joined the lines of hawkish fellow US central bankers while saying, “Restoring price stability is No. 1 priority.”
It should also be noted that the CME’s FedWatch Tool portrays 74.0% chance of a 75 basis points Fed rate hike in September, versus 73.0% the previous day, which in turn offers additional strength to the DXY.
Elsewhere, grim covid conditions in China and the Sino-American tussles over Taiwan appear to exert more downside pressure on the sentiment.
While portraying the mood, US 10-year Treasury yields refresh a two-month high of around 3.21% while the two-year bond coupons jump to the highest levels since 2007, near 3.20% and 3.50% respectively at the latest. Also portraying the sour sentiment is the S&P 500 Futures’ 0.56% intraday fall to the lowest levels since late July, at 3,930 by the press time.
At home, firmer prints of the Eurozone and Germany’s inflation also underpin hawkish bias towards the next week’s European Central Bank (ECB) monetary policy meeting. However, the energy crisis in the old continent and political jitters in Italy and France seem to restrict the Euro from cheering the upbeat catalyst.
For today, Germany’s Retail Sales for August and Eurozone Unemployment Rate may offer immediate directions ahead of the US ISM Manufacturing PMI for the stated month. Also important will be the second-tier data relating to US employment.
Also read: US ISM Manufacturing PMI Preview: Slowing growth or recession?
Technical analysis
A convergence of the 10-DMA and weekly support line, around 0.9995-90, appears a short-term key challenge for EUR/USD bears before they aim for the yearly low near 0.9900. Meanwhile, a downward sloping trend line from February, near 1.0190, restricts the pair’s upside momentum.
-
06:10
Asian Stock Market: Risk-off tone accelerates as DXY recaptures 109.00, US ISM PMI is focus
- Asian equities are witnessing selling pressure amid a risk-off market mood.
- Chinese equities have declined after the downbeat Caixin Manufacturing PMI data.
- The DXY is attempting to establish above 109.00 ahead of US ISM PMI.
Markets in the Asian domain have witnessed a significant fall as investors have turned risk-averse ahead of the US ISM Manufacturing PMI data. Asian equities are facing the wrath of downbeat consensus for the US economic data. Also, the US dollar index (DXY) has displayed limited gains in the Asian session.
At the press time, Japan’s Nikkei225 plunged 1.60%, China A50 surrendered 0.46%, Hang Seng plummeted 1.52%, and Nifty50 surrendered 0.52%, however, the Indian 50-stock basket has recovered a majority of its losses after a gap down opening.
Japanese indices have witnessed a steep fall as the Bank of Japan (BOJ) announced a fixed-rate purchase plan for the cheapest to deliver Japanese Government Bonds (JGBs) consecutively for the 357th time for an extended period of time, as per Reuters. This will weaken the Japanese yen further due to more liquidity infusion in the economy. It will make imports more costly, hence it will impact corporate margins due to costly imported raw materials.
On the China front, the world’s second-largest economy is facing the headwinds of a lower growth rate. Chinese equities have witnessed selling pressure after the release of the downbeat Caixin Manufacturing PMI data. The economic data has been trimmed to 49.5 against the consensus of 50.2 and the prior release of 50.4. This has soared signs of de-growth in China.
Meanwhile, the US dollar index (DXY) is attempting an establishment above 109.00. The DXY is aiming higher as investors have ignored the lower consensus for US ISM Manufacturing PMI and are focusing on more rate hikes by the Federal Reserve (Fed) in its September monetary policy meeting. The Manufacturing PMI data is seen at 52.0 vs. 52.8 in the former release.
-
06:04
USD/TRY stays firmer around 18.20 as Turkiye hikes electricity, gas prices
- USD/TRY picks up bids to reverse the previous day pullback from weekly top.
- Turkish authorities raise prices of electricity, gas even as inflation runs hot.
- Hawkish Fed bets, risk-off mood also underpin the bullish bias.
- Key US data eyed for fresh impulse, risk catalysts are important too.
USD/TRY regains upside momentum, after posting the first daily loss in seven, as it picks up bids to 18.20 heading into Thursday’s European session. In doing so, the Turkish lira (TRY) pair justifies the market’s broad US dollar favor and the energy price increase at home.
“Turkish authorities hiked electricity and natural gas prices for households by around 20% and by around 50% for industry on Thursday,” said Reuters. The news also mentioned that the price hike puts further upside pressure on inflation, which was running at nearly 80% in July.
On the other hand, strong yields propel the US Dollar Index (DXY) amid increasingly hawkish Fed bets. That said, the CME’s FedWatch Tool portrays 74.0% chance of a 75 basis points Fed rate hike in September, versus 73.0% the previous day.
The US 10-year Treasury yields refresh a two-month high of around 3.21% while the two-year bond coupons jump to the highest levels since 2007, near 3.20% and 3.50% respectively at the latest. Also portraying the sour sentiment is the S&P 500 Futures’ 0.56% intraday fall to the lowest levels since late July, at 3,930 by the press time.
Also contributing to the DXY’s run-up is the risk-off mood. While portraying the sentiment, shares in the Asia-Pacific bloc grind lower while S&P 500 Futures drop half a percent at the latest. The reason could be linked to the central bankers’ aggression despite economic slowdown fears and grim covid conditions in China. Furthermore, the US-China tussles over Taiwan and softer China Caixin Manufacturing PMI are extra positives for the USD/TRY.
Looking forward, the US ISM Manufacturing PMI for August, expected 52.8 versus 52.0 prior, ahead of Friday’s US Nonfarm Payrolls (NFP). Also important will be the moves of the Treasury bond yields, as well as headlines surrounding China.
Also read: US ISM Manufacturing PMI Preview: Slowing growth or recession?
Technical analysis
A one-week-old horizontal resistance around 18.25 appears to restrict the short-term USD/TRY upside ahead of 2021 peak surrounding 18.35. Meanwhile, the RSI signals that the buyers are running out of steam, which in turn highlights the monthly horizontal support near 18.00 as the key downside level to welcome the bears.
-
05:47
Copper prints five-day downtrend as recession fears supersede China’s production fall
- Copper price holds lower ground near the one-month low flashed the previous day.
- Recently downbeat economic data, China’s covid conditions join hawkish central bankers to weigh on prices.
- Chile reports 8.6% YoY fall in copper production during July.
- Risk catalysts, US data are crucial for fresh impulse.
Copper price holds its place on the bear’s radar as it drops for the fifth consecutive day, and stays pressured around the one-month low heading into Thursday’s European session. The red metal’s latest weakness could be linked to the downbeat statistics from the global majors, as well as coronavirus at the world’s biggest metal consumer China. In doing so, the quote ignores a reduction in the output at one of the key producers of the commodity, namely Chile.
While portraying the moves, copper futures on the COMEX dropped more than 1.0% to $3.4790 by the press time. That said, a three-month copper on the London Metal Exchange (LME) was down 0.8% at $7,742.50 a tonne, as of 02:13 GMT, extending losses from the previous session, per Reuters. Above all, the October contract of the metal on the Shanghai Futures Exchange drops nearly 1.6%.
That said, China’s Caixin Manufacturing PMI marked the lowest prints in three months while suggesting a contraction in activities with a 49.5 figure, versus 50.2 expected and 50.4 prior. In doing so, the private manufacturing gauge tracks the official NBS PMI and highlights grim conditions at the world’s largest industrial player. On the same line was the US ADP Employment Change that rose by 132K versus 288K expected and 270K prior.
The chatters surrounding another ship blocking the moves in the Suez Canal, before the latest refloat, joined pessimism over China’s covid conditions and tussles with the US over Taiwan appear to weigh on the market sentiment of late. Recently, Taiwan's President Tsai Ing-Wen mentioned that Taiwan wants to expand its semiconductor industry collaboration with the US.
Elsewhere, hawkish Fed bets are an extra burden on the industrial metal. As per the CME’s FedWatch Tool, there is a 74.0% chance of a 75 basis points Fed rate hike in September, versus 73.0% the previous day.
Alternatively, impending details of China’s stimulus and an 8.6% YoY drop in the output of the world’s biggest copper producer Chile, during July, seem to challenge the copper bears.
While the market fears are negative for the metal prices, coupled with the hopes of receding demand and a firmer US dollar, headlines surrounding and the ISM Manufacturing PMI for August, expected 52.8 versus 52.0 prior, could entertain traders ahead of Friday’s US Nonfarm Payrolls (NFP).
-
05:36
GBP/USD Price Analysis: Breakdown of triangle warrants more weakness, 1.1400 eyed
- Lower tilted 20-and 50-EMAs add to the downside filters.
- A symmetrical triangle breakdown has underpinned the greenback bulls.
- The RSI (14) has shifted into the bearish range of 20.00-40.00.
The GBP/USD pair has displayed a vulnerable performance after surrendering the critical support of 1.1600 in the Asian session. The cable is declining vigorously and has printed an intraday low of 1.1571 as long-term inflation expectations have soared. As per Citi, the inflation expectations for a 10-year period have advanced to 4.8% against the desired rate of 2% by the Bank of England (BOE).
A breakdown of the symmetrical triangle chart pattern on an hourly scale has weakened the pound bulls. The upper portion of the above-mentioned chart pattern is placed from Tuesday’s high at 1.1761 while the lower portion is plotted from Monday’s low at 1.1645. The breakdown of the triangle has resulted in heavy volume and wider ticks.
Declining 20-and 50-period Exponential Moving Averages (EMAs) at 1.1610 and 1.1645 respectively are indicating more weakness ahead.
Meanwhile, the Relative Strength Index (RSI) (14) has shifted into the bearish range of 20.00-40.00, which has triggered a fresh selling leg.
A less-confident pullback move to near Wednesday’s low at 1.1600 will activate a bargain sell. An occurrence of the same will drag the asset towards 19 March 2020 low at 1.1472. A slippage below 1.1472 will drag the cable towards the round-level support at 1.1400.
On the flip side, a break above Wednesday’s average price at 1.1650 will send the asset towards the round-level resistance at 1.1700, followed by Tuesday’s high near 1.1760.
GBP/USD hourly chart
-637976037042413458.png)
-
05:23
USD/IDR Price News: Rupiah bears attack $14,900 on softer Indonesia Inflation, strong DXY
- USD/IDR picks up bids to snap two-day downtrend after softer Indonesia data.
- Indonesia Inflation eased to 4.69% YoY, -0.21% MoM in August.
- Fitch’s warning to Indonesian Banks join risk-off mood to propel the pair.
USD/IDR rises to $14,905 after Indonesia’s downbeat inflation data during Thursday’s Asian session. In doing so, the Indonesia rupiah (IDR) pair also takes clues from the broad risk-off mood, as well as the hawkish Fed bets, to snap a two-day downtrend.
Indonesia’s Inflation dropped to 4.69% YoY versus 4.90% expected and 4.94% prior in August. However, the Core Inflation rose to 3.04% versus 3.0% market forecasts and 2.86% prior. It should be noted that the monthly prints marked -0.21% figures compared to -0.05% consensus and 0.64% prior.
Also negative for the IDR were the comments from the global rating agency Fitch as it said, “Indonesian banks will face some compression of net interest margins (NIM) as policy interest rates increase in the next year or so, per Reuters. It’s worth noting that Fitch also expects the downside impact to be tepid while also suggesting that the Bank Indonesia (BI) will raise rates by a further 25bp before the end-2022 and another 100bp in 2023, following a 25bp increase in August 2022.
On the other hand, strong yields propel the US Dollar Index (DXY) amid increasingly hawkish Fed bets. That said, the CME’s FedWatch Tool portrays 74.0% chance of a 75 basis points Fed rate hike in September, versus 73.0% the previous day. The US 10-year Treasury yields refresh a two-month high of around 3.21% while the two-year bond coupons jump to the highest levels since 2007, near 3.51% at the latest. Also portraying the sour sentiment is the S&P 500 Futures’ 0.36% intraday fall to the lowest levels since late July, at 3,930 by the press time.
Also contributing to the DXY’s run-up, as well as the USD/IDR strength is the risk-off mood. While portraying the sentiment, shares in the Asia-Pacific bloc grind lower while S&P 500 Futures drop half a percent at the latest. The reason could be linked to the central bankers’ aggression despite economic slowdown fears and grim covid conditions in China. Furthermore, the US-China tussles over Taiwan and softer China Caixin Manufacturing PMI are extra negatives for the IDR.
Having witnessed the initial impact of Indonesia data, the USD/IDR traders should wait for the US ISM Manufacturing PMI for August, expected 52.8 versus 52.0 prior, ahead of Friday’s US Nonfarm Payrolls (NFP). Also important will be the moves of the Treasury bond yields, as well as headlines surrounding China.
Technical analysis
A one-month-old symmetrical triangle restricts immediate USD/IDR moves between $14,800 and $14,920.
-
05:13
Indonesia Core Inflation (YoY) above expectations (3%) in August: Actual (3.04%)
-
05:10
Indonesia Inflation (YoY) registered at 4.69%, below expectations (4.9%) in August
-
05:10
Indonesia Inflation (MoM) registered at -0.21%, below expectations (-0.05%) in August
-
05:05
USD/CAD stabilizes above 1.3150 as US ISM hogs limelight, oil below $90.00
- USD/CAD is juggling above 1.3150 as DXY has strengthened despite lower consensus for US ISM PMI.
- A decline in US ADP Employment Change was already expected as US techs went lay-off plans.
- Oil prices have slipped below $90.00 amid soaring recession fears.
The USD/CAD pair is attempting an establishment above 1.3150 as the US dollar index (DXY) has climbed above 109.00 in the Asian session. The asset has displayed a bullish open test-drive move and is expected to display more gains ahead. At the press time, the major recorded an intraday high of 1.3167.
The DXY defended the downside momentum on Wednesday despite a downward shift in US Automatic Data Processing (ADP) Employment Change. An unconventional methodology adopted by the ADP agency displayed job additions in the private sector by 132k, lower than the prior release of 288k. As big tech boys have preferred retrenchment to offset a decline in growth forecasts, the employment generation process was expected to go through severe pain.
Going forward, investors’ entire focus will remain on US ISM Manufacturing PMI data, which is seen lower at 52.0 than July’s print of 52.8. As the Federal Reserve (Fed) is hiking interest rates at a decent pace, cheaper funds are disappearing from the economy. This has forced the corporate to drop expansion plans and to put more filters on investment opportunities.
Meanwhile, oil prices have slipped below the psychological support of $90.00 as recession fears are accelerating sharply. Western central banks are good to announce a fresh leg of interest rate hikes to tame the inflationary pressures. Therefore, the overall demand is expected to face the wrath and eventually oil demand will remain vulnerable.
On the loonie front, the Canadian economy has grown by 3.3% on an annual basis, higher than the prior release of 3.1%. However, the Gross Domestic Product (GDP) data remained significantly lower than the consensus of 4.4%.
-
04:57
Gold Price Forecast: XAU/USD bears target $1,688 ahead of key US data – Confluence Detector
- Gold price licks its wounds near monthly lows after testing the $1,700 mark.
- US dollar rallies with yields as investors cheer hawkish Fed and ECB rate hike bets.
- XAU/USD could extend losses towards $1,688 on a firm break below $1,700.
Gold price is on a five-day downtrend, eyeing a sustained move below the $1,700 mark amid unrelenting buying interest seen around the US dollar. Markets seem to be convinced about a 75 bps Fed rate hike in September, reflective of the ongoing rally in the US Treasury yields across the curve. The two-year US rates are at their highest level since 2007 while the benchmark 10-year yields are at two-month highs above 3.20%. According to CME FedWatch Tool, there is a 72% probability of an outsized rate hike this month. Further, Eurozone inflation hit another record high at 9.1% in August, cementing a 75 bps Sept ECB rate hike. Expectations of aggressive tightening from the Fed and the ECB offset weak US ADP jobs data, weighing negatively on the non-yielding bullion. The bright metal now looks forward to the US ISM Manufacturing PMI and Nonfarm Payrolls data for fresh trading directives.
Also read: Gold Price Forecast: XAUUSD close to confirming a long-term double top
Gold Price: Key levels to watch
The Technical Confluence Detector shows that the gold price is gathering strength for the next push lower, as bears aim for the pivot point one-day S2 at $1,700.
If sellers find a strong foothold below the latter, a sharp sell-off towards the pivot point one-day S3 at $1,688 will be inevitable.
On the flip side, any recovery attempts will need acceptance above the convergence of the pivot point one-week S2 and the previous low four-hour at $1,707.
The previous day’s low of $1,710 will challenge the road to recovery, above which the Bollinger Band one-day Lower at $1,713 will come into play.
Further up, a dense cluster of resistance levels around $1,716 will be a tough nut to crack for bulls. That price zone is the confluence of the Fibonacci 38.2% one-day and SMA5 four-hour.
Here is how it looks on the tool
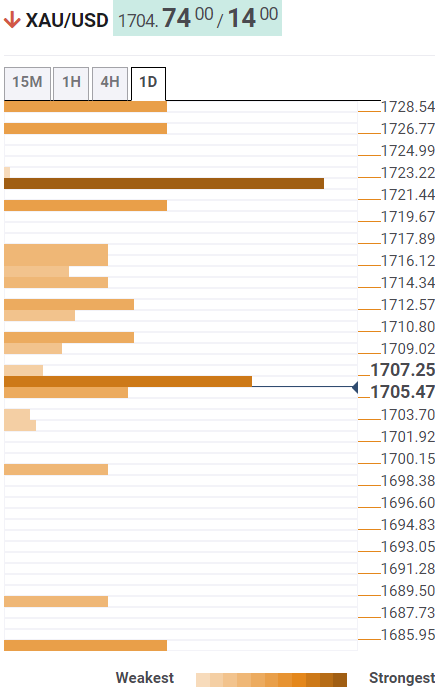
About Technical Confluences Detector
The TCD (Technical Confluences Detector) is a tool to locate and point out those price levels where there is a congestion of indicators, moving averages, Fibonacci levels, Pivot Points, etc. If you are a short-term trader, you will find entry points for counter-trend strategies and hunt a few points at a time. If you are a medium-to-long-term trader, this tool will allow you to know in advance the price levels where a medium-to-long-term trend may stop and rest, where to unwind positions, or where to increase your position size.
-
04:56
USD/INR Price News: Indian rupee bulls struggle near 79.50 amid hawkish Fed concerns
- USD/INR holds lower ground at two-week low, sidelined of late.
- Chatters surrounding India GDP, New Delhi’s likely inclusion in global bond markets defend bears.
- Risk-aversion, increasing bets on 0.75% Fed rate hike in September favor upside momentum.
- US data, China headlines can entertain traders ahead of NFP.
USD/INR pares recent losses around 79.60 as bulls and bears jostle amid mixed catalysts, snapping a two-day downtrend, ahead of Thursday’s European open. In doing so, the Indian rupee (INR) pair pays little heed to the latest positives surrounding the Indian economic growth and bond market expectations, as well as softer US data.
“India's economy grew 13.5% in the April-to-June quarter, its fastest pace in a year, though economists said growth is likely to lose momentum in coming quarters as higher interest rates cool economic activity,” reported Reuters. The news also mentioned that the last time India's economy grew faster was in April-June 2021 when it gained 20.1% from the pandemic-depressed level a year earlier.
Also exerting downside pressure on the USD/INR prices are expectations that India could be included in global bond indexes in 2023, given some estimates of passive inflows worth $30 billion, per Reuters.
Elsewhere, softer oil prices and the Reserve Bank of India's strong defense of the USD/INR pair above 80.00 also keep the sellers hopeful.
On the other hand, the strong US Treasury yields, as well as hawkish bets on the US Federal Reserve’s (Fed) next moves join the risk-off mood that underpins the US dollar’s safe-haven demand to propel the USD/INR prices.
Recently, Cleveland Federal Reserve Bank President Loretta Mester said on Tuesday that she was not anticipating the Fed to cut rates next year, as reported by Reuters. Further, the newly appointed Dallas Fed President Lory Logan joined the lines of hawkish fellow US central bankers while saying, “Restoring price stability is No. 1 priority.”
Amid these plays, the US 10-year Treasury yields refresh a two-month high of around 3.21% while the two-year bond coupons jump to the highest levels since 2007, near 3.51% at the latest. Further, the CME’s FedWatch Tool portrays 74.0% chance of a 75 basis points Fed rate hike in September, versus 73.0% the previous day.
Looking forward, the US ISM Manufacturing PMI for August, expected 52.8 versus 52.0 prior, could entertain the traders ahead of Friday’s US Nonfarm Payrolls (NFP).
Technical analysis
A sustained break of the monthly support line, now resistance around 79.80, keeps USD/INR bears hopeful of testing an upward sloping trend line support from early Marcy, at 79.10 by the press time.
-
04:35
USD/JPY renews 24-year high below 140.00 as hawkish Fed bets buoy DXY ahead of US NFP
- USD/JPY remains firmer around the highest levels since 1998 during five-day uptrend.
- US two-year Treasury yields rose to 15-year high as softer US data couldn’t tame hawkish Fed bets.
- Risk-negative headlines from China, Taiwan add strength to the upside momentum.
- US ISM Manufacturing PMI, risk catalysts are important to track for fresh impulse ahead of Friday’s NFP.
USD/JPY remains bid for the fifth consecutive day as it refreshes the highest levels since 1998, up 0.45% intraday near 139.60 during early Thursday morning in Europe. The yen pair’s latest run-up could be linked to the strong US Treasury yields, as well as hawkish bets on the US Federal Reserve’s (Fed) next moves. Also keeping the quote firmer is the risk-off mood that underpins the US dollar’s safe-haven demand.
That said, the US 10-year Treasury yields refresh a two-month high of around 3.21% while the two-year bond coupons jump to the highest levels since 2007, near 3.51% at the latest. Also portraying the sour sentiment is the S&P 500 Futures’ 0.56% intraday fall to the lowest levels since late July, at 3,930 by the press time.
Elsewhere, the CME’s FedWatch Tool portrays 74.0% chance of a 75 basis points Fed rate hike in September, versus 73.0% the previous day.
The hawkish Fed bets seem to ignore softer US data as the ADP Employment Change grew by 132K versus 288K expected and 270K prior. The reason could be linked to the average wage increases for August that rose 7.6% y/y and the same kept the Fed policymakers hawkish. Following the data, Cleveland Federal Reserve Bank President Loretta Mester said on Tuesday that she was not anticipating the Fed to cut rates next year, as reported by Reuters. Further, the newly appointed Dallas Fed President Lory Logan joined the lines of hawkish fellow US central bankers while saying, “Restoring price stability is No. 1 priority.”
In addition to the Fed-linked catalysts, Eurozone inflation data and the hawkish comments from the European Central Bank (ECB), as well as from the Bank of Japan (BOJ) policymakers, also portray the central bankers’ broadly hawkish stance and favor the USD/JPY rally.
Additionally, the chatters surrounding another ship blocking the moves in the Suez Canal, before the latest refloat, joined pessimism over China’s covid conditions, downbeat statistics and tussles with the US over Taiwan appear to weigh on the market sentiment of late. Recently, Taiwan's President Tsai Ing-Wen mentioned that Taiwan wants to expand its semiconductor industry collaboration with the US.
At home, Japan’s Jibun Bank Manufacturing PMI for August, 51.5 versus 51.0 initial forecast, seems to gain major attention. Also likely to have been ignored are comments from Japan’s Finance Ministry that stated, “Japan's government is watching currency moves with a ‘high sense of urgency’ as rapid exchange-rate moves are undesirable.”
Moving on, the US ISM Manufacturing PMI for August, expected 52.8 versus 52.0 prior, could entertain the traders ahead of Friday’s US Nonfarm Payrolls (NFP). Also important will be the moves of the Treasury bond yields, as well as headlines surrounding China.
Technical analysis
A clear upside break of July’s peak near 139.40 keeps USD/JPY bulls directed towards the 140.00 threshold. However, the 61.8% Fibonacci Expansion (FE) of the pair’s late March to early August moves, near 141.60, could join the nearly overbought RSI (14) to challenge the upside momentum.
-
04:27
Steel prices stay vulnerable on poor demand forecast, China Covid cases spike
- Steel prices have comfortably established below $100.00 amid trimmed demand forecasts.
- Resurgence in China’s Covid-19 situation may worsen demand for steel.
- Downbeat Caixin Manufacturing PMI has dented the market sentiment.
Steel prices are continuously auctioning below $100.00 for the past three weeks as market veterans are trimming steel demand forecast due to the lack of construction activities in China. As individuals are dodging mortgages to the banking sector, critical for real estate and construction activities, steel demand is fading dramatically.
Steel mill owners are banking on production cuts as steel stockpiles are accelerating faster due to weak demand in China. Major Angang Steel Co., near Beijing, cited that “it sees tough conditions persisting through the end of the year”.
The Chinese authorities are aware of the fact that the overall demand is dropping vigorously, which forced the People's Bank of China (PBOC) to adopt a ‘dovish’ stance on the Prime Lending Rate (PLR). It is worth noting that the PBOC trimmed its one-year PLR and five-year PLR by five and 15 basis points (bps) respectively. Also, economic stimulus is around the corner to spurt economic activities and eventually the growth rate.
Meanwhile, a resurgence in Covid-19 in China has refreshed fears of recession ahead. Major provinces of China have announced lockdown curbs to contain the Covid-19 spread. This may further result in a decline in overall economic activities.
Besides that, China’s Caixin Manufacturing PMI has trimmed to 49.5 against the consensus of 50.2 and the prior release of 50.4. This has soared signs of de-growth in China and it would be worthy of dictating that the steel demand would have also declined in August.
-
04:07
Japan’s Finance Ministry Official: Sudden fx fluctuations not desirable
Responding to the recent sharp depreciation of the yen, Japan’s senior Finance Ministry official said on Thursday, “sudden fx fluctuations not desirable.”
Additional quotes
No comment on every day-to-day forex moves.
Volatility is rising in recent forex market.
Watching fx moves with a high sense of urgency.
Market reaction
USD/JPY is trading at 139.52, up 0.43% on the day, reverting to the 24-high of 139.68 reached in the last hours.
-
03:53
GBP/USD could drop to the 1.10 zone in next few months – Scotiabank
Analysts at Scotiabank are out with their outlook on the British pound, leaning bearish amid a variety of discouraging fundamental factors.
Key quotes
“Beyond the stagflation risk, the GBP will not react well to renewed equity market weakness as central banks persist with interest rate increases.”
“The domestic political backdrop remains unhelpful.”
“Broad, trade-weighted index (TWI) measure of the pound could fall another 4-5% broadly or so before reaching the lows seen around the 1992 Exchange Rate Mechanism debacle, the 2008 financial crisis, the 2016 Brexit vote and the 2020 pandemic.”
“The fact that broad TWI losses stalled around 73.5 on each of those very different calamities for the pound suggests it is a point worth keeping a close eye on moving forward.”
“A return to that point in this cycle might imply — roughly — downside risks for GBP/USD to the 1.10 zone and upside risks for EUR/GBP to the 0.90 area in the next few months.”
-
03:47
EUR/USD oscillates above 1.0000 ahead of US ISM PMI, US NFP remains a key event
- EUR/USD is juggling in an 11-pips range, downside remains favored amid firmer DXY.
- Investors have trimmed manufacturing PMI forecasts due to rising interest rates by the Fed.
- A jumbo rate hike by the ECB looks likely as eurozone HICP has landed higher-than-expected at 9.1%.
The EUR/USD pair has turned sideways as investors are awaiting the release of the US ISM Manufacturing PMI data. The asset is oscillating in a narrow range of 1.0020-1.0031 in the Asian session after a downside move from Wednesday’s high at 1.0076. In the Asian session, the major extended its losses after surrendering the potential support of 1.0040. More downside looks favorable as the US dollar index (DXY) is aiming to establish itself above the round-level resistance of 109.00.
The investing community is aware of the consequences of hiking interest rates with higher velocity by the Federal Reserve (Fed). As liquidity has been squeezed dramatically from the economy, the investment spree by the corporate sector has witnessed a hiatus. Therefore, investors are bracing for a decline in economic activities. According to the preliminary estimates, the US ISM Manufacturing PMI is seen lower at 52.0 than the prior release of 52.8.
While the show-stopper event for this week will be the US Nonfarm Payrolls (NFP). Ahead of more comprehensive and considered US NFP data, the unconventional US Automatic Data Processing (ADP) has reported 132k new job additions in August in the private sector, much lower than the expectations of 288k.This has also accelerated fears of a severe decline in the US NFP, which may halt the DXY’s stalwart rally.
On the Eurozone front, an escalation in Harmonized Index of Consumer Prices (HICP) to 9.1% has soared hawkish bets n European Central Bank (ECB). Next week, a bumper rate hike announcement by ECB President Christine Lagarde looks likely as the inflation chaos is highly needed to be fixed sooner.
-
03:47
AUD/USD Price Analysis: Bulls could be encouraged at this juncture above 0.6790
- AUD/USD bears are moving in on critical support.
- Bulls could be encouraged if the price decelerates in key demand territory around 0.68 the figure.
AUD/USD has broken to the downside on further US dollar strength, reaching near to 0.68 the figure which could be a last push for the week before a significant bullish correction.
The bulls set a high for the week in the 0.6950s and the price is now carving out a fresh low for the week. Given the timings of the week, a pullback into stops above recent peaks could be in order for the day ahead before Nonfarm Payrolls on Friday:
Meanwhile, as per the prior analysis, AUD/USD is volatile around the Powell speech, but focus is on downside while below 0.7000, the price followed suit and melted to the downside as forecasted:
AUD/USD prior analysis
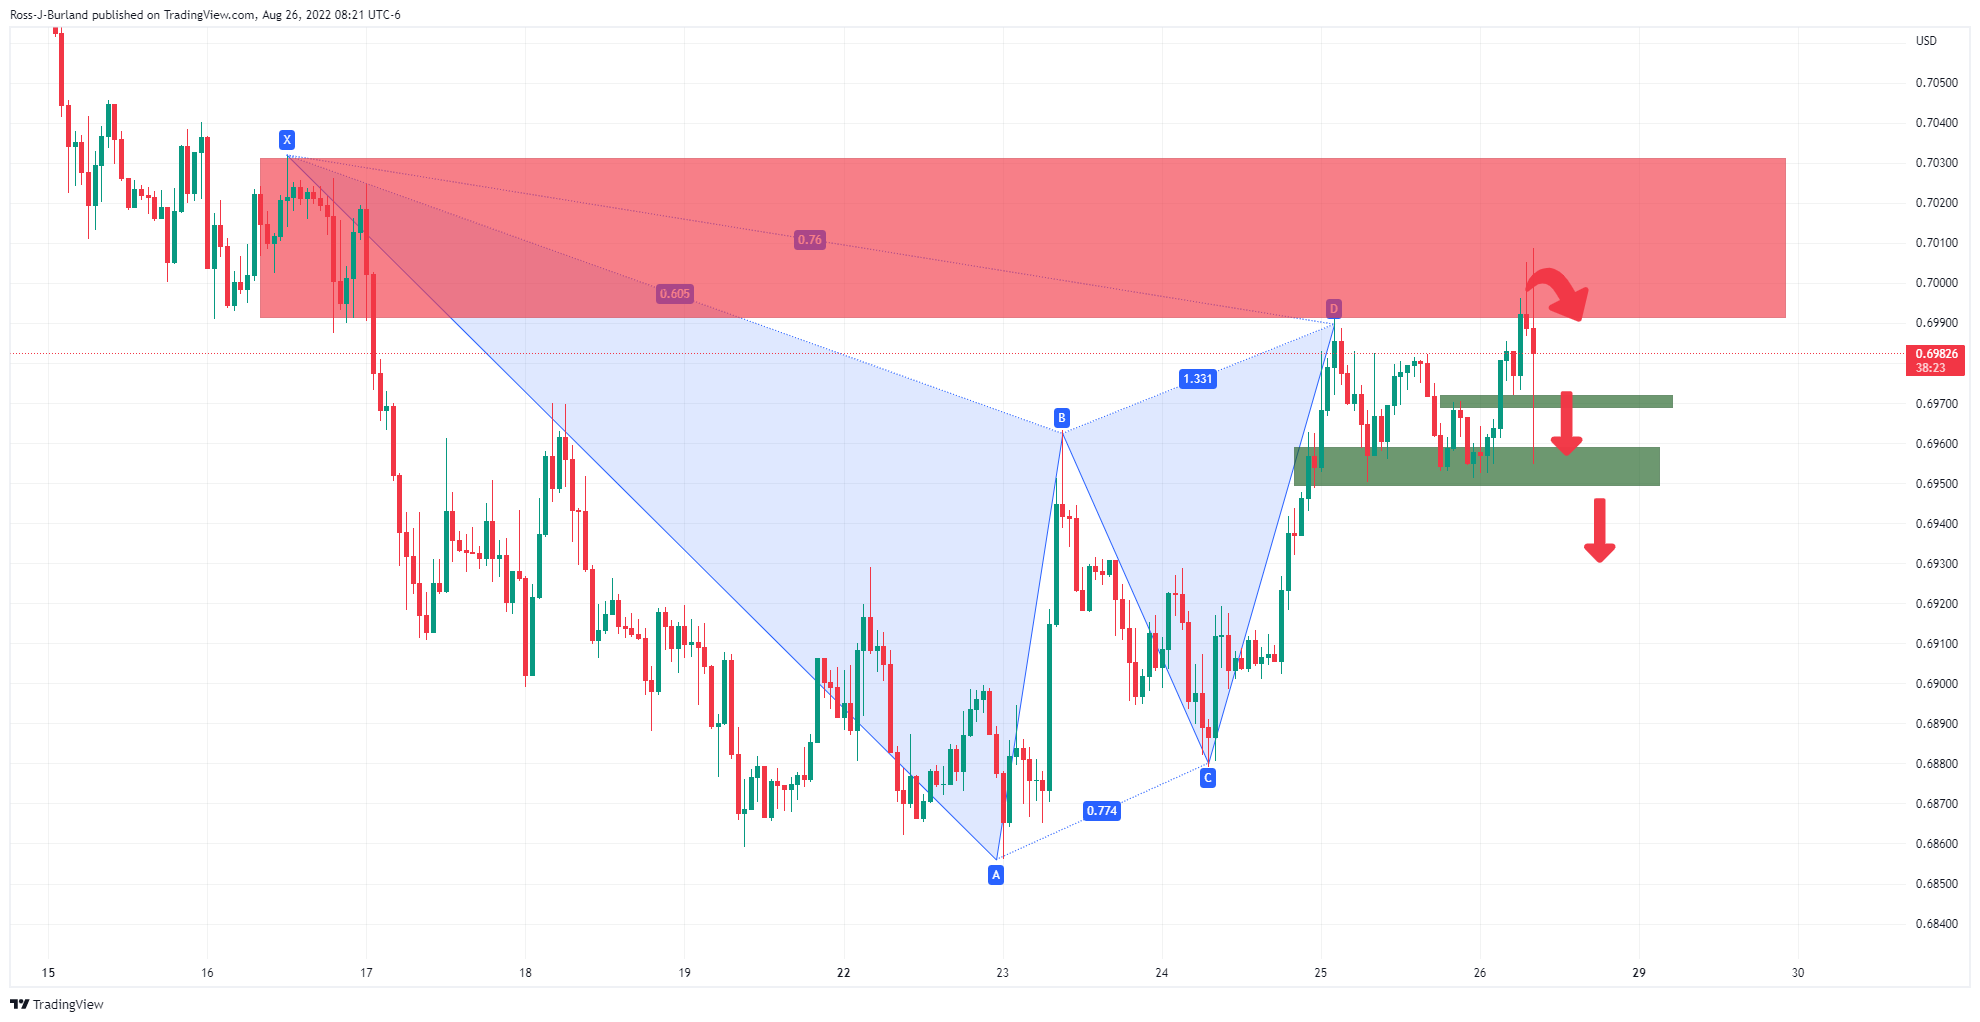
After...
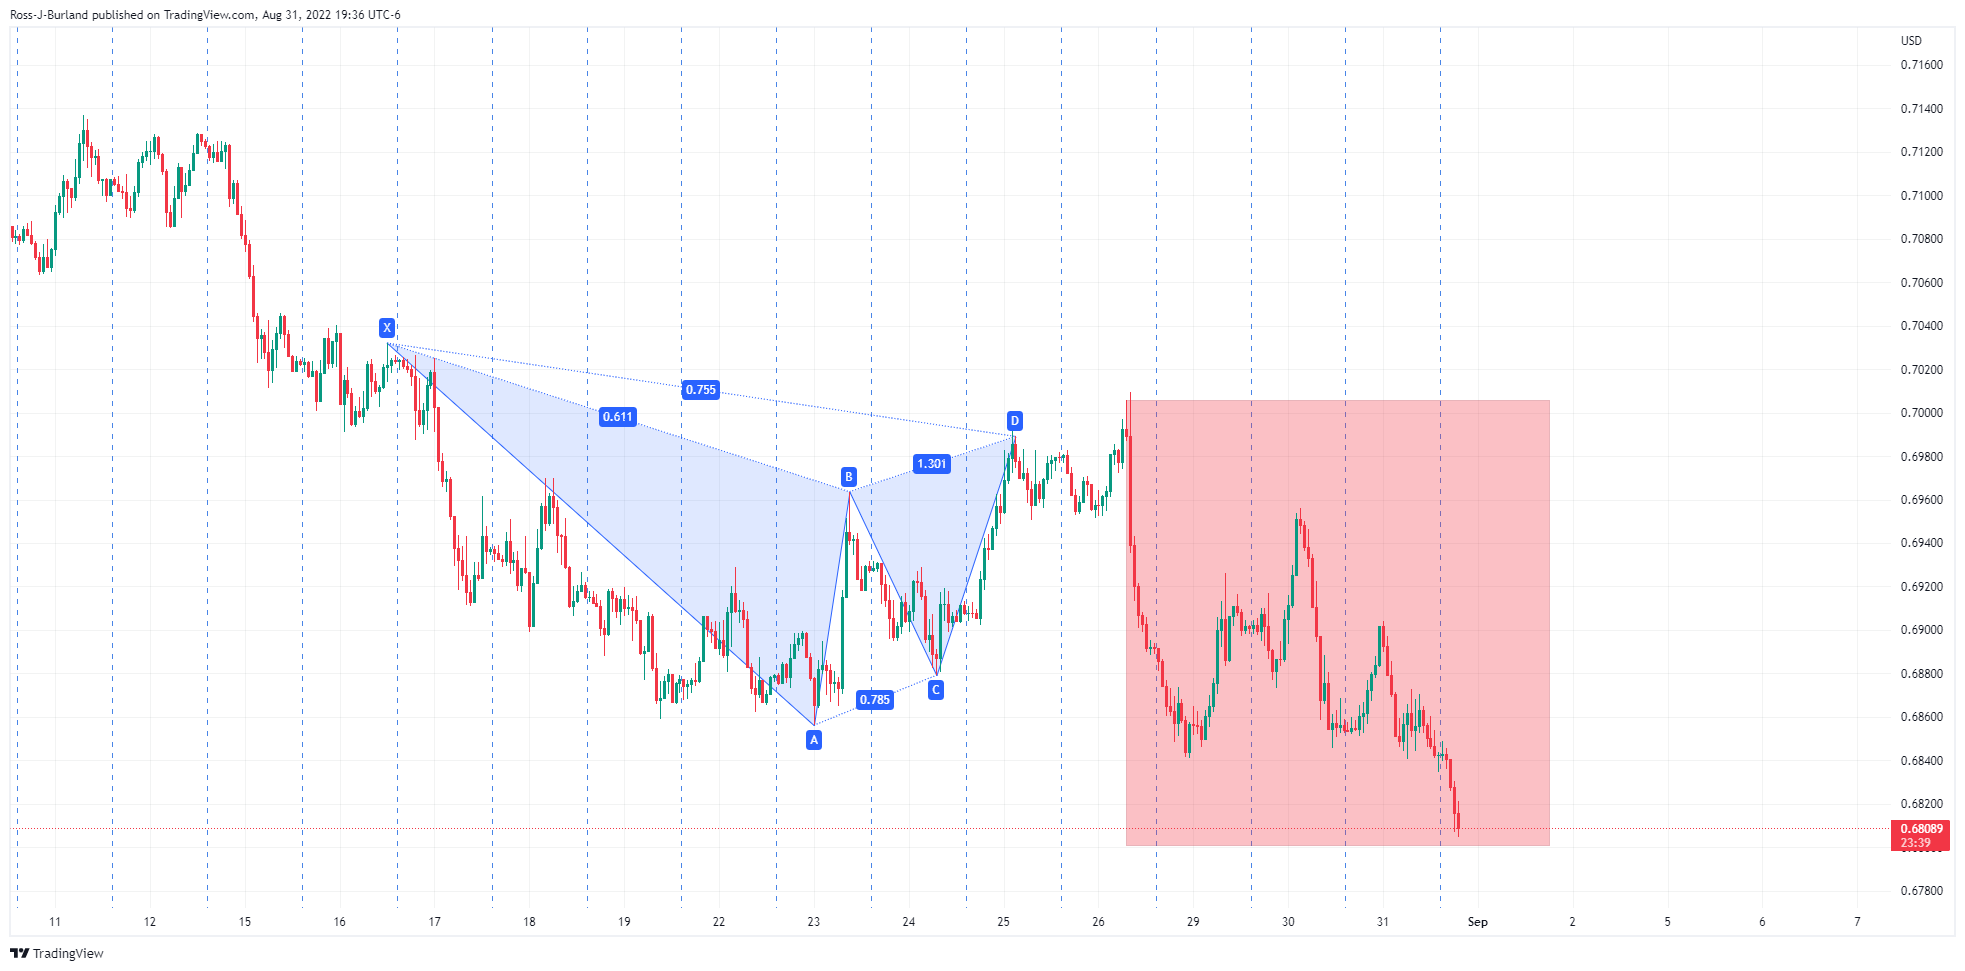
AUD/USD live update

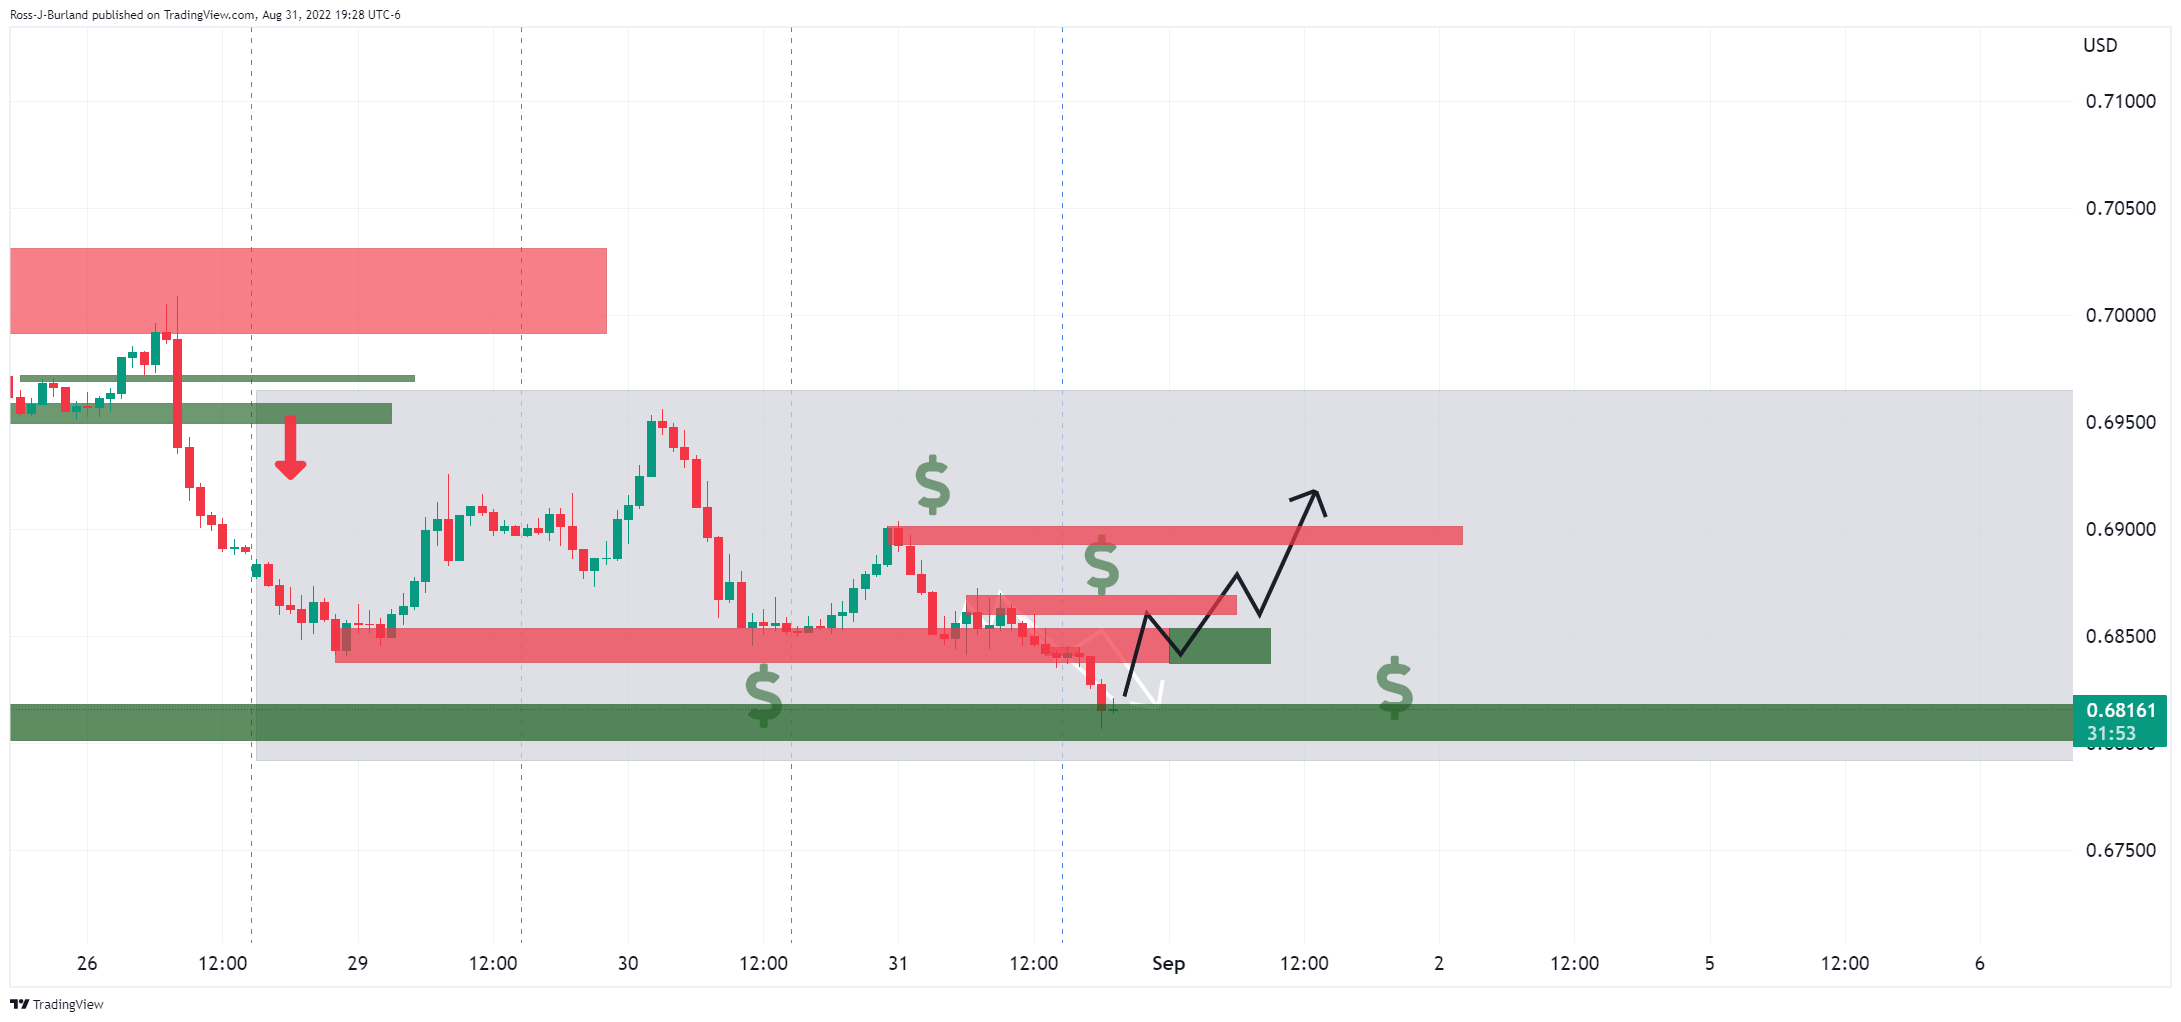
There are a couple of scenarios that point to a reversion to target the sell positions on the way down from the highs that were set this week near 0.6950 and the more recent swing highs around 0.69 the figure and 0.6875.
On the other hand, if the US dollar bulls stay in charge all the way into Friday's data, a break of 0.6790 as per the weekly chart could see a significant downside breakout:
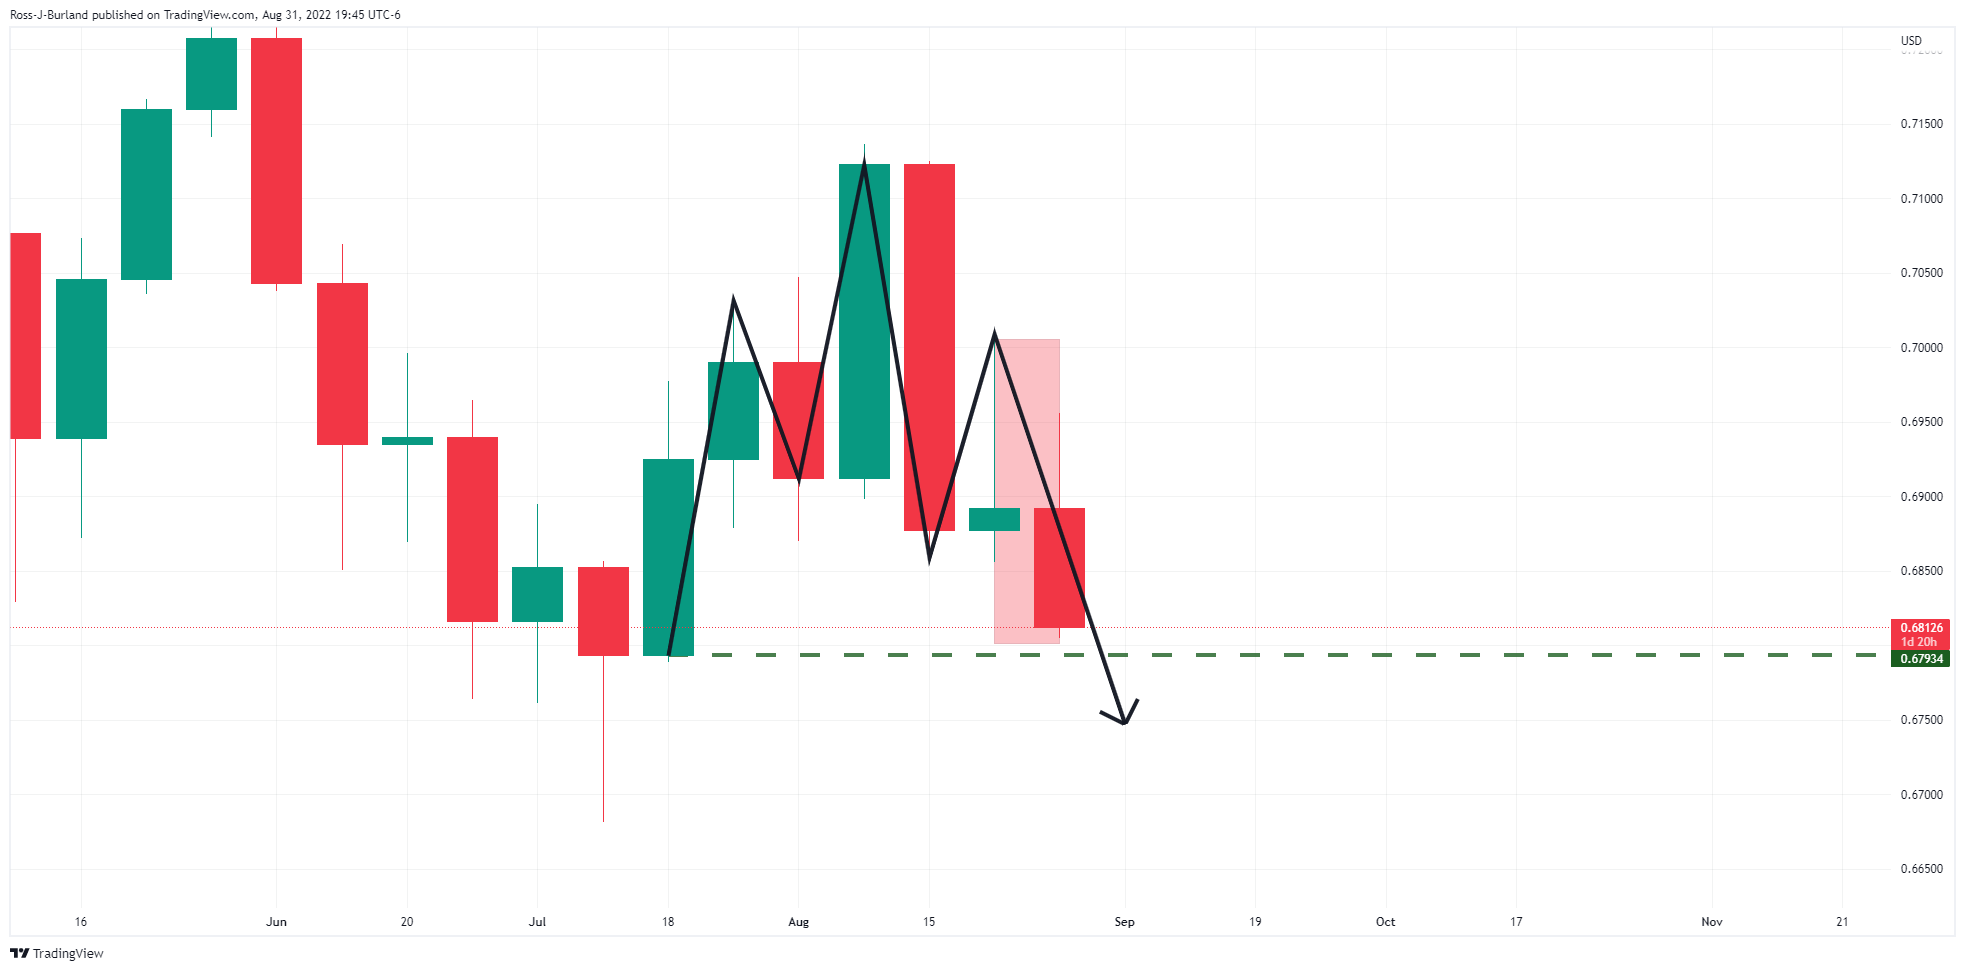
-
03:30
Commodities. Daily history for Wednesday, August 31, 2022
Raw materials Closed Change, % Silver 17.976 -2.35 Gold 1710.52 -0.73 Palladium 2080.9 -0.08 -
03:28
NZD/USD slides below 0.6100 on downbeat China PMI, sour sentiment, US NFP eyed
- NZD/USD drops to the fresh seven-week low during a three-day downtrend.
- China’s Caixin Manufacturing PMI traces official activity numbers to mark contraction for August.
- Aggressive Fed policymakers, China-linked economic fears and Eurozone energy crisis also add to the risk-off mood.
- US ISM Manufacturing PMI may entertain intraday traders but NFP is the key.
NZD/USD renews 1.5-month low after China’s activity numbers join broad risk-off mood to weigh on the Kiwi pair during Thursday’s Asian session. However, the cautious mood ahead of the top-tier US data tries to limit the downside, but eventually fails of late. That said, the pair pints 0.33% intraday loss during a three-day downtrend to 0.6090, at 0.6100 by the press time.
China’s Caixin Manufacturing PMI marked the lowest prints in three months while suggesting a contraction in activities with a 49.5 figure, versus 50.2 expected and 50.4 prior. In doing so, the private manufacturing gauge tracks the official NBS PMI and highlights grim conditions at the world’s largest industrial player.
Additionally, covid-led lockdowns in China and the escalating tussles with Taiwan also portray the dragon nation-linked risk-aversion. Recently, Taiwan's President Tsai Ing-Wen mentioned that Taiwan wants to expand its semiconductor industry collaboration with the US.
Alternatively, China will publish detailed steps for a set of newly-announced policy measures in early September, state media quoted the cabinet as saying on Wednesday, reported Reuters. The news also stated that China will guide commercial banks to provide medium- and long-term loans to key projects and equipment upgrading, the cabinet was quoted as saying.
On a broader front, strong US Treasury yields and central bankers’ aggression despite softer data appear to weigh on the NZD/USD prices. That said, the US 10-year Treasury yields refresh a two-month high of around 3.21% while the two-year bond coupons jump to the highest levels since 2007, near 3.51% at the latest. Also portraying the sour sentiment is the S&P 500 Futures’ 0.55% intraday fall to the lowest levels since late July, at 3,930 by the press time.
US ADP Employment Change rose by 132K versus 288K expected and 270K prior. However, the average wage increases in the US in August were 7.6% y/y and the same kept the Fed policymakers hawkish. Following the data, Cleveland Federal Reserve Bank President Loretta Mester said on Tuesday that she was not anticipating the Fed to cut rates next year, as reported by Reuters. Further, the newly appointed Dallas Fed President Lory Logan joined the lines of hawkish fellow US central bankers while saying, “Restoring price stability is No. 1 priority.”
Moving on, hopes of upbeat details of the Chinese stimulus and the US ISM Manufacturing PMI for August, expected 52.8 versus 52.0 prior, could entertain the NZD/USD traders ahead of Friday’s US Nonfarm Payrolls (NFP). It should be noted that the risk-off mood keeps bears hopeful.
Technical analysis
A three-week-old falling wedge’s bottom and the yearly low marked in July, respectively around 0.6065 and 0.6060, could test the NZD/USD bears. Alternatively, an upside break of the 0.6145 hurdle will confirm the bullish chart pattern but the NZD/USD buyers will need validation from the 50-SMA level surrounding 0.6170.
-
03:24
Taiwan President Tsai: Look forward to producing 'democracy chips' with US
"In the face of authoritarian expansionism and the challenges of the post-pandemic era, Taiwan seeks to bolster cooperation with the United States in the semiconductor and other high-tech industries,” Taiwan President Tsai Ing-wen said in a meeting with the visiting governor of the US state of Arizona, Doug Ducey, on Thursday.
"This will help build more secure and more resilient supply chains. We look forward to jointly producing democracy chips to safeguard the interests of our democratic partners and create greater prosperity,” Tsai added.
In response, Ducey said, "TSMC's legacy investment has elevated the potential for what's possible between Arizona and Taiwan. Arizona stands with Taiwan, and we look forward to building on the many opportunities ahead."
Market reaction
Growing trade relations between Taiwan and the US are unlikely to go down well with China, which could deepen the risk aversion and exacerbate the pain in the Chinese proxy, the AUD.
AUD/USD was last seen trading at 0.6815, down 0.34% on the day.
-
03:19
China’s Cabinet: Will publish detailed policy steps in early September
China’s state media quoted the cabinet meeting as saying that Beijing will publish detailed steps for a set of newly-announced policy measures in early September.
Key takeaways
China will guide commercial banks to provide medium- and long-term loans for key projects and equipment upgrading.
To prop up the weak property market, China will also support rigid housing demand.
"Local governments should have 'one policy for one city' to make good use of policy tools" and flexibly use the special loans for home delivery.
Related reads
- USD/CNH grinds higher past 6.9100 on softer China PMI, focus on stimulus, US NFP
- China's Caixin/ S&P Global Manufacturing PMI contracts to 49.5 in August vs. 50.2 expected
-
03:09
USD/CNH grinds higher past 6.9100 on softer China PMI, focus on stimulus, US NFP
- USD/CNH picks up bids to reverse the previous day’s losses, seesaws near two-year high.
- China’s Caixin Manufacturing PMI marked contraction, tracks official activity numbers for August.
- Chinese government to unveil details of stimulus during early September.
- Grim covid conditions, Fed vs. PBOC divergence keep buyers hopeful ahead of the key US data.
USD/CNH regains upside momentum, after snapping a three-day north-run the previous day, as downbeat activity data joins the risk-off mood during Thursday’s Asian session. However, the pair buyers seem cautious ahead of the anticipated release of the stimulus plan from the Chinese government.
China’s Caixin Manufacturing PMI marked the lowest prints in three months while suggesting a contraction in activities with a 49.5 figure, versus 50.2 expected and 50.4 prior. In doing so, the private manufacturing gauge tracks the official NBS PMI and highlights grim conditions at the world’s largest industrial player.
China will publish detailed steps for a set of newly-announced policy measures in early September, state media quoted the cabinet as saying on Wednesday, reported Reuters. The news also stated that China will guide commercial banks to provide medium- and long-term loans to key projects and equipment upgrading, the cabinet was quoted as saying.
Also fueling the pair are the covid-led lockdowns in China, as well as the escalating tussles with Taiwan. Recently, Taiwan's President Tsai Ing-Wen mentioned that Taiwan wants to expand its semiconductor industry collaboration with the US.
Furthermore, strong US Treasury yields and central bankers’ aggression despite softer data appear to fuel the USD/CNH prices. That said, the US 10-year Treasury yields refresh a two-month high of around 3.21% while the two-year bond coupons jump to the highest levels since 2007, near 3.51% at the latest. Also portraying the sour sentiment is the S&P 500 Futures’ 0.36% intraday fall to the lowest levels since late July, at 3,930 by the press time.
On Wednesday, US ADP Employment Change rose by 132K versus 288K expected and 270K prior. However, the average wage increases in the US in August were 7.6% y/y and the same kept the Fed policymakers hawkish. Following the data, Cleveland Federal Reserve Bank President Loretta Mester said on Tuesday that she was not anticipating the Fed to cut rates next year, as reported by Reuters. Further, the newly appointed Dallas Fed President Lory Logan joined the lines of hawkish fellow US central bankers while saying, “Restoring price stability is No. 1 priority.”
Not only in the US but strong Eurozone inflation data and the hawkish comments from the European Central Bank (ECB), as well as from the Bank of Japan (BOJ) policymakers, also portray the central bankers’ broadly hawkish stance.
Looking forward, hopes of upbeat details of the Chinese stimulus and the US ISM Manufacturing PMI for August, expected 52.8 versus 52.0 prior, could entertain the traders ahead of Friday’s US Nonfarm Payrolls (NFP).
Technical analysis
USD/CNH pullback remains elusive until breaking a three-week-old support line, near 6.8850 by the press time. That said, the latest multi-month high of 6.9326, marked on Monday, appears to lure the bulls.
-
02:54
AUD/USD refreshes monthly low near 0.6800 on downbeat Aussie/China data, risk-aversion
- AUD/USD takes offers to poke the lowest levels since July 19.
- Australia Private Capital Expenditure, Housing data joined downbeat China Caixin Manufacturing PMI to favor bears.
- Recession woes, China concerns propel risk-off mood, strong yields adds strength to the US dollar’s demand.
- US ISM Manufacturing PMI, second-tier jobs data may entertain traders ahead of US NFP, risk catalysts are important too.
AUD/USD drops to the fresh 1.5-month low around 0.6800 as bears cheer downbeat Aussie data and risk-off mood during Thursday’s Asian session. That said, the Aussie pair’s latest weakness could also be linked to the negative concerns surrounding the major customer China.
China’s Caixin Manufacturing PMI marked the lowest prints in three months while suggesting a contraction in activities with 49.5 figure, versus 50.2 expected and 50.4 prior.
Elsewhere, Australia’s Home Loans slumped by -7.0% in July versus -3.0% forecast and -3.3% prior. On the same line is the Investment Lending for Homes for the said month, -11.2% compared to -6.3%. It should be noted that the Aussie Private Capital Expenditure repeated the previous contraction of 0.3% during the second quarter (Q2), down from hopes of a 1.5% upside.
Talking about the risk, the US 10-year Treasury yields refresh a two-month high of around 3.21% while the two-year bond coupons jump to the highest levels since 2007, near 3.51% at the latest. Also portraying the sour sentiment is the S&P 500 Futures’ 0.36% intraday fall to the lowest levels since late July, at 3,930 by the press time.
It’s worth noting that the chatters surrounding another ship blocking the moves in Suez Canal joined pessimism over China’s covid conditions, downbeat statistics and tussles with the US over Taiwan appear to weigh on the market sentiment of late. Recently, Taiwan's President Tsai Ing-Wen mentioned that Taiwan wants to expand its semiconductor industry collaboration with the US.
Given the Fed policymakers’ latest hawkish mood, despite mixed data, AUD/USD bears are likely to keep reins as updates from China are also grim. However, today’s US ISM Manufacturing PMI for August, expected 52.8 versus 52.0 prior, could entertain the traders ahead of Friday’s US Nonfarm Payrolls (NFP).
Technical analysis
A clear downside break of May’s low, near 0.6830 directs AUD/USD bears towards early July’s bottom around 0.6760. Alternatively, a downward sloping support-turned-resistance line from early August, close to 0.6850, will join the 0.6830 hurdle to probe the pair’s corrective pullback.
-
02:46
China's Caixin/ S&P Global Manufacturing PMI contracts to 49.5 in August vs. 50.2 expected
China's Caixin/ S&P Global Maufacturing PMI for August arrived at 49.5 vs. 50.2 expected and 50.4 previous, showing that the country’s manufacturing sector activity returned to contraction.
The survey data signaled a downturn, as power cuts weigh on manufacturing sector performance in August.
Wang Zhe, Senior Economist at Caixin Insight Group said, “A resurgence of Covid-19 infections, coupled with a prolonged heat wave, weighed on the manufacturing sector.”
“Manufacturing supply expanded while demand shrank. Although output increased for the third successive month, the rate of expansion was marginal due chiefly to power cuts caused by the heat wave, Wang added.
AUD/USD attacks 0.6800
The downbeat print of the Chinese Manufacturing PMI renders negative for the aussie dollar, as AUD/USD is trading at 0.6808, down 0.44% on the day, at the time of writing.
-
02:46
China Caixin Manufacturing PMI registered at 49.5, below expectations (50.2) in August
-
02:44
Australia Home Loans came in at -7%, below expectations (-3%) in July
-
02:37
Australia Home Loans registered at -5.8%, below expectations (-3%) in July
-
02:37
Australia Investment Lending for Homes fell from previous -6.3% to -11.2% in July
-
02:35
USD/CHF Price Analysis: Further upside past 0.9800 appears difficult
- USD/CHF renews 1.5-month high inside three-week-old bullish channel.
- Overbought RSI, 61.8% Fibonacci retracement level challenges immediate upside.
- Channel’s top, July’s peak add to the upside filters.
- 100-DMA could probe bears before the bullish channel’s support line.
USD/CHF takes the bids to refresh the six-week high near 0.9805 during Thursday’s Asian session. In doing so, the Swiss currency (CHF) pair attacks the 61.8% Fibonacci retracement level of the May-August downside during the five-day uptrend.
It’s worth noting, however, that the overbought RSI (14) challenge the quote’s further upside near the 0.9800 threshold.
Even if the quote stays beyond 0.9800, the upper line of the three-week-long bullish channel, near 0.9820, could challenge the USD/CHF buyers.
If at all the prices ignore RSI and cross the hurdle near 0.9820, July’s peak of 0.9885 will act as the last defense of the bears.
On the contrary, pullback moves may initially test the 50% Fibonacci retracement level of 0.9715 before highlighting the 100-DMA support near 0.9680-75.
Should the USD/CHF sellers manage to conquer the 0.9680 support, the aforementioned channel’s support line, at 0.9650 by the press time, will be crucial before giving them control.
To sum up, USD/CHF remains on the bull’s radar but the upside room appears limited.
USD/CHF: Daily chart

Trend: Limited upside expected
-
02:33
Aussie CAPEX miss weighs on AUD/USD
The Private Capital Expenditure has been released as follows:
Australian Private Capital Expenditure Q2: -0.3% (exp 1.0%; prev -0.3%).
AUD remains pressured on the day following the data embarking on fresh lows towards 0.68 the figure.
More to come...
About the Private Capital Expenditure
The data is released by the Australian Bureau of Statistics measures current and future capital expenditure intentions of the private sector. It is considered as an indicator for inflationary pressures. A high reading is seen as positive (or bullish) for the AUD, while a low reading is seen as negative (or bearish).
-
02:30
Australia Private Capital Expenditure below forecasts (1.5%) in 2Q: Actual (-0.3%)
-
02:24
USD/CNY fix: PBoC set a stronger-than-expected yuan fixing for the seventh day
In recent trade today, the People’s Bank of China (PBOC) set the yuan (CNY) at 6.8821 vs. the previous fix of 6.8906 and the prior close of 6.8918. The central bank has set a stronger-than-expected yuan fixing for the seventh day.
About the fix
China maintains strict control of the yuan’s rate on the mainland.
The onshore yuan (CNY) differs from the offshore one (CNH) in trading restrictions, this last one is not as tightly controlled.
Each morning, the People’s Bank of China (PBOC) sets a so-called daily midpoint fix, based on the yuan’s previous day's closing level and quotations taken from the inter-bank dealer.
-
02:18
GBP/USD tumbles to near 1.1570 amid firmer DXY, US ISM PMI buzz
- GBP/USD has slipped significantly to near 1.1570 on soaring UK long-run inflation expectations.
- The DXY is aiming higher despite the downbeat US ADP Employment Change.
- As per the consensus, the US ISM Manufacturing PMI is seen lower at 52.0
The GBP/USD pair is falling like a house of cards as the US dollar index (DXY) has reclaimed the round-level hurdle of 109.00 in the Asian session. The asset is declining towards its two-year low near 1.1500. The cable has displayed a vertical downside move after surrendering the critical support of 1.1600. Also, the asset has continued its four-day losing streak after slipping below Wednesday’s low at 1.1599.
After a former opening, the DXY is scaling higher and is expected to recapture its 19-year high at 109.46. The DXY has picked significant bids despite the downbeat US Automatic Data Processing (ADP) Employment Change data. The US economy has added 132k new jobs in the private sector. The unconventional methodology adopted by the US ADP agency to display the labor market situation more precisely didn’t result in a confident decline in the DXY.
As the Federal Reserve (Fed) already warned about softening labor market due to consecutive bumper rate hike announcements, investors didn’t go for an extreme sell-off in the DXY. Going forward, the US ISM Manufacturing PMI will be of utmost importance. The economic data is seen lower at 52.0 against the former figure of 52.8. This might have a major impact on the DXY.
Meanwhile, pound bulls are weakened over soaring long-run inflation expectations, which are expected to hit 4.8%, as per Citi. Also, public expectations for inflation over the coming 12 months rose to 6.3%. As energy and electricity prices are advancing dramatically amid political instability, inflation expectations are soaring and have crossed the Bank of England (BOE)’s long-term target of 2%.
-
02:15
GBP/JPY fails to cheer strong yields around 161.50, UK PM Johnson’s final speech eyed
- GBP/JPY hesitates in extending the two-day downtrend, sidelined of late.
- Upbeat US Treasury yields, record borrowing costs in the UK fail to impress buyers.
- Economic, political pessimism surrounding Britain favor sellers but BOJ’s divergence keeps buyers hopeful.
GBP/JPY treads water around 161.50 during Thursday’s Asian session, snapping a two-day downtrend with the latest inaction performance. The cross-currency pair’s latest moves could be linked to the market’s anxiety amid mixed catalysts and a light calendar ahead of the key data.
In doing so, the quote also ignores firmer Treasury bond yields. That said, the US 10-year Treasury yields refresh a two-month high of around 3.21% while the two-year bond coupons jump to the highest levels since 2007, near 3.51% at the latest. Also portraying the sour sentiment is the S&P 500 Futures’ 0.36% intraday fall to the lowest levels since late July, at 3,930 by the press time.
At home, British households' expectations for average inflation over the next five to 10 years jumped to a record-high 4.8% in August, well above the Bank of England's 2% inflation target, a monthly survey from Citi and YouGov showed on Wednesday, reported Reuters. With this, the hawkish hopes from the Bank of England (BOE) should have ideally favored the GBP/JPY buyers. However, the lack of hopes from the BOE and political pessimism in the UK, as well as the nation's energy crisis, seem to exert downside pressure on the GBP/JPY prices.
Prime Minister Boris Johnson will say on Thursday that the recent rise in energy prices was a warning that Britain cannot be left at the mercy of international markets or "foreign despots" to meet its energy needs, per Reuters.
Elsewhere, Japan’s Industrial Production for July improved to -1.8% YoY versus -2.6% expected and -2.8% prior. Further, Retail Trade numbers for the said period also grew 2.4% YoY compared to 1.9% market forecasts and 1.5% prior. It’s worth noting that Bank of Japan (BOJ) monetary policy board member Junko Nakagawa recently mentioned on Wednesday that he hopes to discuss policy change in September based on data available.
Elsewhere, the chatters surrounding another ship blocking the moves in Suez Canal joined pessimism over China’s covid conditions, downbeat statistics and tussles with the US over Taiwan appear to weigh on the market sentiment of late, which in turn favor GBP/JPY sellers.
That said, the GBP/JPY traders should pay attention to today’s final speech of UK PM Johnson, as well as yields, for fresh impulse.
Technical analysis
A clear downside break of the monthly support line, near 160.95 by the press time, becomes necessary for the GBP/USD bears before challenging the yearly low near 159.45. Alternatively, the 100-DMA restricts immediate upside near 163.00.
-
02:00
UK long-run inflation expectations hit record 4.8% - Citi/YouGov
British households' expectations for average inflation over the next five to 10 years jumped to a record-high 4.8% in August, well above the Bank of England's 2% inflation target, a monthly survey from Citi and YouGov showed on Wednesday, reported Reuters.
The news gains major attention amid the biggest monthly jump in the UK’s 10-year borrowing cost since 1986.
The survey also mentioned that the public expectations for inflation over the coming 12 months rose to 6.3%.
GBP/USD slides
The survey fails to impress GBP/USD buyers amid broad US dollar upside, mainly due to the risk-off mood, as well as the political pessimism in the UK.
Also read: GBP/USD Price Analysis: Downside momentum loss to support cable, 1.1650 a critical hurdle
-
01:47
Gold Price Forecast: XAU/USD renews six-week low with eyes on $1,698, US NFP
- Gold price stands on slippery grounds, prints five-day downtrend to refresh 1.5-month low.
- Risk-aversion, firmer yields underpin US dollar rebound ahead of the key data.
- Headlines surrounding China, US ISM Manufacturing PMI could also entertain XAU/USD traders.
Gold price (XAU/USD) portrays the market’s risk-aversion wave as it drops to the lowest levels since July 21 amid a rush toward the US dollar. That said, the yellow metal declined for the fifth consecutive day to $1,706 during Thursday’s Asian session.
The risk-aversion wave could be well-witnessed in the strong US Treasury yields despite the softer US data. As a result, the US 10-year Treasury yields refresh a two-month high of around 3.21% while the two-year bond coupons jump to the highest levels since 2007, near 3.51% at the latest. Also portraying the sour sentiment is the S&P 500 Futures’ 0.36% intraday fall to the lowest levels since late July, at 3,930 by the press time.
US data wasn’t either too positive but could manage to keep the greenback buyers hopeful amid the recently loose links between ADP and Nonfarm Payrolls (NFP). Also exerting downside pressure on the sentiment are Taiwan-China tension, fresh covid woes in Beijing and the United Nations (UN) Human Resource Office mentioning that the Chinese government has committed ‘serious human rights violations’ in Xinjiang. Additionally, a blockage in the Suez Canal by Singaporean-flagged oil tanker Affinity V previously challenged the risk appetite but the latest refloating of the ship couldn’t trigger the optimism.
That said, US ADP Employment Change rose by 132K versus 288K expected and 270K prior. However, the average wage increases in the US in August were 7.6% y/y and the same kept the Fed policymakers hawkish.
Following the data, Cleveland Federal Reserve Bank President Loretta Mester said on Tuesday that she was not anticipating the Fed to cut rates next year, as reported by Reuters. Further, the newly appointed Dallas Fed President Lory Logan joined the lines of hawkish fellow US central bankers while saying, “Restoring price stability is No. 1 priority.”
Not only in the US but strong Eurozone inflation data and the hawkish comments from the European Central Bank (ECB), as well as from the Bank of Japan (BOJ) policymakers, also portray the central bankers’ broadly hawkish stance.
Given the central bankers’ aggression, today’s US ISM Manufacturing PMI for August, expected 52.8 versus 52.0 prior, could entertain the traders ahead of Friday’s US Nonfarm Payrolls (NFP). Should the outcome manages to portray firmer US job conditions, as well as activities, the XAU/USD may witness further downside.
Also read: US ISM Manufacturing PMI Preview: Slowing growth or recession?
Technical analysis
A clear downside break of the 1.5-month-old horizontal support, now resistance around $1,715, directs gold prices towards an area comprising lows marked during mid-July, near $1,698-96. Following that, the yearly bottom surrounding $1,680 will be in focus.
It’s worth observing that the RSI (14) is approaching the oversold territory and hence the XAU/USD may have limited downside room before posing a corrective pullback, which in turn highlights the $1,698-96 region for the bears.
Meanwhile, an upside clearance of $1,715 could direct gold price towards the 23.6% Fibonacci retracement level of June-July downside, near $1,728.
Following that, a 13-day-old resistance line and 21-day EMA, respectively near $1,741 and $1,747, as well as the $1,750 round figure, could challenge the gold price upside.
Gold: Daily chart
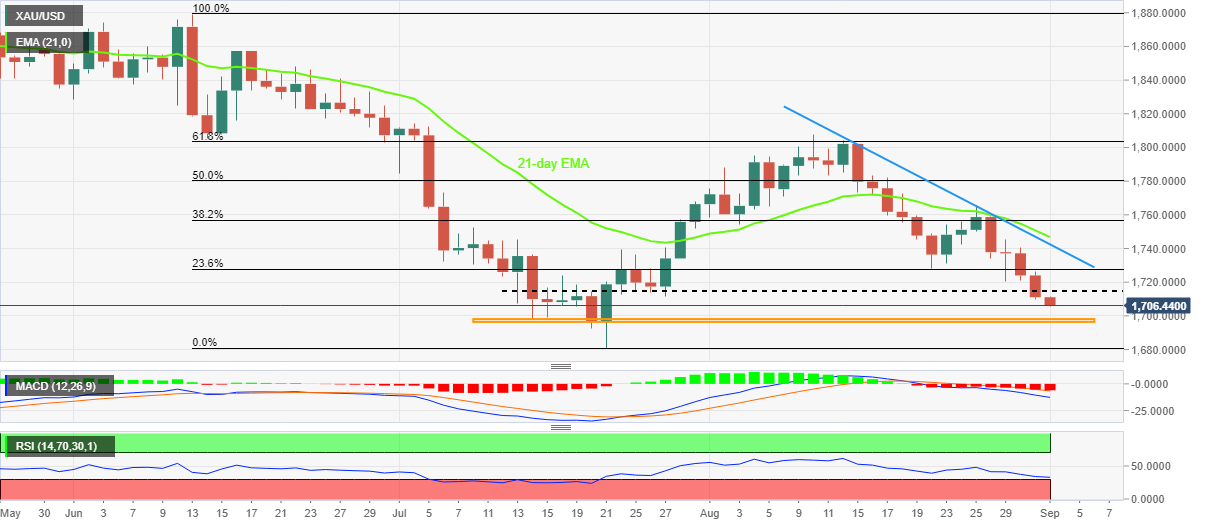
Trend: Limited downside expected
-
01:38
EUR/GBP struggles around 0.8660, upside remain favored on hawkish ECB bets
- EUR/GBP is facing weak barricades around 0.8660, a break above the same looks likely.
- The ECB is set to hike its interest rates next week as the HICP has crossed 9%.
- An extension in the energy supplies cut period to Germany may strengthen energy crisis fears.
The EUR/GBP pair has refreshed its two-month high at 0.8661 and is now struggling at elevated levels. The asset continued its four-day winning streak on Thursday after overstepping Wednesday’s high at 0.8653. The cross has displayed a sheer upside move after the inflation rate in the Eurozone crossed 9% comfortably.
On Wednesday, European Central Bank (ECB)’s preferred inflation indicator Eurozone Harmonized Index of Consumer Prices (HICP) landed at 9.1%, higher than the expectations of 9% and the prior release of 8.9%. As price pressures are soaring in the shared currency region amid accelerating energy bills after energy supply cuts by Russia, the inflation rate is skyrocketing.
This has strengthened the odds of a bumper rate hike announcement by the ECB next week. ECB’s Governing Council member and German central bank head Joachim Nagel on Wednesday cited that the ECB “urgently needs to act decisively next week,” He further added that “We need a strong rate hike in September,”
Apart from that, investors are also worried over an extension of unscheduled maintenance of the Nord Stream 1 pipeline under the Baltic Sea from Russia. The ongoing tensions between eurozone and Russia after the former boycotted oil and energy imports from the latter may result in an extension of the maintenance period as Russia eyes revenge. An occurrence of the same will accelerate fears of an energy crisis in Germany. As Germany is a core member of the European Union (EU), an occurrence of a German energy crisis could impact shared currency dramatically.
On the pound front, a light economic calendar holds shared currency responsible for movement in the cross ahead. On a broader note, political instability in the UK zone is weakening the sterling bulls. This month, elections for UK Prime Minister will be the key event to watch.
-
01:31
Japan Jibun Bank Manufacturing PMI above expectations (51) in August: Actual (51.5)
-
01:31
South Korea S&P Global Manufacturing PMI came in at 47.6 below forecasts (50.5) in August
-
01:30
Stocks. Daily history for Wednesday, August 31, 2022
Index Change, points Closed Change, % NIKKEI 225 -104.05 28091.53 -0.37 Hang Seng 5.36 19954.39 0.03 KOSPI 21.12 2472.05 0.86 ASX 200 -11.5 6986.8 -0.16 FTSE 100 -77.45 7284.15 -1.05 DAX -126.18 12834.96 -0.97 CAC 40 -85.12 6125.1 -1.37 Dow Jones -280.44 31510.43 -0.88 S&P 500 -31.16 3955 -0.78 NASDAQ Composite -66.94 11816.2 -0.56 -
01:15
Currencies. Daily history for Wednesday, August 31, 2022
Pare Closed Change, % AUDUSD 0.68418 -0.16 EURJPY 139.738 0.55 EURUSD 1.00504 0.35 GBPJPY 161.484 -0.13 GBPUSD 1.16154 -0.32 NZDUSD 0.61177 -0.2 USDCAD 1.31338 0.33 USDCHF 0.97783 0.37 USDJPY 139.037 0.2 -
01:14
EUR/USD Price Analysis: Snaps three-day uptrend, 0.9985 in the spotlight
- EUR/USD takes offers to refresh intraday low, extends pullback from weekly high.
- Impending bear cross on MACD, RSI retreat favor sellers.
- Convergence of 200-HMA, support line of weekly triangle appears tough nut to crack for sellers.
- Buyers need to cross 1.0090 to retake control.
EUR/USD bears return after a three-day absence as the quote renews its intraday low near 1.0030 during Thursday’s Asian session.
In doing so, the major currency pair retreats inside a one-week-old symmetrical triangle amid downbeat oscillators.
That said, the MACD teases bears and the recent weakness in the RSI (14) keeps EUR/USD bears hopeful.
However, the 1.0000 psychological magnet will precede the 0.9985 support confluence, including the 200-HMA and support line of the stated triangle, to restrict the short-term downside of the pair.
In a case where the EUR/USD remains weak past 0.9985, a south-run towards the monthly low of 0.9900, marked the last week, can’t be ruled out.
Meanwhile, recovery moves may initially aim for the 50% Fibonacci retracement level of August 18-23 downside, near 1.0050.
Following that, the triangle’s upper line and the 61.8% gold ratio, respectively around 1.0080 and 1.0090, could challenge the EUR/USD buyers.
It’s worth noting that the 1.0100 threshold could act as an extra upside filter to challenge the pair’s buyers before giving them control.
EUR/USD: Hourly chart
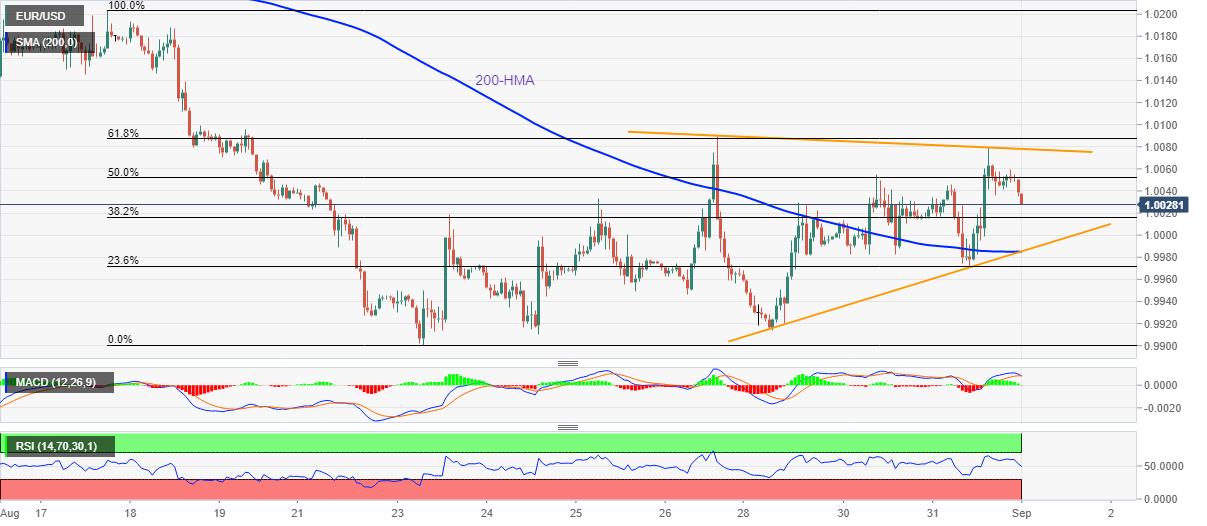
Trend: Further weakness expected
-
01:12
USD/JPY prints a fresh 24-year high at 139.40 ahead of US PMI
- USD/JPY has printed a fresh 24-year high at 139.44 amid firmer DXY.
- The US ISM PMI is expected to trim to 52 vs. 52.8 recorded earlier.
- The announcement of 357th JGBs for an extended period has weakened the yen bulls.
The USD/JPY pair is displaying a juggernaut upside move and has printed an intraday high of 139.44 in the early Tokyo session. The asset has picked significant bids after overstepping the crucial resistance of 139.00. The major is advancing vigorously and has printed a fresh 24-year high at 139.44 high ahead of the release of the US ISM Manufacturing PMI.
As per the market consensus, the US ISM Manufacturing PMI will land at 52, lower than the prior release of 52.8. No doubt, soaring price pressures have escalated interest rates significantly and have trimmed the overall demand. Therefore, the corporate sector is taking second thoughts while investing in new opportunities and capacity expansion plans. This has scaled down expectations for Manufacturing PMI.
The US dollar index (DXY) is aiming to recapture the round-level hurdle of 109.00 despite lower consensus for the US Nonfarm Payrolls (NFP). The economic data is expected to decline to 300k against the prior release of 528k. As the Federal Reserve (Fed) already warned about softening labor market at the Jackson Hole Economic Symposium, investors are not punishing the DXY.
On the Tokyo front, yen bulls will keep their eyes on commentary on the monetary policy meeting in September. Bank of Japan (BOJ)’s member Junko Nakagawa held economic data crucial for discussion on the continuation of prudent policy in September’s meeting. More significantly, the announcement of delivering the cheapest Japanese Government Bonds (JGBs) consecutively for the 357th time for an extended period of time has weakened the yen bulls.
-
01:09
S&P 500 Futures trace Wall Street’s losses, yields dribble at two-month high
- Market sentiment remains sour amid hawkish central bankers, concerns over China.
- Chatters over Suez Canada added to the risk-off mood of late.
- S&P 500 Futures remain pressured at five-week low, yields seesaws after rising the most in three weeks.
- US ISM Manufacturing PMI, NFP data are in focus after the latest softer US ADP.
Risk profile remains weak during Thursday’s Asian session as traders fear the central banks’ aggression despite recently mixed data. Also keeping traders on their toes are concerns surrounding China and Suez Canal blockage.
While portraying the mood, the S&P 500 Futures drop 0.36% intraday as bears keep reins at the lowest levels since late July, at 3,930 by the press time. Further, the US 10-year Treasury yields seesaw around 3.20% after rising the most in two weeks while poking the highest level since late June. It should be observed that the US two-year Treasury yields rise to the highest since 2007, at 3.52% by the press time.
US data wasn’t either too positive but could manage to keep the greenback buyers hopeful amid the recently loose links between ADP and Nonfarm Payrolls (NFP). That said, US ADP Employment Change rose by 132K versus 288K expected and 270K prior. However, the average wage increases in the US in August were 7.6% y/y and the same kept the Fed policymakers hawkish.
Following the data, Cleveland Federal Reserve Bank President Loretta Mester said on Tuesday that she was not anticipating the Fed to cut rates next year, as reported by Reuters. Further, the newly appointed Dallas Fed President Lory Logan joined the lines of hawkish fellow US central bankers while saying, “Restoring price stability is No. 1 priority.”
Not only in the US but strong Eurozone inflation data and the hawkish comments from the European Central Bank (ECB), as well as from the Bank of Japan (BOJ) policymakers, also portray the central bankers’ broadly hawkish stance.
Elsewhere, Taiwan’s first shooting at a Chinese drone and more virus-led lockdown on the dragon nation joined the second month of manufacturing activity contraction in China, per NBS Manufacturing PMI, to weigh on the risk appetite. On the same line was the latest statement from the United Nations (UN) Human Resource Office mentioning that the Chinese government has committed ‘serious human rights violations’ in Xinjiang. Additionally, a blockage in the Suez Canal by Singaporean-flagged oil tanker Affinity V previously challenged the risk appetite but the latest refloating of the ship couldn’t trigger the optimism.
Looking forward, the US ISM Manufacturing PMI for August could entertain the traders ahead of Friday’s US Nonfarm Payrolls (NFP).
Also read: US ISM Manufacturing PMI Preview: Slowing growth or recession?
-
01:01
Ireland Purchasing Manager Index Manufacturing: 51.1 (August) vs previous 51.8
-
01:01
US dollar bears are lurking, significant move shaping up
- US dollar is strong in the Asian market but bulls are running into a key hourly resistance.
- The focus is on the NFP at the end of the week.
The US dollar has been pressured against a basket of peer currencies midweek, but the greenback is on track for its third-straight monthly rise as investors position for a sizeable interest rate hike from the US Federal Reserve.
The dollar index, DXY, which measures the greenback against a basket of six currencies, was last up 0.13% at 108.83, albeit down from Monday's two-decade peak of 109.48. Nevertheless, the index is on track for a rise of over 3% in August, and its highest end-of-month closing level since May 2002.
US Treasury yields have been bolstered by record-high inflation in parts of the world and the compounding recession fears have served as a bullish landscape for the greenback. The two-year US Treasury yield, which is relatively more sensitive to the monetary policy outlook in the US, hit a 15-year high at 3.499% overnight but eased back towards 3.446% by the close of play. The 10-year Treasury yield, which hit a two-month high of 3.153% but was moving in on the 3.2% mark in early Asia, supporting the greenback.
Traders are now pricing in about a 70% chance of a 75 basis points Fed rate hike next month, according to data from Refinitiv following Fed officials reiterating their support for further rate hikes. New York Fed President John Williams told Wall the Wall Street Journal that inflation expectations in the US were well anchored but added that it would take a few years to bring inflation back to 2%. Richmond Federal Reserve Bank President Thomas Barkin explained on Tuesday that the United States is facing "post-war-like" inflation.
Meanwhile, from a technical stance, however, if the bears commit today in Tokyo's and London's sessions, this could be the catalyst for a major turnaround in the greenback as we head into the Nonfarm Payrolls on Friday. The analysts at TD Securities explained that ''employment likely continued to advance robustly in August but at a more moderate pace following the booming 528k print registered in July. High-frequency data, including Homebase, point to still above-trend job creation.'' The analysts also look for the UE rate to drop by a tenth for a second consecutive month to 3.4%, and for wage growth to advance at a firm 0.4% MoM (5.3% YoY).
DXY hourly chart
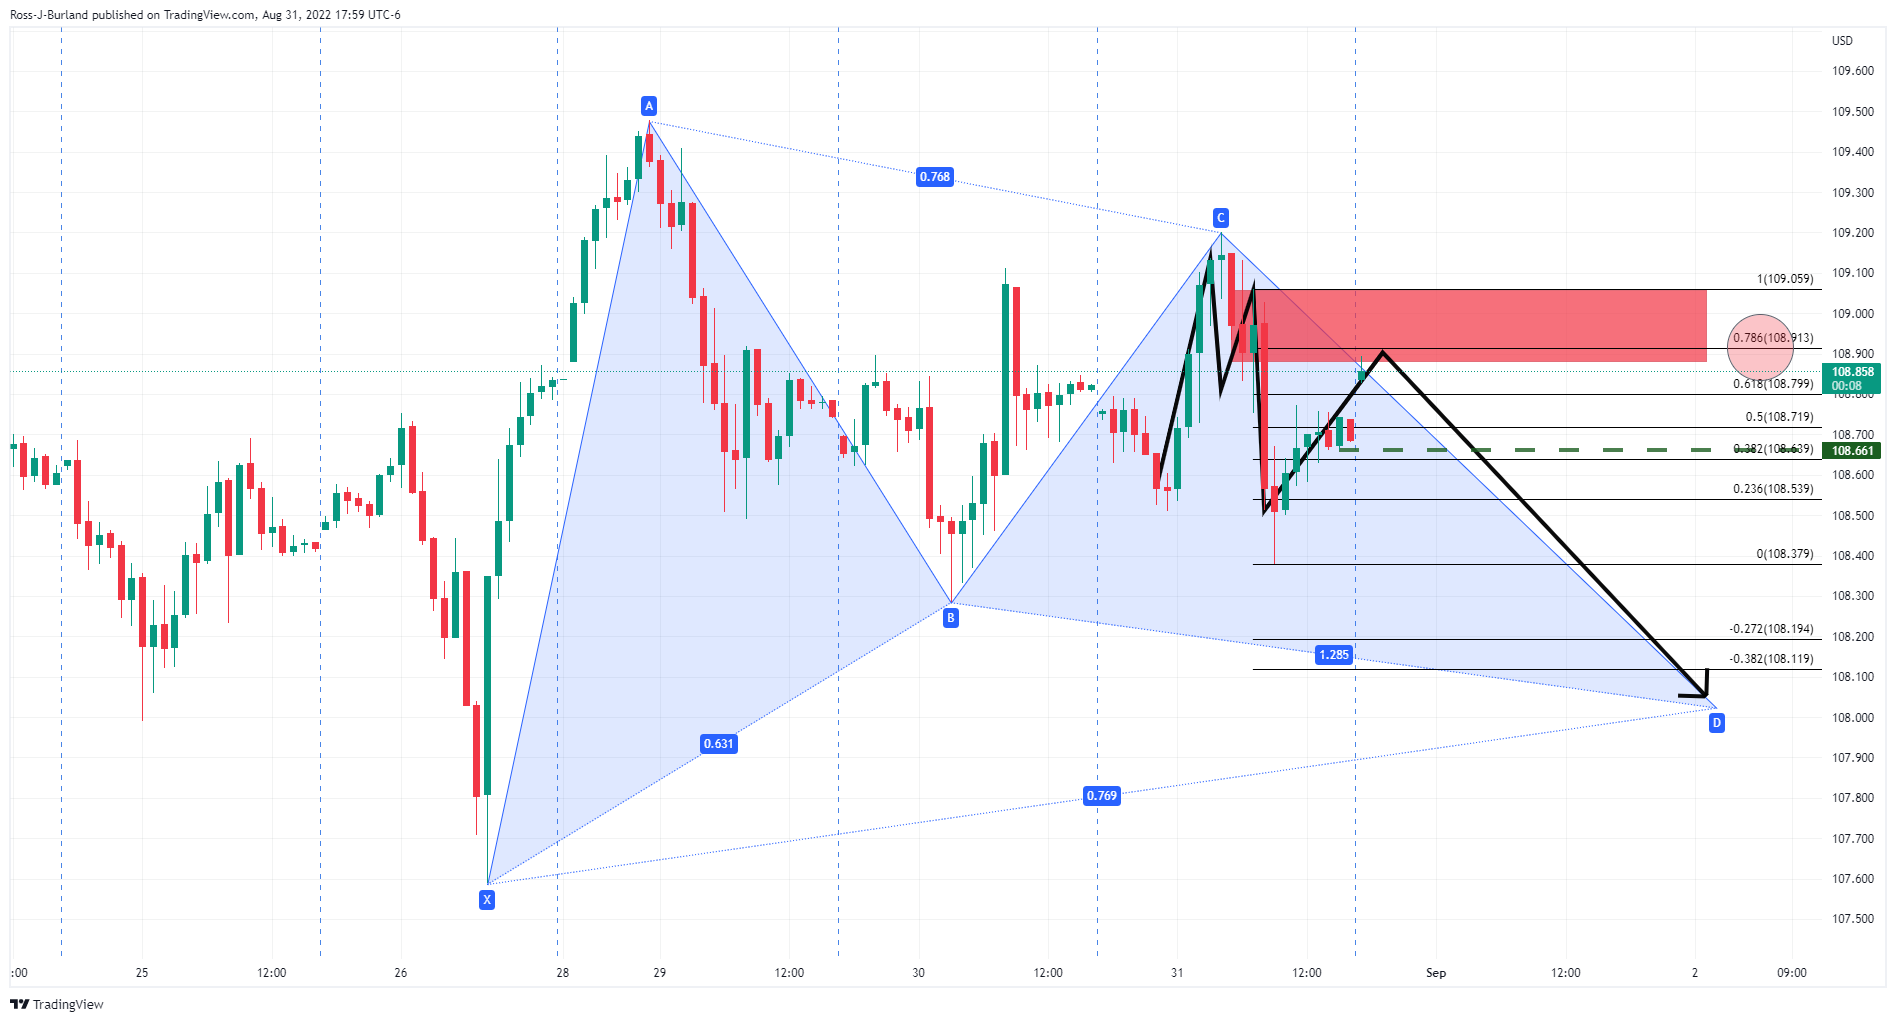
The M-formation has drawn the price into the neckline and near a 78.6% Fibonacci retracement level, but if resistance were to hold, there would be prospects of a bearish move to complete a Gartley pattern. The key support is 108.6610 in that regard.
-
01:01
South Korea Trade Balance below expectations ($-8B) in August: Actual ($-9.47B)
-
00:51
Japan Capital Spending up to 4.6% in 2Q from previous 3%
-
00:50
Japan Foreign Bond Investment dipped from previous ¥-79.2B to ¥-303.7B in August 26
-
00:50
Japan Foreign Investment in Japan Stocks declined to ¥-536B in August 26 from previous ¥28.5B
-
00:41
NZD/USD Price Analysis: Retreats towards 0.6100 inside monthly falling wedge
- NZD/USD remains pressured around six-week low marked on Monday.
- Falling wedge formation teases buyers to take a risk but RSI hints at further downside.
- Convergence of the 100-SMA and 200-SMA appears a tough nut to crack for bulls.
NZD/USD prints a three-day downtrend while posting mild losses around 0.6115 during Thursday’s Asian session. In doing so, the Kiwi pair stays near the lowest levels in 1.5 months, tested earlier in the week.
That said, the quote’s latest weakness could be linked to the U-turn from a three-week-old resistance line forming part of the falling wedge bullish chart pattern. The downside momentum also takes clues from the RSI (14).
Hence, the quote’s further weakness towards the weekly bottom of 0.6100 can’t be ruled out.
However, the stated wedge’s bottom and the yearly low marked in July, respectively around 0.6065 and 0.6060, could test the NZD/USD bears.
It should be noted that the RSI might have turned oversold around the yearly low, which in turn signals a corrective pullback, failing to portray the same could quickly drag the quote towards the 0.6000 psychological magnet.
On the contrary, an upside break of the 0.6145 hurdle will confirm the bullish chart pattern but the NZD/USD buyers will need validation from the 50-SMA level surrounding 0.6170.
Also acting as the key upside hurdle is the 100 and 200 SMA confluence, near 0.6260-55.
NZD/USD: Four-hour chart
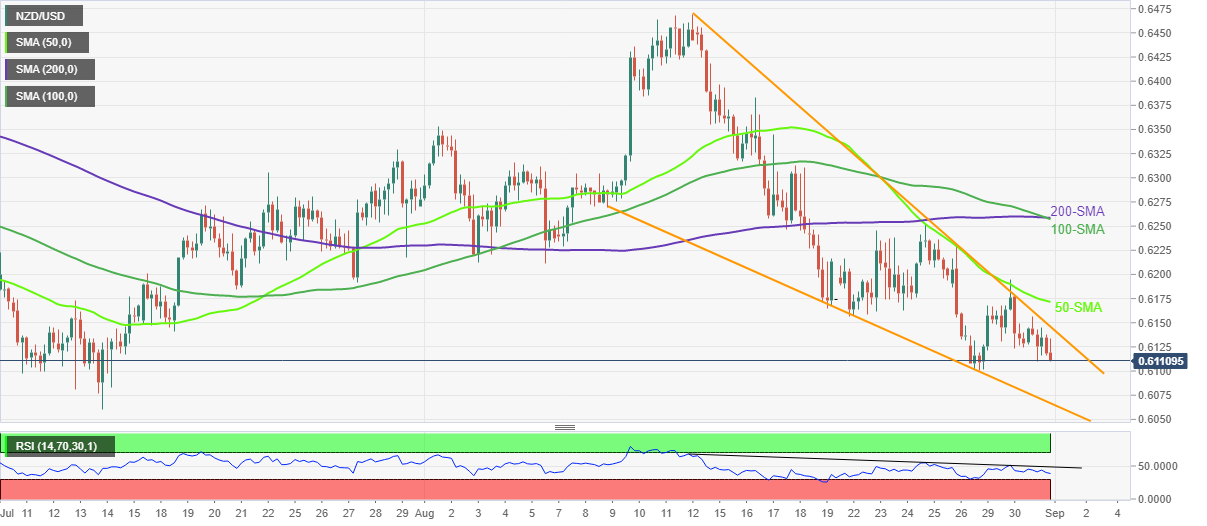
Trend: Limited downside expected
-
00:40
AUD/NZD attempts to build a cushion around 1.1170 ahead of RBA policy
- AUD/NZD is defending the immediate support of 1.1170 as focus shifts to RBA.
- A fourth consecutive 50 bps OCR hike is expected from the RBA next week.
- Upbeat Building Permits strengthened the kiwi bulls.
The AUD/NZD pair has turned volatile as aussie bulls are fighting firmly to defend the crucial support of 1.1170 in the early Tokyo session. The asset is expected to remain sideways further amid the unavailability of a potential trigger. However, investors are focusing on September’s monetary policy announcement by the Reserve Bank of Australia (RBA), which is due next week.
Aussie bulls are attempting to defend the cushion of 1.1170 despite the weaker release of the Mfg index by the Australian Industry Group (AIG). The economic data landed at 49.3, significantly lower than the prior release of 52.5. As the RBA is hiking its Official Cash Rate (OCR) consecutively with bumper size, cheap money is disappearing from the economy. Due to the unavailability of cheaper money, companies are left with limited funds, which they are deploying in ultra-filtered investment opportunities only.
Next week, RBA Governor Philip Lowe is expected to announce the fourth consecutive 50 basis points (bps) interest rate hike. As price pressures have reached rooftops in the Australian economy, restrictive monetary policy is highly expected to fix the inflation chaos.
Meanwhile, the kiwi dollar got strengthened after the release of the upbeat Building Permits data. The economic data improved dramatically to 5% against the prior release of -2.2%. After a clarity from the Reserve Bank of New Zealand (RBNZ) Governor Adrian Orr on guidance over interest rates, investors have supported kiwi against aussie. RBNZ’s Orr announced two more rate hikes ahead this year to tame the inflationary pressures at Jackson Hole Economic Symposium.
-