Notícias do Mercado
-
23:43
GBP/USD sees a pullback to near 1.1500 as positive tone recovers, Fed/BOE policy in focus
- GBP/USD is expecting a pullback move after a perpendicular drop as the risk profile is turning positive.
- The BOE could announce the highest rate hike by 75 bps in the current rate hike cycle.
- The Fed may accelerate interest rates by 75 bps and the target range of rates may top around 5%.
The GBP/USD pair witnessed fresh demand around 1.1460 in the early Tokyo session. A pullback move in the cable looks favored as the risk-on impulse is getting traction. S&P500 futures have attempted a recovery after a bearish Monday while the 10-year US Treasury yields have also dropped to 4.05%.
The US dollar index (DXY) witnessed a vertical rise to near 111.50 after overstepping the critical hurdle of 111.00 as uncertainty ahead of monetary policies by the Federal Reserve (Fed) and the Bank of England (BOE) raised the credibility of safe-haven assets.
Analysts at Rabobank have come forward with a 75 basis point (bps) rate hike projection. Earlier, analysts were expecting a full percent rate hike after the disaster of the mini-budget under the leadership of former UK PM Liz Truss and Chancellor Kwasi Kwarteng.
However, novel leadership formation led by the appointment of Rishi Sunak as UK PM and Jeremy Hunt as Chancellor has infused optimism. They explain that it would still be the largest rate hike of this cycle. On policy guidance, analysts expect rates to peak at 4.75%.
The pound bulls could remain under pressure as UK’s business confidence has dropped to pandemic levels. The UK Consumer Confidence fell 1 point to 15% in the October survey, as reported by Bloomberg. However, the majority of employers are expecting that staff will increase for the first time in five months.
On the US front, the Fed is set to raise the target range for the federal funds rate by 75 bps to 3.75- 4.00% on Wednesday, in a note from analysts at Rabobank. They further added that “We expect a 50 bps hike in December, followed by two hikes of 25 bps in February and March, which would take the top of the target range to 5.00%.
-
23:41
Bond yields are currently likely in the process of topping out – JP Morgan
Analysts at JP Morgan highlight the recently sluggish Treasury bond performance while suggesting a pullback in the coupons as they said, “Bond yields are currently likely in the process of topping out.”
While citing the reasons, the investment bank stated that the disinflation phase has begun.
JP Morgan also mentioned that inflation will drop meaningfully lower in three to six months.
The US-based bank forecasts that core inflation will be at 5.3% YoY in the first quarter (Q1) of 2023, compared to the latest print of 6.6%.
It’s worth noting that the yields began the week on the positive side before marking a retreat as traders turn cautious ahead of the key US Wednesday’s all-important Federal Open Market Committee (FOMC) meeting and Friday’s Nonfarm Payrolls (NFP). That said, the US 10-year Treasury yields remain sidelined near 4.05% by the press time.
Also read: Forex Today: Dollar strengthens ahead of RBA, Fed and more
-
23:32
USD/CHF snaps three-day uptrend above parity level ahead of US ISM PMI
- USD/CHF seesaws around one-week high, prints mild losses.
- Mildly bid US stock futures, sluggish Treasury yields probe DXY bulls.
- Hawkish Fed bets, geopolitical/covid fears keep buyers hopeful.
USD/CHF bulls take a breather, following a three-day uptrend, as the quote makes rounds to 1.0010-15 during Tuesday’s Asian session. In doing so, the Swiss currency (CHF) pair seesaws around the highest level in a week while printing mild losses at the latest.
The pair’s recent weakness could be linked to a pause in the US Treasury yields’ run-up after a two-day winning streak. On the same line could be the mild gains of the S&P 500 Futures despite the Wall Street benchmark’s negative closing.
The downbeat US data and hopes of more easing in the oil prices, and inflation in turn, appeared to have exerted downside pressure on the US dollar. That said, the US Chicago Purchasing Managers’ Index and Dallas Fed Manufacturing Business Index for October came in at 45.2 and -19.4 versus 47.0 and -15.0 expected respectively.
“US President Joe Biden on Monday called on oil and gas companies to use their record profits to lower costs for Americans and increase production, or pay a higher tax rate, as he battles high pump prices with elections coming in a week,” said Reuters.
However, the market’s fears of hawkish Fed and cautious mood ahead of the key central bank announcements, as well as the employment data, underpinned the US dollar’s demand.
Looking forward, the USD/CHF traders may seek more clues to extend the latest pullback, which in turn highlights the Swiss SVME Purchasing Managers’ Index for October, expected 56 versus 57.1 prior. Following that, the US ISM Manufacturing PMI, likely to ease to 50.0 versus 50.9 prior, will direct immediate USD/CHF moves. Additionally, The US S&P Global Manufacturing PMI for the stated month, expected to confirm the initial forecast of 49.9 figure, will join the JOLTS Jobs Openings for September, forecast 10M versus 10.053M prior, to also entertain the pair traders.
Technical analysis
An upward-sloping trend line from late Thursday, around 0.9950 by the press time, restricts short-term USD/CHF declines.
-
23:23
GBP/JPY Price Analysis: Bears giving ground to the bulls at key support
- GBP/JPY has scope for a move higher so long as the bulls commit at 170.50.
- A break below 170.00 opens risks all the way to 169.00 for the day ahead.
GBP/JPY has been breaking higher this week with eyes on the 174.00s. However, for the near term, the bulls need to hold on as they take on the bears on the backside fo the trendline. The bears are looking to clean up the length that is vulnerable below 170.85 with 168.80 eyed. The following illustrates the market structures and bias on the weekly, daily and hourly charts.
GBP/JPY weekly chart
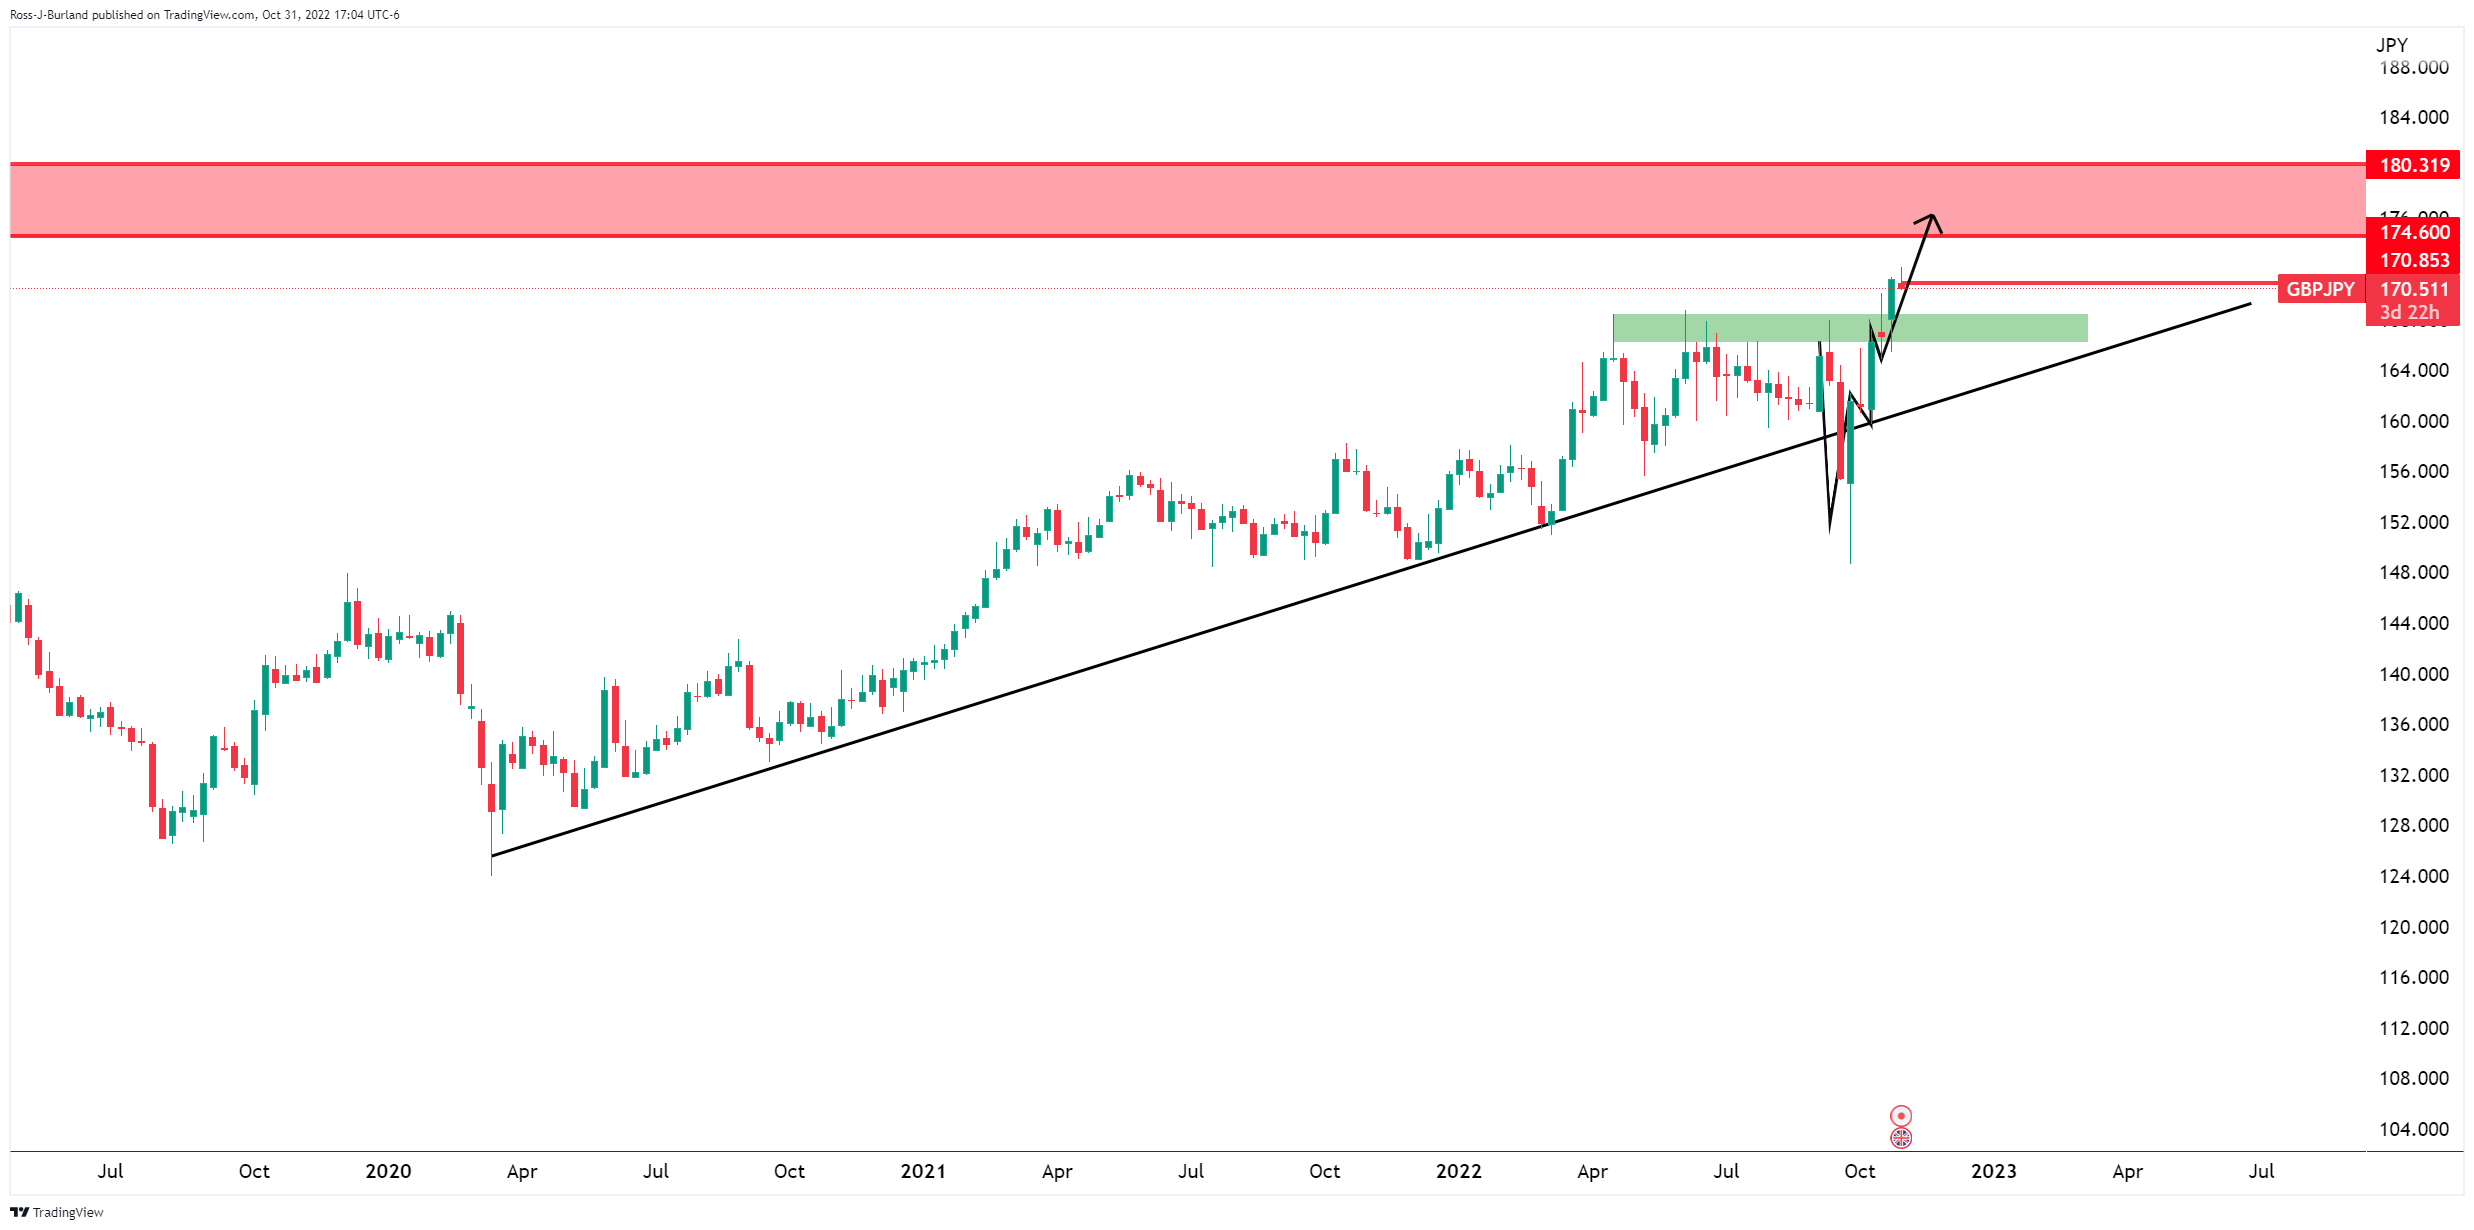
There is room for a move higher into weekly resistance while climbing the supporting trendline while the bullish W-formation and neckline remain intact.
GBP/JPY daily chart
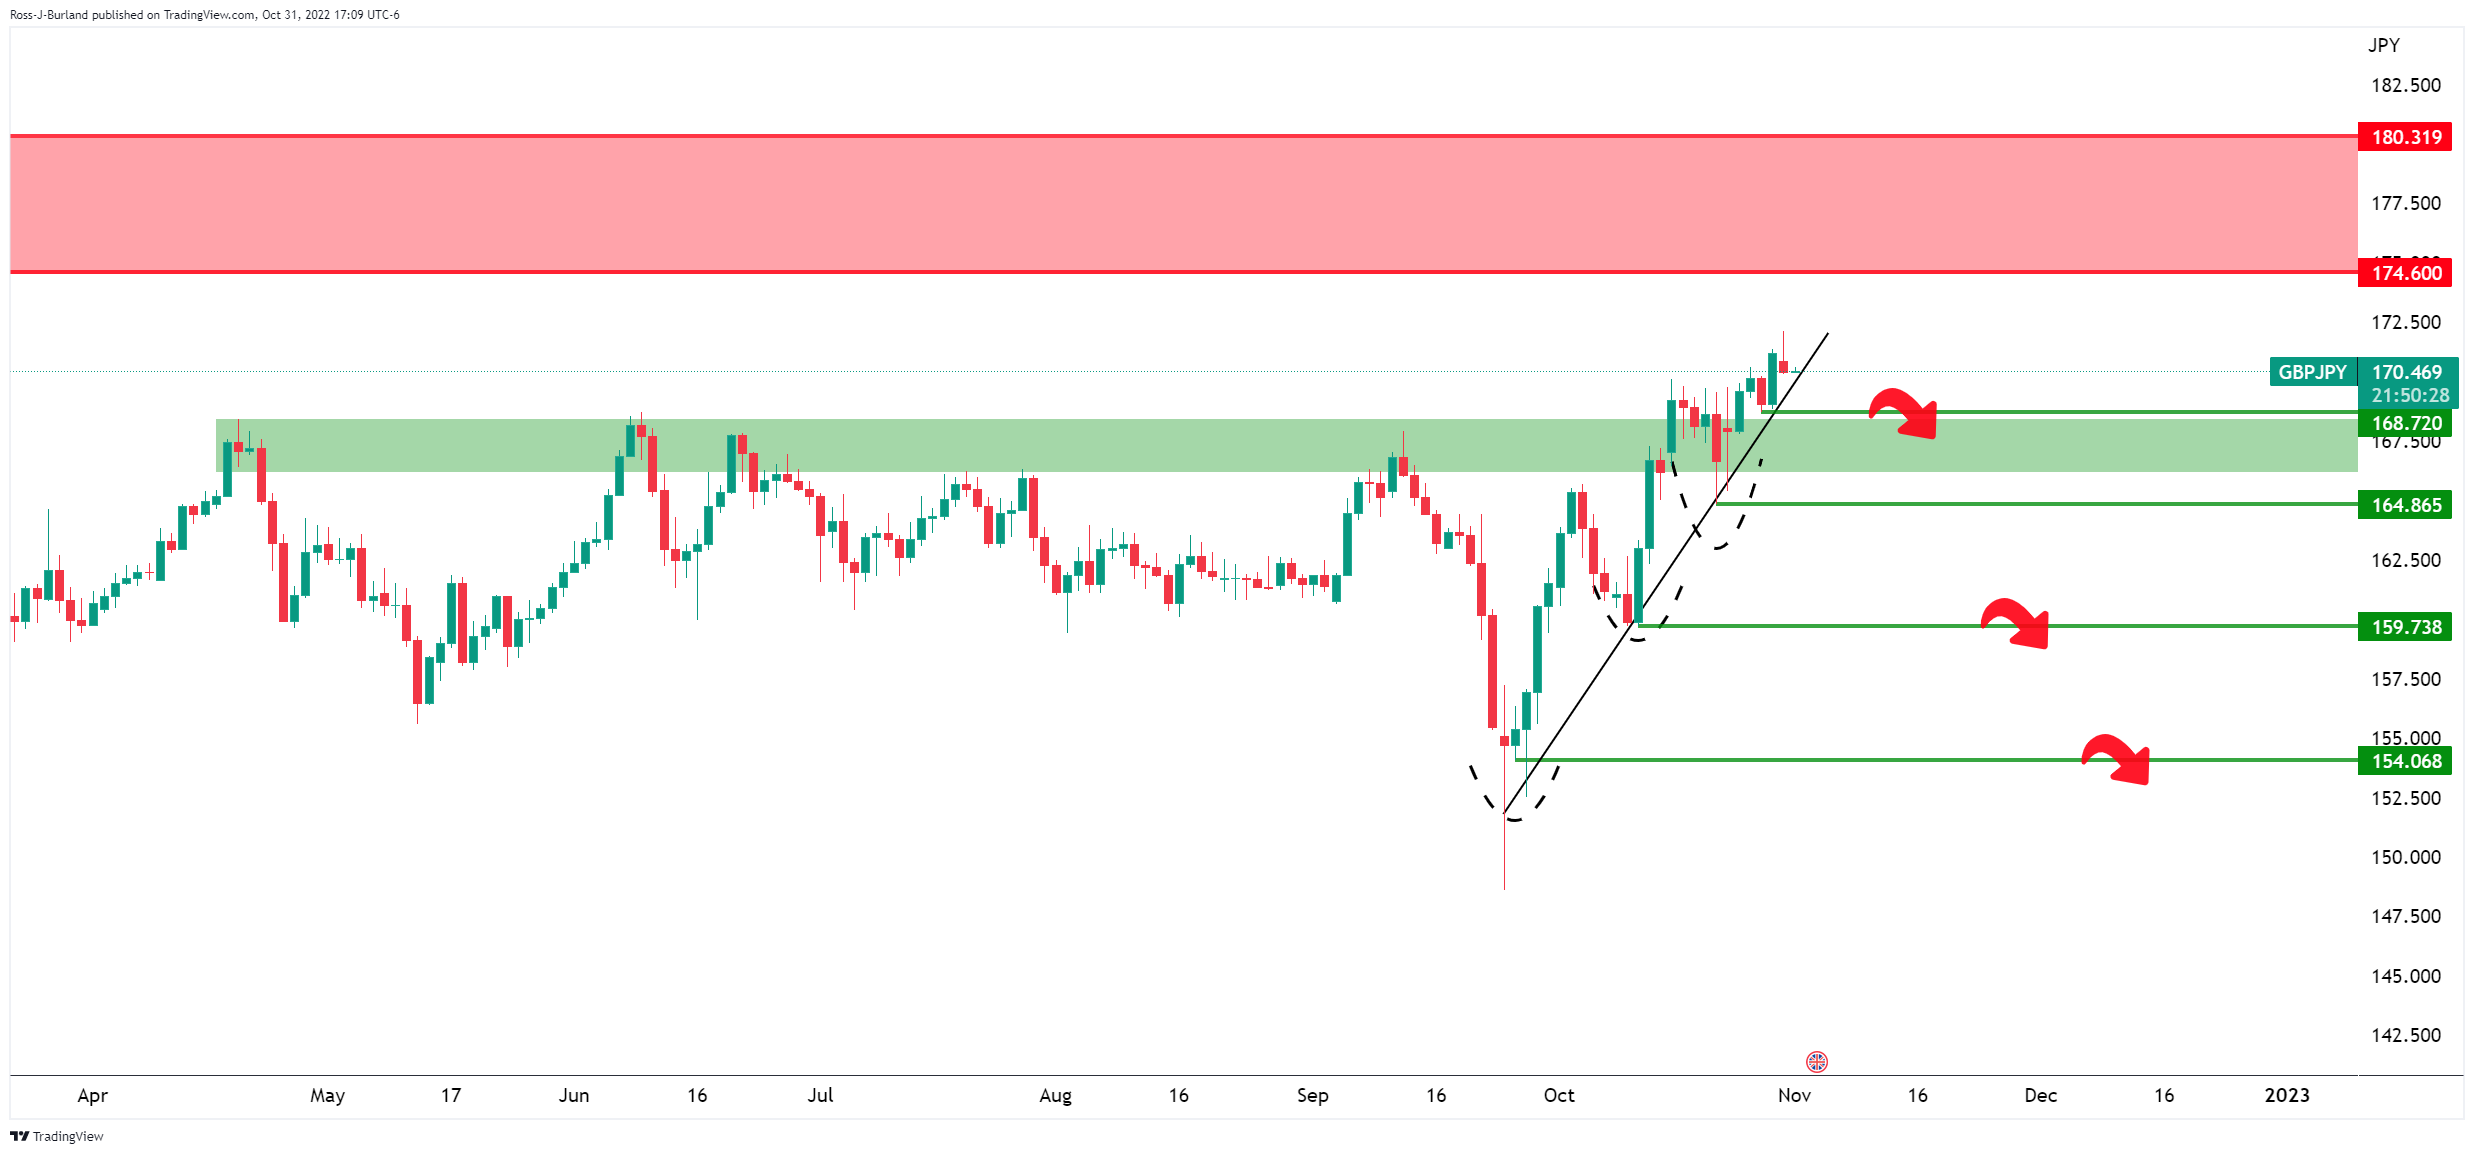
The daily chart shows that the price is hugging the trend but the price is decelerating on the bid which could lead to a cascade of drops at key structure levels.
GBP/JPY hourly chart
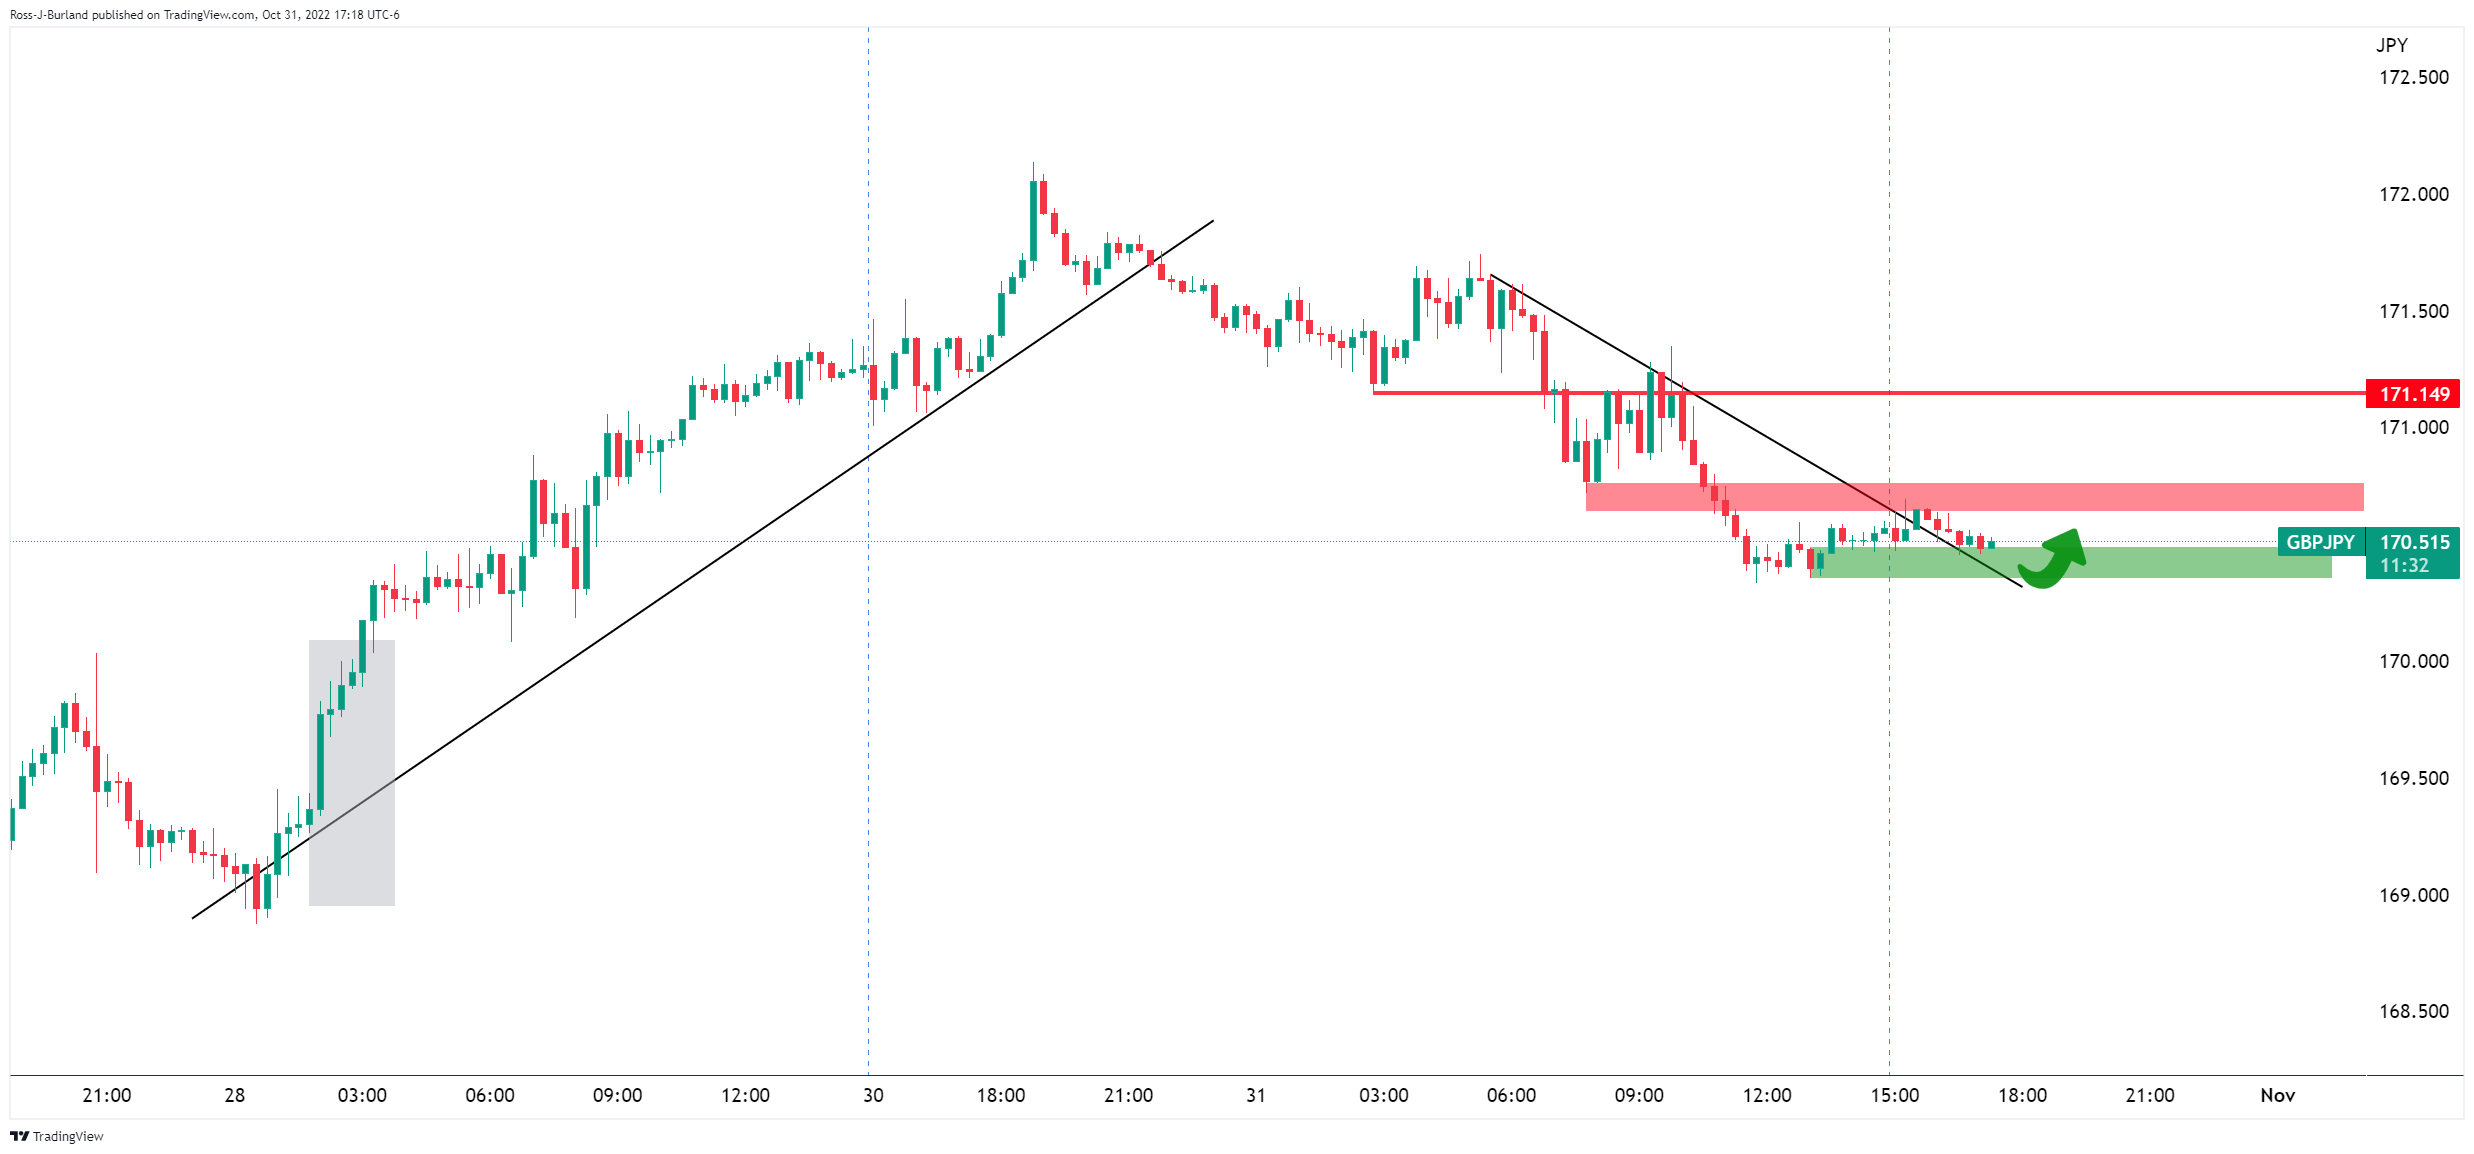
This is where the near-term opportunity might evolve. The price is reaching higher, but should we have seen a break of structure to the downside but the bears have failed to stay on the front side of the trend. There is scope for a move higher so long as the bulls commit at 170.50. A break below 170.00 opens risks all the way to 169.00 for the day ahead.
-
23:03
AUD/JPY extends gains above 95.00 ahead of RBA policy
- AUD/JPY has refreshed its day’s high at 95.24 ahead of RBA’s monetary policy.
- It would be worth watching whether RBA will remain stick to 25 bps or return to a 50 bps structure.
- The Caixin Manufacturing PMI is seen higher despite a sheer drop in official manufacturing PMI.
The AUD/JPY pair has delivered an upside break of the immediate hurdle of 95.16 in the early Asian session. The asset is aiming higher ahead of the interest rate decision by the Reserve Bank of Australia (RBA).
The release of a significantly higher inflation rate for the second quarter in the Australian region has brought ambiguity in minds of investors regarding the extent of the rate hike by the RBA on Tuesday. In October monetary policy meeting, RBA Governor Philip Lowe slowed down the pace of hikes in the Official Cash Rate (OCR), citing that the economic prospects cannot be entirely sacrificed in achieving price stability.
The RBA announced a rate hike by 25 basis points (bps), terminating the 50 bps rate hike spell. Now, the inflation rate has delivered a historic surge after advancing to 7.3% vs. the expectation of 7.0%. This has accelerated chances that the RBA could return to a 50 bps rate hike structure to combat mounting price pressures.
Economists at ANZ Bank cited that “A 50 bps rise in November is possible, but we think the RBA will prefer to hike more frequently than shift back to 50 bps, given the reasoning behind the decision to go 25 bps in October.”
Apart from that, investors will also focus on the Caixin Manufacturing PMI data, being Australia a leading trading partner of China. The economic data is seen higher at 49.0 vs. the prior release of 48.1 despite a sheer drop in official manufacturing PMI data.
On the Tokyo front, investors are awaiting the release of the Bank of Japan (BOJ) monetary policy minutes on Wednesday. BOJ Governor Haruhiko Kuroda kept interest rates unchanged citing external demand shocks and the priority of achieving pre-pandemic growth levels.
-
23:03
WTI Price Analysis: Bears approach monthly support near $84.40
- WTI holds lower ground after breaking 50-DMA support.
- Steady RSI keeps sellers hopeful to visit the short-term key support trend line.
- Buyers need validation from a three-month-old resistance line to retake control.
WTI crude oil prices print a three-day downtrend as it drops to 85.55 during Tuesday’s Asian session. In doing so, the black gold justifies the previous day’s downside break of the 50-DMA.
That said, the steady RSI (14) adds strength to the bearish bias suggesting the quote’s further downside towards an upward-sloping support line from September 26, around $84.40 at the latest.
In a case where the energy benchmark breaks the $84.40 key support, the odds of witnessing its slump towards the lows marked on October 18 and September 08, respectively around $81.30 and $80.95, can’t be ruled out.
However, the commodity’s downside past $80.95 appears difficult as the $79.30 level could challenge the sellers before directing them to September’s bottom around $78.00.
Alternatively, the 50-DMA hurdle surrounding $86.00 restricts the WTI crude oil’s immediate recovery before the previous week’s high of $89.30.
Following that, a downward-sloping resistance line from late July, around $89.90 and the $90.00 threshold could challenge the commodity buyers.
Should the quote manage to remain firmer past $90.00, it could rush toward the previous monthly peak of $92.63.
WTI: Daily chart
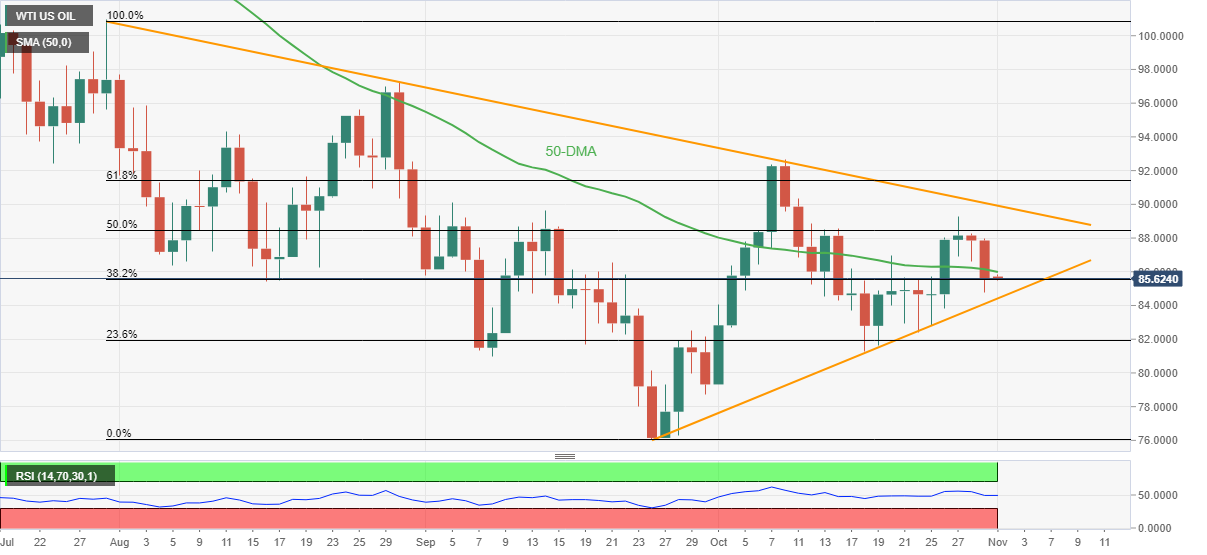
Trend: Further weakness expected
-
23:02
AUDUSD: The Aussie Dollar hovers around 0.6400 ahead of the RBA and the Fed decisions
- The AUD is at the mercy of central bank decisions by the Reserve Bank of Australia (RBA) and the Federal Reserve (Fed).
- The AUDUSD tumbled on Monday as China’s PMI entered the recessionary territory, spurring a risk-off impulse.
- The USD was bolstered by Fed rate hike expectations and high US bond yields.
The AUDUSD is almost flat as the Asian session begins, following Monday’s trading session, with AUD losing ground against the USD due to a risk-off impulse. Hence, the safe-haven status of the US Dollar keeps the greenback underpinned. Factors like weaker-than-expected China data and Hong Kong Iron Ore prices tumbling below $80.00 were headwinds for the Aussie Dollar. At the time of writing, the AUDUSD is trading at 0.6396.
Broad US Dollar strength underpinned by Fed’s rate hike expectations weighed on the Aussie Dollar
Wall Street finished the session with hefty losses. A light US economic calendar keeps investors focused on the Federal Reserve’s November meeting as investors brace for a 75 bps rate hike based on the last week’s US data. Given that the Federal Reserve preferred gauge for inflation’s core Personal Consumption Expenditures (PCE) jumped by 5.1% YoY, below expectations but above August’s 4.9%, while the Employment Cost Index (ECI) for Q3 was 1.2% QoQ, lower than Q2 1.4%, is almost sure that Jerome Powell and Co., will continue to tighten monetary conditions. That said, US Treasury bond yields are higher, with most yields along the curve breaching the 4% threshold. Hence, the AUDUSD is on the brink of extending its losses if not by the Reserve Bank of Australia’s (RBA) monetary policy decision one day before the Fed.
US data wise, PMI figures released by the Regional Federal Reserve banks, like Chicago and Dallas, revealed Manufacturing Indices were ignored by AUDUSD traders. The Chicago Manufacturing Index missed expectations at 45.2, less than the previous reading. Later, the Dallas Manufacturing Index plunged to -19.2, lower than estimates, showing business conditions deteriorating for the sixth consecutive month.
AUDUSD buyers ignored Australia Retail Sales
Aside from the US, Australia revealed its Retail Sales for November, which rose by 0.6% MoM in September, aligned with estimates, and above the previous month’s reading. Even though the data was positive for the AUD, investors focused on the Fed and the RBA. Later, the Reserve Bank of Australia (RBA) is expected to hike a quarter percent (0.25%) of the Cash Rate, aligned with October’s monetary decision. The RBA’s decision to raise rates by 25 bps slowed the rate hikes and triggered a sell-off in the AUDUSD, which dived from around 0.6550, toward the YTD low at 0.6169, in just five days.
Factory activity in China weakens, weighing on the AUD
Elsewhere, China’s October official PMIs, stood at 48.7 from 50.6 reported in September, falling to contractionary territory, and weighing in commodity prices, particularly Iron Ore, which tumbled below $80 for the first time since 2019. Given the backdrop, investors’ moods shifted as they sold risk-perceived assets. In the Foreign Exchange (FX) market means selling the Aussie Dollar and buying US Dollars.
Ahead in the calendar, the Australian economic docket will feature the Reserve Bank of Australia (RBA) monetary policy decision at 02:30 GMT. Most commercial banks estimate a 25 bps rate increase, leaving the Cash Rate at 2.85%. If the RBA goes above estimates, it would be positive for the AUD; which could rally towards the 0.6500 figure; otherwise, it could be a less meaningful event, with the Federal Reserve decision looming.
On the US front, the US economic calendar will feature the S&P Global Manufacturing PMI for October, alongside the awaited ISM Manufacturing PMI and the JOLTs Job Openings.
AUD/USD Price Analysis: Technical outlook
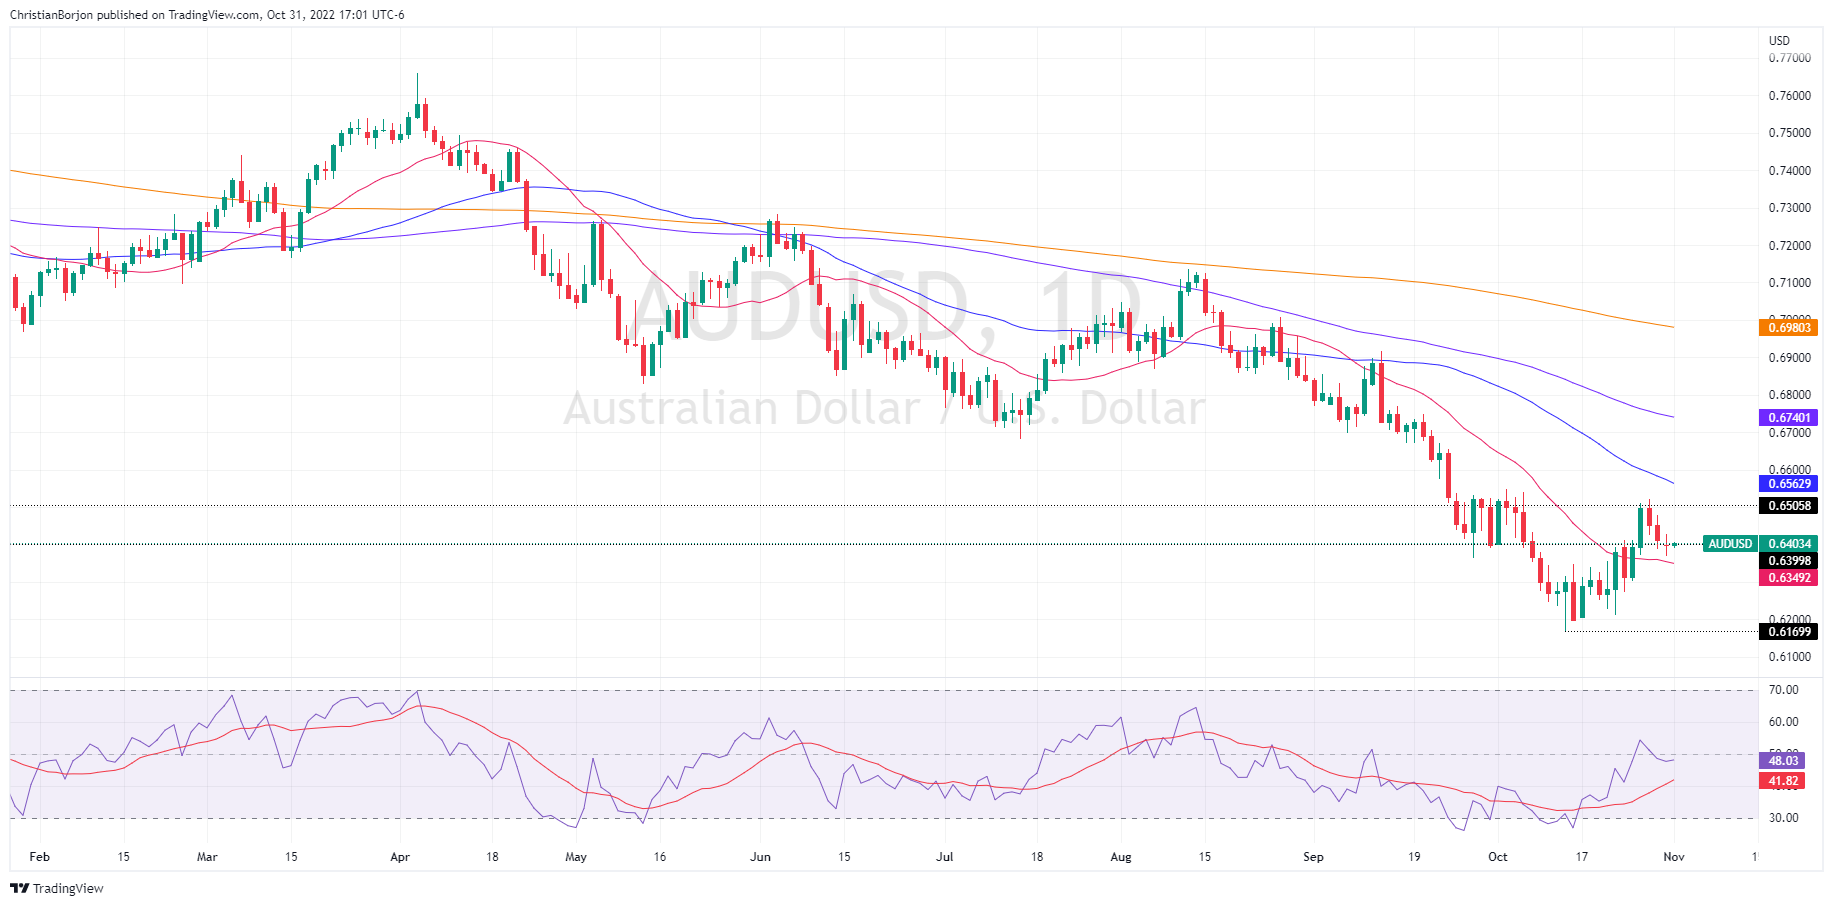
The AUDUSD downward biased is intact, with most daily Exponential Moving Averages (EMAs) remaining above the exchange rate, except for the 20-day EMA at 0.6349. The Relative Strength Index is at 48.31, at bearish territory, though almost flat, meaning that choppy trading conditions remain. If the RBA surprises the market, the Aussie Dollar, could rally towards the October 31 daily high at 0.6428, followed by the October 28 high at 0.6479. On the flip side, a fall towards the 20-day EMA at 0.6349, followed by the 0.6300 figure.
-
22:44
USD/CAD retreats towards 1.3600 despite downbeat oil prices, US/Canada PMIs eyed
- USD/CAD snaps three-day uptrend, steps back from one-week high.
- Risk-aversion, softer oil prices helped buyers to keep the reins before the latest consolidation move.
- October’s PMIs for Canada, US will offer immediate directions ahead of Wednesday’s FOMC, Friday’s job numbers.
USD/CAD begins Tuesday’s trading on the negative side as it drops to 1.3610 following an upbeat start to the key week. The Loonie pair’s latest pullback fail to take clues from the downbeat prices of Canada’s key export item WTI crude oil, as well as the market’s rush towards the US dollar in search of risk safety. The reason could be linked to the anxiety ahead of important central bank announcements and the monthly employment data.
WTI crude oil remains pressured for the third consecutive day, down 0.22% intraday around $86.10 at the latest. The black gold’s recent weakness could be linked to the downbeat activity data from China, as well as the fresh covid-led lockdown and the fears emanating from it. Also, exerting downside pressure on the black gold prices could be US President Joe Biden’s push for lower energy prices. “US President Joe Biden on Monday called on oil and gas companies to use their record profits to lower costs for Americans and increase production, or pay a higher tax rate, as he battles high pump prices with elections coming in a week,” said Reuters.
Elsewhere, downbeat prints of the US activity data might have favored the USD/CAD sellers to take the risk. That said, the US Chicago Purchasing Managers’ Index and Dallas Fed Manufacturing Business Index for October came in at 45.2 and -19.4 versus 47.0 and -15.0 expected respectively.
Even so, the market’s fears of hawkish Fed and cautious mood ahead of the key central bank announcements, as well as the employment data, underpinned the US dollar’s demand. Also portraying the sour sentiment were firmer US Treasury yields and equities.
Looking forward, Canada’s S&P Global Manufacturing PMI for October, expected 49.2 versus 49.8 prior, will join the US ISM Manufacturing PMI, likely to ease to 50.0 versus 50.9 prior, will direct immediate USD/CAD moves. Additionally, The US S&P Global Manufacturing PMI for the stated month, expected to confirm the initial forecast of 49.9 figure, will join the JOLTS Jobs Openings for September, forecast 10M versus 10.053M prior, to also entertain the pair traders.
It should, however, be noted that Wednesday’s all-important Federal Open Market Committee (FOMC) meeting and Friday’s jobs report from the US and Canada are crucial catalysts for the Loonie pair traders to watch for clear directions.
Technical analysis
A pullback from the 21-DMA hurdle, around 1.3695 by the press time, directs the USD/CAD bears towards a four-day-old support line near 1.3590.
-
22:33
NZD/USD attempts a break of oscillation above 0.5800 ahead of Caixin PMI
- NZD/USD is aiming to deliver an upside break of the 17-pips consolidation ahead of Caixin PMI data.
- Chinese official manufacturing PMI remained downbeat amid zero Covid-19 policy.
- The antipodean is outperforming other risk-perceived currencies despite a pessimism in the market mood.
The NZD/USD pair has attempted a breakout after displaying back-and-forth moves in a 0.5803-0.5820 range in the early Tokyo session. The asset remained sideways from the late New York session as investors were awaiting the release of the Caixin Manufacturing PMI data for making an informed decision.
The commodity-linked currency refused to sustain below the critical support of 0.5800 on Monday and rebounded firmly unlike the other risk-sensitive currencies, which remained crippled against the greenback. Meanwhile, risk sentiment remained dampened as Federal Reserve (Fed)’s pre-anxiety period is compelling investors to hide behind safe-haven assets.
The US dollar index (DXY) advanced sharply on Monday after a breakout above the round-level hurdle of 110.00. Also, the 10-year US Treasury yields jumped to 4.05%.
As per the consensus, the Caixin Manufacturing PMI is seen higher at 49.0 vs. the prior release of 48.1. Official Manufacturing PMI which releases before the Caixin Manufacturing PMI remained downbeat on Monday. It is worth noting that New Zealand is a leading trading partner of China.
China’s official Manufacturing PMI landed lower at 49.2 vs. the projections of 50.0 and the prior release of 50.1, reported by the National Bureau of Statistics (NBS). Also, the Non-Manufacturing PMI had been recorded significantly lower at 48.7 against the expectations of 51.9 and the former release of 50.6. It seems that the continuation of the no-tolerance Covid-19 policy has weighed pressure on China’s economic activities.
Apart from that, kiwi’s labor market data will remain in focus. The Employment Change for the third quarter is seen at 0.5% against the former print of 0%. While the Unemployment Rate could trim to 3.2% vs. 3.3% released earlier. In addition to that, the labor cost index is also seen lower at 1% against the prior release of 1.3%.
-
22:23
EUR/USD bears take a breather below 0.9900 with eyes on US ISM PMI, Fed
- EUR/USD began the week on the negative side, holding lower ground near one-week bottom of late.
- Fears of Eurozone recession intensified after record high inflation data, unimpressive GDP figures.
- Hawkish hopes from ECB fail to defend pair buyers as USD benefits from rush to risk safety.
- US ISM PMI, JOLTS Job Openings will decorate calendar ahead of Wednesday’s FOMC.
EUR/USD steadies inside a 20-pip trading range below 0.9900 following a downbeat start to the central bank’s week. In doing so, the major currency pair seesaws around a one-week low.
Monday’s risk-aversion joined fears of more economic hardships for the old continent to exert downside pressure on the EUR/USD prices. The same stopped the quote to cheer hawkish expectations from the European Central Bank (ECB) and the multi-year high inflation data.
On Monday, the preliminary readings of the Eurozone’s third quarter (Q3) Gross Domestic Product (GDP) matched 0.2% QoQ forecasts versus 0.8% prior. Further, the bloc’s first readings of inflation data for October, per the HICP measure, jumped to 1.5% MoM versus 0.6% expected and 1.2% previous readings. On a yearly basis, the Eurozone HICP rallied to 10.7% compared to 9.8% prior and 10.2% market consensus.
Elsewhere, the US Chicago Purchasing Managers’ Index and Dallas Fed Manufacturing Business Index for October came in at 45.2 and -19.4 versus 47.0 and -15.0 expected respectively.
It should be noted that Russia’s retreat from the grain deal with the United Nations, Turkey and Ukraine joined the fresh wave of covid lockdowns in China to weigh on the market’s sentiment. Also, fears of higher rates and strong inflation were persistent and helped the US dollar to remain firmer.
With this, the US equities began the week on the negative side while yields recovered, which in turn underpinned the US Dollar Index (DXY) to print a three-day uptrend.
That said, traders await the US activity data for October before Wednesday’s all-important Federal Open Market Committee (FOMC) meeting. Among them, the US ISM Manufacturing PMI, expected to ease to 50.0 versus 50.9 prior, will be more important to watch. Additionally, The US S&P Global Manufacturing PMI for the stated month, expected to confirm the initial forecast of 49.9 figure, will join the JOLTS Jobs Openings for September, forecast 10M versus 10.053M prior, to also entertain the pair traders.
Given the hawkish hopes from the Fed, as well as the economic and geopolitical fears surrounding Eurozone, the EUR/USD pair is likely to remain weak.
Technical analysis
EUR/USD seesaws around the previous resistance line from March 31 and the 50-DMA while taking rounds to 0.9880-90. Given the downbeat RSI and the pair’s pullback from the 100-DMA hurdle, around 1.0075 at the latest, the quote is likely to remain weak, which in turn highlights the 0.9830 support confluence, including the 21-DMA and monthly ascending trend line to watch as the next rest-point.
-
22:07
Australia S&P Global Manufacturing PMI below expectations (52.8) in October: Actual (52.7)
-
22:01
Gold Price Forecast: XAU/USD aims to test a two-week low below $1,620 amid anxiety ahead of Fed policy
- Gold price is declining towards a two-week low at $1,617.28 amid rising hawkish Fed bets.
- The DXY continued its upside journey as the risk profile sours amid Fed’s pre-anxiety.
- The Fed will hike interest rates by 75 bps in November and by 50bps in December.
Gold price (XAU/USD) has witnessed a pullback move after dropping to near $1,632 in the early Tokyo session. The confidence seems to be lacking in the pullback move as the overall structure has become weak after the gold price surrendered the critical support of $1,638.00. The precious metal is declining toward a two-week low at $1,617.28 as the Federal Reserve (Fed) is set to tighten its policy further to combat rigid inflation.
Meanwhile, the US dollar index (DXY) extended its two-day winning streak on Monday after overstepping the critical hurdle of 111.00. Investors shifted to the risk aversion theme amid uncertainty ahead of the interest rate decision by the Fed. This also resulted in a sell-off in S&P500 and 10-year US Treasury yields flew higher to 4.05%.
As per the CME FedWatch tool, the chances of fourth consecutive 75 basis points (bps) rate hike stand at 86.5%. Analysts at Rabobank point out that with a Fed that is clearly prioritizing price stability over full employment, rates will go higher than currently anticipated. They expect a 75 bps rate hike in November and a 50 bps rate hike in December. And, the terminal rate would top around 5%.
Gold technical analysis
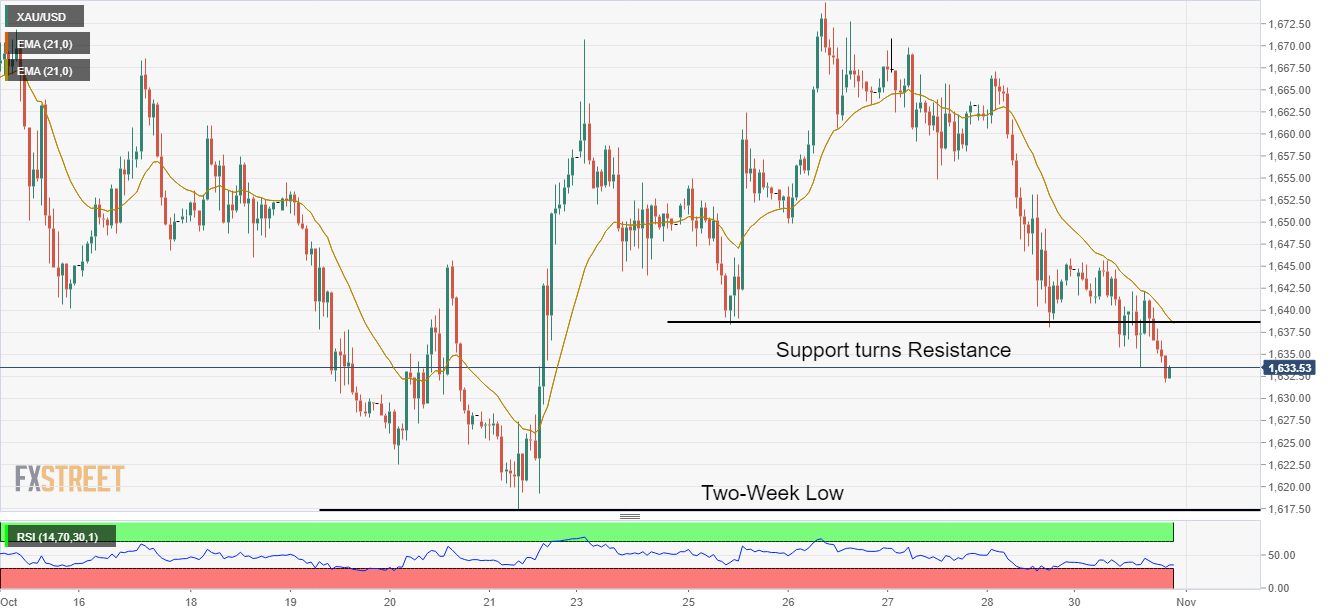
On an hourly scale, gold price has shifted into the bearish trajectory after surrendering the critical support of $1,638.00. The precious metal will test a two-week high at $1,617.28, recorded on October 21.
The 20-period Exponential Moving Average (EMA) at $1,638.00 is acting as major resistance for the counter. Meanwhile, the Relative Strength Index (RSI) (14) has shifted into the bearish range of 20.00-40.00, which indicates more weakness ahead.
Gold hourly chart
 .
. -
21:45
New Zealand Building Permits s.a. (MoM) registered at 3.8% above expectations (-1.2%) in September
-
21:12
GBP/USD Price Analysis: Bulls hold the fort at key support, but bears are lurking
- GBP/USD bears are in town but the bulls have not thrown in the towel.
- The key support structure remains intact so far.
GBP/USD is threatening a move to the downside and into longs that were built up over the past week. The pair has been pressured over the course of the start of the week and made a low of 1.1459. The following charts show the bias on the hourly time frame while respecting the key structures:
GBP/USD H1 charts
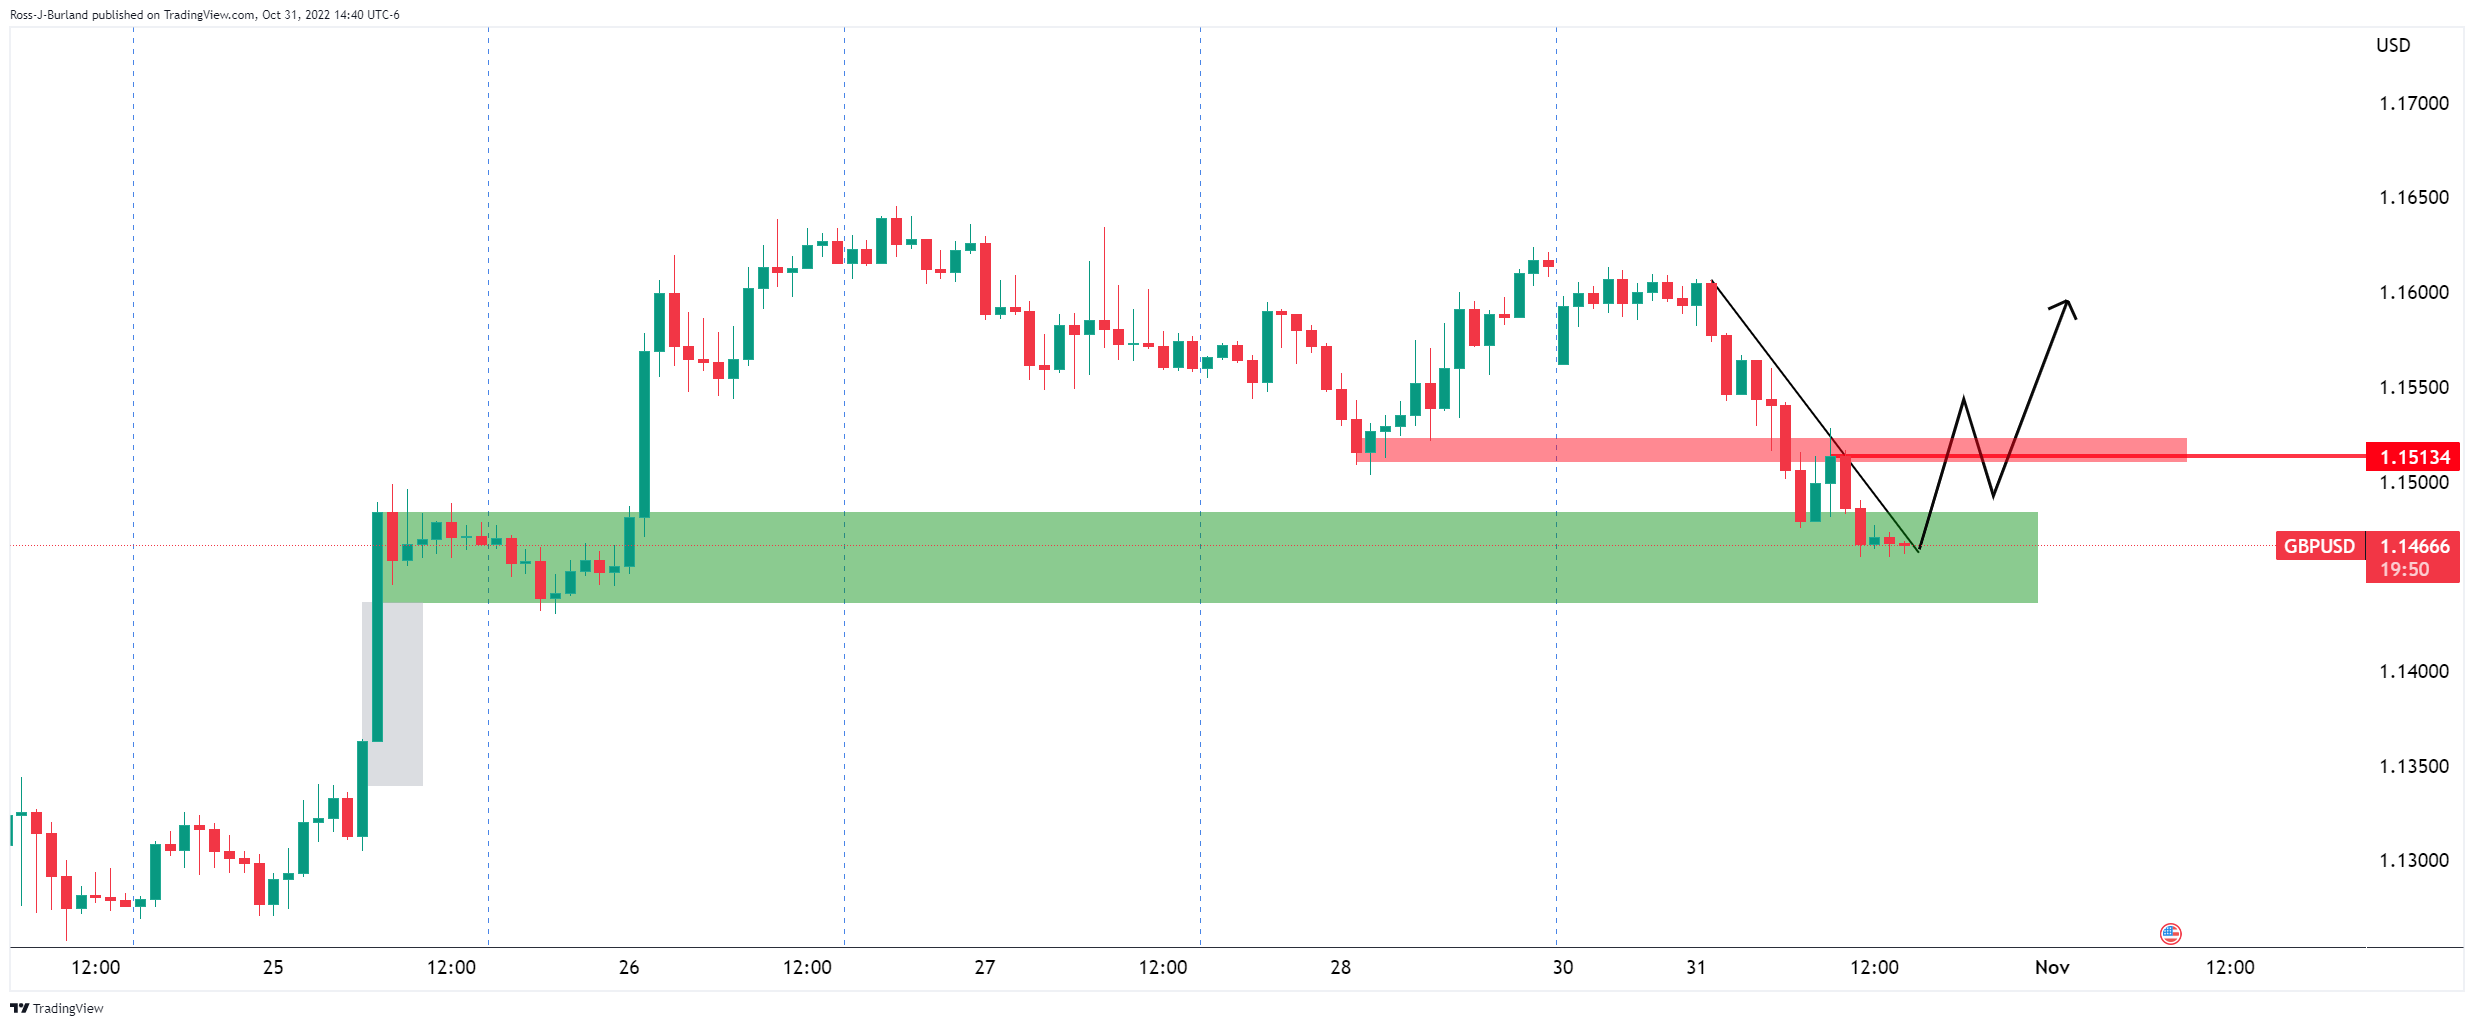
the price is supported in a demand area and there are prospects of a move-in to test the resistance. However, failures there could result in a downside continuation for the days ahead. If the price breaks the 1.1430 mark, this would be a significant development:
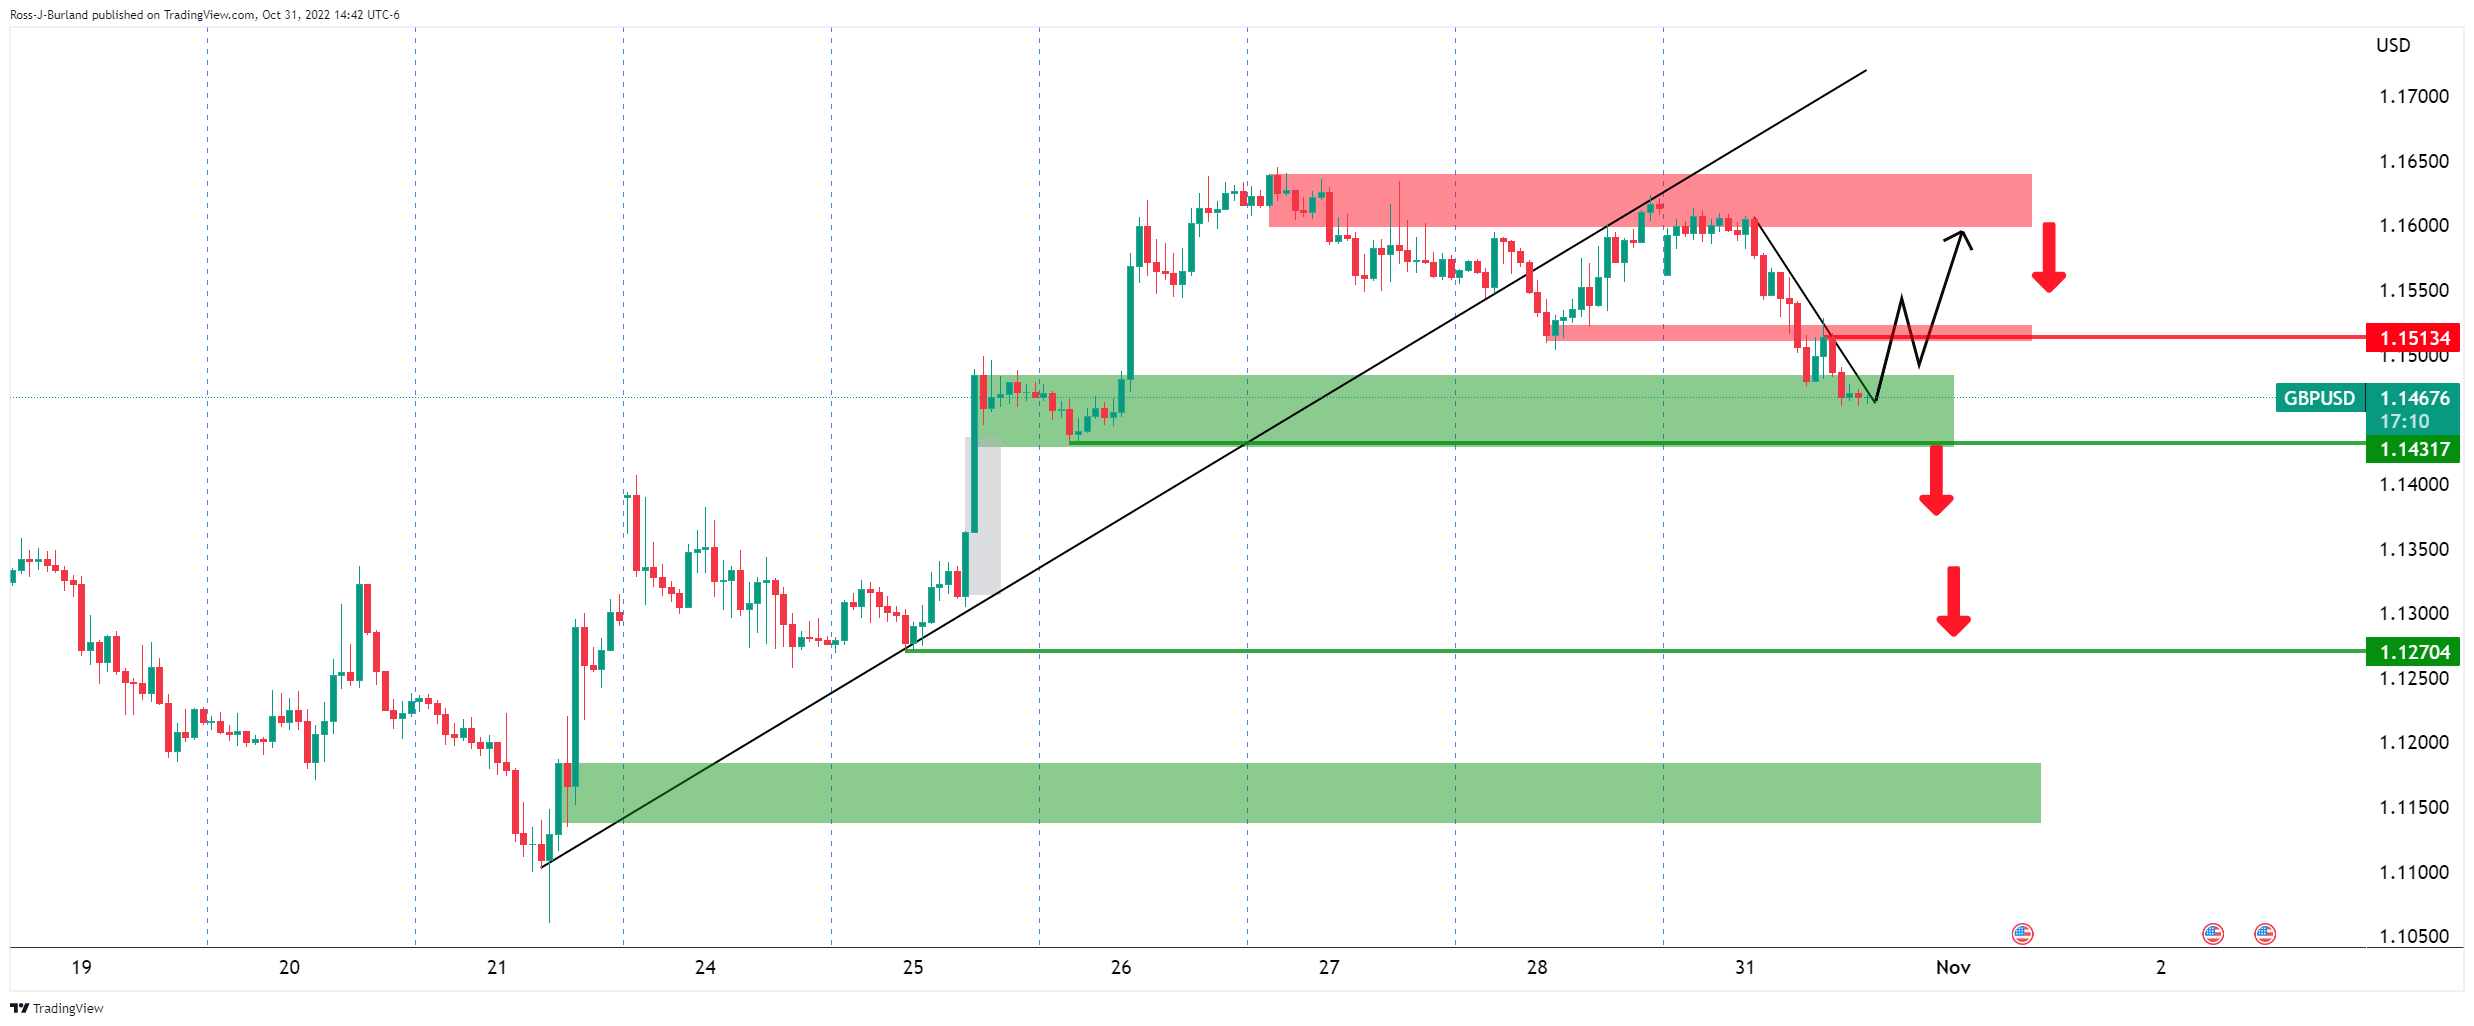
In doing so, 1.1270 will be vulnerable which guards the start of the move from the October 21 lows near 1.1100/1.1050.
-
20:22
EUR/JPY turns lower and returns below 147.00
- The euro fails at 147.80 and retreats below 147.00.
- A sourer market mood underpins a mild JPY recovery.
- EUR/JPY is trapped on a bullish triangle pattern.
The euro was capped at 147.80 and pulled down against the Japanese yen on Monday, retracing Friday’s gains to hit session lows at 146.70. The sourer market mood at the start of the week has underpinned the safe-haven Japanese yen, weighing on the common currency.
The yen appreciates on risk aversion
Earlier on the day, the downbeat Chinese manufacturing and services activity figures reactivated investors’ concerns that the impact of the country’s strict COVID-19 restrictions, over the world's second-largest economy might dampen global growth, which has hammered risk appetite.
Beyond that, the market remains cautious ahead of the US Federal Reserve’s monetary policy meeting, due on Wednesday, which has weighed the euro against a stronger US dollar.
On the macroeconomic front, preliminary data showed that the eurozone inflation accelerated beyond expectations in October, showing a 10.7% annual rise against the 1.2% market consensus and following a 9.9% increase in the previous month.
These figures combined with the deceleration of the Gross Domestic Product; 0.2% in the Q3 against 0.8% in the previous quarter are posing a problem to the ECB and have increased bearish pressure on the euro.
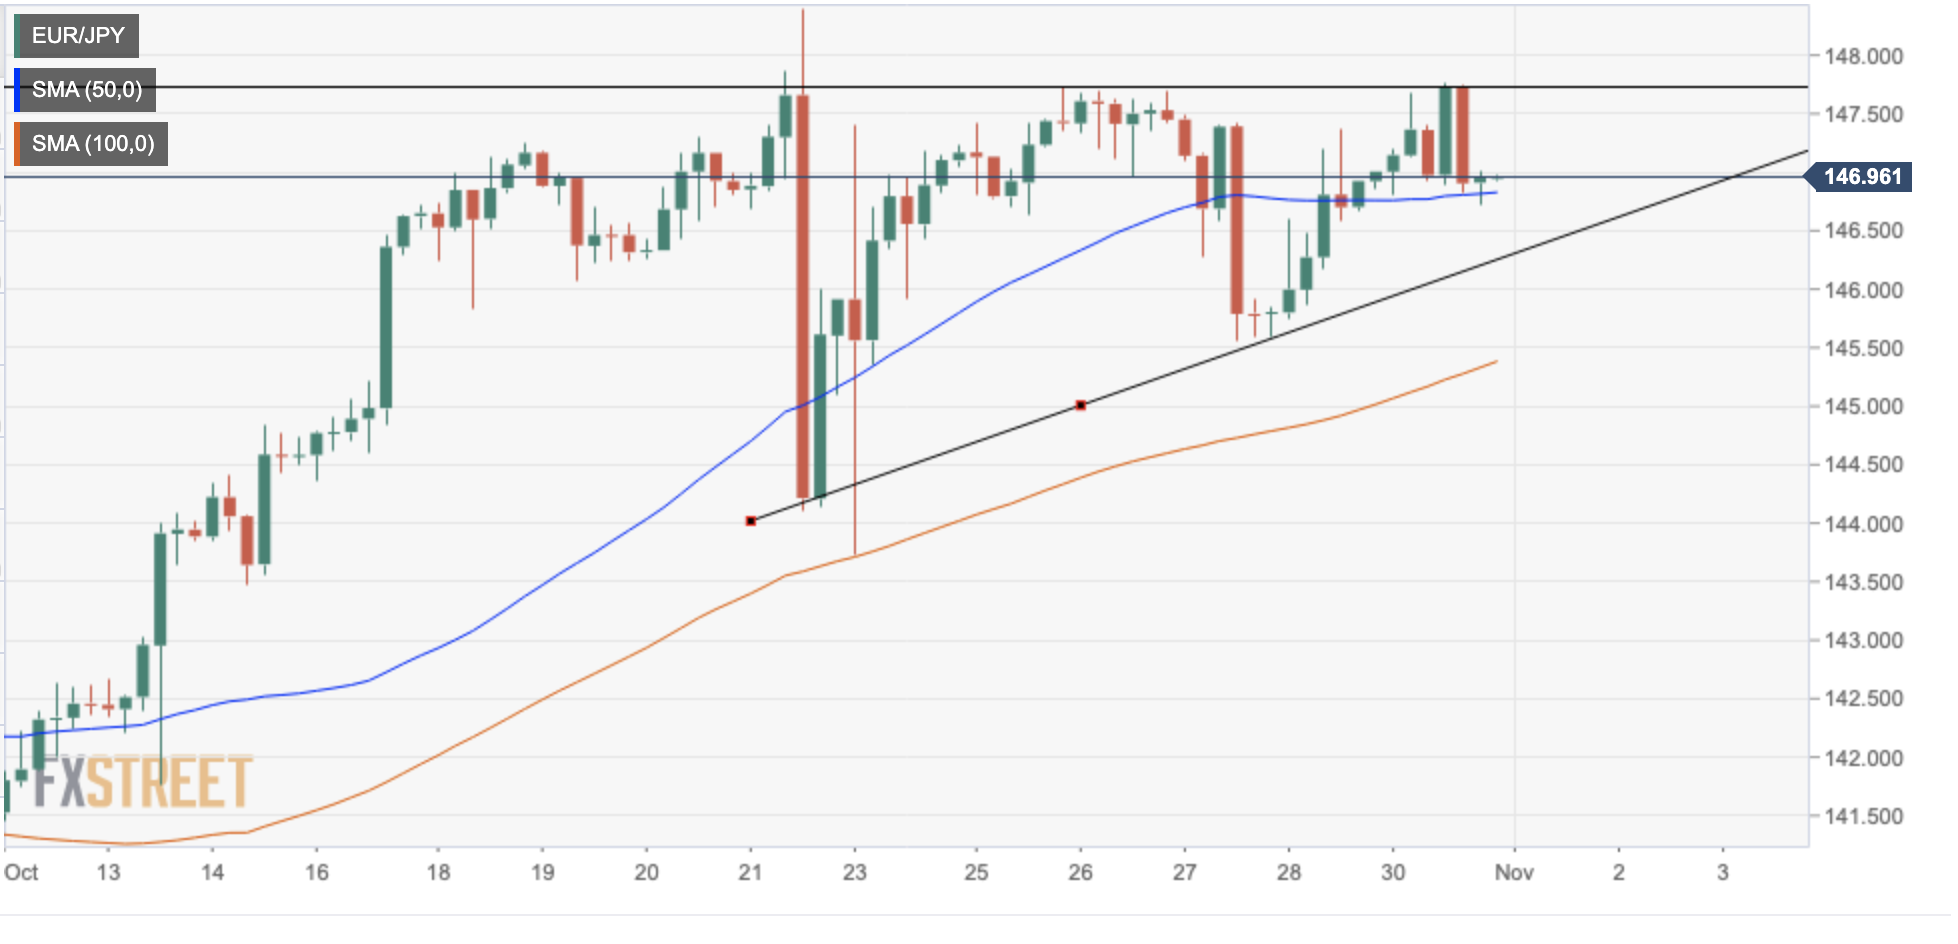
EUR/JPY trapped within a bullish triangle pattern
From a technical perspective, the 4-hour chart shows the pair pulling back from the upper limit of a bullish triangle pattern (in the image below).
The pair’s reversal from the mentioned 147.80 area seems to have found buyers at the 50-period SMA, now around 146.80, which closes the path toward the lower limit of the triangle, at 146.20
On the upside, a successful move above 147.80 would increase bullish traction, which could push the pair towards the October 17 high at 148.40 ahead of the 150.00 psychological level.EUR/JPY 4-hour chart
Technical levels to watch
-
20:18
Silver Price Analysis: XAG/USD falls but is subdued around $19.10, ahead of FOMC’s decision
- Silver price tumbles ahead of the Fed November meeting on a buoyant US Dollar.
- From a daily chart perspective, XAG/USD remains neutral-to-downward biased.
- Short term, the XAG/USD is subdued around $19.10s.
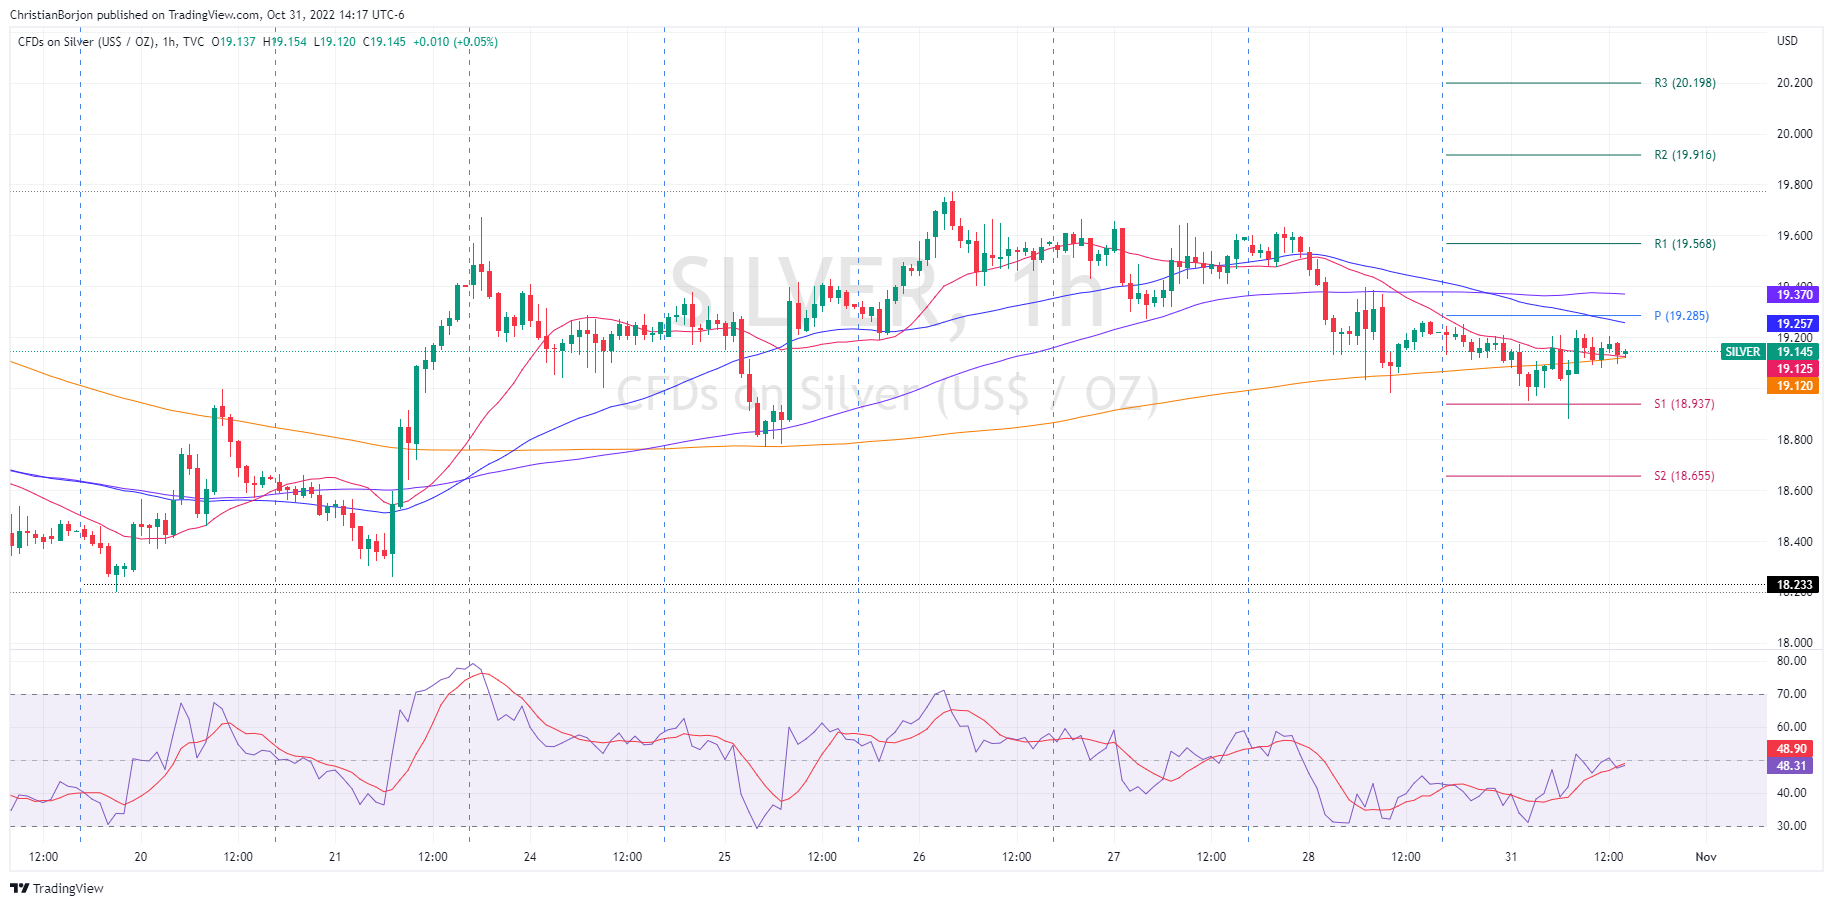
XAG/USD slides from around the daily high at $19.25 towards the 50-day Exponential Moving Average (EMA) at $19.09 amidst broad US Dollar strength, exacerbated by US Treasury yields rising on an almost certain 75 bps Federal Reserve hike at November’s meeting. At the time of writing, XAG/USD is trading at $19.13, below its opening price by 0.40%.
XAG/USD Price Forecast: Technical outlook
From a daily chart perspective, XAG/USD remains neutral-to-downward biased, though it was neutral when the white metal reached a monthly high at $21.23. However, erased its gains, and at the time of typing, it meanders around $19.10s. Worth noting that on its way south, the white metal tumbled below the 100 and the 20-day EMAs, so as mentioned above, the bias remains unchanged.
The Relative Strength Index (RSI) crossed below the 50-midline, meaning sellers are gathering momentum. Nevertheless, XAG/USD needs to achieve a daily close below $19.00, to open the door for further losses.
Short term, the XAG/USD is range-bound. However, traders should be aware that the Exponential Moving Averages (EMAs) remain below the spot price except for the 50 and 100-EMA, hovering around the daily pivot point at $19.25 and $19.37, respectively. Also, the Relative Strength Index (RSI) below the 50-midline is trendless, meaning that silver is consolidated.
Key resistance levels lie at the 50-EMA at $19.25, followed by the daily pivot level at $19.28, ahead of the 100-EMA at $19.37. On the flip side, the XAG/USD first support would be the confluence of the 20 and 200-EMA at $19.12, followed by the S1 daily pivot at $18.93, followed by the S2 pivot level at $18.65.
Key Technical Levels
-
20:04
UK PM Sunak signs off on tax rises, GBP remains under pressure
The new Prime Minister for the UK, Rishi Sunak, is reported to be set to sign off on raising taxes across the board as the new British prime minister looks to plug a £50bn hole in public finances.
The Financial Times wrote in an article on Monday that Treasury insiders said that Sunak and chancellor Jeremy Hunt had agreed on Monday that while “those with the broadest shoulders should be asked to bear the greatest burden”, everybody’s taxes would go up.
the article reports that a Treasury official said after the bilateral meeting: “It is going to be rough. The truth is that everybody will need to contribute more in tax if we are to maintain public services.
“After borrowing hundreds of billions of pounds through Covid-19 and implementing massive energy bills support, we won’t be able to fill the fiscal black hole through spending cuts alone.”
The article states that the Treasury officials said there was an “eye-watering fiscal black hole”, as they attempted to prepare the public for tough economic news when Hunt delivers the Autumn Statement on November 17.
The UK political scene has been a major driver in financial markets of late. However, a new UK administration has brought more stability to the local bond and currency market.
With that being said, the economic slowdown and rising inflation pose ongoing risks to the pound which is down to the greenback by some 1.25% on the day so far. GBP/USD fell from a high of 1.1613 to a low of 1.1459.
-
19:46
USD/CAD Price Analysis: Bears losing their grip as price attempts to break channel resistance
- USD/CAD bulls seek a break of the hourly resistance structure.,
- Bears will remain favoured so long as the channel is respected.
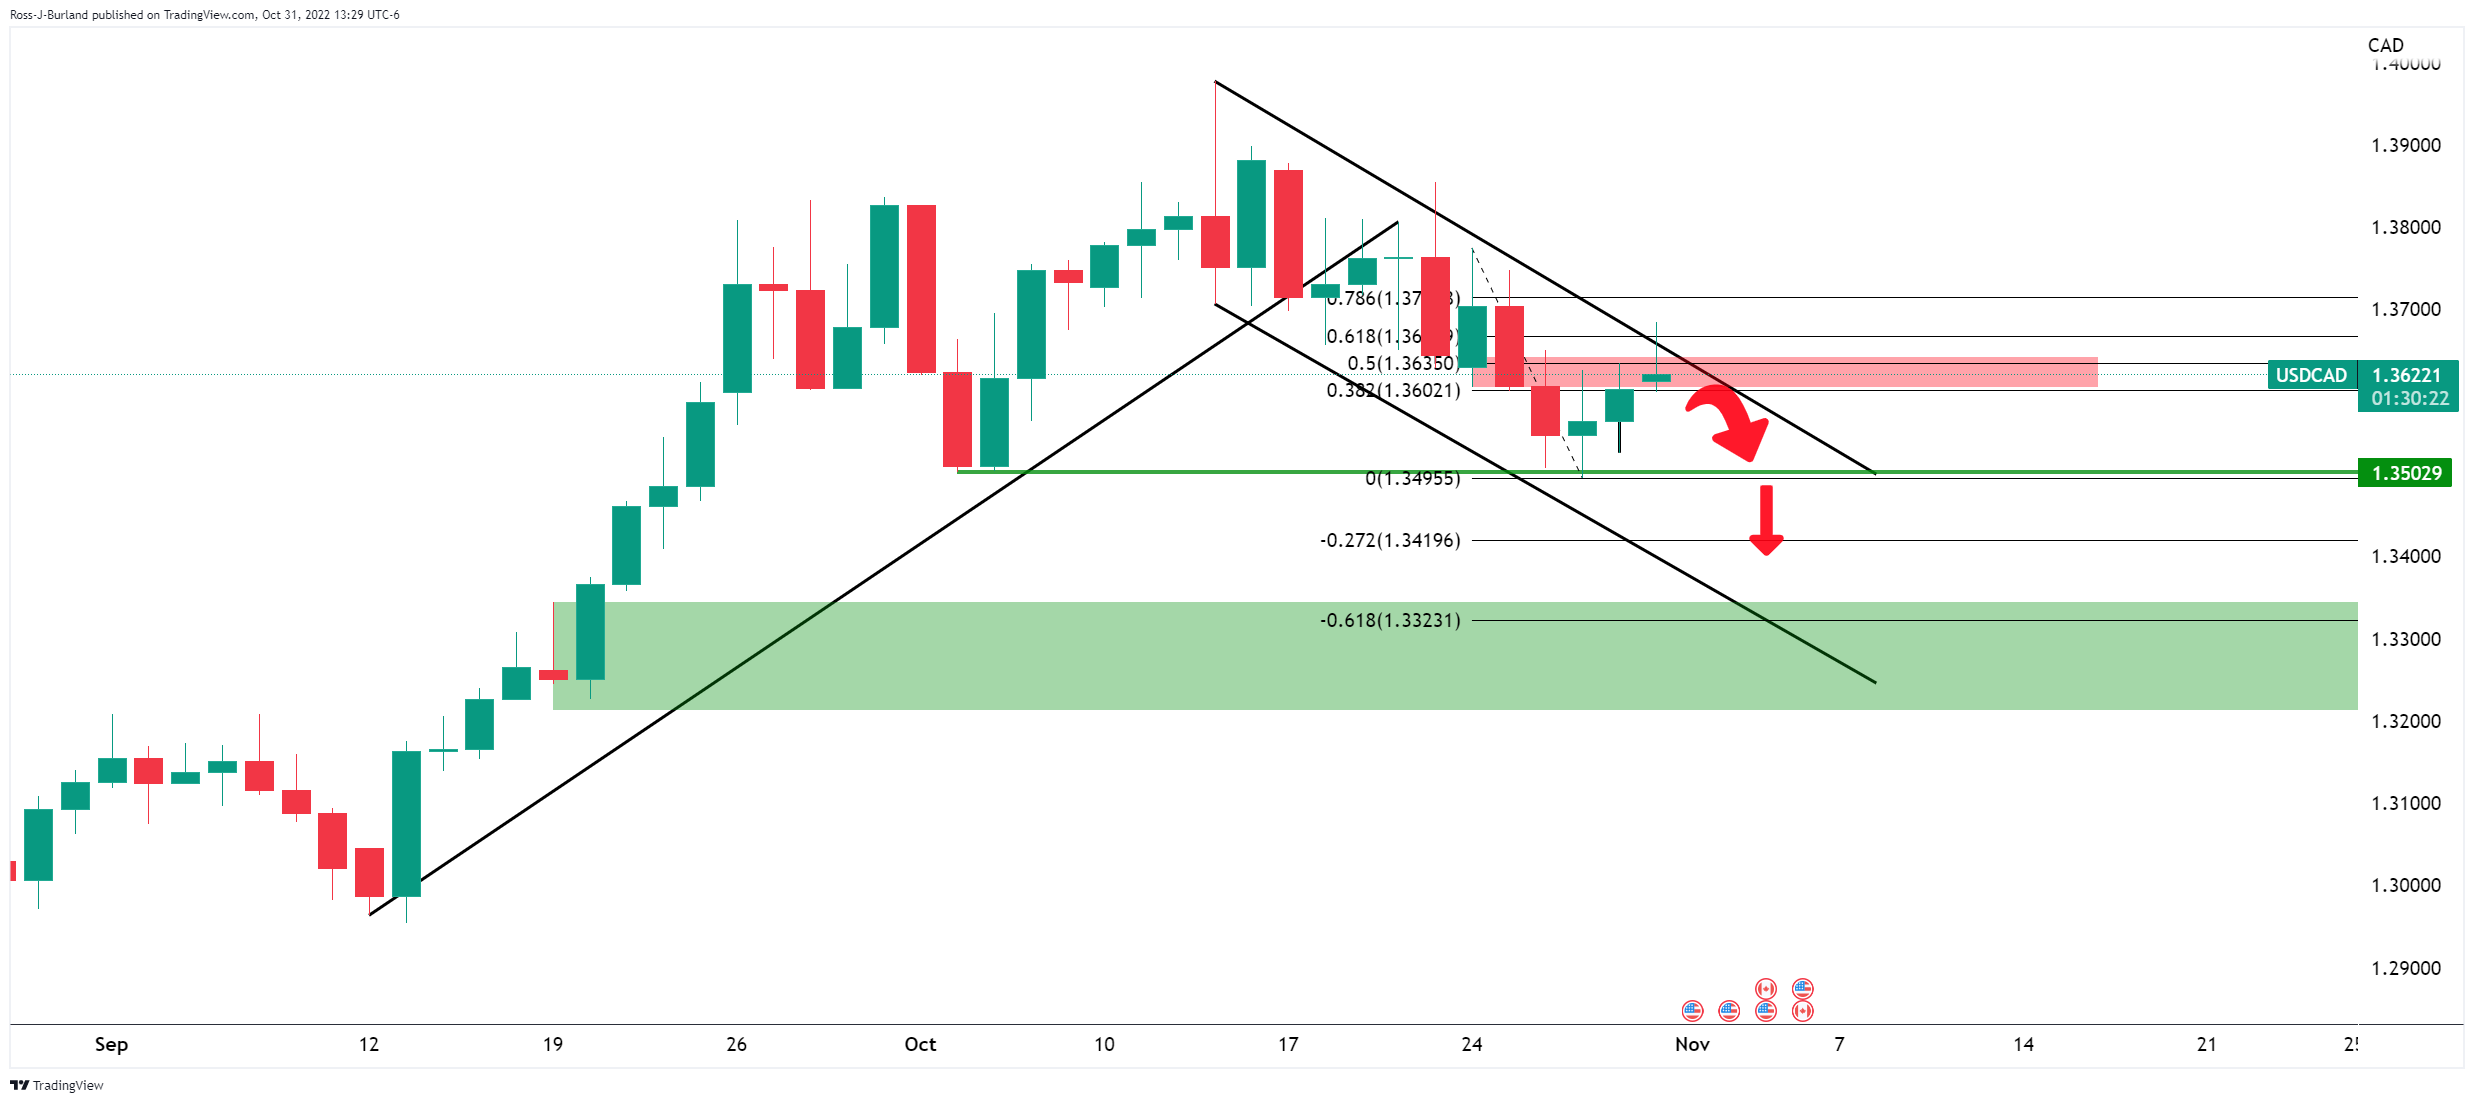
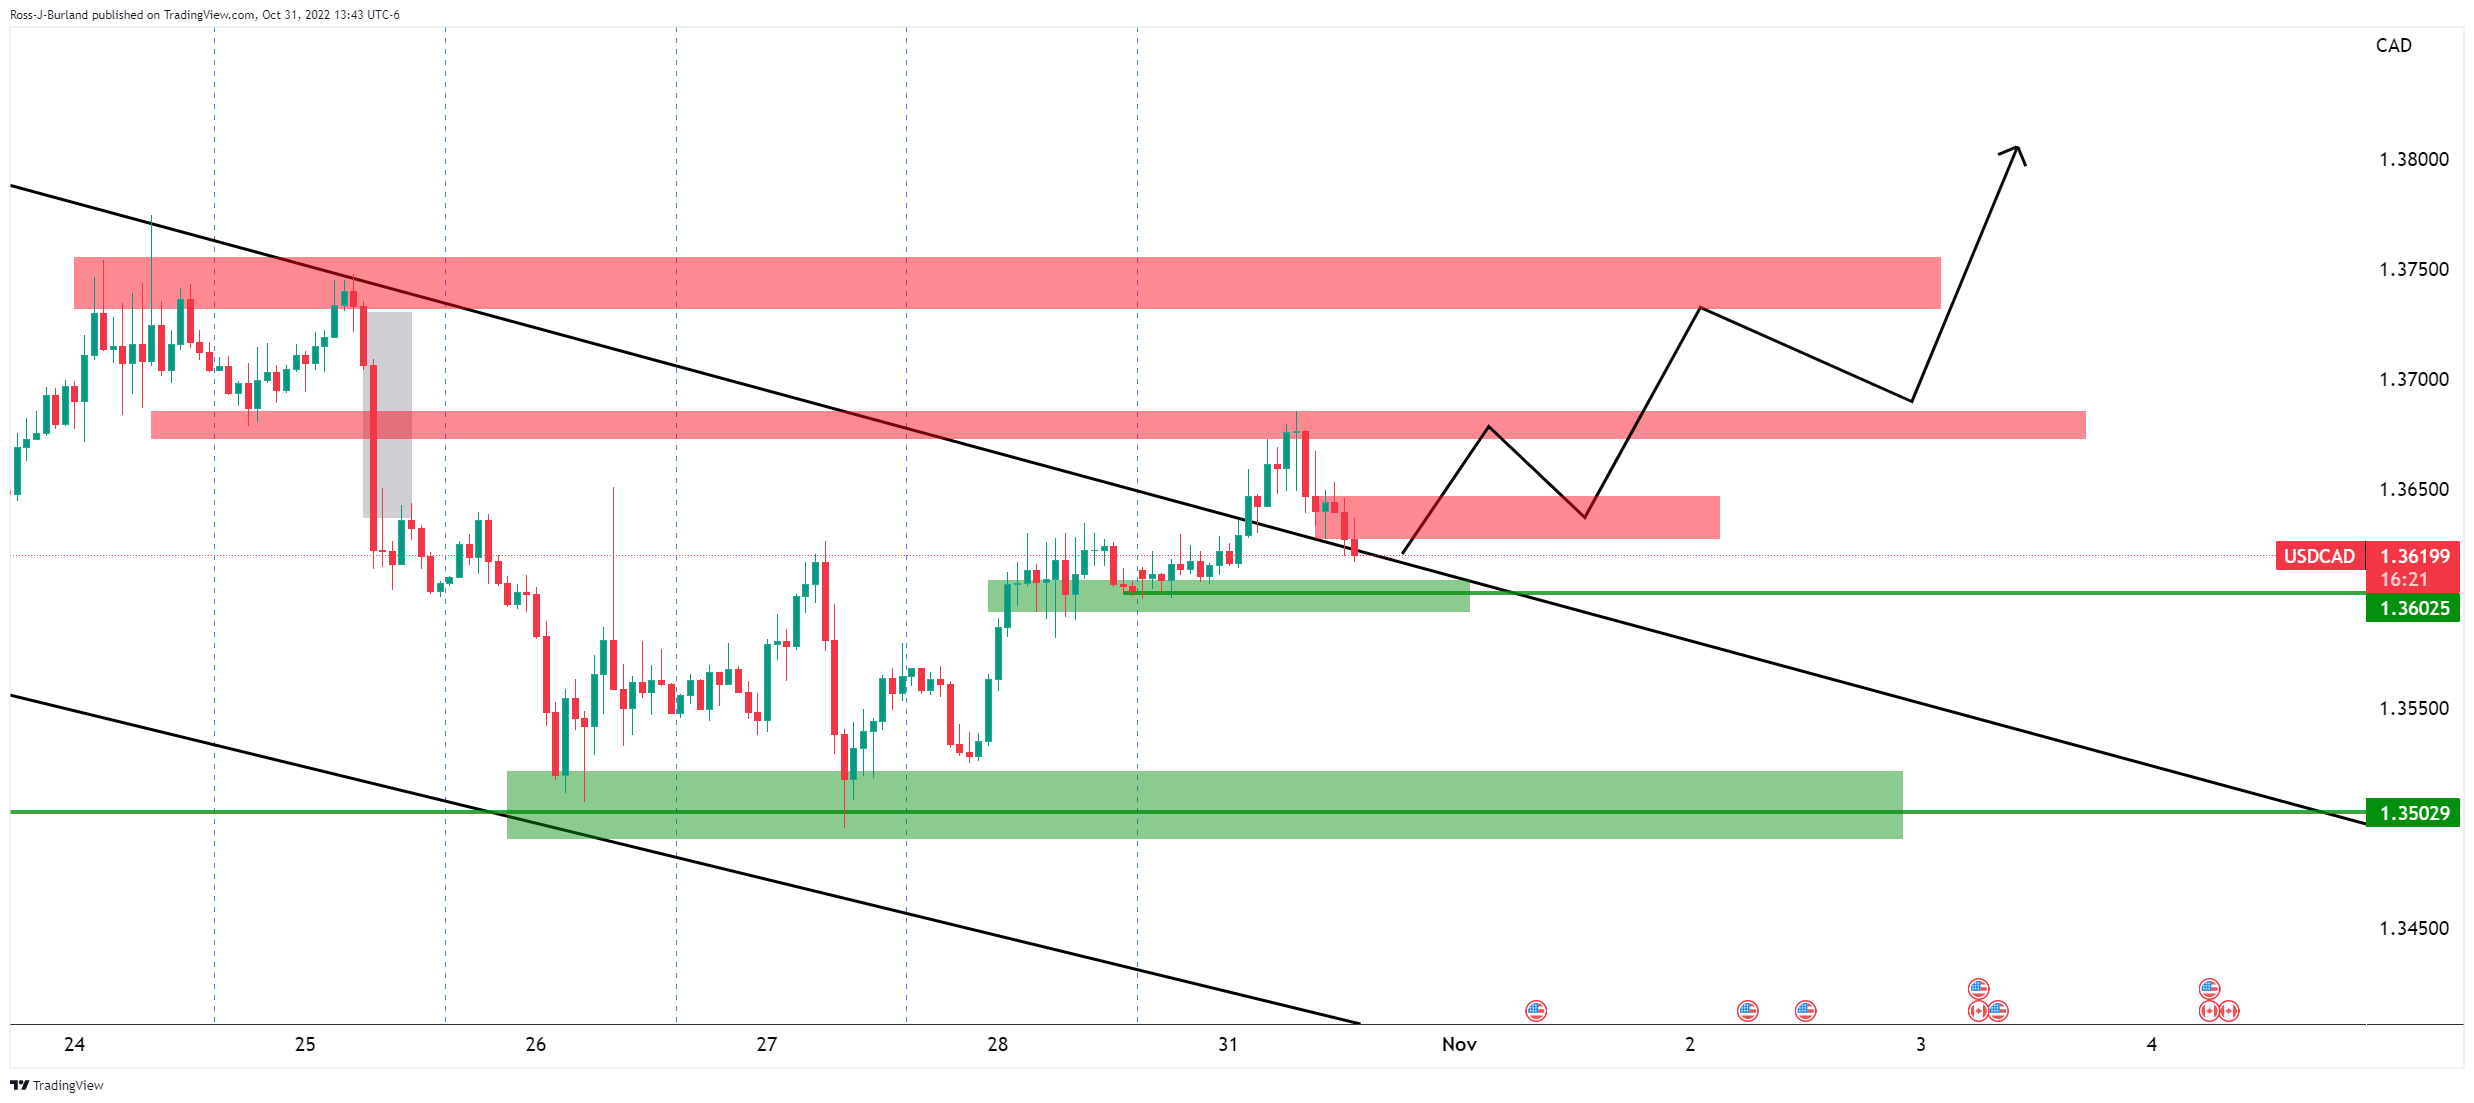
USD/CAD has seen two-way price action in a mixed start to the week so far. The following illustrates the bullish and bearish scenarios on the hourly chart, leaning on a daily bearish bias. With the price on the backside of the prior bullish trend, USD/CAD remains in a bearish trend despite the recent correction. The bears could look to commit at this juncture and see the price revert to the downside within the descending channel. However, the 1.3502 level remains key at this point:
USD/CAD daily chart
USD/CAD H1 chart
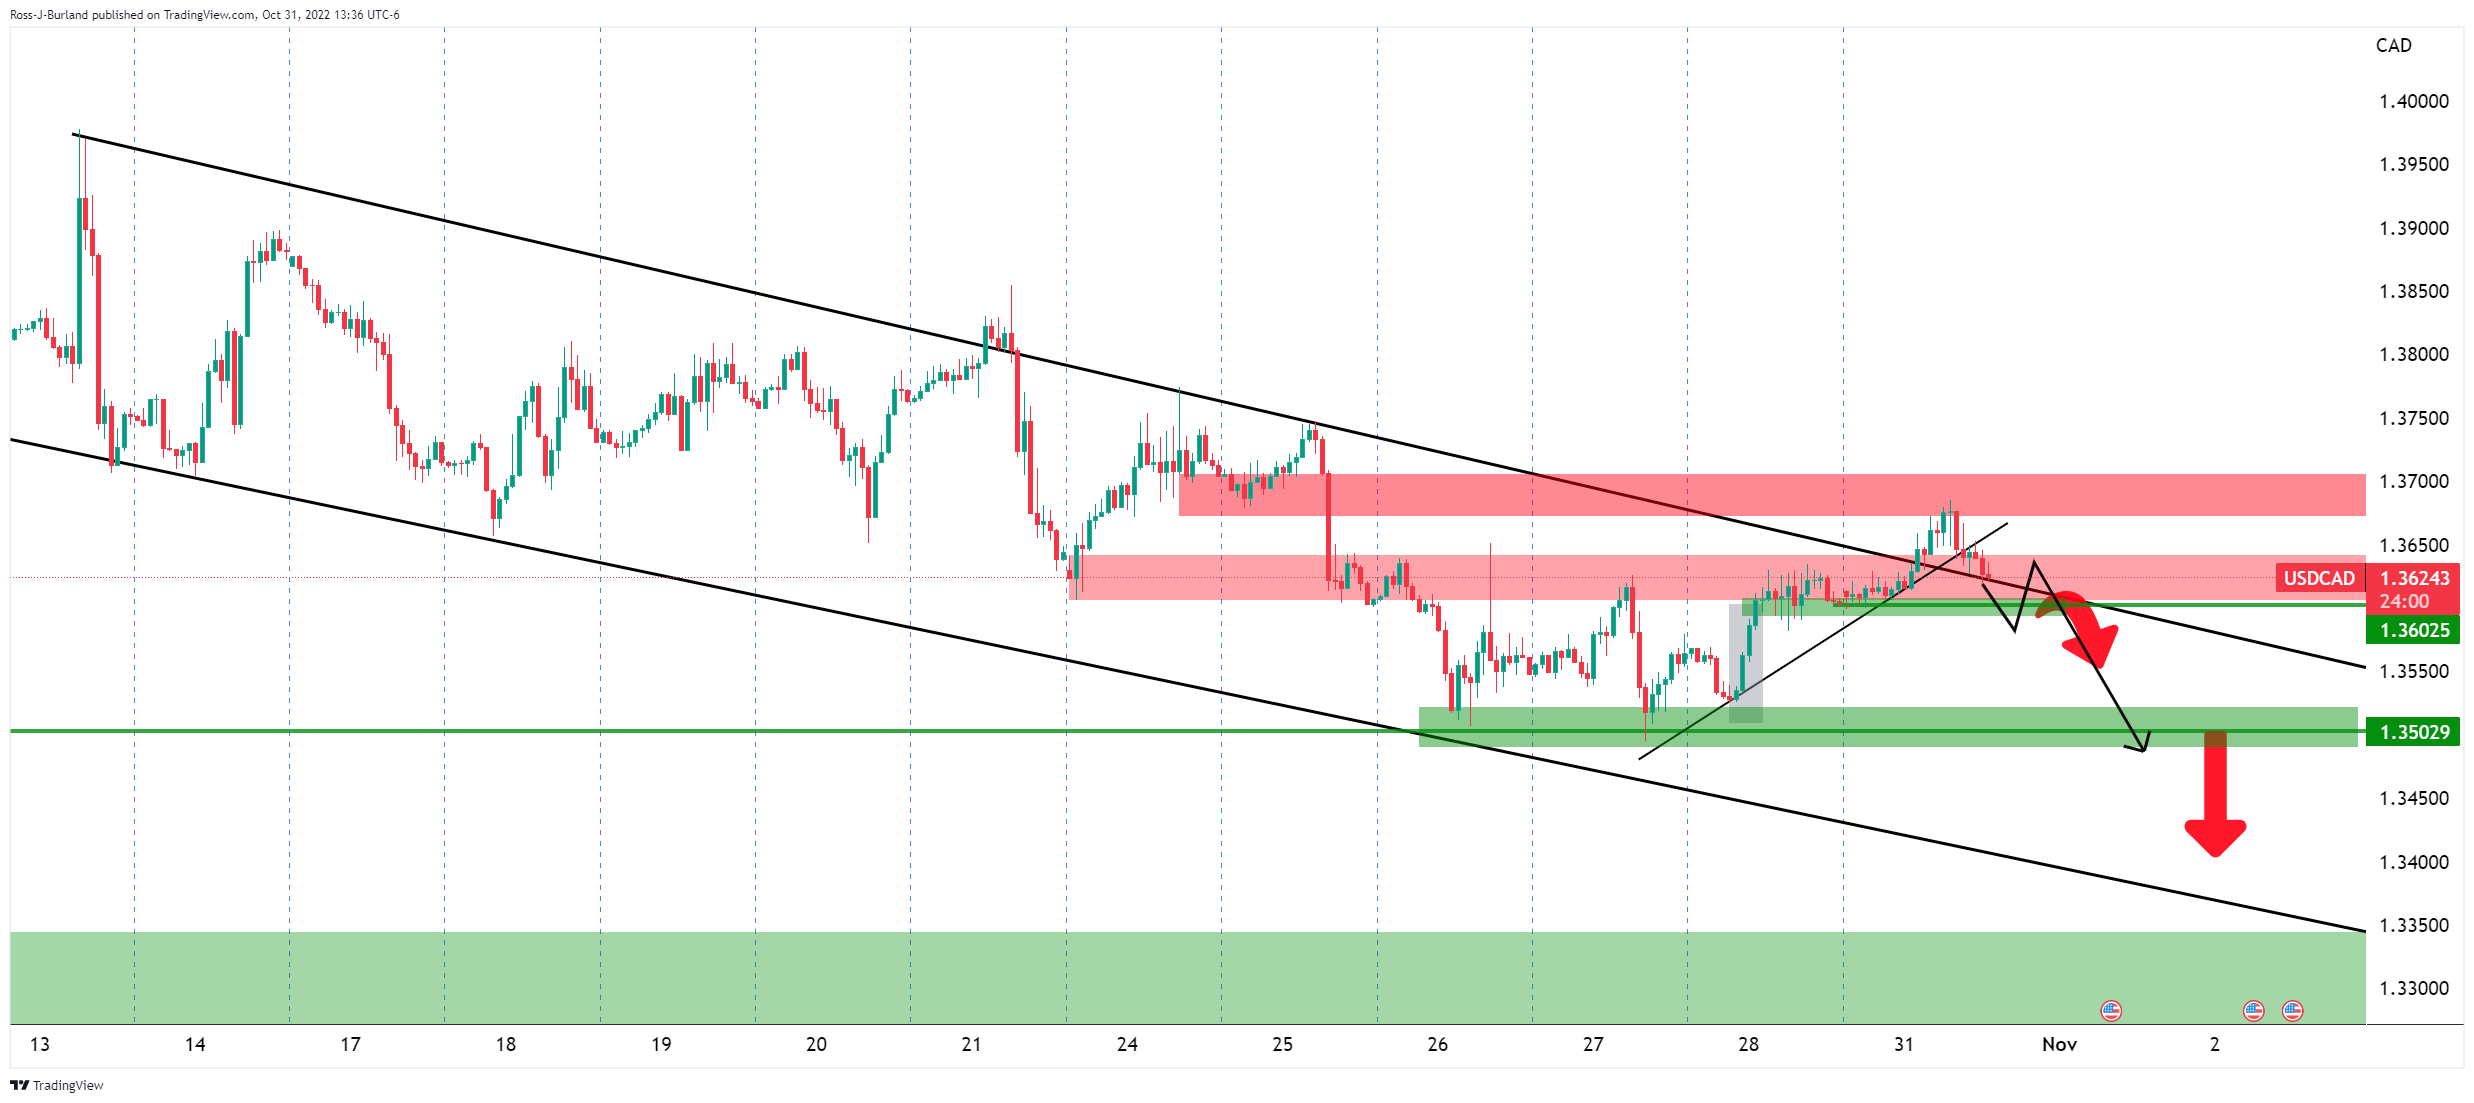
The price on the hourly chart is sliding its way out of the channel resistance again and should the bears commit, they will need to get below 1.3600 where a void of liquidity could see the CAD rally to the daily support target in quick concession. On the other hand, should the bulls find the staying power, 1.3680 and then 1.3700 could come under pressure and give way to a breakout to the upside:
-
19:37
Forex Today: Dollar strengthens ahead of RBA, Fed and more
What you need to take care of on Monday, November 1:
The American dollar surged on Monday, posting uneven gains against most major rivals. Tepid Chinese data released at the beginning of the day, alongside continued signs that global inflation is out of control, fuel risk-averse trading.
At the beginning of the day, Australia reported that TD Securities Inflation was up by more than anticipated in October, now at 5.2% YoY from 5% in the previous month. Later in the day, the Eurozone published the preliminary estimate of the October Consumer Price Index, up at an annualized pace of 10.7%, a new record.
Central banks have adopted aggressive quantitative tightening to bring inflation down, but so far, there are no signs that price pressures have begun receding. The Bank of Canada and the Reserve Bank of Australia have already started easing the pace of tightening.
The Reserve Bank of Australia will open the central banks’ calendar on Tuesday and is expected to announce a modest 25 bps rate hike despite inflation jumping to a two-decade high in the third quarter of the year. The US Federal Reserve will announce its decision on Wednesday, and market players anticipate a 75 bps hike and hint it will start slowing the pace of rate hikes in December. Finally, the Bank of England will have a Super Thursday, with the latest political turmoil in the United Kingdom generating uncertainty on what Governor Andrew Bailey and co can do this time. Finally on Friday, the US will publish the October Nonfarm Payrolls report.
In the UK, Prime Minister Rishi Sunak and Chancellor Jeremy Hunt were on the wires, anticipating that it is unavoidable that all Britons would pay more taxes.
The EUR/USD pair lost the 0.9900 threshold and trades near a daily low of 0.9872, while GBP/USD trades around 1.1470. Commodity-linked currencies recovered some ground ahead of the close as Wall Street trimmed most of its early losses. AUD/USD trades just below 0.6400, while USD/CAD is down to 1.3620.
The USD/JPY pair advanced and is now trading around 148.60, while USD/CHF hovers around parity.
Gold trades at its lowest in a week, now hovering around $1,635, while crude oil prices edged lower and WTI changes hands at $86.40 a barrel.
Binance Coin price pumps on improving fundamentals – forecasting a bullish move to $380
Like this article? Help us with some feedback by answering this survey:
Rate this content -
19:30
GBP/JPY retreats from the 172.00 area to session lows sub-170.50
- The pound fails at 172.00 and drops below 170.50.
- Fed hike hopes and risk aversion weigh on the pound.
- The yen picks up as market sentiment deteriorates.
The pound is pulling back from long-term highs above 172.00, weighed by a broad-based USD strength and a sourer market sentiment. The pair has retreated about 0.5% on the day, to reach session lows at 170.35 so far.
The pound loses momentum with the US Fed on focus
Last week’s moderately positive market sentiment seems to have waned on Monday, with the investors in a more cautious mood ahead of the US Fed’s monetary policy decision. The bank is widely expected to hike rates by 75 basis points for the fourth consecutive time on Wednesday, which has provided a fresh boost to the USD.
Furthermore, the market seems to have digested Rishi Sunak’s appointment as British prime minister, which propelled the pound more than 2% higher against the yen last week.
This week, the focus has turned to the Bank of England’s monetary policy decision, due on Thursday. The BoE is also expected to hike rates by 0.75%, although the new cabinet, which has calmed the markets, coupled with the weak UK economic perspectives are feeding expectations of a somewhat softer tightening cycle in 2023.
In the Asian session, the positive Japanese retail sales, which rose beyond expectations in September, and the downbeat Chinese manufacturing data, also JPY-supportive on the back of its safe haven status, have increased downside pressure on the GBP.
Technical levels to watch
-
19:13
WTI creeps lower toward $86.20s on weak China PMI, higher US production
- Oil production in the US increased by almost 1%, according to the US EIA.
- US President Joe Biden calls oil companies to raise production to lower gasoline prices.
- China’s weak factory activity, and Covid-19 restrictions, were headwinds for oil prices.
The US crude oil benchmark, also known as Western Texas Intermediate (WTI), slides from around $88.260s on broad US Dollar strength, alongside estimates that US production could rise amidst weaker than estimated China’s data, threatening to slow down the second-largest economy. At the time of writing, WTI is trading at $86.26 per barrel, below its opening price by 2.28%.
According to the US Energy Information and Administration (EIA), production in the United States increased by 0.9% in August to almost 12 million barrels per day, its highest since March 2020. Data showed that crude oil production in Texas and New Mexico grew by 1.6% and 0.6%, respectively, contrary to North Dakota, with production falling by 0.5%.
Aside from this, the White House reported that the President of the United States, Joe Biden, will acknowledge the record profits by oil companies while Americans struggle to pay high fuel prices at around 20:30 GMT. The White House said Biden would speak after major oil companies reported record profits, led by Exxon Mobil and Chevron, which benefitted from surging natural gas and fuel prices.
Biden asked US companies to raise production instead of using profits for share buybacks and dividends.
Elsewhere, China’s manufacturing data weakened, as an official survey showed on Monday, weighed by soft demand and the zero-tolerance Covid-19 restrictions.
Additional headwinds for global oil demand is the Eurozone entering a recession, as last week’s Global S&P PMIs reported by the block keep raising concerns about the ongoing slowdown.
Of late, the Organization of the Petroleum Exporting Countries (OPEC) raised its forecast for world oil demand in the medium-longer term in an annual outlook revised on Monday. The cartel said $12.1 trillion of investment is needed to meet demand despite the energy transition.
WTI Key Technical Levels
-
19:00
NZD/USD refuses to give up the ghost in Halloween trade
- NZD/USD remains firm despite strong US yields and USD.
- Fed is the highlight of the week, domestically, NZ jobs on the radar.
NZD/USD refused to give up the ghost for Halloween trading at the start of the week despite firm US yields, poor Chinese data and sinking stocks on Wall Street. The bird remains underpinned by a hawkish stance at the Reserve Bank of New Zealand.
It was a mixed start to the week on Wall Street, with the high betas, such as the kiwi, initially under pressure before stocks tried to correct, supporting the antipodeans. NZD/USD fell to a low of 0.5774 before recovering to a high of 0.5820 in New York, back into London shorts. This occurred at the same time the cash market S&P 500 closed the opening gap, despite further disappointing US data while investors assessed the possibility of the Federal Reserve signalling this week a slowdown in the pace of interest-rate hikes from December. US Chicago PMI for October arrived at 45.2 vs. the estimated 47.0 vs. the previous 45.7.
Meanwhile, the key events come in this week’s FOMC announcement, mid-term elections and October labour market report. However, markets may still be optimistic about a Fed ‘pivot’, so the communications from the Fed's chair, Jerome Powell, will remain the main focus for the week. ''We look for the FOMC to deliver a fourth consecutive 75bp rate hike next week,'' analysts at TD Securities explained. ''The decision will bring policy to a level at which we think the FOMC will be more comfortable in shifting to a steadier hiking pace. The exact timing of the downshift, however, will highly depend on the Consumer Price Index data before the Dec meeting. Powell might offer hints of this in the post-meeting presser.''
NZ jobs market in focus
For the domestic week ahead, third-quarter data should confirm that the labour market remained exceptionally tight in the September quarter, as analysts at ANZ Bank explained.
''Data volatility means it’s highly uncertain where unemployment will actually land (we’ve pencilled in a 0.2ppt drop to 3.1%), but the overall release is expected to confirm that the inflationary chasm between labour demand and supply in New Zealand continues.''
''Wage growth is likely to accelerate again, with private sector average hourly earnings picked to rise 2.3% q/q (8.2% YoY), comfortably exceeding annual inflation of 7.2%. Productivity-adjusted private sector labour costs, meanwhile, are forecast to have lifted 3.9% YoY. Both measures of annual wage growth are expected to see their strongest prints on record (albeit in data only going back to the 1990s).''
The ''data may not shift the dial for the November MPS (where a 75bp hike is widely expected after last week’s shock CPI print), especially given that the RBNZ in August was expecting an even faster rise in wages than we are now. But a stronger-than-expected set of data could firm up expectations for another 75bp hike in February (ie our forecast).''
-
18:51
AUD/USD is attempting to regain the 0.6400 level after bouncing up from 0.6365
- The aussie trims losses and returns to the 0.6400 area.
- Fed hike expectations are strengthening the USD.
- AUD/USD should breach 0.6430 to ease downside pressure.
The Australian dollar is trimming losses on Monday’s US trading session and has reached the 0.6400 level, after having found support at 0.6365 earlier today. On the daily chart, the pair remains slightly lower after having entered the week on the back foot.
Hopes of a hawkish Fed are hurting the aussie
With the focus on the several monetary policy decisions scheduled this week, and with special attention on the US Federal Reserve, investors have remained cautious today. The Fed is widely expected to hike rates by 75 basis points for the fourth consecutive time, which is underpinning demand for the USD.
Furthermore, the downbeat Chinese Manufacturing PMI figures released earlier today have revived fears of a global economic slowdown. These figures have hammered risk appetite during the Asian session, increasing negative pressure on the risk-sensitive AUD.
In Australia, the RBA will announce its monetary policy decision on Tuesday. The event, however, is failing to provide any relevant support to the Aussie. The bank placed itself on the dovish side of the spectrum with a dovish rate hike on early October and the market has priced in a slowdown in the bank's tightening path over the months ahead.
AUD/USD should breach 0.6430m to ease downward pressure – UOB
FX analysts at UOB see the pair gaining downward traction, and point out to 0.6430 as a key level on the upside: “AUD dipped to a low of 0.6389. Downward momentum has improved a tad and AUD is likely to edge lower today, but a clear break of 0.6370 is unlikely. Resistance is at 0.6430 but only a break of 0.6460 would indicate that the current mild downward pressure has subsided.”
Technical levels to watch
-
18:22
EUR/USD dives toward the 50-DMA, eyeing 0.9800, on a buoyant US Dollar
- The EUR/USD could not cling to gains above 0.9900 despite Euro area economic data, justifying additional rate hikes.
- The Federal Reserve monetary policy meeting put a lid on the Euro’s rise as the week begins.
- Inflation in the bloc jumped surprisingly above 10.5%, despite that the ECB hiked rates by 75 bps in two consecutive meetings
The Euro continues its free-fall against the US Dollar, testing the 50-day Exponential Moving Average (EMA) at around 0.9886, amidst a mixed sentiment of the November’s Fed meeting, where the US central bank is foreseen to hike rates by 75 bps. However, expectations for a Fed pivot as US recession fears escalated, keeping investors on their toes. At the time of writing, the EUR/USD is trading at 0.9890.
The Euro loses ground against the US Dollar, albeit inflation figures justifying additional ECB tightening
Equities in the US reflect a dampened market mood as traders brace for the Federal Reserve. The US economic data revealed the Chicago PMI and the Dallas Fed Manufacturing Index, both October readings, and disappointed investors. The Chicago PMI missed expectations at 45.2, less than the previous reading. Later, the Dallas Fed Manufacturing Index plunged to -19.2, lower than estimates, showing business conditions deteriorating for the sixth consecutive month.
In the meantime, the Eurozone reported inflation for Germany, which sharply surprised the upside in October by 11.6% YoY, above estimates of 10.9%, weighing on the bloc’s figures. Meanwhile, the Eurozone Harmonized Index of Consumer Prices (HICP) rose by 10.7% YoY, exceeding forecasts of 10.3%, but core figures kept unchanged. The core HICP increased by 5% YoY, as estimated.
Elsewhere, the US Dollar Index, a gauge of the buck’s value against a basket of six currencies, soars 0.77%, at 111.523, underpinned by higher US Treasury yields, as the Fed’s decision looms
The CME FedWatch Tool estimates an 86% chance for a Fed 75 bps rate hike, while for December, traders are split between 50 and 75 bps. Worth noting that the odds for another ¾ percent raise increased from 43.4% to 49.5%, with 50 bps sliding to 44% from 48%.
What to watch
The EU’s economic docket would be light, with Germany reporting Import Prices for September. Contrarily, the US calendar will reveal the ISM Manufacturing PMI and the JOLTs Job Opening report for October, with both figures estimated at 50 and 10 million, respectively.
EUR/USD Key Technical Levels
-
18:10
Gold Price Forecast: XAU/USD bears turn up the heat on committed longs
- Gold bears are out in force at the start of the week as the US dollar continues its reign.
- The anticipation of a hawkish Fed is building again following conflicting WSJ reports.
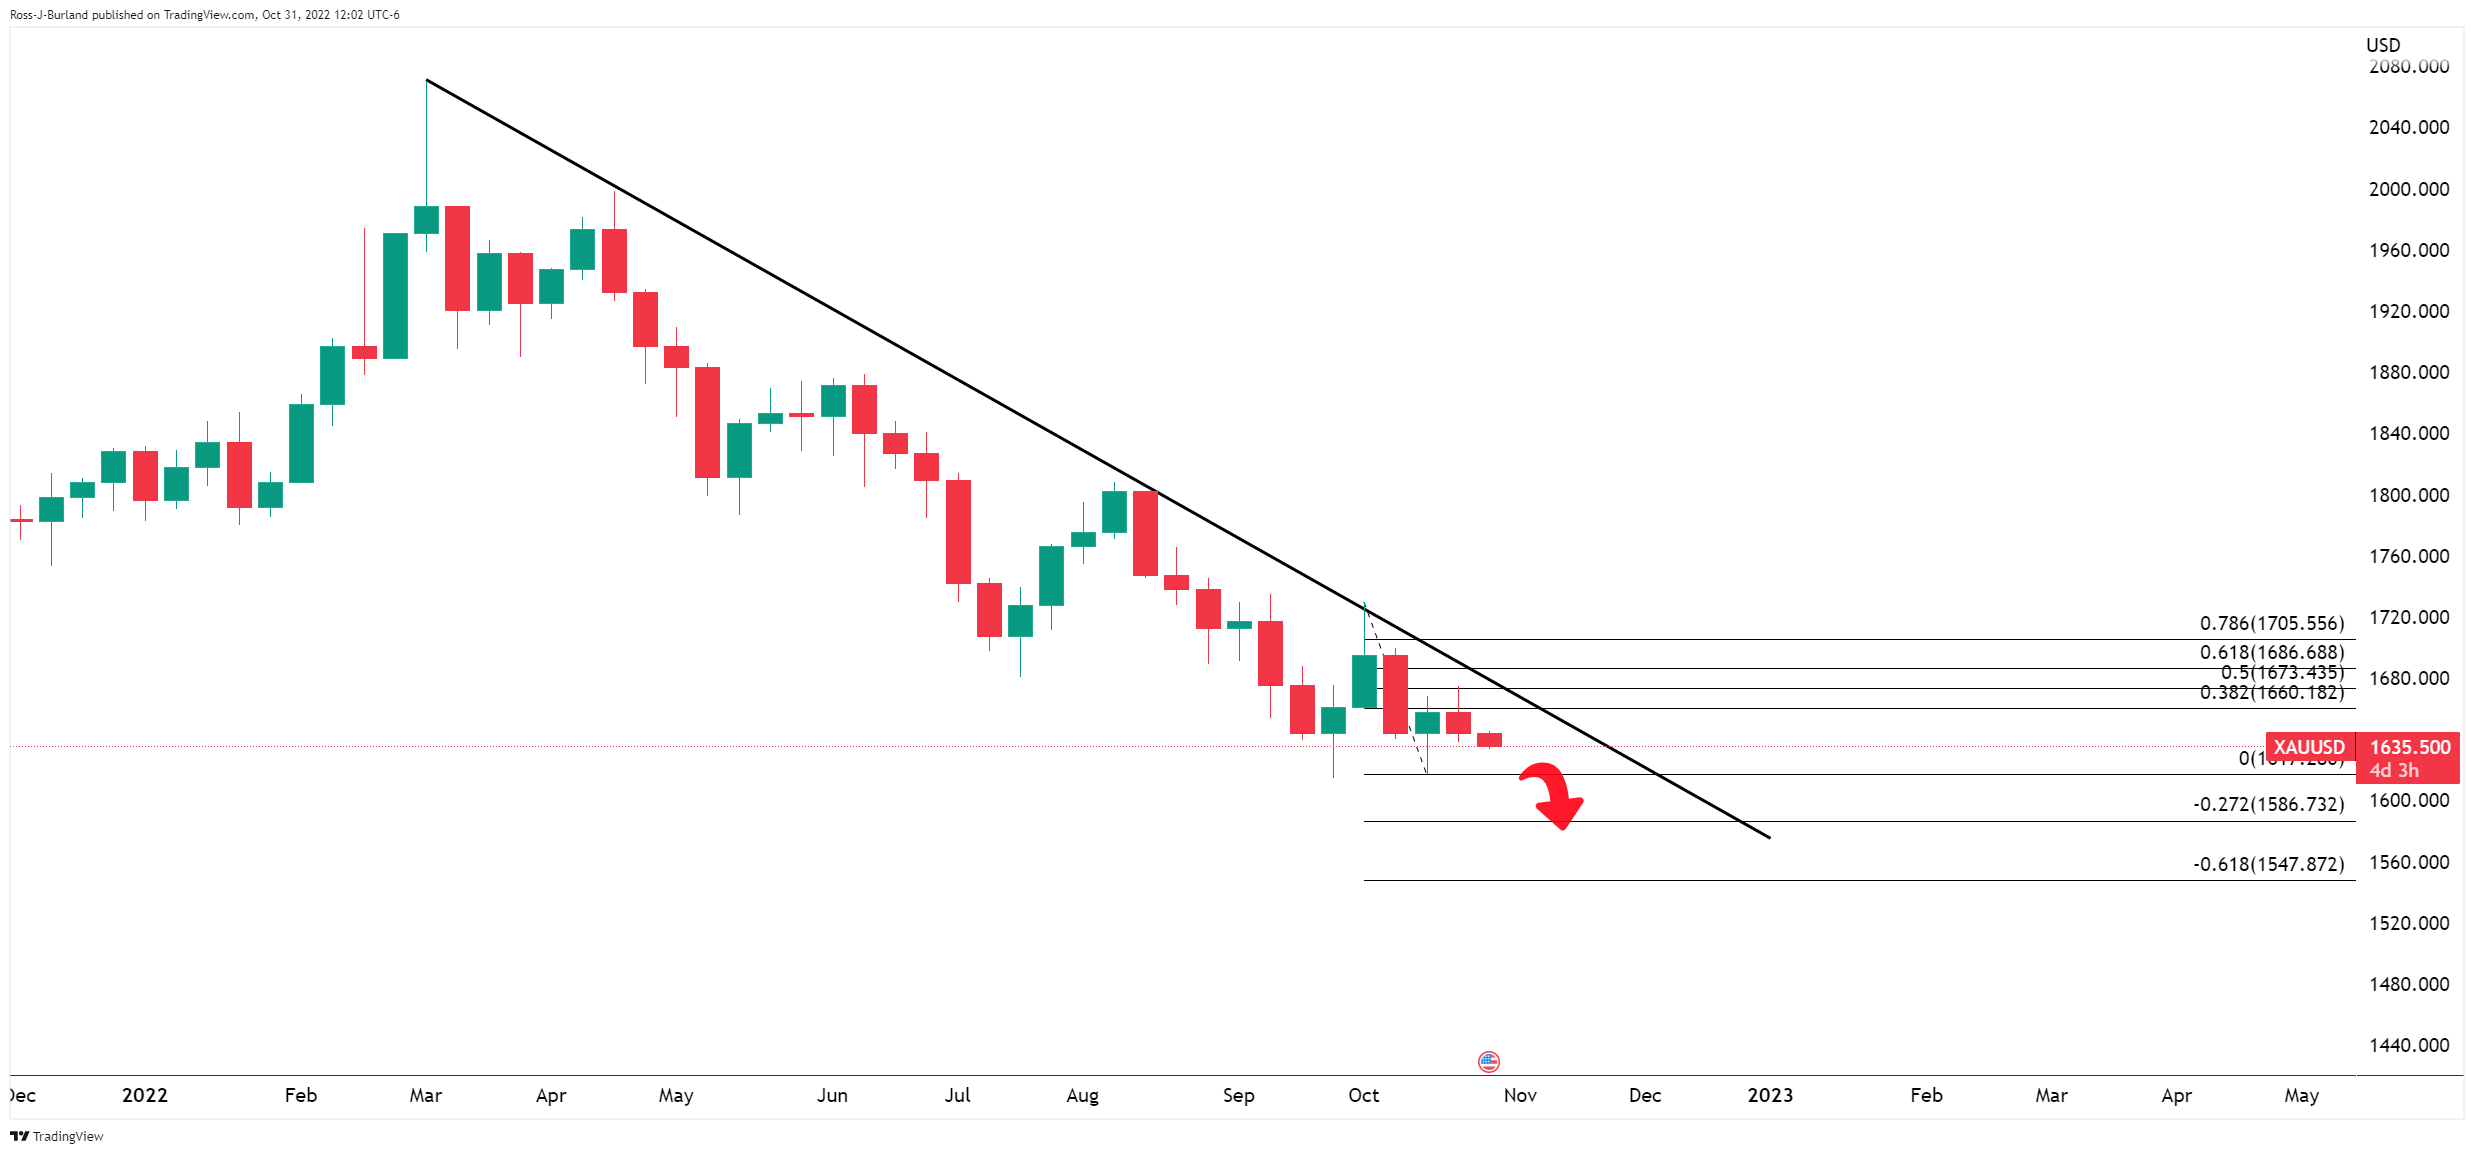
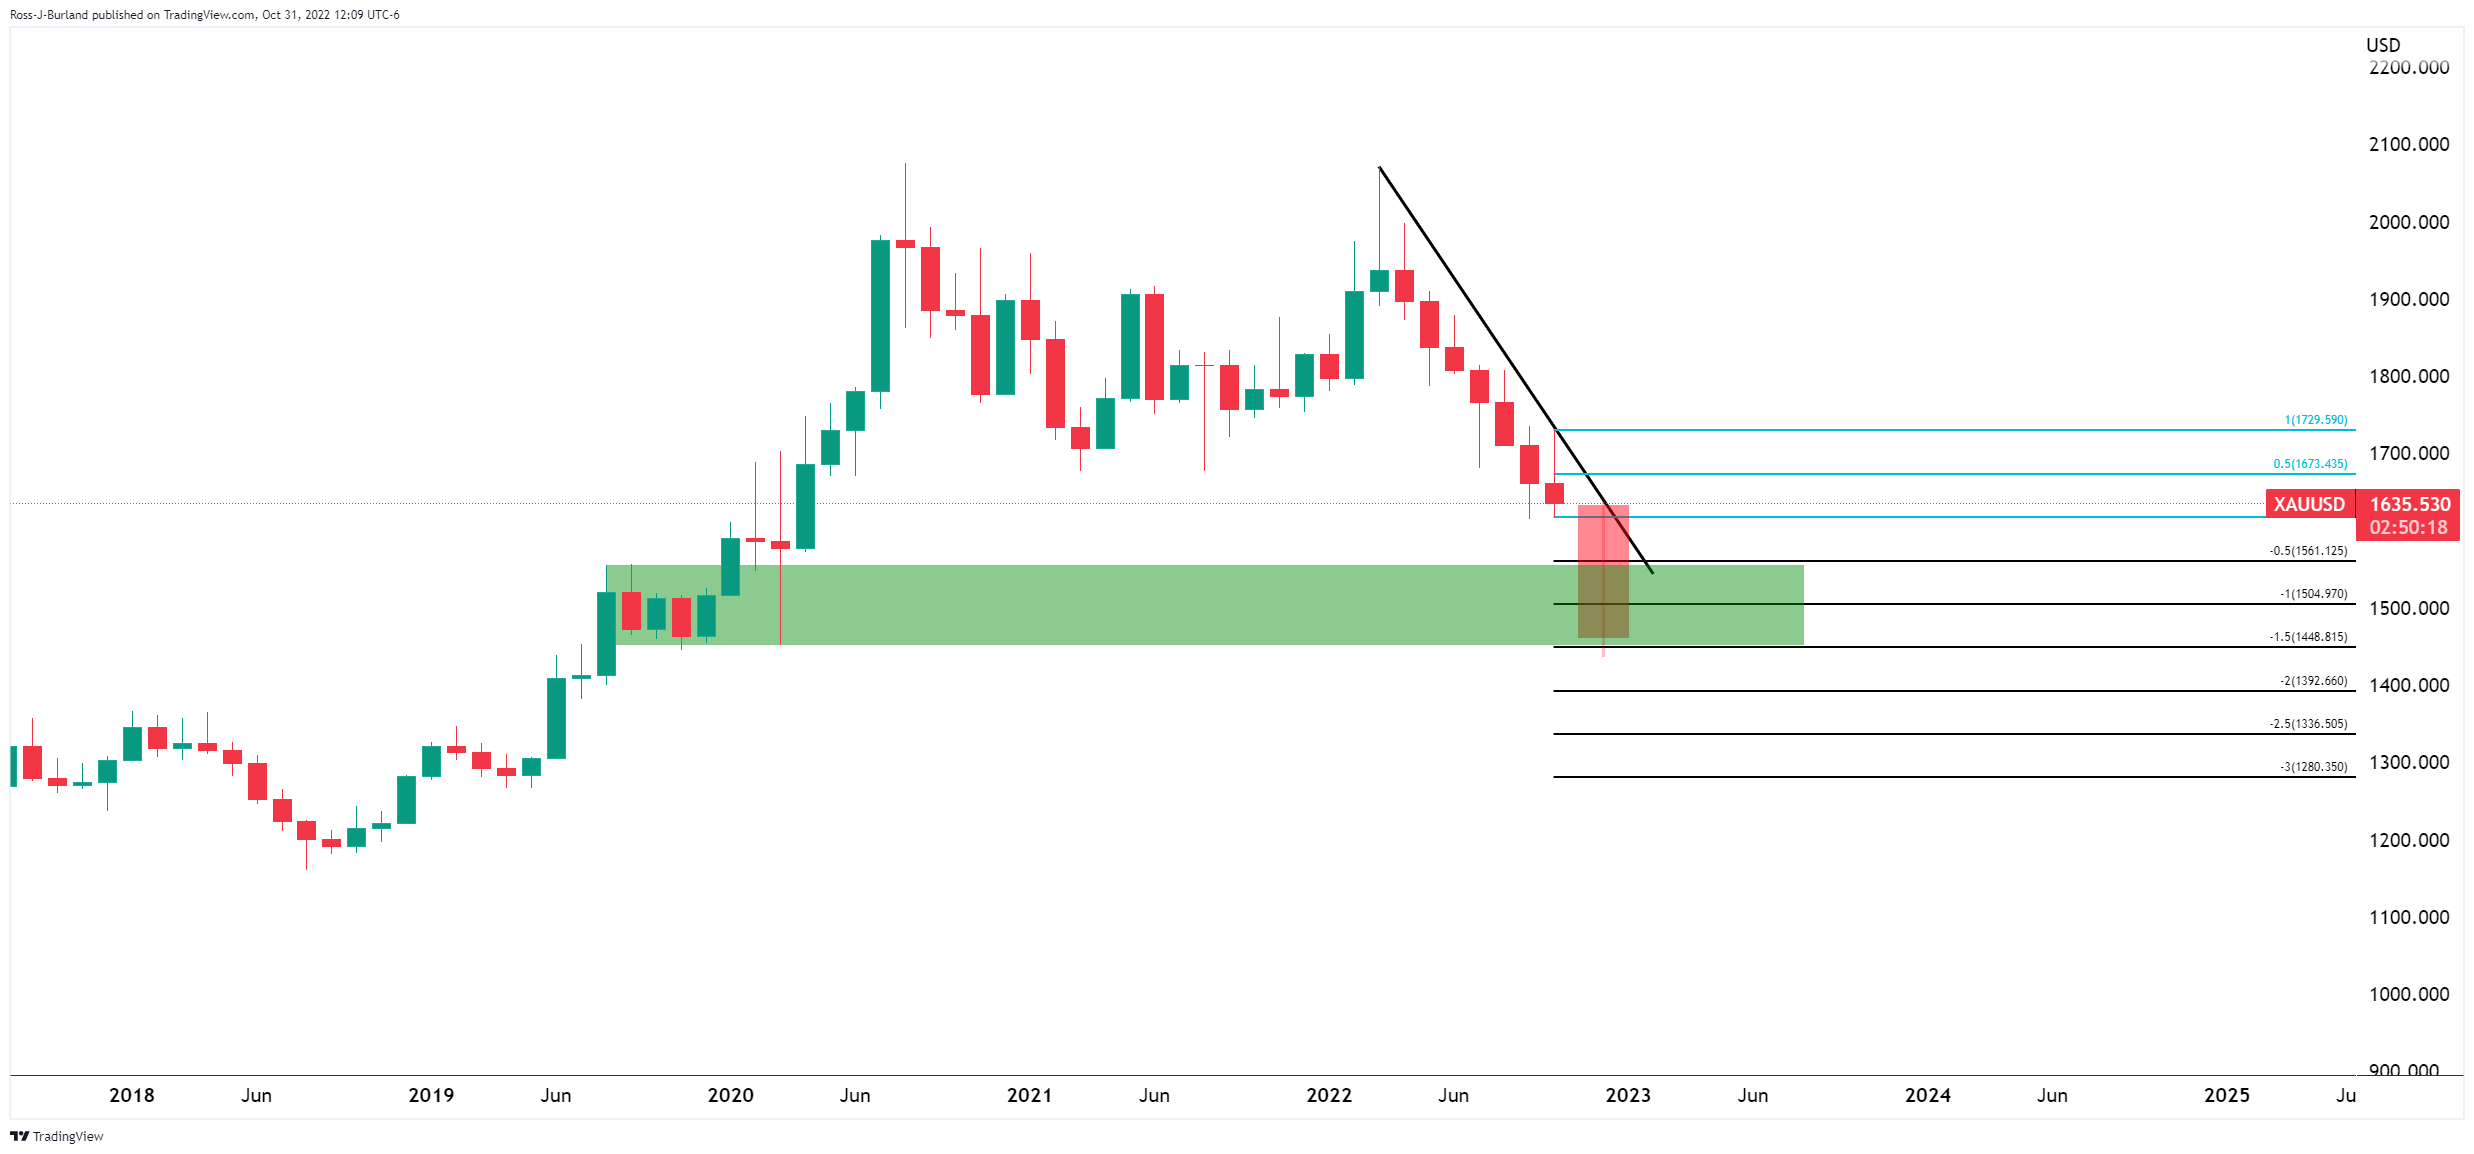
Gold has continued to slide, backing up from prospects of a bullish breakout as per the technical below. At the time of writing, XAU/USD is down 0.5% and has dropped from a high of $1645.74 to a low of $1,633.49 so far on the day. The yellow metal is heading for its longest streak of monthly losses on record with investors now in anticipation of continued rate hikes from central banks that will cause a strong US dollar and elevated US bond yields.
Looking to positioning data for the greenback, speculators’ net long USD index positions edged lower for a second week but remained essentially consolidative. The debate over whether the Fed is approaching a pivot point on policy has restarted in the market and that leaves scope for further length in the US dollar.
The sentiment has dented the non-yielding metal's appeal and nudged the bulls back a step further at the start of the week where the Federal Open Market Committee is expected to deliver a fourth consecutive 75bp rate hike this week. Hot US Consumer Price Index, strong growth numbers and conflicting ideas from the likes of WSJ have kept the US dollar underpinned.
As Reuters wrote in an opening note on Monday, ''the latest round of hopes for a shift in the Fed's tone seems to have stemmed from a Wall Street Journal article two weeks ago, flagging a possible discussion about slowing hikes. But a report from the same author over the weekend pointed to a lengthy period of high rates and traders have now tempered initial optimism, pricing in the funds rate to hit near 5% by May next year.''
This leaves the focus on the Fed chairman's presser. Jerome Powell will talk at a press conference where guidance for future increases could move the needle and after four jumbo-sized hikes. He may want to gauge economic responses before committing to anything besides hiking rates in the face of market speculating that the Fed would slow the pace of rate hikes amid concerns about overtightening.
Meanwhile, the greenback rose 0.8%, making gold more expensive for other currency holders. The benchmark 10-year Treasury yields also edged up at the start of this week. This is now using gold prices into a spiral of more than $400 since climbing above the key $2,000 per ounce level in March.
Gold technical analysis
On the downside, while below the weekly trendline, given that the price has already corrected to a 50% mean reversion of the prior bearish impulse, and considering it has failed to break key resistance so far, there is a strong argument for a downside extension:
The monthly chart could turn out a November candle such as the following:
-
17:51
GBP/USD extends losses below 1.1500 with the pound losing momentum
- The pound's reversal from 1.1645 extends below 1.1500.
- The sterling loses ground as the Sunak effect wanes.
- The US dollar appreciates ahead of the Fed's monetary policy meeting.
Sterling’s reversal from last week’s highs at 1.1645 accelerated on Monday, reaching levels below 1.1500. The cable is on the defensive at the start of the week against a stronger USD ahead of the Fed’s monetary policy meeting.
The sterling resumes its downtrend as the Sunak effect wanes
The positive impact triggered by the appointment of Rishi Sunak as British Prime Minister last week, which pushed the GBP to its highest levels in six weeks, seems to have waned. Bearing in mind the challenges ahead for the new cabinet, a sustained GBP rally was highly unlikely,
Beyond that, the focus this week has moved to the US Federal Reserve’s monetary policy meeting. The bank is widely expected to deliver the fourth consecutive 0.75% rate hike next Wednesday, which is stimulating demand for the US dollar.
The Bank of England is also expected to deliver another 0.75% hike on Thursday in an attempt to tame the soaring inflation pressures. The market, however, seems reluctant to place large GBP bets.
The new UK cabinet, and especially the confirmation of Jeremy Hunt as Chancellor of the Exchequer has calmed the market, which makes unnecessary an aggressive move to defend the pound. Furthermore, the prospects of an upcoming recession and the softer stance recently adopted by some of the world’s major central banks suggest that the BoE will soon follow suit and start slowing down its monetary normalization cycle.
Technical levels to watch
-
17:08
USD/CAD hits resistance at 1.3685 and retreats below 1.3650
- US dollar's recovery from 1.3495 finds resistance at 1.3685.
- The pair remains moderately bid with all eyes on the Fed.
- USD/CAD: needs to breach 1.3650 to confirm its upward trend – Scotiabank.
The US dollar is pulling lower on Monday’s US trading session, giving away previous gains after having peaked at 1.3685. On the daily chart, however, the pair remains moderately positive, on track to close a three-day rally from 1.3495 lows last week.
The US dollar appreciates ahead of Fed’s meeting
The Federal Reserve is attracting investors’ attention this week. The US central bank is widely expected to deliver the fourth consecutive jumbo hike next Wednesday, which is keeping the greenback moderately bid across the board at the start of the week.
US macroeconomic data, however, have not been dollar supportive on Monday. The Chicago Purchasing Managers’ Index deteriorated for the second consecutive month -to 45.2 in October from 45.7 in September- and the Dallas fed Manufacturing Index confirmed the lackluster perspectives of the sector, declining to a -19.4 reading in October from -17.2 in September.
On the other hand, the Canadian dollar has failed to capitalize on the recent USD weakness, weighed by lower oil prices. The US benchmark WTI is dropping nearly 2% on the day, amid concerns about the weak Chinese manufacturing data and its potential impact on demand.
USD/CAD: Confirmation above 1.3650 will increase upward momentum – Scotiabank
Currency analysts at Scotiabank point out at the 1.3650 level key to confirm the pairs’ neat-term trend: “USD/CAD pressured key support at 1.3505 on Thursday, but failing to achieve a sustained break under the figure leaves the market prone to a rebound (…) “Gains through 1.3650 are needed for the USD recovery to extend intraday. A high close today for the USD may add to short-term upward momentum.”
Technical levels to watch
-
16:43
NZD/USD marches steadily around 0.5800 despite a buoyant US Dollar
- NZD/USD seesaws around 0.5800 amidst overall US Dollar strength.
- A mixed sentiment keeps some high-beta currencies trending higher, though capped by a buoyant greenback.
- The US-3-month/10-year yield curve is inverted, meaning that the US could hit a recession within the next 12 months.
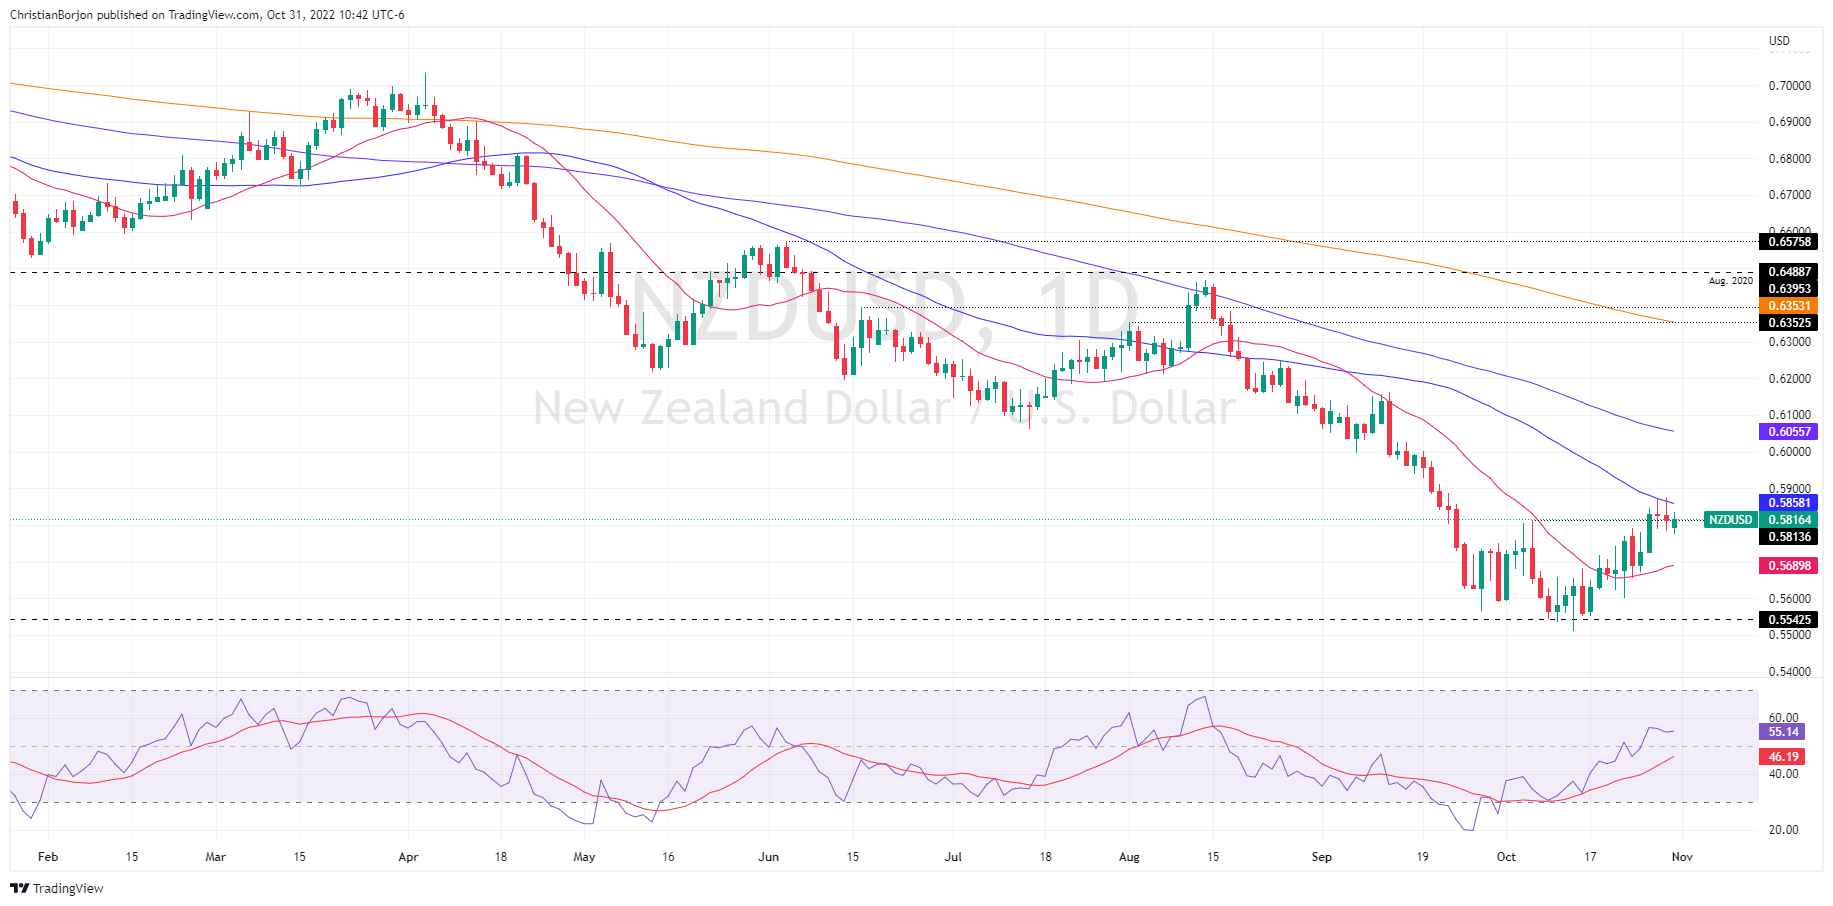
The NZD/USD slightly advanced during the mid-North American session, despite overall US Dollar strength, though the New Zealand dollar, after reaching a fresh three-day low, bounced off and reclaimed the 0.5800 figure. At the time of writing, the NZD/USD is trading at 0.5812, almost flat.
NZD/USD fluctuates as investors get ready for the Fed
US equities are trading within a mixed tone due to the deteriorated sentiment. Some US Federal Reserve regional banks unveiled PMI and Business Indices, namely the Chicago and Dallas Fed. The Chicago manufacturing PMI came at 45.2, lower than the 47.0 estimates, while the Dallas Fed Manufacturing Business Index dropped even further to -19.4 from -17.4 expected, exacerbating US recession fears around the financial markets.
Additionally, traders should be aware that the spread between the US 3-month/10-year turned negative, meaning that the yield curve inverted for the first time since March of 2020, signaling that a US recession is arriving, according to analysts at BBH.
In the meantime, geopolitical jitters like Russia’s blocking Ukraine from exporting grains, alongside a weaker-than-estimated China’s PMI figures, would likely keep the safe-haven US Dollar underpinned, even though the US economy is likely to head into a recession.
Also, the lack of tier 1 economic data keeps traders focused on the Federal Reserve’s decision. However, NZD/USD traders should be aware that November 1 ISM Manufacturing PMI for October could be the first domino of some usual “leading” indicators to flash signals of an impending slowdown in the US. Also, the JOLT’s report and the ADP Employment Change, ahead of the Fed’s policy meeting, would shed some light regarding the future outcome of the US Dollar.
NZD/USD Daily Chart
-
16:32
USD/CHF resurfaces above 1.0000 with all eyes on the Fed
- The dollar rallies for the third consecutive day, returning to levels beyond parity.
- Hopes of an aggressive Fed hike are buoying the USD.
- USD/CHF: Next upside targets are 1.0030 and 1.0145.
The US dollar is appreciating for the third consecutive day against the Swiss franc, extending its rebound from last week’s lows at 0.9840 to levels beyond parity, with the market focusing on the Fed’s monetary policy meeting, due later this week.
Hopes of an aggressive hike by the Fed are buoying the USD
Investors’ focus is on Wednesday's US Federal Reserve’s monetary policy decision, one of the highlights of the week. All signs point to another 0.75% rate hike, a favorable scenario for the US dollar, which is appreciating against its main rivals.
In the macroeconomic calendar, The US Chicago PMI has shown that business activity deteriorated beyond expectations in October and the same accounts for the Dallas Fed Manufacturing Index. These figures have increased fears about a slowdown in economic activity in the last quarter of the year, although the impact on the US dollar has been muted.
In Switzerland, retail sales increased at a 3.2% yearly pace in September, according to data from the Swiss Federal Statistics Office. This reading comes slightly below the 3.3% anticipated by the market, yet, well above the 2.1% seen in August.
USD/CHF: Increasing bullish momentum above 1.0000
From a technical perspective, the pair has confirmed its near-tern bullish bias breaching the 200-hour SMA at the 0.9980 area, which is now acting as support. On the upside, the pair is struggling against a resistance area at 1.0030 (October 24,25 highs) which would open the path toward a three-year high at 1.0145.
On the downside, the mentioned 200-hour SMA at the 0.9980 area is keeping bears at a bay. Below here, the next potential targets are October 30 low at 0.9945 and October 27 high at 0.9920/25.
Technical levels to watch
-
16:24
BoE: Looking at a dovish hike - Danske Bank
On Thursday, the Bank of England will announce its decision on monetary policy. Analysts from Danske Bank expect the central bank to hike the key rate by 75 basis points. They see later, fewer hikes than priced in markets as they emphasise the weak growth outlook.
Key Quotes:
“We expect the Bank of England (BoE) to hike the Bank Rate by 75bp on 3 November bringing it to 3.00%. Markets are currently pricing close to 75bp. Given the past months immense sell-off in gilt markets, we see the hawkish camp prevailing as an opportunity to restore market credibility as inflation remains significantly above target.”
“We expect the Bank to return to its more dovish stance as recession risks are becoming more pronounced and the growth outlook is increasingly becoming weaker. Likewise, the BoE tends to ear on the side of caution, why we expect a return to smaller increment hikes.”
“We keep the rest of our forecast unchanged, expecting a 50bp hikes in December followed by a final 25bp hike in February 2023, which is fewer hikes than priced in markets (currently 270bps until August 2023).”
“In our base case of a 75bp hike, we expect EUR/GBP to move slightly higher on announcement. As we expect the BoE to highlight the gloomy growth outlook for the UK economy amid rising recession risk, we expect EUR/GBP to continue its move higher during the press conference.”
-
16:20
Fed: We do not expect a pivot before 2024 – Rabobank
Analysts at Rabobank point out that with a Federal Reserve that is clearly prioritizing price stability over full employment, rates will go higher than currently anticipated. They expect the FOMC to raise the target range for the federal funds rate by 75 bps to 3.75- 4.00% on Wednesday. They do not expect the Fed to pivot before 2024.
Key Quotes:
“The next meeting of the FOMC takes place on November 1 and 2. Given the high inflation figures published in October, the FOMC is expected to take another giant step of 75 bps in November. Since that will take the top of the target range to 4.00%, and the FOMC had a terminal rate of 4.6% in mind in September, they are likely to slow down the hiking cycle at the next meeting in December.”
“We expect a 50 bps hike in December, followed by two hikes of 25 bps in February and March, which would take the top of the target range to 5.00%. We expect the Fed to remain on hold for the remainder of 2023.”
-
16:14
USD/JPY hits six-day highs near 149.00 ahead of critical days
- Japanese yen fall on Monday amid higher yields.
- Intervention: can it be sustained?
- USD/JPY with bullish bias in the very short term.
The USD/JPY is rising on Monday for the second day in a row and reached a six-day high at 148.83, before pulling back to the 148.50 area. The yen is among the worst performers even as equity markets in the US decline.
Higher US yields continue to be a key driver in USD/JPY. The US 10-year yield is holding firm above 4.00% while the 2-year approaches 4.50% again.
Intraday, the pair is moving with a bullish bias. The next resistance is seen around 149.10. On the flip side, support levels are 148.25 and 147.80.
Critical days ahead
Economic data released on Monday in the US showed an unexpected decline in the Chicago PMI and also in the Dallas Fed Manufacturing Business Index. Despite the numbers, the greenback remained in positive ground against most currencies. On Tuesday the ISM Manufacturing Index is due.
The FOMC will end its two-day meeting on Wednesday. The Fed is expected to raise the key interest rate by 75 basis points. On Friday, is the Non-farm payrolls report. Those events are likely to keep volatility elevated over the next sessions.
Data released in Japan gave light on the recent intervention from authorities to curb the yen’s weakness. After spending around 20 billion dollars in September, the total in October was above 40 billion. “In total, these interventions represent nearly 6% of its total foreign reserves and so it’s clear that this pace cannot be sustained on a regular basis. Rather, we think the BOJ will continue to intervene sporadically and quietly to try and keep the markets guessing. With the BOJ delivering another dovish hold last Friday, we think USD/JPY remains a buy at current levels”, said analysts at Brown Brother Harriman.
Technical levels
-
15:58
RBA Preview: Forecasts from 10 major banks, 50 bps rise is possible on upside surprises in inflation
The Reserve Bank of Australia (RBA) will announce its next monetary policy decision on Tuesday, November 1 at 03:30 GMT and as we get closer to the release time, here are the forecasts by the economists and researchers of 10 major banks regarding the upcoming central bank's decision.
The RBA will likely hike the cash rate by 25 basis points although a 50 bps move is still on the table, given the most recent inflation estimates.
ANZ
“The Q3 acceleration in CPI is expected to see the RBA lift its forecast for headline inflation for the full 2022 year to more than 8%. We think the equivalent forecast for trimmed mean inflation will lift to around 6.6% YoY. This shifts the narrative about Australia being on a different inflation pathway from other developed countries. The shift in this narrative has caused us to adjust our policy expectations for the RBA. We have pushed that up to another 125 bps, with the RBA no longer expected to pause in December. After consecutive 25 bps rate hikes this week and December, we see a further 75 bps of tightening over the first half of 2023 which will take the cash rate target to a revised peak of 3.85% in May(up from 3.6%). Absent a sharp negative external shock, we don’t think the RBA will be in a position to ease policy for some time. We have 50 bps of rate cuts penciled in for H22024.”
Westpac
“The RBA will lift the cash rate by 50 bps, to 3.10%. This is a non-consensus view – most commentators anticipate a move of 25 bps. It is significant that Q3 inflation data was much higher than anticipated. The 1.8%qtr, 6.1%yr increase in trimmed mean inflation was a shock result. It demands a more urgent response from the RBA. With inflation higher for longer the concern is that strong inflationary psychology may become entrenched.”
Standard Chartered
“We expect the RBA to hike the cash rate by 25 bps to 2.85% from 2.60% previously. Given the high frequency of RBA meetings, we think the RBA may keep to 25 bps hikes even though Q3 inflation surprised to the upside.”
UOB
“The latest Federal Budget, unveiled on 25 Oct, displayed strong fiscal discipline, which is crucial and consistent with RBA’s efforts to curb inflation. Notably, both headline and underlying inflation for 3Q22 came in higher than expectations. But we believe inflation will likely peak in 4Q22, in the absence of further significant global shocks. We are penciling in a 25 bps hike OCR to 2.85%.”
TDS
“The RBA made a judgment call in October and reduced the size of its rate hikes. However, the upside surprise in Q3 CPI cast doubt on the pivot though we think this adds upside risk to our terminal rate call rather than a return to 50 bps hike next month. The RBA will provide new forecasts and we expect downward revisions to growth and upgrades to its inflation forecasts.”
ING
“After the big upside miss to 3Q22 inflation, we think the RBA will have to return to 50 bps of tightening after it dropped to just 25 bps at the October meeting.”
SocGen
“We expect the RBA to increase the cash rate target from 2.60% to 3.10%, which means that it is likely to return to the 50 bps pace of tightening implemented from June to September after a one-off 25 bps hike in October. The upside surprises in the 3Q22 inflation data should be the main driver for the likely 50 bps hike, overwhelming other factors like the slowdown in employment and the stabilisation of global financial market conditions. The policy statement should continue to say that the RBA is resolute in its determination to return inflation to target while keeping the economy on an even keel. Meanwhile, we stick to our ‘terminal’ policy rate forecast of 3.60% at this juncture.”
NAB
“We expect the RBA to lift the cash rate by 0.25 bps to 2.85% but note that the AU Q3 Inflation data revealed high and broad-based inflation, setting up a tough choice for the RBA on Tuesday. Thus, a 50 bps will be considered and we see it as a material risk.”
Citibank
“We stick to our view of another 25 bps rate hike this week and further 25 bps hikes across December and February. The RBA will also provide updates to Australian GDP and CPI forecasts. We expect a downgrade to 2023 GDP while raising the unemployment rate forecast. However, we do not expect the RBA to materially change the headline inflation forecast despite last week’s solid Q3 CPI data.”
Wells Fargo
“While headline CPI inflation surprised to the upside and reached 7.3% year-over-year in Q3, we still expect this 25 bps rate hike pace to continue in November. However, we now believe the RBA will extend its rate hike cycle beyond this year into 2023, with 25 bps rate hikes in November, December, and February to a terminal rate of 3.35%.”
-
15:33
Gold Price Forecast: XAU/USD tumbles below the 20 DMA, targets the YTD low below $1,620, ahead of Fed meeting
- Gold tumbles and extends its yearly losses, eyeing the YTD low at around $1,615.
- Broad US dollar strength ahead of the Federal Reserve meeting keeps the precious metals segment under pressure.
- US ISM Manufacturing PMI and JOLTs Opening, eyed on Tuesday, before Fed’s decision.
Gold price slides for the second consecutive day as the US dollar advances, ahead of the Federal Reserve Open Market Committee (FOMC) meeting, which is widely expected to deliver the last jumbo-size rate hike of the US central bank, amidst growing speculation for a Fed pivot, while recession fears increased. At the time of writing, the XAU/USD is trading at $1,637 a troy ounce, down by 0.39%.
XAU/USD falls on a buoyant US Dollar, underpinned by elevated US T-bond yields.
Global equities remain under pressure. Inflation in the Eurozone reached a record high of 10.7% amidst an ongoing economic slowdown in the block, which weakened the EUR, and underpinned the USD. The greenback got bolstered by US Treasury yields rising, while the 3-month/10-year yield curve spread briefly inverted during the last week. According to BBH analysts, “the signal is impossible to ignore, and that is the US economy is moving closer to a recession within the next 12 months, give or take.”
Data-wise, the US economic docket featured the Chicago PMI, which decreased to 45.20, below estimates of 47, adding to the list of Federal Reserve regional indices, painting a recessionary scenario. Of late, the Dallas Fed Manufacturing Business Index dropped below 0 to -19.4, lower than estimates of -17.4.
Aside from this, the Institute for Supply Management (ISM) will be reported the Manufacturing PMI for October on November 1, with estimates at 50, below the previous month’s 50.9. Of note, particular attention would be to prices paid by companies and employees, which would signal if the US economy continues to expand or begins to feel the shock of higher interest rates. Last month’s readings were 68.7 and 53.0, respectively.
The US Dollar Index, a gauge of the buck’s value vs. a basket of peers, climbs 0.84% to 111.592, while the US 10-year benchmark note rate sits at 4.042%.
The US calendar will release the ISM Manufacturing PMI for October, JOLT’s opening, and the Federal Reserve’s monetary policy decision ahead of the week.
Gold Price Forecast (XAU/USD): Technical outlook
The yellow metal tumbled below last week’s low of $1638.40, exacerbating its fall to fresh two-week lows at around $1633.53. The Relative Strength Index (RSI) in the daily chart is headed downward, meaning that sellers remain in charge, though they will face solid support at around $1617, ahead of the YTD low at $1614.92. If buyers would like to shift gold bias to neutral, they need to reclaim the 50-day Exponential Moving Average (EMA) at $1682.69.

-
15:28
USD/MXN Price Analysis: Mexican peso continues to test the 19.80 barrier
- USD/MXN with bearish bias while below 19.95.
- Consolidation under 19.80 points to more weakness ahead.
- Immediate resistance at 19.95 followed by 20.00; upside limited under 20.15.
The USD/MXN is rising on Monday but it moved off highs and pulled back. The pair traded momentarily above 19.90 and then dropped below 19.85, and is it looking again at the key support around 19.80.
The critical support area around 19.80 has held fine so far and triggered a rebound, but it is still exposed and being challenged. A daily close below would reinforce the bearish bias, exposing the 19.50 key level (intermediate support at 19.70).
The 19.95 has become the immediate resistance, followed by 20.00, an area that also contains the 20 and 55-day Simple Moving Average. A break higher would expose the 20.15/20.20 key resistance. A break higher would suggest more gains ahead, targeting 20.45.
USD/MXN daily chart
-638028268926843569.png)
-
15:25
Colombia National Jobless Rate rose from previous 10.6% to 10.7% in September
-
15:19
USD to suffer a further leg lower if Fed commits to slowing down the pace – MUFG
After its late October swoon, the US Dollar Index is up for the third straight day as critical central bank week gets underway. Unless the Federal Reserve cements a pivot, the greenback is set to remain on a solid foot, economists at MUFG Bank report.
US rate market is expecting Fed to signal slower pace of hikes ahead
“If the Fed does slow the pace of hikes in December it does not necessarily mean as well that the total amount of tightening delivered in the current tightening cycle will be less although that will be the initial assumption. It could be that the Fed slows the pace of hikes but eventually keeps hiking for longer. The US rate market though is expecting that as the Fed slows the pace of hikes at the end of this year, it will then quickly bring an end to the hiking cycle in the 1H of next year leaving the terminal rate at around 4.75%.”
“After correcting lower over the past week/month, the Fed will have to send a clear signal that it plans to slow rate hikes and sound more cautious over the need for further tightening to trigger a further leg lower for the US dollar in the week ahead.”
-
14:38
US: Economy is seen expanding 1.6% in 2022 – UOB
Senior Economist at UOB Group Alvin Liew reviews the recent flash US GDP figures for the third quarter.
Key Takeaways
“The advance estimate of US 3Q GDP surprised on the upside with a 2.6% q/q SAAR expansion (versus Bloomberg est +2.4%) the first positive q/q print for this year, from an unchanged 0.6% decline in 2Q. The rebound in 3Q GDP was attributed to resilient private consumption expenditure, a continued gain in net exports, a rebound in non-residential fixed investment (business spending) as well as federal government, state and local government spending, offsetting the continued decrease in private inventories and a deeper plunge in residential fixed investment.”
“But with the 2.6% bounce in 3Q growth, even as we factor in a sizeable 3.6% contraction in 4Q, our full year GDP growth forecast will now be higher at 1.6% (from previous forecast of 1.0%). And for 2023, we continue to expect the US economy to fall into a shallow recession due to the combination of elevated inflation, global growth slowdown with a European recession and importantly, the impact from the aggressive Fed rate hikes. We keep our projection for US GDP to contract by 0.5% in 2023. That said, the risk of a deeper recession will rise in tandem with a more protracted and sharper Fed tightening cycle.”
“US GDP Outlook – The latest GDP report does not change our Nov FOMC outlook for a 75 bps rate hike. If anything, the resilient PCE component and rebound in business spending in 3Q vindicates the Fed to continue with “larger than usual” hikes in order to tame elevated inflation. The question is whether the more pessimistic outlook in 2023 will be enough to convince the Fed to slow its tightening pace after Nov.”
-
14:35
US: Dallas Fed Manufacturing Index drops to -19.4 in October vs. -15 expected
- Dallas Fed Manufacturing Index for October missed market expectations.
- US Dollar Index clings to strong daily gains near 111.50.
The headline General Business Activity Index of the Federal Reserve Bank of Dallas' Texas Manufacturing Survey declined to -19.4 in October from -17.2 in September. This reading came in weaker than the market expectation of -15.
Further details of the survey revealed that the Manufacturing Output Index fell to 6 from 9.3, the Employment Index improved to 17.1 from 15 and the Company Outlook Index edged higher to -9.1 from -10.7.
Market reaction
The greenback preserves its strength following this report and the US Dollar Index was last seen rising 0.75% on the day at 111.50.
-
14:35
EUR/USD: High inflation to dampen the risk of a sharper euro sell-off – MUFG
The euro has remained at weaker levels following last week’s European Central Bank (ECB) policy meeting. The release of stronger activity and inflation data from the eurozone are set to prevent a sharp euro sell-off as ECB tightening expectations have been challenged, economists at MUFG Bank report.
Economic data releases keep pressure on ECB to tighten policy
“The latest economic data from the eurozone did highlight that the ECB is still facing a difficult balance when setting policy with inflation continuing to surprise significantly to the upside. It will keep pressure on the ECB to keep delivering larger rate hikes as policy rates remain relatively low and well below inflation.”
“Activity in the eurozone economy appears to have held up better than expected in Q3. While a sharper slowdown is still likely over the winter period, the activity data for Q3 has provided some comfort.”
“The combination of stronger inflation and activity data should help to dampen speculation over an even bigger dovish pivot from the ECB anytime soon, and thereby dampen the risk of a sharper euro sell-off.”
-
14:34
EUR/USD: Bears don’t give up and push for more
- EUR/USD breaks below the 0.9900 mark to new lows.
- The dollar remains well bid ahead of the FOMC event on Wednesday.
- EMU Flash inflation rose more than expected in October.
The single currency remains mired in the negative territory and drags EUR/USD to fresh multi-session lows in the sub-0.9900 region at the beginning of the week.
EUR/USD weaker on USD-recovery
EUR/USD accelerates its losses on Monday and breaches the key support at 0.9900 the figure, that is more than 2 cents down from last week’s monthly highs just below the 1.0100 barrier (October 27).
Indeed, the continuation of the strong recovery in the greenback keeps undermining the sentiment around the euro and favours extra decline in the pair, as investors get ready for the FOMC gathering on Wednesday, which will be the salient event of the week.
The daily drop in the pair comes in tandem with the small rebound in the German 10-year bund yields, which add to Friday’s bounce beyond 2.10% at the same time.
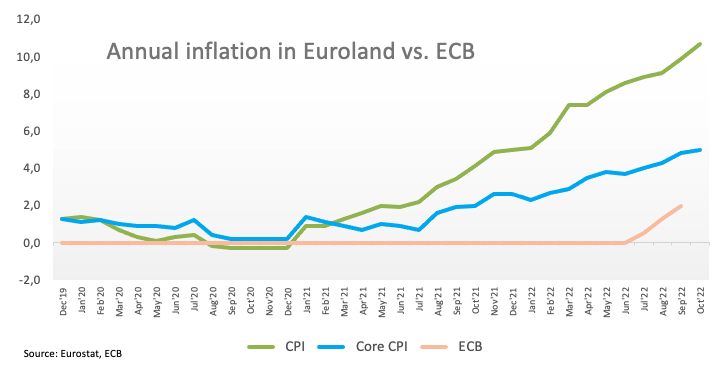
In the euro docket, advanced inflation figures in the euro area now see the CPI rising more than expected 10.7% in the year to October, while the Core CPI is seen gaining 5.0% from a year earlier.
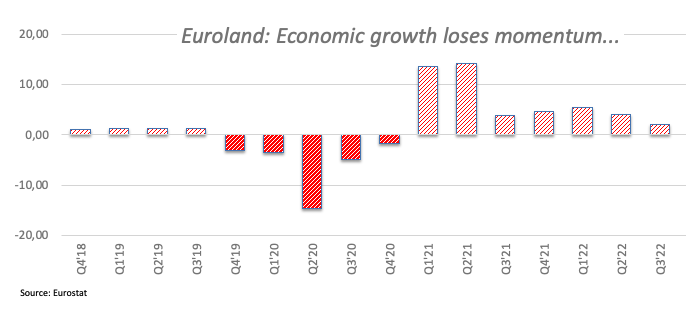
Still in the Euroland, the economy is predicted to expand 0.2% QoQ in Q3 and 2.1% on a yearly basis, according to preliminary results. In the first turn, German Retail Sales contracted 0.9% in September vs. the same month of 2021.
What to look for around EUR
EUR/USD extends a leg lower and breaks below the 0.9900 mark against the backdrop of persistent dollar strength on Monday.
In the meantime, price action around the European currency is expected to closely follow dollar dynamics, geopolitical concerns and the Fed-ECB divergence. The resurgence of speculation around a potential Fed’s pivot seems to have removed some strength from the latter, however.
Furthermore, the increasing speculation of a potential recession in the region - which looks propped up by dwindling sentiment gauges as well as an incipient slowdown in some fundamentals – adds to the fragile sentiment around the euro in the longer run.
Key events in the euro area this week: Germany Retail Sales, EMU Flash Q3 GDP Growth Rate, Inflation Rate (Monday) – Germany Balance of Trade, Unemployment Change, Unemployment Rate, Final Manufacturing PMI, EMU Final Manufacturing PMI (Wednesday) – EMU Unemployment Rate (Thursday) – EMU/Germany Final Services PMI, ECB Lagarde (Friday).
Eminent issues on the back boiler: Continuation of the ECB hiking cycle vs. increasing recession risks. Impact of the war in Ukraine and the persistent energy crunch on the region’s growth prospects and inflation outlook.
EUR/USD levels to watch
So far, the pair is retreating 0.66% at 0.9899 and the breakdown of 0.9888 (weekly low October 31) would target 0.9704 (weekly low October 21) en route to 0.9631 (monthly low October 13). On the upside, there is an initial hurdle at 1.0093 (monthly high October 27) followed by 1.0197 (monthly high September 12) and finally 1.0368 (monthly high August 10).
-
14:31
United States Dallas Fed Manufacturing Business Index below expectations (-15) in October: Actual (-19.4)
-
14:17
USD/CAD: Risk appetite to be challenging for a while longer, weighing on the loonie – HSBC
Central bank pivots create interesting dynamics for FX, explaining the recent decline in USD/CAD. But risk appetite remains the dominant driver of the Canadian dollar, economists at HSBC report.
Central bank pivots create interesting dynamics
“For FX, central bank pivots are at the height of financial market fashion and raise interesting questions. On the one hand, individual shifts towards a less hawkish stance continue to be associated with local currency weakness. But on the other hand, the collective shift towards slower tightening appears to be boosting risk appetite, which conversely favours many of the currencies where central banks have pivoted.”
“In the end, risk appetite remains the dominant driver of the CAD. With the US Federal Reserve and the BoC still in the mood to tighten, the outlook for economic growth and risk appetite is set to be challenging for a while longer, probably weighing on the CAD.”
-
14:08
NZ Labour Market Preview: Forecasts from four major banks, back to work
New Zealand is set to report its employment figures for the third quarter on Tuesday, November 1 at 21:45 GMT and as we get closer to the release time, here are forecasts from economists and researchers at four major banks regarding the upcoming labour market data.
The unemployment rate is expected to fall a tick to 3.2%, driven by an expected 0.5% quarter-on-quarter gain in employment. Private wages including overtime are expected at 1.2% QoQ vs. 1.3% in Q2.
Westpac
“We expect a solid 0.6% rise in employment for the quarter and a small dip in the unemployment rate back to its record low of 3.2%. We also expect a 1% rise in the Labour Cost Index, lifting the annual growth rate to a 14-year high of 3.6%.”
ANZ
“We’ve pencilled in a 0.5% QoQ (0.3% YoY) increase in employment. That translates into unemployment easing 0.2ppts to 3.1%, assuming the participation rate lifts 0.1ppts to 70.9%. Data may not shift the dial for the November MPS (where a 75 bps hike is widely expected). But a stronger-than-expected set of data could firm up expectations for another 75 bps hike in February.”
NAB
“We think Wednesday’s Q3 labour market reports will show the unemployment rate pressing down to a record low 3.1%, lower than the 3.3% the RBNZ predicted in its August MPS. But then the RBNZ also expected a quarterly 1.2% lift in the private-sector LCI, which is north of the 1.0% we expect.”
Citibank
“NZ Q3 Labor Force and Wages: Citi employment change forecast; 0.8%, Previous; 0.0%; Citi unemployment rate forecast; 3.3%, Previous; 3.3%; Citi private sector wages forecast; 1.6%, Previous; 1.3%. Despite the return of jobs, we do not expect the unemployment rate to fall from 3.3%. Even so, with a tight labor market, we expect another strong increase in private-sector wage costs.”
-
13:53
AUD/USD keeps the red below 0.6400 amid stronger USD, focus shifts to RBA on Tuesday
- AUD/USD turns lower for the third successive day amid strong follow-through USD buying.
- Elevated US bond yields and the risk-off mood offer support to the safe-haven greenback.
- The downside seems cushioned as traders now look to the RBA policy meeting on Tuesday.
The AUD/USD pair attracts fresh sellers following an early uptick to the 0.6425-0.6430 region and turns lower for the third successive day on Monday. The pair remains on the defensive through the early North American session and is currently placed near a four-day low, around the 0.6375-0.6370 region.
A combination of supporting factors assists the US dollar to capitalize on last week's late rebound from over a one-month low, which, in turn, is seen exerting downward pressure on the AUD/USD pair. The markets have fully priced in another supersized 75 bps rate hike at the end of a two-day FOMC monetary policy meeting on Wednesday. The expectations remain supportive of elevated US Treasury bond yields, which, along with a softer risk tone, underpins the safe-haven greenback.
The disappointing release of the Chinese Manufacturing PMI further fuels worries about a deeper global economic downturn and takes its toll on the risk sentiment. Furthermore, investors remain concerned about the potential economic headwinds stemming from the resurgence of COVID-19 cases in China. This turns out to be another factor weighing on the growth-sensitive Australian dollar, though the downside remains cushioned ahead of this week's key central bank event risks.
The Reserve Bank of Australia is scheduled to announce its policy decision during the Asian session on Tuesday. Last week's stronger domestic consumer inflation figures all but confirmed another 50 bps rate hike by the RBA and hence, the focus will be on the accompanying policy statement. The focus, however, will remain on the outcome of the highly-anticipated FOMC meeting on Wednesday. This will play a key role in determining the next leg of a directional move for the AUD/USD pair.
Technical levels to watch
-
13:45
United States Chicago Purchasing Managers' Index below expectations (47) in October: Actual (45.2)
-
13:26
USD/IDR now looks consolidative within 15,450-15,640 – UOB
Markets Strategist Quek Ser Leang at UOB Group’s Global Economics & Markets Research expects USD/IDR to keep the 15,450-15,640 range unchanged for the time being.
Key Quotes
“Our expectation for USD/IDR to break 15,750 last week did not materialize as it traded within a relatively narrow range between 15,510 and 15,621. We view the quiet price movement as part of a consolidation phase and we expect USD/IDR to trade between 15,450 and 15,640 this week”.
“Looking ahead, USD/IDR has to break clearly above 15,640 before a sustained rise is likely”.
-
13:11
Gold Price Forecast: XAU/USD to gain traction on a dovish Fed surprise
Gold ended up closing the week in negative territory below $1,650. XAU/USD needs a dovish Fed to ditch bears, FXStreet’s Eren Sengezer reports.
Strong NFP print to help the dollar
“The Fed is widely expected to raise its policy rate by 75 bps to the range of 3.75%-4%. Markets are pricing in a 51.5% probability of the Fed hiking its policy rate by a total of 125 bps by end-2022. The market positioning demonstrates that the dollar has more room on the downside in case investors are convinced that the Fed will opt for a 50 bps hike in December. In that scenario, XAU/USD is likely to gather bullish momentum alongside falling US yields. On the other hand, risk traders are likely to be disappointed in case the US central bank shows no intentions of a policy pivot and seek refuge in the dollar. That would likely be a significant bearish development for gold and open the door for an extended decline.”
“The US Bureau of Labor Statistics will publish the October jobs report on Friday. Investors forecast Nonfarm Payrolls (NFP) to rise by 200K. The market reaction to the past few NFP releases had been straightforward with strong prints helping the dollar outperform its rivals and vice versa. A similar response could be witnessed ahead of the weekend.”
-
13:10
GBP/USD drops to fresh daily low, around 1.1500 mark amid broad-based USD strength
- GBP/USD comes under some selling pressure on Monday amid sustained USD buying.
- Elevated US bond yields and the risk-off impulse lifts demand for the safe-haven buck.
- The downside seems limited ahead of the key central bank event risks later this week.
The GBP/USD pair struggles to find acceptance above the 1.1600 mark on Monday and retreats over 100 pips from the daily peak. Spot prices extend the steady intraday descent through the early North American session and drop to a fresh daily low, around the 1.1500 psychological mark in the last hour.
The US dollar builds on last week's bounce from over a one-month low and gains traction for the third successive day, which, in turn, exerts downward pressure on the GBP/USD pair. In fact, the USD Index, which measures the greenback's performance against a basket of currencies, climbs to a multi-day high and is drawing support from a combination of factors.
The Fed is universally expected to deliver another supersized 75 bps rate hike at the end of a two-day monetary policy meeting on Wednesday, which remains supportive of elevated US Treasury bond yields. This, along with the risk-off impulse - as depicted by a generally weaker tone around the equity markets, provides an additional boost to the safe-haven buck.
That said, growing speculations that the US central bank might soften its hawkish stance - amid signs of a slowdown in the US economy - could act as a headwind for the greenback. Investors might also refrain from placing aggressive bets ahead of this week's key central bank event risks and important US macro data scheduled at the beginning of a new month.
The Fed will announce its policy decision on Wednesday, which should play a key role in influencing the near-term USD price dynamics. This will be followed by the Bank of England meeting on Thursday. Apart from this, the closely-watched US jobs report - popularly known as NFP on Friday, will help determine the next leg of a directional move for the GBP/USD pair.
Technical levels to watch
-
12:38
EUR/USD to test the October 21 low near 0.9705 on a break below 0.9855 – BBH
The euro remains heavy despite higher-than-expected Eurozone Preliminary Inflation data. Economists at BBH expect the EUR/USD pair to challenge the October 21 low around 0.9705 on a move under 0.9855.
Eurozone October CPI came in hot
“A break below 0.9855 is needed to set up a test of the October 21 low near 0.9705.”
“Headline came in at 10.7% YoY vs. 10.3% expected and 9.9% in September, while core came in as expected at 5.0% YoY vs. 4.8% in September. These readings will keep pressure on the ECB to continue tightening aggressively even as the eurozone slips into recession. As a result, ECB tightening expectations remain heightened. The problem is that the eurozone is already tipping into recession even as the ECB tightens aggressively.”
-
12:32
Brazil Nominal Budget Balance came in at -60.618B, above expectations (-71.481B) in August
-
12:32
Brazil Primary Budget Surplus below expectations (11.1B) in August: Actual (10.746B)
-
12:31
Silver Price Analysis: XAG/USD sees vulnerable, sustained weakness below $19.00 awaited
- Silver shows some resilience below the $19.00 mark and reverses the early dip to a multi-day low.
- The technical set-up still favours bearish traders and supports prospects for further near-term fall.
- A sustained strength beyond the $20.00 psychological mark is needed to negate the negative bias.
Silver reverses an intraday dip to sub-$19.00 levels, or a multi-day low and climbs to the top end of its daily trading range heading into the North American session. The XAG/USD pair is currently hovering around the $19.15-$19.20 region, still down over 0.20% for the day.
From a technical perspective, any subsequent move-up is likely to face resistance near the $19.30-$19.40 confluence support breakpoint. The said area comprises the 38.2% Fibonacci retracement level of the sharp downfall from the monthly peak and the 100-hour SMA, which should now act as a pivotal point for intraday traders.
A sustained strength beyond might trigger a short-covering move and allow the XAG/USD to reclaim the $20.00 psychological mark. The positive momentum could get extended towards an intermediate hurdle near the $20.50 area, above which bulls could target the $21.00 mark en route to the monthly peak, around the $21.25 region.
On the flip side, the $18.95-$18.90 zone coincides with the 23.6% Fibo. level. A convincing break below will be seen as a fresh trigger for bearish traders and expose the $18.00 mark, with some intermediate support near the $18.30-$18.25 region. The XAG/USD could eventually drop further to challenge the YTD low, around the $17.55 area.
Silver 1-hour chart
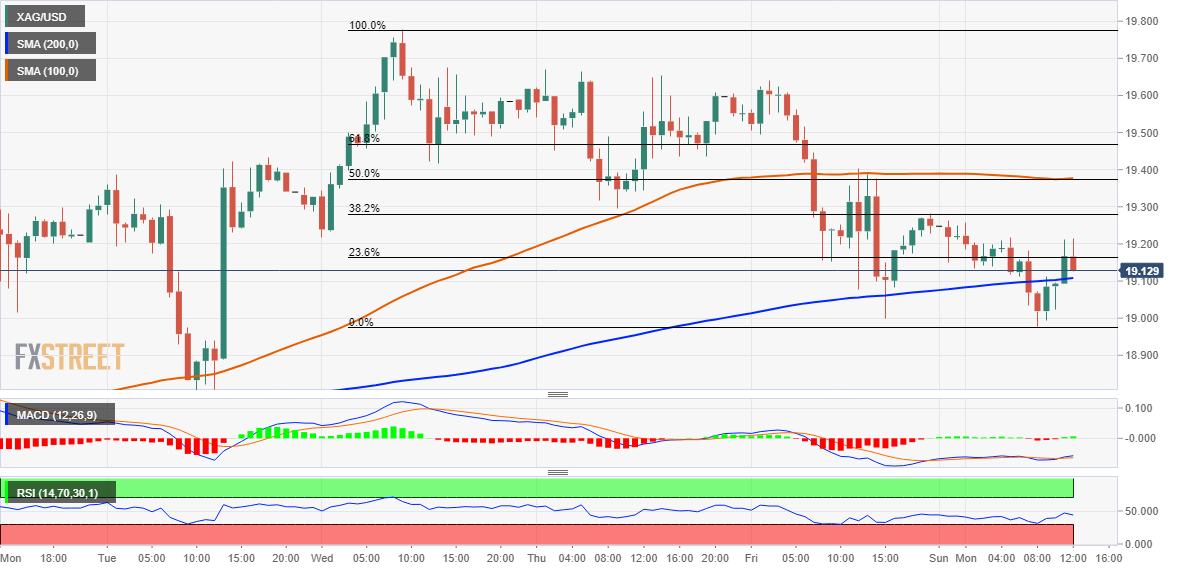
Key levels to watch
-
12:23
ECB to deliver another 75 bps hike in December as inflation refuses to peak – Commerzbank
Euroarea inflation increased again in October to 10.7% year-on-year. This also increases the pressure on the European Central Bank (ECB) to further raise key rates sharply, in the view of economists at Commerzbank.
Inflation rate rises and rises
“The inflation rate in the euro area rose further in October to 10.7%, which was significantly higher than expected. Prices are rising more strongly across the board. The inflation rate excluding the volatile prices of energy, food, alcohol and tobacco rose by 0.2 points to 5.0%.”
“Today's data increase the likelihood that the ECB will raise its key interest rates again by 75 basis points in December, especially as the euro economy still grew by 0.2% in the third quarter compared with the second quarter.”
-
12:12
EUR/USD Price Analysis: Further gains on the cards above 0.9900
- EUR/USD extends the decline to the vicinity of 0.9900.
- The multi-month support line near 0.9900 holds the downside.
EUR/USD comes under further pressure and trades closer to the 0.9900 neighbourhood on Monday.
The 0.9900 region, where the 8-month support line and the 55-day SMA converge, emerges as a quite decent contention zone for the time being. While above this region, the pair could attempt another visit to the October top near 1.0100 (October 27).
In the longer run, the pair’s bearish view should remain unaltered while below the 200-day SMA at 1.0495.
EUR/USD daily chart
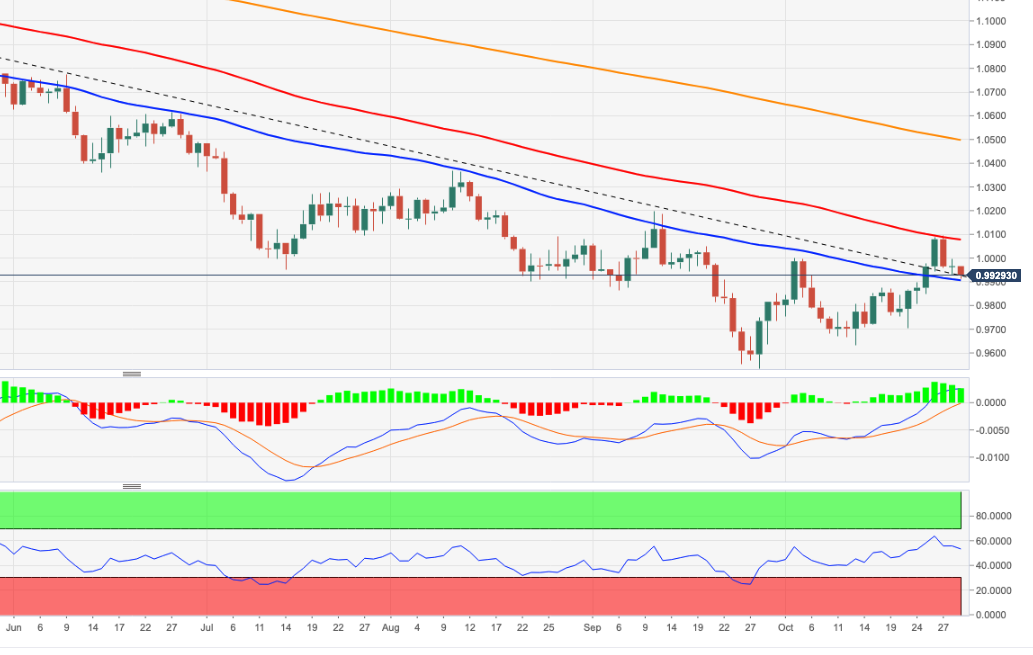
-
12:04
USD/JPY: Break above 149.35 to set up a test of the October 21 high near 15 – BBH
USD/JPY gained more than 100 pips on Friday after the Bank of Japan delivered another dovish hold. Economists at BBH expect the pair to target 152 on a break past 149.35.
Data suggest the BoJ cannot maintain a heavy pace of intervention
“A break above 149.35 would set up a test of the USD/JPY high near 152 from October 21.”
“Reports suggest the BoJ recently spent JPY6.35 trln supporting the yen. In total, these interventions represent nearly 6% of its total foreign reserves and so it’s clear that this pace cannot be sustained on a regular basis. Rather, we think the BoJ will continue to intervene sporadically and quietly to try and keep the markets guessing.”
“With the BoJ delivering another dovish hold last Friday, we think USD/JPY remains a buy at current levels.”
-
12:03
USD Index Price Analysis: Rising bets for a test of 114.00 near term
- DXY extends the upside momentum north of 111.00.
- Further rebound remains focused on the 114.00 region and above.
DXY climbs to fresh 4-session highs near 111.30 at the beginning of the week.
The index seems to have met a decent support near 109.50 (October 27). The continuation of the rebound could then target the area of monthly peaks around 114.00.
The near-term upside bias is expected to hold while above the 8-month support line near 108.50. The proximity of the 100-day SMA also reinforces this area of contention.
In the longer run, DXY is expected to maintain its constructive stance while above the 200-day SMA at 104.15.
DXY daily chart
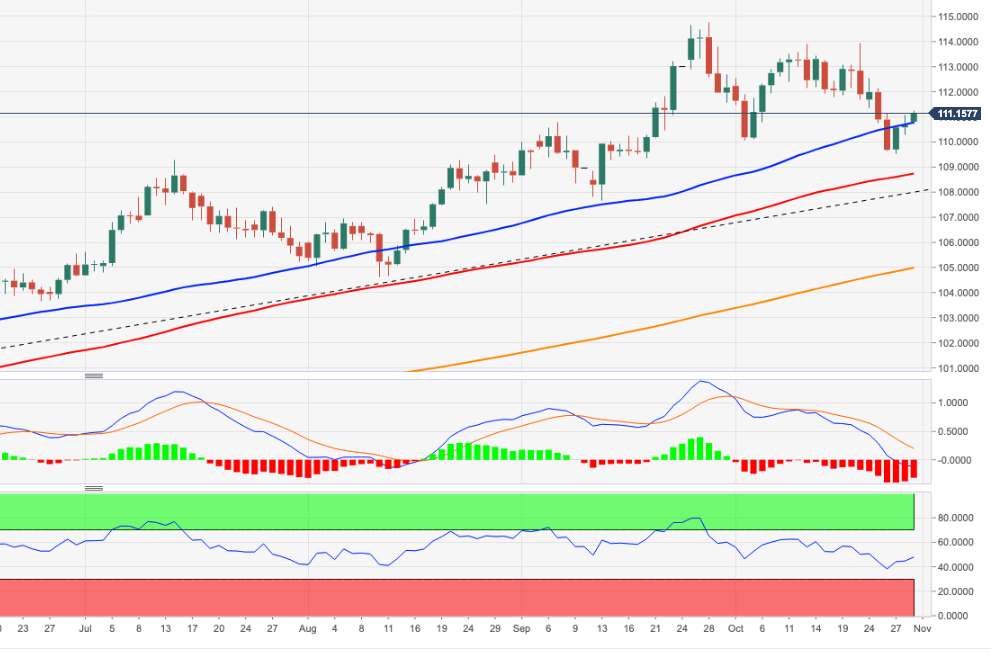
-
12:01
South Africa Trade Balance (in Rands) above expectations (5.3B) in September: Actual (19.7B)
-
12:00
India Infrastructure Output (YoY) above expectations (7.6%) in September: Actual (7.9%)
-
11:54
USD/MYR now predicted to trade within 4.6950-4.7400 – UOB
Further side-lined trading in USD/MYR is probable in the near term, likely between 4.6950 and 4.7400 according to Markets Strategist Quek Ser Leang at UOB Group’s Global Economics & Markets Research.
Key Quotes
“USD/MYR snapped its 8-week winning streak as it closed lower by 0.34% last Friday. The price action is likely the early stages of a consolidation phase”.
“In other words, USD/MYR is likely to trade sideways this week, expected to be within a range of 4.6950/4.7400”.
-
11:50
EUR/JPY Price Analysis: Further gains remain on the table near term
- EUR/JPY adds to Friday’s advance and flirts with multi-session highs.
- Next on the upside aligns the 2022 peak at 148.40.
EUR/JPY extends the rebound and climbs to the 147.70 region at the beginning of the week.
Considering the current price action, there is still chances for the cross to advance further in the short-term horizon. That said, the immediate up barrier now emerges at the 2022 high at 148.40 (October 21) ahead of the December 2014 top at 149.78 (December 8).
In the short term the upside momentum is expected to persist while above the October lows near 141.00.
In the longer run, while above the key 200-day SMA at 137.36, the constructive outlook is expected to remain unchanged.
EUR/JPY daily chart
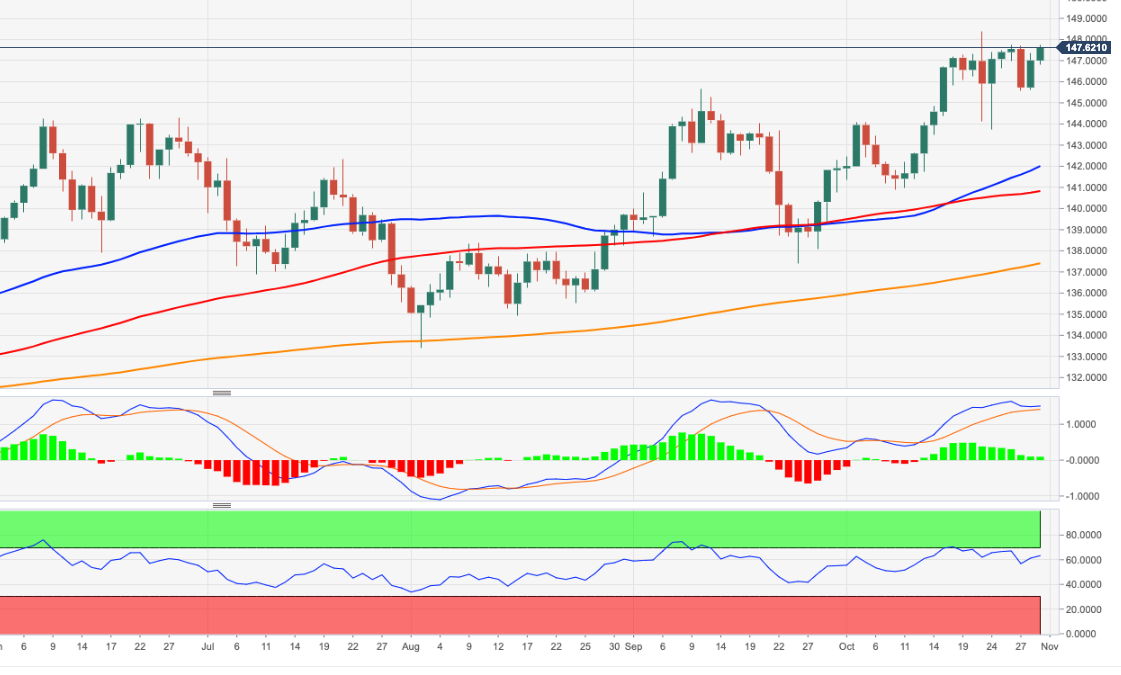
-
11:45
USD/THB points to further consolidation – UOB
Markets Strategist Quek Ser Leang at UOB Group’s Global Economics & Markets Research notes USD/THB faces extra consolidation in the short term.
Key Quotes
“We expected USD/THB to ‘trade sideways between 37.90 and 38.46’ last week. However, USD/THB edged to a low of 37.64 before rebounding. Despite the decline, downward momentum has not improved by much and USD/THB is unlikely to weaken much further.”
“We continue to expect USD/THB to trade sideways this week, albeit likely within a lower range of 37.55/38.30”.
-
11:19
USD Index: A return above 114 appears a big ask if the Fed signals tightening may slow in December – SocGen
The US Dollar Index is strengthening to over 111 as FOMC week gets underway. The focus for the Fed is on guidance for December. A signal to slow tightening next month could avoid a push above the 114 level, economists at Société Générale report.
Losses for the DXY should be contained
“Though expectations for the terminal rate moved up over the past month to 5% next spring, this has not translated into new highs for the dollar. The question then may come down to whether the US labour market, unlike housing, continues to withstand the dual pressure from inflation (profit margins) and the rising cost of borrowing. A weakening in US employment, ISM and payrolls are also due this week, could arguably have a bigger impact on where the dollar but also bond yields are headed in early November.”
“A return to the highs above 114 appears a big ask if the Fed signals tightening may slow in December.”
“Profit taking in USD/G10 since 21 October has been led primarily by the rebound in GBP (2.6%) but gains have been trivial in comparison for other currencies that make up a larger share of the DXY like the euro (+0.6%). In other words, barring a big advance in the single currency, in yen or sterling which to us all look unlikely, losses for the DXY should be contained.”
-
10:47
EUR/NOK set to trade as high as 10.75 – Nordea
The Norwegian krone strengthened last week in tandem with the pullback of the USD and risk-on in financial markets. Still, economists at Nordea see EUR/NOK trading as high as 10.75 until year-end.
More pain to come
“Historically speaking, the period towards year-end, remains a difficult period for the NOK seasonality-wise. We don’t think this year will be an expectation given the macroeconomic backdrop and see EUR/NOK trading as high as 10.75.”
“USD/NOK could rise to 11.50 if/when EUR/USD takes a turn to 0.95 again.”
-
10:38
EUR/GBP rebounds from multi-week low, retakes 0.8600 mark on stronger Eurozone CPI
- EUR/GBP gains some positive traction on Monday and snaps a four-day losing streak.
- Stronger Eurozone inflation data provide a modest lift to the euro and offer support.
- A combination of factors seems to underpin sterling and might cap gains for the cross.
The EUR/GBP cross attracts some buying near the 0.8575-0.8570 region on Monday and snaps a four-day losing streak to its lowest level since early September. The intraday uptick picks up pace following the release of stronger Eurozone consumer inflation figures and lifts spot prices back above the 0.8600 mark during the first half of the European session.
The latest data published by Eurostat showed that the annualized Eurozone Harmonised Index of Consumer Prices (HICP) accelerate to 10.7% in October from 9.9% in the previous month. Adding to this, the core figures climbed to 5.0% YoY during the reported month as compared to the 4.9% expected and 4.8% recorded in September. Separately, the first reading of the Eurozone GDP print showed that the economy expanded by 0.2% during the third quarter, matching consensus estimates. This, in turn, is seen as a key factor behind the shared currency's relative outperformance against its British counterpart and offering some support to the EUR/GBP cross.
That said, a more dovish tone adopted by the European Central Bank last week - in the wake of the worsening economic outlook - continues to act as a headwind for the euro. The British pound, on the other hand, draws support from the latest optimism over the appointment of Rishi Sunak as the new UK Prime Minister. Market players see Sunak as someone who can bring stability back after the recent volatility in the markets. Adding to this, International Monetary Fund (IMF) Managing Director Kristalina Georgieva told Reuters that she expects the new UK PM Sunak to steer Britain towards a path of medium-term fiscal sustainability.
Apart from this, expectations for a 75 bps hike by the Bank of England warrant some caution for aggressive bullish traders and positioning for a further appreciating move for the EUR/GBP cross. Hence, any subsequent strength is more likely to confront stiff resistance and remain capped near the mid-0.8600s, which should act as a pivotal point for intraday traders. Some follow-through buying should push spot prices back above the 0.8700 mark and allow bulls to aim back to retest the 0.8750-0.8760 supply zone.
Technical levels to watch
-
10:18
EUR/USD to retest 0.95 on a close back under 0.9910/00 this week – ING
EUR/USD is trading below parity. Economists at ING expect the world’s most popular currency pair to retest 0.95 on a break under 0.9910/00 this week.
The eurozone and the euro will continue to struggle
“With global growth under pressure from tighter rates and a misfiring Chinese economy, we think the eurozone and the euro will continue to struggle. That is why last Thursday's high of 1.0089 in EUR/USD could have been significant.”
“A close back under the 0.9900/9910 area this week would support our preferred view of EUR/USD retesting the lows near 0.95.”
-
10:04
USD/JPY steadily climbs back to mid-148.00s, multi-day high amid sustained USD buying
- USD/JPY gains traction for the second successive day amid sustained USD buying.
- The Fed-BoJ policy divergence continues to undermine the JPY and offers support.
- The uptick lacks bullish conviction as the focus remains on the key FOMC meeting.
The USD/JPY pair edges higher for the second straight day on Monday and looks to build on its recovery from the 145.00 psychological mark, or a nearly three-week low touched last Thursday. The pair stick to its modest gains through the first half of the European session and is currently placed near a multi-day high, just below mid-148.00s.
The Japanese yen continues to be undermined by the fact that the Bank of Japan held interest rates at record lows on Friday and reiterated that it will continue to guide the 10-year bond yield at 0%. The central bank reaffirmed the need for accommodative policy amid economic headwinds stemming from the resurgence of COVID-19 cases in China and global recession fears. This, along with some follow-through US dollar buying interest continues to lend support to the USD/JPY pair.
In fact, the USD Index, which measures the greenback's performance against a basket of currencies, extends last week's bounce from over a one-month low amid rising US Treasury bond yields. The prospects for another supersized 75 bps Fed rate hike move in November turn out to be a key factor pushing the US bond yields higher and lending some support to the greenback. The USD bulls, however, seem reluctant to place aggressive bets ahead of this week's key central bank event risk.
The Fed is scheduled to announce its monetary policy decision on Wednesday and investors will look for fresh clues about the future rate-hike path. Hence, the focus will remain on the accompanying policy statement and the post-meeting press conference. This will influence the USD price dynamics and help determine the next leg of a directional move for the USD/JPY pair. In the meantime, elevated US bond yields should act as a tailwind for the USD amid absent relevant economic data.
Technical levels to watch
-
10:02
Eurozone Preliminary GDP expands 0.2% QoQ in Q3 vs. 0.2% expected
The Eurozone economy expanded by 0.2% on the quarter in the three months to September of 2022, meeting the 0.2% expected and 0.8% previous, the preliminary release showed on Monday.
On an annualized basis, the bloc’s GDP rate increased by 2.1% in Q3 vs. 4.1% booked in the second quarter of 2021 while matching 2.1% expectations.
Also read: Eurozone Preliminary Inflation soars 10.7% YoY in October vs. 9.8% expected
Market reaction
EUR/USD was last seen trading at 0.9939, down 0.25% on the day. The euro failed to capitalize on the red-hot Eurozone inflation data and in line with expectations GDP data, as the focus remains on the Fed meeting this week.
About Eurozone Preliminary GDP
The Gross Domestic Product released by Eurostat is a measure of the total value of all goods and services produced by the Eurozone. The GDP is considered as a broad measure of the Eurozone's economic activity and health. Usually, a rising trend has a positive effect on the EUR, while a falling trend is seen as negative (or bearish).
-
10:01
Greece Retail Sales (YoY) climbed from previous 1.7% to 4.4% in August
-
10:01
European Monetary Union HICP-X F,E,A,T (MoM) came in at 0.6%, below expectations (1.2%) in October
-
10:01
Breaking: Eurozone Preliminary Inflation soars 10.7% YoY in October vs. 9.8% expected
The annualized Eurozone Harmonised Index of Consumer Prices (HICP) jumped by 10.7% in October vs. September’s 9.9%, the latest data published by Eurostat showed on Monday. The market forecast was for a 9.8% print.
The core figures climbed to 5.0% YoY in October when compared to 4.9% expectations and 4.8% recorded in September.
On a monthly basis, the old continent’s HICP accelerated to 1.5% in October vs. 0.6% expectations and 1.2% previous. The core HICP rose 0.6% this month against 1.2% expected and 1.0% seen in July.
The Euro area figures are reported a trading day after Germany’s annual inflation for October, which surged 11.6% and beat estimates following a 10.9% growth reported in September.
The bloc’s HICP figures hold significance, as it helps investors assess the European Central Bank’s (ECB) monetary policy normalization course. The ECB inflation target is 2%.
Key details (via Eurostat)
“Looking at the main components of euro area inflation, energy is expected to have the highest annual rate in October (41.9%, compared with 40.7% in September), followed by food, alcohol & tobacco (13.1%, compared with 11.8% in September), non-energy industrial goods (6.0%, compared with 5.5% in September) and services (4.4%, compared with 4.3% in September).”
EUR/USD reaction
The shared currency is unfazed by the mixed Eurozone inflation data, as EUR/USD is keeping the red near 0.9940, down 0.25% on the day.
-
10:01
European Monetary Union HICP (MoM) came in at 1.5%, above forecasts (0.6%) in October
-
10:01
European Monetary Union Gross Domestic Product s.a. (QoQ) meets forecasts (0.2%) in 3Q
-
10:01
European Monetary Union Gross Domestic Product s.a. (YoY) in line with expectations (2.1%) in 3Q
-
10:00
European Monetary Union HICP-X F,E,A,T (YoY) came in at 5%, above forecasts (4.9%) in October
-
10:00
European Monetary Union HICP (YoY) registered at 10.7% above expectations (10.2%) in October
-
10:00
USD/CNY: Yuan to remain under pressure as PMIs continue to point to economic weakness – Commerzbank
USD/CNY gained nearly 220 pips last week to above 7.26 despite the softer greenback. The yuan is set to remain under pressure after softer China PMI, economists at Commerzbank report.
Downside surprise to PMIs
“The official manufacturing PMI fell to 49.2 in October (Bloomberg consensus: 49.8) vs 50.1 in September. The official non-manufacturing PMI, which includes services and construction, also fell sharply to 48.7 in October, much weaker than consensus expectations of 50.1 and vs 50.6 in September.”
“Private sector activity, especially in services, will remain under pressure in the near term as the zero-Covid policy and property slump persist. Fiscal stimulus through infrastructure investment and robust activity in the government-supported strategic industries such as electric vehicle and high-end equipment manufacturing will offset growth weakness to some extent.”
“CNY could remain under pressure as the PMIs continue to point to economic weakness.”
-
09:54
USD/CNH seen within the 7.2200-7.3500 range – UOB
USD/CNH should face extra range bound trading in the short-term horizon, likely between 7.2200 and 7.3500, comment Markets Strategist Quek Ser Leang and Economist Lee Sue Ann at UOB Group.
Key Quotes
24-hour view: “Our expectation for USD to ‘consolidate and trade within a range’ last Friday was incorrect as it rose to a high of 7.2840. USD traded on a firm note in early Asian trade today and could edge higher. However, upward momentum is not strong and any advance is unlikely to break 7.3100 (there is another resistance at 7.2980) Support is at 7.2720, followed by 7.2620.”
Next 1-3 weeks: “In our latest narrative from last Thursday (27 Oct, spot at 7.1870), we indicated that the pullback in USD has room to extend to 7.1500, possibly 7.1300. USD then dropped to 7.1662 before rebounding strongly. The build-up in downward pressure faded quickly and USD is unlikely to pullback further. From here, USD could trade between 7.2200 and 7.3500 for a while.”
-
09:32
Portugal Gross Domestic Product (YoY): 4.9% (3Q) vs previous 7.1%
-
09:32
United Kingdom M4 Money Supply (YoY) rose from previous 3.8% to 5.4% in September
-
09:31
US Dollar Index to retest the highs later this year – ING
The US Dollar Index builds on Friday's gains and holds in positive territory near 1110.00. Economists at ING expect DXY to retest the highs later this year.
Break of 111.00/10 could open up a move to the 111.80 area
“It looks as though the dollar's month-long, 4.5% correction could have ended last Thursday and events this week could prove a catalyst to send the dollar back towards the highs”
“Our base case does see the dollar retesting the highs later this year.”
“A break of 111.00/10 in DXY today could open up a move to the 111.80 area.”
-
09:31
United Kingdom Net Lending to Individuals (MoM) fell from previous £7.2B to £6.8B in September
-
09:30
Portugal Gross Domestic Product (QoQ) up to 0.4% in 3Q from previous 0%
-
09:30
United Kingdom Consumer Credit registered at £0.745B, below expectations (£0.978B) in September
-
09:30
United Kingdom M4 Money Supply (MoM) came in at 2.1%, above forecasts (0.1%) in September
-
09:30
United Kingdom Mortgage Approvals below expectations (67K) in September: Actual (66.789K)
-
09:25
EUR/USD extends the weakness and approaches 0.9900 ahead of EMU CPI
- EUR/USD sheds further ground and trades close to 0.9900.
- Germany Retail Sales contracted less than expected in September.
- Flash EMU Q3 GDP, CPI next of relevance in the domestic docket.
Sellers remain in control of the sentiment surrounding the European currency and force EUR/USD to slip back to the vicinity of the 0.9900 neighbourhood at the beginning of the week.
EUR/USD looks to data, dollar dynamic
EUR/USD adds to the rejection from last week’s tops near 1.0100 and trades at shouting distance from the key support at 0.9900 on Monday, always on the back of the continuation of the robust bounce in the dollar.
Indeed, investors keep favouring the greenback in the current context of weakness in the risk-associated universe and in light of the upcoming FOMC gathering due on Wednesday. On the latter, the Federal Reserve is widely expected to raise the Fed Funds Target Range (FFTR) by 75 bps to 3.75%-4.00%.
Earlier in the domestic calendar Retail Sales in Germany expanded at a monthly 0.9% and contracted 0.9% in the year to September. Later, the focus of attention will be on the release of advanced Q3 GDP Growth Rate in the broader Euroland as well as preliminary inflation figures for te month of October.
What to look for around EUR
EUR/USD extends the leg lower and threatens to revisit the 0.9900 neighbourhood against the backdrop of persistence dollar strength.
In the meantime, price action around the European currency is expected to closely follow dollar dynamics, geopolitical concerns and the Fed-ECB divergence. The resurgence of speculation around a potential Fed’s pivot seems to have removed some strength from the latter, however.
Furthermore, the increasing speculation of a potential recession in the region - which looks propped up by dwindling sentiment gauges as well as an incipient slowdown in some fundamentals – adds to the fragile sentiment around the euro in the longer run.
Key events in the euro area this week: Germany Retail Sales, EMU Flash Q3 GDP Growth Rate, Inflation Rate (Monday) – Germany Balance of Trade, Unemployment Change, Unemployment Rate, Final Manufacturing PMI, EMU Final Manufacturing PMI (Wednesday) – EMU Unemployment Rate (Thursday) – EMU/Germany Final Services PMI, ECB Lagarde (Friday).
Eminent issues on the back boiler: Continuation of the ECB hiking cycle vs. increasing recession risks. Impact of the war in Ukraine and the persistent energy crunch on the region’s growth prospects and inflation outlook.
EUR/USD levels to watch
So far, the pair is retreating 0.36% at 0.9930 and the breakdown of 0.9905 (55-day SMA) would target 0.9704 (weekly low October 21) en route to 0.9631 (monthly low October 13). On the upside, there is an initial hurdle at 1.0093 (monthly high October 27) followed by 1.0197 (monthly high September 12) and finally 1.0368 (monthly high August 10).
-
09:17
Gold Price Forecast: XAU/USD slides to $1,635 area, over one-week low amid stronger USD
- Gold drops to over a one-week low on Monday amid some follow-through USD buying interest.
- A fresh leg up in the US Treasury bond yields continues to offer some support to the greenback.
- The risk-off impulse could come in and support the safe-haven XAU/USD ahead of the FOMC.
Gold edges lower for the third successive day on Monday and drops to over a one-week low, around the $1,635 region during the first half of the European session. The US dollar builds on last week's late rebound from over a one-month low and turns out to be a key factor exerting downward pressure on the dollar-denominated commodity. The downside, however, seems limited as traders might prefer to move to the sidelines ahead of the highly anticipated FOMC monetary policy meeting this week.
The Fed is scheduled to announce its decision on Wednesday and is widely expected to deliver another supersized 75 bps rate hike. That said, signs of a slowdown in the US economy might force the Fed to soften its hawkish stance. Hence, the focus will be on the accompanying policy statement and the post-meeting press conference. Investors will look for clues about the Fed's future rate hike path, which will influence the near-term USD price dynamics and provide a fresh directional impetus to the non-yielding gold.
In the meantime, a fresh leg up in the US Treasury bond yields should act as a tailwind for the buck and weigh on the XAU/USD. However, the risk-off impulse could lend some support to the safe-haven gold, at least for the time being. Weaker-than-expected Chinese business activity data released earlier this Monday revives fears about a deeper global economic downturn and tempers investors' appetite for riskier assets. This is evident from a weaker tone around the equity markets and warrants caution for bearish traders.
Nevertheless, the fundamental backdrop suggests that the path of least resistance for gold is to the downside and any attempted recovery move could be seen as a selling opportunity. In the absence of any major market-moving economic releases, the USD remains at the mercy of the US bond yields. This, along with the broader market risk sentiment, could allow traders to grab short-term opportunities around the XAU/USD.
Technical levels to watch
-
09:17
UK will see deeper recession than previously forecast – Goldman Sachs
Goldman Sachs’ Chief European Economist Sven Jari Stehn wrote in his latest research note that the UK economic recession is likely to be deeper than previously forecast.
Key quotes
“The country is likely to have a four-quarter cumulative fall in the gross domestic product (GDP) of 1.6%.”
“The profound economic challenge the UK is facing is effectively the combination of the cost-of-living crisis, high inflation, a recession setting in and then navigating the fallout from this fiscal U-turn for the public finances.”
“Cumulatively, we expect real GDP to decline by about [1.5%]… that’s relatively small compared certainly to COVID-19 or the financial crisis, and a bit more like shallow recessions.”
“The reason for that is that there is still fiscal support via the energy price cap and household have excess savings that they’re setting on, and that they can use to offset some of the shock.”
“The risk is still towards a sharper downturn.”
“While the energy markets may have stabilized, there is still a risk that gas supply will run out and that rationing might happen during winter, although that risk is lower in the UK than in the Euro area.”
-
09:14
USD/JPY sticks to the consolidative theme near term – UOB
In the opinion of Markets Strategist Quek Ser Leang and Economist Lee Sue Ann at UOB Group, USD/JPY is expected to navigate within the 145.50-149.60 range in the next weeks.
Key Quotes
24-hour view: “The strong rise in USD to a high of 147.87 last Friday came as a surprise (we were expecting sideway-trading). USD extended its advance in early Asian trade and is likely to rise further. However, a break of the strong resistance at 148.80 is unlikely (minor resistance is at 148.40). On the downside, a breach of 147.35 (minor support is at 147.70) would indicate that the current upward pressure has dissipated.”
Next 1-3 weeks: “Our latest narrative was from last Thursday (27 Oct, spot at 146.05) where downward momentum is building tentatively and that USD could edge lower. USD subsequently dipped to 145.10 before rebounding strongly and the build-up in downward momentum faded quickly. USD appears to have moved into a consolidation phase and is likely to trade between 145.50 and 149.60 for the time being.”
-
09:09
FX option expiries for Oct 31 NY cut
FX option expiries for Oct 31 NY cut at 10:00 Eastern Time, via DTCC, can be found below.
- EUR/USD: EUR amounts
- 0.9750 892m
- 0.9895-00 621m
- 0.9945-50 257m
- 0.9995-00 2.83b
- GBP/USD: GBP amounts
- 1.1650 392m
- 1.1680 205m
- USD/JPY: USD amounts
- 148.00 470m
- AUD/USD: AUD amounts
- 0.6470 355m
- USD/CAD: USD amounts
- 1.3525 311m
- 1.3600 390m
- 1.3625 317m
- 1.3690 250m
- EUR/CHF: EUR amounts
- 0.9650 518m
-
09:04
Gold Price Forecast: XAU/USD to head lower as Fed set to signal a continued tightening bias – TDS
Money managers aggressively covered their short gold exposure, as talk of a Fed pivot drove rates and the greenback lower. Nevertheless, economists at TD Securities expect the yellow metal to edge lower as the Fed is set to move aggressively this week.
Fed is unlikely to pivot to a dovish direction
“Despite the price moving higher and markets musing about inflation turning lower in the not too distant future and hoping the US central bank would sharply reduce the pace of tightening, long exposure did not increase one bit. This suggests to us that while traders don’t see rates accelerating much beyond what is currently priced, at the same time they don’t see a dovish tilt anytime soon.”
“Gold prices are likely to head lower. The Fed will move aggressively on Wednesday and most likely will signal a continued tightening bias. Unless there is some sort of concern over financial stability, the US central bank is unlikely to pivot to a dovish direction. This implies that prices and length should decrease, once family offices and other specs cut exposure in response to rising front-end rates.”
-
09:01
Italy Gross Domestic Product (QoQ) above forecasts (0%) in 3Q: Actual (0.5%)
-
09:01
Italy Gross Domestic Product (YoY) registered at 2.6% above expectations (2%) in 3Q
-
09:00
Spain Current Account Balance dipped from previous €1.34B to €-0.11B in August
-
08:58
USD Index adds to the recent upside above 111.00
- The index advances further north of 111.00 and clinches fresh tops.
- US yields add to Friday’s rebound and bolster the upside in the dollar.
- Investors’ attention will be on the FOMC event due on November 2.
The greenback, in terms of the USD Index (DXY), remains bid and reclaims the area beyond 111.00 the figure at the beginning of the week.
USD Index focuses on Fed
The index advances for the third session in a row on Monday and looks to consolidate the breakout of the key 111.00 barrier on the back of further weakness in the risk complex and another so far positive session in US yields across the curve.
On the latter, yields add to Friday’s upbeat tone and extend the recovery, setting aside at the same time part of last week’s weakness.
Nothing scheduled data wise in the US calendar at the beginning of the week, although the dollar is expected to grab the driver’s seat later in the week in light of the FOMC event on November 2, where consensus among investors anticipate the Committee hiking rates by another 75 bps.
What to look for around USD
The dollar extends the rebound and adds to the rebound seen in the second half of last week above the key 111.00 mark.
In the meantime, the firmer conviction of the Federal Reserve to keep hiking rates until inflation looks well under control regardless of a likely slowdown in the economic activity and some loss of momentum in the labour market continues to prop up the underlying positive tone in the index.
Looking at the more macro scenario, the greenback also appears bolstered by the Fed’s divergence vs. most of its G10 peers in combination with bouts of geopolitical effervescence and occasional re-emergence of risk aversion.
Key events in the US this week: Final Manufacturing PMI, Construction Spending, ISM Manufacturing (Tuesday) – MBA Mortgage Applications, ADP Employment Change, FOMC Interest Rate Decision, Chief Powell press conference (Wednesday) – Balance of Trade, Initial Jobless Claims, Final Services PMI, ISM Non-Manufacturing (Thursday) – Nonfarm Payrolls, Unemployment Rate (Friday).
Eminent issues on the back boiler: Hard/soft/softish? landing of the US economy. Prospects for further rate hikes by the Federal Reserve vs. speculation of a recession in the next months. Geopolitical effervescence vs. Russia and China. US-China persistent trade conflict.
USD Index relevant levelsNow, the index is gaining 0.48% at 111.19 and faces the immediate up barrier at 113.88 (monthly high October 13) seconded by 114.76 (2022 high September 28) and then 115.32 (May 2002 high). On the flip side, the breakdown of 109.53 (monthly low October 27) would open the door to 109.35 (weekly low September 20) and finally 107.68 (monthly low September 13).
-
08:54
ONS: UK energy price caps will help to reduce inflation
The UK’s Office for National Statistics (ONS) said on Monday, it expects the country’s energy price cap for consumers and government-funded discounts on bills for businesses to bring down official measures of inflation, per Reuters.
Key takeaways
“The Energy Price Guarantee (EPG) for households, and the Energy Bill Relief Scheme for businesses, would lower the unit prices of energy that feed into inflation indexes.”
“The consumer prices index "will hence be lower while the schemes are in operation than if the EPG had not been introduced.”
“Similarly, the energy bill scheme for businesses would help to lower the input measure of the producer prices index.”
Market reaction
The pound receives little support from the ONS report, as GBP/USD is drowning by 0.50% so far, breaching 1.1550, at the press time.
-
08:37
IFO: Fewer German companies feel threatened than during pandemic
A survey conducted by Germany’s highly-influential economic institute, IFO, showed on Monday, “far fewer German businesses feel their survival is at risk now than at the height of the COVID-19 pandemic.”
“7.5% felt their economic survival is threatened,” the survey findings revealed.
Klaus Wohlrabe, head of surveys at IFO, said that “At the height of the pandemic, these numbers were much higher, at 21.8 percent. In the face of a sharp economic slowdown, companies are proving to be very robust.”
“The current rate of inflation is a major concern for retailers,” Wohlrabe added.
Market reaction
The above findings have little to no impact on the EUR market, as EUR/USD sheds 0.41% on the day to trade at 0.9920, as of writing.
-
08:35
AUD/USD: Upside pressure seen fading on a breach of 0.6370 – UOB
Further strength in AUD/USD is ruled out on a break below the 0.6370 level, according to Markets Strategist Quek Ser Leang and Economist Lee Sue Ann at UOB Group.
Key Quotes
24-hour view: “Last Friday, we expected AUD to ‘range-trade between 0.6405 and 0.6505’. However, AUD dipped to a low of 0.6389. Downward momentum has improved a tad and AUD is likely to edge lower today but a clear break of 0.6370 is unlikely. Resistance is at 0.6430 but only a break of 0.6460 would indicate that the current mild downward pressure has subsided.”
Next 1-3 weeks: “We turned positive in AUD early last week. As AUD rose, in our latest narrative from last Thursday (27 Oct, spot at 0.6480), we indicated that overbought short-term conditions could lead to 1 to 2 days of consolidation first but AUD is likely to strengthen to 0.6555 later on. However, AUD has been edging lower the last couple of days and upward momentum is beginning to fade. From here, a break of 0.6370 (no change in ‘strong support’ level from last Friday) would indicate that AUD is unlikely to strengthen further to 0.6555.”
-
08:33
Countries that have large exports to China to suffer significantly – Natixis
Analysts at Natixis seek to identify the countries that will suffer significantly from China’s stagnant domestic demand. These are countries that have large exports to China.
Which countries will suffer from stagnant domestic demand in China?
“It is important to understand that China will no longer be the driving force of the global economy, given the demographic slowdown and excess savings due to the inadequate pension system.”
“The countries that will suffer the most are those whose growth has been driven by exports to China, in particular Latin America, Germany, OPEC countries, Africa, Russia, and most Asian countries.”
-
08:31
AUD/USD flirts with daily low, just below 0.6400 mark amid broad-based USD strength
- AUD/USD struggles to gain traction and is pressured by a combination of factors.
- A softer risk tone undermines the risk-sensitive aussie amid modest USD strength.
- The downside seems limited ahead of RBA on Tuesday and FOMC on Wednesday.
The AUD/USD pair surrenders its modest intraday gains and slides to the lower end of its daily trading range, around the 0.6400 round-figure mark during the first half of the European session. The downside, however, remains cushioned as traders seem reluctant ahead of this week's key central bank event risks.
The Reserve Bank of Australia is scheduled to announce its policy decision on Tuesday and is expected to hike interest rates by 50 bps for the fourth successive time in as many meetings. The bets were lifted by last week's stronger-than-expected domestic consumer inflation figures, which continue to act as a tailwind for the Australian dollar and lend support to the AUD/USD pair.
That said, worries about economic headwinds stemming from the recent resurgence in COVID-19 cases in China keep a lid on any meaningful gains for the Australian dollar. The fears were further fueled by Monday's disappointing release of Chinese business activity data, which tempers investors’ appetite for riskier assets and contributes to capping the upside for the risk-sensitive aussie.
The US dollar, on the other hand, gains traction for the third successive day and is looking to build on last week's recovery move from over a one-month low. Against the backdrop of a softer risk tone, elevated US Treasury bond yields, provide a modest lift to the safe-haven greenback. This is seen as another factor acting as a headwind for the AUD/USD pair, at least for the time being.
Hence, the focus will remain glued to the outcome of a two-day FOMC monetary policy meeting, scheduled to be announced on Wednesday. The Fed is universally expected to raise its benchmark interest rates by 75 bps rate hike move. Hence, investors will look for cues about the future rate-hike path, which will influence the USD and provide a fresh directional impetus to the AUD/USD pair.
Technical levels to watch
-
08:12
USD/BRL: Real is likely to react very cautiously to Lula’s victory – Commerzbank
In the end, former President Lula only gained a slim majority over incumbent Bolsonaro. The Brazilian real has stood up surprisingly well compared with other Emerging Market currencies this year but economists at Commerzbank believe that BRL has only limited appreciation potential for the time being.
The real is likely to have only limited appreciation potential
“In addition to continued inflation risks one reason why the central bank has not been in a rush with rate cuts is likely to have been the political uncertainty. So far both candidates have only commented about possible fiscal plans in a very vague manner. For that reason, the real is likely to react very cautiously to Lula’s victory.”
“Some fear though that under Lula important fiscal reforms will not be implemented. Until details on that emerge, the real is likely to have only limited appreciation potential.”
-
08:01
Spain Retail Sales (YoY) came in at 0.1%, below expectations (1.1%) in September
-
08:00
Gold Price Forecast: XAU/USD awaits Fed for a sustained break from the ongoing range
Gold price remains in a pre-defined range between two key Fibonacci Retracement (Fibo) levels on the daily time frames. Therefore, XAU/USD looks to range between these key levels ahead of Fed, FXStreet’s Dhwani Mehta reports.
XAU/USD confined within two key barriers
“The $1,674 upside target continues to cap the bullish attempts. That level is the 50.0% Fibo level of the October decline from $1,730. Meanwhile, the downside remains cushioned by the 78.6% Fibo level of the same descent, which is at $1,640.”
“Gold traders await the Fed outcome for a sustained break from the ongoing range but risks to the downside seem compelling, as the 14-day Relative Strength Index (RSI) is trading listlessly while below the 50.00 level. This suggests that bears will likely retain control going forward.”
“On the upside, the immediate resistance is seen at the $1,650 psychological level, above which the 21-Daily Moving Average (DMA) at $1,667 could be challenged. Alternatively, the previous week’s low at $1,638 will be on sellers’ radars, below the 78.6% Fibo support. The monthly low of $1,617 will be the level to beat for XAU/USD bears.”
-
07:58
GBP/USD to break back under 1.1500 – ING
GBP/USD is consolidating above the important 1.15 level, holding onto recent gains. Nonetheless, economists at ING expect the pair to move back below the 1.15 mark.
Thursday's BoE could do some damage
“The highlight this week will be Thursday's Bank of England meeting. The market firmly prices 75 bps, but we think the risk of a softer 50 bps is under-priced as the BoE prepares for the coming recession.”
“The forthcoming tighter fiscal and more dovish than expected monetary policy could prove a bearish combination for sterling.”
“We are dollar bulls and would thus favour GBP/USD breaking back under 1.1500 based on this week's confluence of events. This would also point to current EUR/GBP losses under 0.8600 proving short-lived.”
-
07:51
Eurozone HICP Preview: Forecasts from five major banks, another peak in inflation
Eurostat will release Harmonised Index of Consumer Prices (HICP) data for October on Monday, October 31 at 10:00 GMT and as we get closer to the release time, here are the expectations forecast by the economists and researchers of five major banks regarding the upcoming EU inflation print.
For the eurozone as a whole, headline inflation is expected at 9.8% year-on-year vs. 9.9% in September and core is expected at 4.8% YoY vs. 4.8% in September. On a monthly basis, the HICP is expected at 0.6% vs. 1.2% booked in September while the core HICP is foreseen at 1.2% against the previous figure of 1%.
Commerzbank
“In the euroarea, the inflation rate is likely to have risen from 9.9% in September to 10.0% in October. It is true that energy prices rose only about half as much in October as in October 2021, which in itself depresses the inflation rate by 0.4 percentage points. But this effect is likely to be more than offset by the further strong rise in food prices and a further slight increase in the inflation rate excluding energy, food and beverages from 4.8% to 4.9%.”
Danske Bank
“Following the higher-than-expected prints out of Germany, Italy and France we expect an increase to 10.8% from 9.9% in September.”
SocGen
“We think euro area inflation will reach a new high of 10.7% in October, up 0.8pp from September. Meanwhile, we think core inflation will increase by 0.1pp to 4.9%.”
TDS
“We look for another significant jump in EZ inflation, with headline at 10.8% and core at 5%, on the back of sharp upside surprises in Germany, Italy, and France. We think energy prices will be the main driver, although both services and core goods inflation will likely also provide upside pressure. The outlook for inflation remains highly uncertain, particularly due to prospective fiscal subsidies.”
Citibank
“We expect eurozone HICP to hit 10.0%.”
-
07:48
USD/CAD sticks to gains above 1.3600 mark amid sliding oil prices, modest USD strength
- USD/CAD gains traction for the third straight day and is supported by a combination of factors.
- Sliding crude oil prices undermines the loonie and acts as a tailwind amid modest USD strength.
- The upside seems limited as the focus remains glued to the FOMC policy decision on Wednesday.
The USD/CAD pair attracts some buying for the third successive day on Monday and maintains its bid tone through the early European session. The pair is currently placed around the 1.3635 region and might now be looking to build on its bounce from levels just below the 1.3500 psychological mark, or over a one-month low touched last Thursday.
Crude oil prices come under some selling pressure on Monday after weaker-than-expected Chinese business activity data revives fears about a deeper global economic downturn and slowing fuel demand. This, in turn, undermines the commodity-linked loonie and is seen as a key factor acting as a tailwind for the USD/CAD pair amid a modest US dollar strength.
Furthermore, the disappointing Chinese economic data temper investors' appetite for riskier assets, which is evident from a softer tone around the equity markets. Apart from this, elevated US Treasury bond yields, bolstered by expectations for another supersized 75 bps hike by the Federal Reserve, lends additional support to the safe-haven greenback.
That said, speculations that the Fed will soften its hawkish tone - amid signs of a slowdown in the US economy - might hold back the USD bulls from placing aggressive bets. Hence, investors might prefer to move to the sidelines ahead of the key central bank event risk - the outcome of the highly-anticipated two-day FOMC policy meeting on Wednesday.
Adding to this, expectations of tight supply should limit any deeper losses for crude oil prices and further contribute to capping gains for the USD/CAD pair. In the absence of any major market-moving economic releases, either from the US or Canada, the mixed fundamental backdrop warrants some caution before positioning for any further intraday gains.
Technical levels to watch
-
07:38
EUR/USD to trend weaker again – Commerzbank
High inflation rates in the eurozone hardly move the euro at all. Economists at Commerzbank expect the EUR/USD pair to trend lower again.
Even the smallest inflation shock could cause an unfortunate dynamic
“As inflation expectations have already become de-anchored from the 2% target, I fear that even the smallest inflation shock could cause an unfortunate dynamic. That is, even more, the case if the market assumes that the ECB will not hike its interest rates sufficiently strongly in reaction to higher inflation rates because it is taking the economy into consideration.”
“Sooner or later the euro is likely to trend weaker again, particularly against the US dollar, as the market considers the Fed to be much more committed in its fight against inflation.”
-
07:30
Switzerland Real Retail Sales (YoY) below forecasts (3.3%) in September: Actual (3.2%)
-
07:21
Natural Gas Futures: Further downside not ruled out
CME Group’s flash data for natural gas futures markets noted open interest rose for the 4th straight session on Friday, this time by around 2.7K contracts. On the other hand, volume went down for the third session in a row, now by around 82.6K contracts.
Natural Gas keeps targeting the 200-day SMA
Friday’s negative price action in prices of the natural gas was accompanied by rising open interest. While this is supportive of further losses, the strong drop in volume could also prop up a bullish attempt in the very near term with the next target at the 200-day SMA near $6.74 per MMBtu.
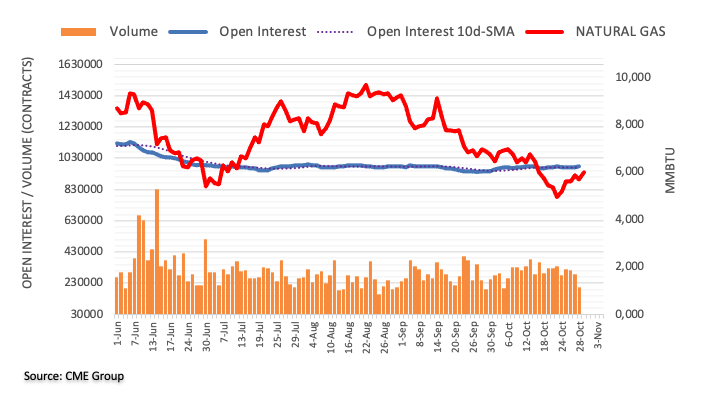
-
07:12
Gold Price Forecast: Sellers look to continue to dominate XAU/USD's action
Gold failed to make a daily close above the 20-day SMA despite having tested that level twice earlier in the week. As FXStreet’s Eren Sengezer notes, the near-term technical outlook reveals a lack of buyer interest.
Drop below $1,620 could trigger a technical selloff
“The Relative Strength Index (RSI) indicator on the daily chart turned south and declined toward 40 after meeting resistance at around 50, suggesting that sellers look to retain control of gold’s action.”
“On the downside, $1,620 aligns as critical support. A drop below that level could trigger a technical selloff and cause XAU/USD to slide toward $1,600 and $1,575 .”
“If XAU/USD makes a daily close above $1,670 (20-day SMA) and manages to stabilize, it could target $1,680 (50-day SMA), $1,700 and $1,720.”
-
07:07
GBP/USD stuck in a range around 1.1600 mark, downside remains cushioned
- GBP/USD is seen consolidating its recent strong move up to a multi-week high.
- A combination of factors underpins the USD and acts as a headwind for the pair.
- The set-up favours bulls and supports prospects for further gains for the major.
The GBP/USD pair enters a bullish consolidation phase and oscillates in a narrow trading band, around the 1.1600 mark through the early European session on Monday.
The US dollar kicks off the new week on a positive note and looks to build on its recent strong bounce from over a one-month low, which, in turn, acts as a headwind for the GBP/USD pair. Investors turned cautious following the disappointing release of Manufacturing PMI from China, which unexpectedly shrank in October. This adds to worries about economic headwinds stemming from the resurgence of new COVID-19 cases in China and tempers investors' appetite for riskier assets.
Apart from this, elevated US Treasury bond yields, bolstered by bets for another supersized 75 bps Fed rate hike in November, continue to underpin the greenback. That said, signs of a slowdown in the US economy might force the Fed to soften its hawkish stance. This, in turn, is holding back the USD bulls from placing aggressive bets. Apart from this, expectations for a 75 bps hike by the Bank of England offer some support to the GBP/USD pair, at least for the time being.
Furthermore, investors see the new UK Prime Minister Rishi Sunak as someone who can bring stability to the recent volatile markets and keep the British economy stable. This, along with last week's bullish breakout through the 1.1480-1.1485 supply zone and acceptance above the 1.1500 psychological mark, supports prospects for additional gains for the GBP/USD pair. Traders, however, might refrain from placing aggressive bets ahead of the key central bank event risk.
The Fed is scheduled to announce the outcome of a two-day policy meeting on Wednesday. This will play a key role in influencing the near-term USD price dynamics and help determine the next leg of a directional move for the GBP/USD pair. In the meantime, spot prices seem more likely to prolong the consolidative price move amid absent relevant market-moving economic releases, either from the UK or the US on Monday.
Technical levels to watch
-
07:03
Forex Today: Investors turn cautious as critical central bank week gets underway
Here is what you need to know on Monday, October 31:
Market mood sours on the last trading day of October as investors prepare for the key central bank meetings and high-tier data releases later in the week. The US Dollar Index builds on Friday's gains and holds in positive territory near 1110.00, US stock index futures post modest losses and the 10-year US Treasury bond yield stays calm above 4%. Eurostat will release the advanced estimate of the third-quarter Gross Domestic Product (GDP) growth and October inflation data on Monday. Later in the day, ISM Chicago's PMI and the Federal Reserve Bank of Dallas' Texas Manufacturing Survey will be watched closely by market participants.
Earlier in the day, the data from China showed that the NBS Manufacturing PMI and Non-Manufacturing PMI both fell into contraction territory in October, arriving at 49.2 and 48.7 respectively. In addition to the disappointing PMI data, ongoing coronavirus-related lockdowns and restrictions across numerous cities in China forced investors to seek refuge with the Shanghai Composite losing nearly 1% on the day. In the early trading hours of the Asian session on Tuesday, the Reserve Bank of Australia will announce its interest rate decision. Despite the negative shift witnessed in risk mood, AUD/USD trades in a narrow channel slightly above 0.6400.
EUR/USD failed to reclaim parity on Friday and started the new week in a relatively calm manner. As of writing, the pair was moving sideways at around 0.9950.
GBP/USD registered gains for the third straight week and went into a consolidation phase near 1.1600 early Monday. The Bank of England will announce its policy decisions later in the week and British Prime Minister Rishi Sunak will unveil the fiscal plan on November 17.
Following the Bank of Japan's decision to keep the policy setting unchanged on Friday, USD/JPY gained more than 100 pips on Friday. The pair fluctuates in a relatively tight range near 148.00 heading into the European session on Monday.
Gold suffered heavy losses on Friday as the benchmark 10-year US Treasury bond yield snapped a three-day losing streak and reclaimed 4%. XAU/USD consolidates its losses at around $1,640 on Monday.
Bitcoin struggled to make a decisive move in either direction over the weekend but managed to end the week above the key $20,000 level. Ethereum gained more than 15% last week and turned quiet above $1,500 early Monday while awaiting the next significant catalyst.
-
07:01
German Retail Sales drop 0.9% YoY in September vs. -0.4% expected
- German Retail Sales arrived at -0.9% YoY in September vs. -0.4% expected.
- Retail Sales in Germany jumped 0.9% MoM in September vs. -0.3% expected.
Germany's Retail Sales rebounded by 0.9% MoM in September versus -0.3% expected and -1.3% previous, the official figures released by Destatis showed on Monday.
On an annualized basis, the bloc’s Retail Sales came in at -0.9% in September versus the -0.4% expected and a 4.3% slump recorded in August.
FX implications
The euro is paring losses on the mixed German data. At the time of writing, the major trades at 0.9950, down 0.11% so far.
About German Retail Sales
The Retail Sales released by the Statistisches Bundesamt Deutschland is a measure of changes in sales of the German retail sector. It shows the performance of the retail sector in the short term. Percent changes reflect the rate of changes of such sales. The changes are widely followed as an indicator of consumer spending. Positive economic growth is usually anticipated as "bullish" for the EUR, while a low reading is seen as negative, or bearish, for the EUR.
-
07:00
Germany Retail Sales (YoY) came in at -0.9% below forecasts (-0.4%) in September
-
07:00
Germany Retail Sales (MoM) came in at 0.9%, above expectations (-0.3%) in September
-
07:00
Norway Credit Indicator declined to 5.1% in September from previous 5.2%
-
07:00
Denmark Unemployment Rate fell from previous 2.3% to 2.2% in September
-
06:59
USD/CHF Price Analysis: Bulls poke 0.9980 resistance confluence
- USD/CHF grinds higher during a three-day uptrend, eyes third consecutive monthly gain.
- Convergence of 50-SMA, 100-SMA challenge buyers of late.
- MACD, RSI conditions suggest gradual advances toward the yearly low.
USD/CHF buyers jostle with the 0.9975-80 hurdle during the initial hour of Monday morning in Europe. In doing so, the Swiss currency (CHF) pair braces for the third monthly gain as it pokes a joint of the 100-SMA and the 50-SMA.
Given the firmer RSI (14) and the bullish MACD signals, not to forget the pair’s sustained trading beyond a three-day-old ascending trend line, USD/CHF prices are likely to remain firmer.
However, a clear upside break of the 0.9980 hurdle appears necessary for the buyers to meet the 1.0000 psychological magnet.
Following that, multiple hurdles around 1.0080 could probe the USD/CHF pair’s upside ahead of challenging the yearly top of 1.0148. In a case where the quote remains firmer past 1.0150, the April 2019 peak surrounding 1.0240 will gain the market’s attention.
Meanwhile, the pullback move remains elusive unless the quote stays beyond the aforementioned support line from Wednesday, close to 0.9920 at the latest.
Should the USD/CHF bears manage to conquer the 0.9920 support, the 0.9900 threshold and the monthly low near 0.9840 will be on their radar.
Overall, USD/CHF is likely to remain firmer but the upside room appears limited.
USD/CHF: Four-hour chart
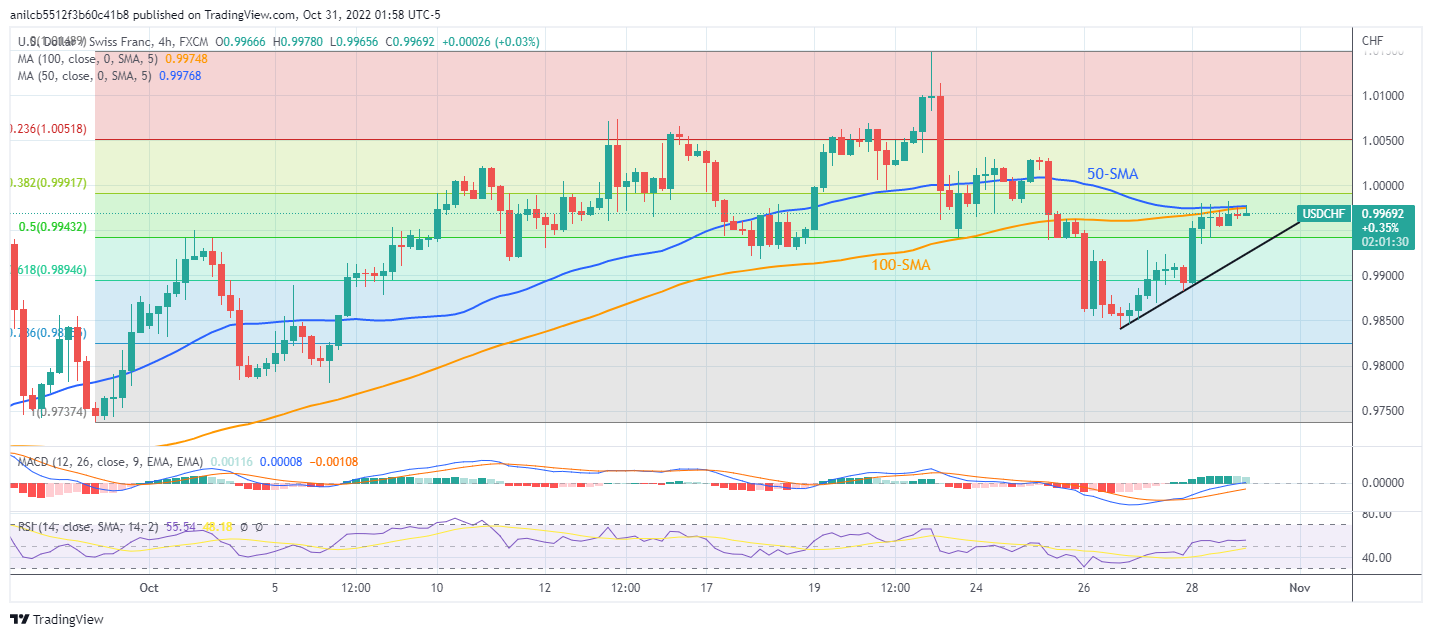
Trend: Further upside expected
-
06:51
US Energy Hochstein: Energy prices have to be priced in a way that allows for economic growth
US Energy Envoy Amos Hochstein said on Monday that “energy prices have to be priced in a way that allows for economic growth.”
He added that “more investment is needed in the oil and gas sector right now and tomorrow.”
Market reaction
WTI was last seen trading at $87.10, down 0.91% on the day.
-
06:40
Crude Oil Futures: Room for further weakness
Considering advanced prints from CME Group for crude oil futures markets, traders added around 2.3K contracts to their open interest positions at the end of last week, reaching the 5th consecutive daily build. Volume, instead, reversed three daily pullbacks in a row and shrank by around 115.3K contracts.
WTI: Next on the downside comes $82.00
Prices of the WTI retreated modestly on Friday amidst rising open interest, which is supportive of extra decline in the very near term. That said, the area of last week’s lows near the $82.00 mark appears as the initial contention for the time being.
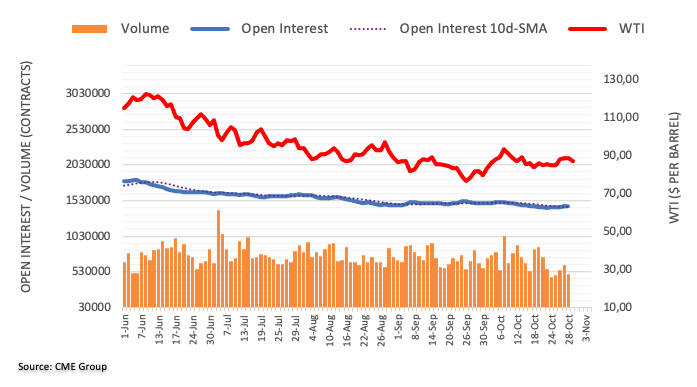
-
06:39
USD/TRY bulls stay on the way to 19.00, Fed, US NFP eyed
- USD/TRY picks up bids to refresh all-time high, snaps two-day losing streak.
- CBRT’s warning to banks over FX transactions, policy divergence with the Fed keeps buyers hopeful.
- Risk-negative catalysts also strengthen bullish bias even as pre-Fed anxiety tests upside moves.
USD/TRY renews record top near 18.65 during early Monday in Europe, around 18.60 at the latest, as the US dollar cheers broad risk-aversion ahead of the key data/events. That said, the Central Bank of the Republic of Türkiye’s (CBRT) fear and Turkish support for the grain deal also seem to propel the Turkish lira (TRY) pair.
US Dollar Index (DXY) adds 0.20% intraday while printing the first gains on a day in three. In doing so, the greenback’s gauge versus the six major currencies benefit from the hawkish Fed bets, especially after Friday’s upbeat prints of the Fed’s preferred inflation gauge, namely the US Core Personal Consumption Expenditures (PCE) Price Index rose to 5.1% YoY for September versus 5.2% expected and 4.9% prior. However, the fifth quarterly fall in US private consumption raised fears of the US Federal Reserve’s (Fed) slower rate hike starting in December, which in turn tests DXY bulls.
On the other hand, Turkey's central bank warned local banks about taking "necessary measures" about conducting forex transactions with foreign banks during night hours, a letter sent to lenders and seen by Reuters showed on Friday.
Elsewhere, Macau’s lockdown of a casino resort and fears emanating from Russia gain major attention during a sluggish session and propel the USD/TRY prices. “Russia, which invaded Ukraine on Feb. 24, halted its role in the Black Sea deal on Saturday for an ‘indefinite term’ because it could say it could not ‘guarantee the safety of civilian ships’ traveling under the pact after an attack on its Black Sea fleet,” reported Reuters.
It should be noted that the US 10-year Treasury yields seesaw near 4.00% after snapping the 10-week uptrend while the US equity future prints mild losses even after Dow Jones braces for the biggest monthly jump since 1976.
Looking forward, the second-tier US activity numbers and the aforementioned risk catalysts could weigh on the USD/TRY prices. Even so, the Fed’s rejection to bow down keeps the gold bears hopeful.
Technical analysis
A two-week-old ascending support line, near 18.50 by the press time, restricts the short-term USD/TRY downside. Meanwhile, the 19.00 round figure will precede the 20.00 psychological magnet to lure bulls. That said, overbought RSI (14) and a month-old trading range suggests that the buyers are running out of steam.
-
06:37
China's Foreign Minister Wang urges US to stop curbing China's development
In a phone call on Sunday, China's Foreign Minister Wang Yi urged US Secretary of State Antony Blinken to stop curbing China's development.
China confirmed a phone call between US Secretary of State Blinken and China's Foreign Minister Wang Yi on Monday.
Key quotes
“The US must correct curbs on exports and investment.”
“The US’ side should stop the practice of containment and suppression against China and not create new obstacles to the relationship between the two countries.”
Market reaction
At the time of writing, AUD/USD is consolidating the upside at around 0.6425, adding 0.16% on the day.
-
06:32
GBP/USD: Outlook remains positive – UOB
Further advance in GBP/USD appears on the cards, although Markets Strategist Quek Ser Leang and Economist Lee Sue Ann at UOB Group note a probable test of 1.1760 seems to have lost momentum.
Key Quotes
24-hour view: “We highlighted last Friday that ‘the price movement is likely part of a consolidation’ and we expected GBP to ‘trade within a range of 1.1485/1.1625’. Our view of consolidation was not wrong even though GBP traded within a narrower range than expected (1.1504/1.1622). The underlying tone has firmed somewhat and the bias for today is on the upside. However, a sustained rise above 1.1645 is unlikely (next resistance is at 1.1700). On the downside, a breach of 1.1525 (minor support is at 1.1560) would indicate that the current mild upward pressure has eased.”
Next 1-3 weeks: “We turned positive on GBP early last week. In our latest narrative from last Thursday (27 Oct, spot at 1.1630), we indicated that GBP is still strong and we noted that the next level to monitor is at 1.1760. Since then, GBP has not been able to make much headway on the upside. However, we continue to hold a positive GBP view for now and only a break of 1.1440 (no change in ‘strong support’ level from last Friday) would indicate that GBP is not advancing further. That said, as upward momentum has waned, the odds of GBP advancing to the major resistance at 1.1760 have diminished.”
-
06:24
Gold Futures: Extra decline seems likely
Open interest in gold futures markets rose for the 5th consecutive session on Friday, this time by around 7.5K contracts according to preliminary readings from CME Group. Volume followed suit and went up by around 8.3K contracts, offsetting the previous daily pullback.
Gold looks supported around $1,615
Friday’s downtick in gold prices was amidst increasing open interest and volume and opens the door to a deeper retracement in the very near term. Against that, the precious metal remains bolstered by the $1,615 region for the time being.
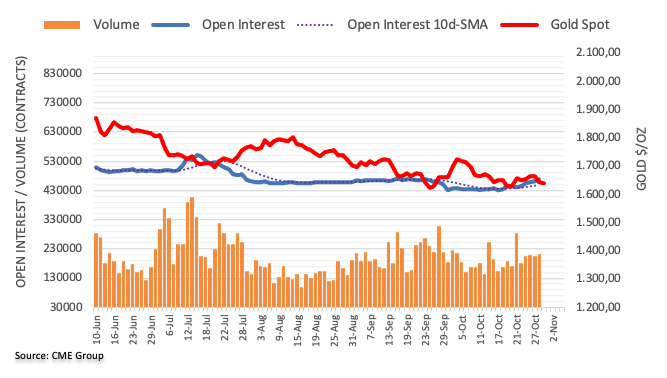
-
06:13
GBP/JPY senses selling pressure from 172.00, BOE policy grabs attention
- GBP/JPY has dropped sharply from 172.00 amid mixed responses from risk impulse.
- Upbeat Japan’s Retail Sales data has strengthened yen.
- The BOE may hike its interest rates by 75 bps to 3%.
The GBP/JPY pair has witnessed a steep fall after failing to sustain above 172.00 in the European session. The cross sensed selling pressure after Japan’s Bureau of Statistics reported a significant increase in Retail Sales data.
Meanwhile, the market impulse is delivering mixed responses as anxiety among the market participants is accelerating ahead of the monetary policies by the Bank of England (BOE), the Federal Reserve (Fed), and the Reserve Bank of Australia (RBA).
The release of the upbeat Retail Sales data has strengthened yen. The monthly and annual Retail Trade have accelerated to 1.1% and 4.5% vs. the projections of 0.6% and 4.1% respectively. The Larger Retail Sales have soared to 4.1% against the estimates of 3.6%. Apart from that, annual Industrial Production has climbed to 9.8% in comparison to the consensus of 8.7%.
On the UK front, investors are awaiting Thursday’s interest rate decision by the BOE. Analysts at Rabobank see a 75 bps rate hike to 3.00% from 2.25%. Earlier, analysts were expecting a rate hike of a full percent after the disaster of the mini-budget under the leadership of former UK PM Liz Truss and Chancellor Kwasi Kwarteng. However, novel leadership formation has infused optimism in scaled-down rate hike projections. They explain that it would still be the largest rate hike of this cycle. On policy guidance, analysts expect rates to peak at 4.75%.
Meanwhile, minutes from Llyods Bank PLC’s business barometer claim that business confidence has dropped to pre-pandemic levels. The UK Consumer Confidence fell 1 point to 15% in the October survey, as reported by Bloomberg. However, the majority of employers are expecting that staff will increase for the first time in five months.
-
06:09
EUR/USD: Shrinking bets for further strength – UOB
Markets Strategist Quek Ser Leang and Economist Lee Sue Ann at UOB Group suggest the prospect for further strength in EUR/USD now appears diminished.
Key Quotes
24-hour view: “Last Friday, we held the view that EUR ‘is likely to consolidate and trade between 0.9925 and 1.0050’. While EUR consolidated as expected, it traded within a narrower range than expected (0.9925/0.9997) before closing largely unchanged at 0.9963 (+0.01%). The price actions still appear to be part of a consolidation and we expect EUR to trade sideways between 0.9920 and 1.0020 today.”
Next 1-3 weeks: “Our update from last Friday (28 Oct, spot at 0.9970) still stands. As highlighted, the sharp pullback last Thursday has resulted in a quick loss in momentum and the chance of further EUR strength has diminished. However, only a break of 0.9880 (no change in ‘strong support’ level) would indicate that the EUR strength that started early last week has come to an end.”
-
06:07
GBP/USD: Better, but not good – Goldman Sachs
Analysts at Goldman Sachs, in their recent note, revised up their forecasts for the GBP/USD pair but still expect some underperformance going forward.
Key quotes
"After serving as the center of the financial market storm for a few weeks, with fiscal and monetary policy out of step with each other and the macro backdrop, now they appear to be moving in a more cohesive and coherent direction."
"Markets have responded to this change in strategy by taking down the risk premium on UK assets significantly. We think this is appropriate, but also think it should be emphasized that the UK economy remains in a difficult position."
"From current levels,(GBP) risks still appear to be skewed to the downside given how much is priced into the BoE, and it might be 'easier said than done' when it comes to removing fiscal support during a difficult economic downturn."
"Taking these things together, we are revising our Sterling forecasts in a more positive direction, but still expect some further GBP underperformance ahead. We now forecast EUR/GBP to trade at GBP0.88, GBP0.87, and GBP0.86 in 3, 6, and 12 months (from GBP0.92, GBP0.90, and GBP0.88 previously). This implies GBP/USD at $1.10, $1.11, and $1.22 (vs $1.05, $1.08, and $1.19 previously)."
-
06:06
Gold Price Forecast: XAU/USD eyes seventh monthly loss around $1,650 as hawkish Fed bets propel DXY
- Gold price drops for the third consecutive day after reversing from 21-DMA.
- Headlines concerning China, Russia weigh on risk appetite amid mixed data.
- Friday’s US inflation numbers propel Fed bets but hints for December’s move will be crucial for XAU/USD buyers to trace.
Gold price (XAU/USD) holds lower ground near $1,640 heading into Monday’s European session, printing three-day losing streak while bracing for the seventh monthly fall.
In doing so, the bright metal justifies the market’s rush for risk safety ahead of the key central bank announcements. Other than the pre-Fed anxiety, the geopolitical risk emanating from Russia and China’s covid woes join downbeat PMIs from Beijing to exert downside pressure on the XAU/USD prices.
China’s official NBS Manufacturing PMI for October dropped to 49.2 versus 50.0 expected and 50.1 prior. Further, the Non-Manufacturing PMI also slumped to 48.7 compared to 51.9 market forecasts and 50.6 previous readings. “China's factory activity unexpectedly fell in October, an official survey showed on Monday, weighed by softening global demand and strict COVID-19 restrictions, which hit production,” said Reuters following the data.
Macau’s lockdown of a casino resort and fears emanating from Russia’s retreat from the grain deal gain major attention when it comes to the risk-negative catalysts. On the same line were Friday’s strong prints of the Fed’s preferred inflation gauge, namely the US Core Personal Consumption Expenditures (PCE) Price Index. However, the fifth quarterly fall in the US private consumption joins fears of the US Federal Reserve’s (Fed) slower rate hike starting in December to challenge the XAU/USD bears.
Amid these plays, the US 10-year Treasury yields seesaw near 4.00% after snapping the 10-week uptrend while the US equity future prints mild losses even after Dow Jones braces for the biggest monthly jump since 1976.
Moving on, the second-tier US activity numbers and the aforementioned risk catalysts could weigh on the XAU/USD prices. Even so, the Fed’s rejection to bow down keeps the gold bears hopeful.
Technical analysis
In addition to a successful U-turn from the 21-DMA hurdle, around $1,667, the gold buyers should also cross a downward-sloping resistance line from August, close to $1,695, to retake control. It should be noted that the 10-DMA level surrounding $1,649 guards immediate recovery of the XAU/USD.
Meanwhile, $1,630 acts as a nearby support before directing the bears towards a monthly support line, close to $1,617 by the press time. Following that, a downward trajectory towards the yearly low near $1,614 and the $1,600 threshold can’t be ruled out.
Overall, the gold price remains on the bear’s radar but the downside appears limited, which in turn highlights the Fed’s monetary policy announcements as the key catalyst.
Gold: Daily chart
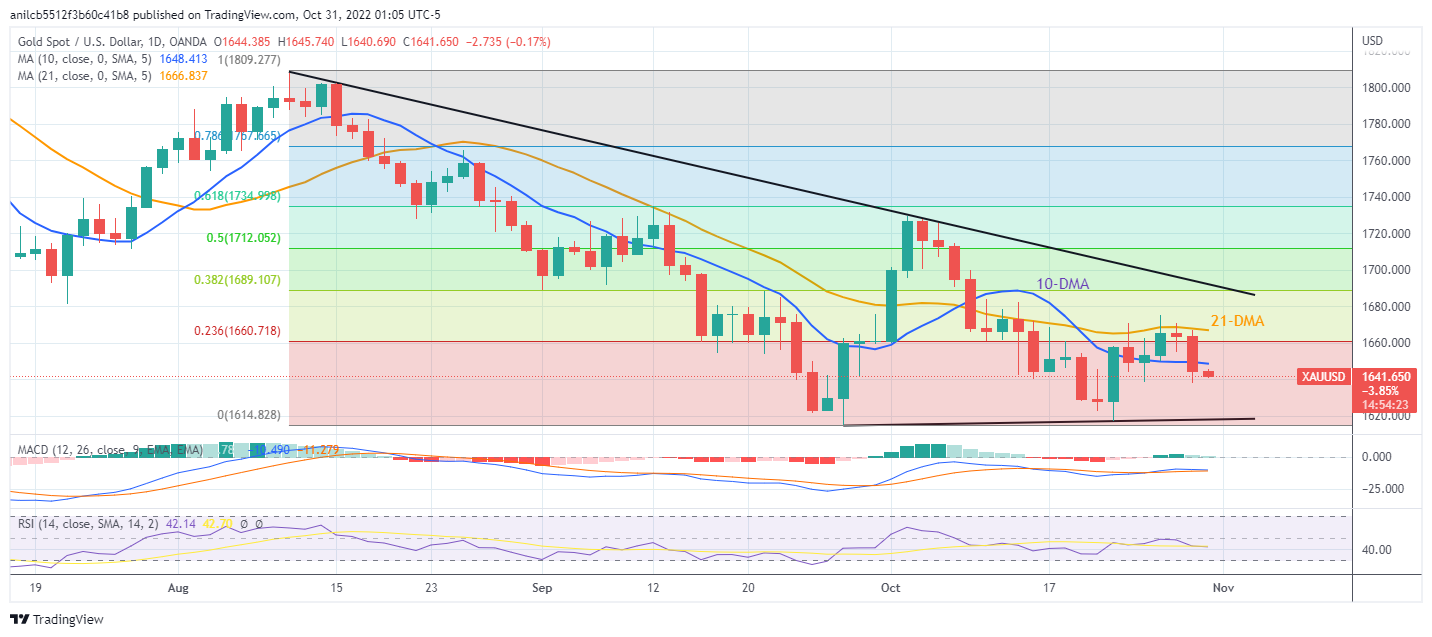
Trend: Further weakness expected
-
06:01
South Africa M3 Money Supply (YoY) above expectations (8.25%) in September: Actual (8.75%)
-
06:01
South Africa Private Sector Credit came in at 9.74%, above forecasts (8.2%) in September
-
05:47
EUR/USD Price Analysis: Struggles around the 20-EMA band, parity remains a key hurdle
- Ambiguity in the risk profile has shifted the asset to the sidelines.
- The asset is hovering around the 20-MA High-Low band, which acts as a major area of the impulsive rally.
- A breach of parity would expose the asset to smash a two-month high at 1.0200.
The EUR/USD pair has slipped marginally after struggling to cross the immediate hurdle of 0.9965 in the early European session. The asset has turned sideways amid ambiguous performance displayed by the mighty US dollar index (DXY).
The risk profile is displayed mixed response as upbeat S&P500 futures are providing a solid cushion while anxiety ahead of the interest rate decision by the Federal Reserve (Fed) is capping the upside.
On a four-hour scale, the asset witnessed a juggernaut rally after an upside break of the Symmetrical Triangle chart pattern, however, the rally had been followed by a corrective move. The asset is hovering marginally below the 20-period Moving Average (MA) High-Low band, which acts as a strong support for the asset.
Meanwhile, the Relative Strength Index (RSI) (14) has slipped into the 40.00-60.00 range. An upside momentum will get triggered once it will reclaim the bullish zone in a 60.00-80.00 range.
Should the asset break above September 20 high at 1.0051, the shared currency bulls will send the asset firmly toward August 3 low at 1.0123, followed by a two-month high at 1.0200.
On the flip side, the greenback bulls will grab attention if the asset drops below October 25 low at 0.9848. It may drag the asset toward October 20 low at 0.9755 and October 21 low at 0.9705.
EUR/USD four-hour chart
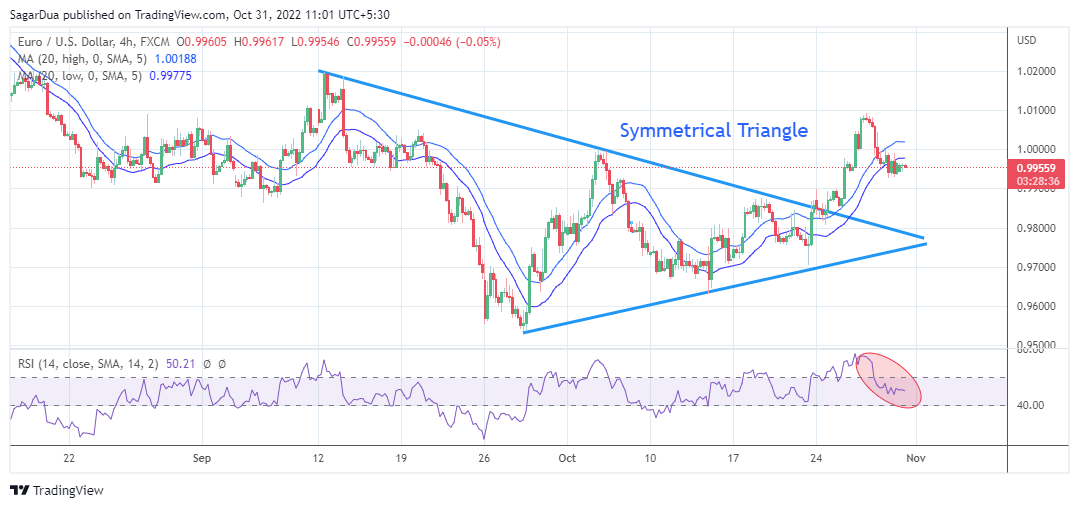
-
05:32
Copper prints three-day downtrend around $3.40 on China-inspired fears, firmer DXY
- Copper holds lower ground near intraday bottom, down for the third consecutive day.
- Clear break of weekly support line joins China’s covid woes, downbeat PMI to weigh on prices.
- DXY begins the key week on a firmer footing amid hawkish Fed bets.
Copper remains bearish for the third consecutive day as sellers approach the $3.4000 psychological magnet heading into Monday’s European session, near $3.4030 by the press time. In doing so, the red metal justifies the market’s risk-off mood, as well as the firmer US dollar, ahead of the key central bank meetings.
Macau’s lockdown of a casino resort and fears emanating from Russia gain major attention when it comes to the risk-negative catalysts. “Russia, which invaded Ukraine on Feb. 24, halted its role in the Black Sea deal on Saturday for an ‘indefinite term’ because it could say it could not ‘guarantee the safety of civilian ships’ traveling under the pact after an attack on its Black Sea fleet,” reported Reuters.
On the other hand, China’s official NBS Manufacturing PMI for October dropped to 49.2 versus 50.0 expected and 50.1 prior. Further, the Non-Manufacturing PMI also slumped to 48.7 compared to 51.9 market forecasts and 50.6 previous readings. “China's factory activity unexpectedly fell in October, an official survey showed on Monday, weighed by softening global demand and strict COVID-19 restrictions, which hit production,” said Reuters following the data.
Alternatively, Reuters’ report suggests a drop in Chile’s copper output struggles to defend the metal buyers amid China’s covid woes. “Copper output in Chile, the world's largest producer of the metal, fell 2.6% on a year-on-year basis to 439,277 tonnes in September, the country's statistics agency, INE, said on Friday,” the news states.
Against this backdrop, the US 10-year Treasury yields seesaw near 4.00% after snapping the 10-week uptrend while the US equity future prints mild losses even after Dow Jones braces for the biggest monthly jump since 1976.
Looking forward, activity numbers from China and the US will join the Nonfarm Payrolls (NFP) to direct short-term copper traders. However, major attention will be given to the Fed’s language as DXY bears could jump if policymakers hint at slower rate hikes starting from December.
Technical analysis
A successful break of the one-week-old ascending trend line, now resistance around $3.4500, directs copper prices toward the monthly low near $3.30.
-
05:30
Netherlands, The Retail Sales (YoY) up to 5.9% in September from previous 3.7%
-
05:22
Asian Stock Market: Follows footprints of upbeat S&P500, DXY turns sideways, oil drops
- Asian equities are displaying solid gains amid a risk-on market impulse.
- Chinese indices turned nervous ahead of Caixin Manufacturing PMI data.
- Oil prices have dropped below $87.00 amid growing demand worries ahead of Fed policy.
Markets in the Asian domain are displaying solid gains on Monday tracking decent weekly returns in S&P500. The 500-stock basket witnessed a stellar buying interest after investors shrugged off uncertainty on tech’s earnings guidance. The risk profile is upbeat as the US dollar index (DXY) is displaying a subdued performance in the Tokyo session.
At the press time, Japan’s Nikkei225 soared 1.64%, ChinaA50 remained almost flat, Hang Seng jumped 1.60% and Nifty50 climbed 0.93%.
Chinese markets have turned nervous ahead of the Caixin Manufacturing PMI data, which will release on Tuesday. The economic data is seen higher at 49.0 vs. the prior release of 48.1. Official Manufacturing PMI which release before the Caixin Manufacturing PMI has remained downbeat.
China’s official Manufacturing PMI has landed lower at 49.2 vs. the projections of 50.0 and the prior release of 50.1, reported by the National Bureau of Statistics. Also, the Non-Manufacturing PMI has been recorded as significantly lower at 48.7 against the expectations of 51.9 and the former release of 50.6. It seems that the continuation of the no-tolerance Covid-19 policy has weighed pressure on economic activities.
Meanwhile, Japanese equities are having a ball with an expectation of more stimulus in the economy by the Bank of Japan (BOJ) to support the economy from external demand shocks and weaker economic prospects. It is worth noting that BOJ Governor Haruhiko Kuroda kept the monetary policy unchanged on Friday.
On the oil front, rising odds of a bigger rate hike by the Federal Reserve (Fed) are weighing on oil prices. The oil prices have dropped sharply below $87.00 as more policy tightening measures by the Fed will trim the oil demand ahead.
-
05:08
USD/INR Price News: Indian rupee floats around 82.50, Fed, RBI announcements eyed
- USD/INR remains mildly bid while paring the previous weekly losses.
- Downbeat China data, risk-off mood propel prices even as WTI crude oil drops.
- Hopes of RBI’s inaction join hawkish Fed bets to keep buyers hopeful.
USD/INR picks up bids to consolidate the previous week’s losses around 82.40 during early Monday in Europe. In doing so, the Indian rupee (INR) pair portrays the market’s rush towards the US dollar ahead of the key central bank announcements.
That said, the US Dollar Index (DXY) prints a three-day uptrend around 110.80, up 0.10% intraday by the press time, as traders expect the US Federal Reserve (Fed) to announce a 75 basis point of a rate hike during Wednesday’s Federal Open Market Committee (FOMC).
On the other hand, Reuters stated that the Reserve Bank of India's monetary policy committee meeting on Thursday was most likely to discuss the central bank's response to the government after failing to meet its inflation target for three quarters in a row. “State Bank of India does not expect any other agenda for this meeting, despite being scheduled a day after the Fed meets,” the news also adds.
Elsewhere, the downbeat prints of China’s activity numbers and fears emanating from Russia also weigh on the market’s sentiment and propel the USD/INR prices. China’s official NBS Manufacturing PMI for October dropped to 49.2 versus 50.0 expected and 50.1 prior. Further, the Non-Manufacturing PMI also slumped to 48.7 compared to 51.9 market forecasts and 50.6 previous readings. “China's factory activity unexpectedly fell in October, an official survey showed on Monday, weighed by softening global demand and strict COVID-19 restrictions, which hit production,” said Reuters following the data.
Further, news of Macau’s lockdown of a casino resort and fears emanating from Russia also underpin the USD/INR upside, due to the US dollar’s safe-haven status. “Russia, which invaded Ukraine on Feb. 24, halted its role in the Black Sea deal on Saturday for an ‘indefinite term’ because it could say it could not ‘guarantee the safety of civilian ships’ traveling under the pact after an attack on its Black Sea fleet,” reported Reuters.
It should be noted that the recent weakness in the WTI crude oil prices, down 1.0% on a day around $87.40 by the press time, fails to tease the USD/INR bears. That said, the US 10-year Treasury yields seesaw near 4.00% after snapping the 10-week uptrend by the end of Friday while the US equity future prints mild losses even after Dow Jones braces for the biggest monthly jump since 1976.
Moving on, the market’s risk catalysts and second-tier PMI data from the US may entertain the USD/INR pair traders but the bulls are likely to keep the reins.
Technical analysis
A daily closing beyond the 10-DMA, around 82.50 by the press time, becomes necessary for the USD/INR bulls.
-
05:02
Japan Construction Orders (YoY) rose from previous 17.9% to 36.6% in September
-
05:02
Japan Annualized Housing Starts: 0.857M (September) vs previous 0.903M
-
05:00
Japan Consumer Confidence Index came in at 29.9, below expectations (31.5) in October
-
05:00
Japan Housing Starts (YoY) below forecasts (2.3%) in September: Actual (1%)
-
04:48
USD/JPY declines from 148.00 as DXY drops, upside remains favored amid hawkish Fed bets
- USD/JPY has slipped sharply from 148.00 as the risk-on profile has regained strength.
- Fed may not pause policy tightening measures till the inflation rate gets halved.
- An upbeat Japan’s Retail Sales data has supported yen.
The USD/JPY pair has witnessed a steep fall after failing to sustain above the critical hurdle of 148.00 in the Asian session. The asset has slipped to near the immediate cushion of 147.82 as the US dollar index (DXY) has turned volatile. The DXY has refreshed its day’s low at 110.72 and is expected to display more weakness as the risk-on profile has rebounded firmly.
S&P500 futures are holding their previous week’s gains, which has restricted the DXY bulls to gain traction. Meanwhile, the 10-year US Treasury yields have rebounded firmly to near 4.03% ahead of the monetary policy decision by the Federal Reserve (Fed).
The odds for a 75 basis point (bps) rate hike by the Fed are gaining gradually. As per the CME FedWatch tool, the chances for a third quarter-to-a-percent rate hike stand at 83.7%.
According to the economists’ poll by Reuters, the Fed will announce a fourth consecutive 75 bps rate hike. The report further cited that the central bank should not pause until the inflation rate is scaled down by half.
This week, ISM Manufacturing PMI data will also remain in the spotlight. As per the preliminary estimates, ISM Manufacturing PMI data is seen lower at 50.0 vs. the prior release of 50.9. Also, the ISM New Orders Index will be the crucial catalyst that displays forward demand and is seen significantly higher at 49.1 against the former figure of 47.1.
On the Tokyo front, upbeat Japanese Retail Trade data has also supported yen. The monthly and annual Retail Trade have accelerated to 1.1% and 4.5% vs. the projections of 0.6% and 4.1% respectively. The Larger Retail Sales have soared to 4.1% against the estimates of 3.6%. Apart from that, annual Industrial Production has climbed to 9.8% in comparison to the consensus of 8.7%.
-
04:39
GBP/USD fades upside momentum near 1.1600 with eyes on Fed vs. BOE play
- GBP/USD prints mild losses around a fortnight high, probes three-week uptrend.
- Market’s confidence in Britain’s new government, hawkish bets on BOE defend buyers.
- Risk-aversion, strong US data tease pair sellers amid sluggish session.
- Second-tier US PMIs may entertain traders but FOMC, BOE’s rate decision will be crucial for fresh directions.
GBP/USD retreats towards 1.1600 while snapping a three-week uptrend with mild losses during early Monday morning in Europe. The Cable pair’s latest weakness could be linked to the market’s cautious mood ahead of this week’s key monetary policy meetings of the Federal Open Market Committee (FOMC) and the Bank of England (BOE). Also likely to have weighed on the quote is the mixed sentiment.
Although Friday’s US inflation data renewed concerns that the Fed hawks may keep the reins, the mixed details of the US GDP and looming fears that the policymakers may hint at slower rate hikes in December weigh on the GBP/USD prices. On the contrary, cautious optimism in the UK, mainly due to the credibility of the new British government, keep the pair firmer. Additionally fueling the quote are the hopes that the BOE might even surpass the market expectations of announcing the biggest rate hike since 1989.
That said, the Fed’s preferred inflation gauge, namely the US Core Personal Consumption Expenditures (PCE) Price Index rose to 5.1% YoY for September versus 5.2% expected and 4.9% prior. However, the fifth quarterly fall in US private consumption raised fears of the US Federal Reserve’s (Fed) slower rate hike starting in December.
Elsewhere, Macau’s lockdown of a casino resort and fears emanating from Russia gain major attention during a sluggish session and weigh on the GBP/USD prices. “Russia, which invaded Ukraine on Feb. 24, halted its role in the Black Sea deal on Saturday for an ‘indefinite term’ because it could say it could not ‘guarantee the safety of civilian ships’ traveling under the pact after an attack on its Black Sea fleet,” reported Reuters.
It’s worth observing that the Reuters latest poll mentioned that the BOE is to hike by 75 bps on Nov. 3 but may go bigger. The analytics on the same mentioned, “That is down from near-100% bets on a full percentage-point leap in the Bank Rate which were doused last week by new finance minister Jeremy Hunt when he reversed almost all of former Prime Minister Liz Truss's tax cuts.” The piece also cites the odds while saying, “But the delay of the first budget plan of Hunt and new Prime Minister Rishi Sunak until Nov. 17 will make it harder for the BoE to spell out its economic forecasts.”
Amid these plays, the US 10-year Treasury yields seesaw near 4.00% after snapping the 10-week uptrend by the end of Friday. Additionally testing the GBP/USD traders are the mixed moves of the equities as the US equity future prints mild losses even after Dow Jones braces for the biggest monthly jump since 1976.
Moving on, the second-tier US activity data could offer intermediate moves to the GBP/USD prices but major attention will be given to the BOE versus Fed moves. Also important will be Friday’s US jobs report for October.
Technical analysis
Despite the latest pullback, GBP/USD bears may wait for a clear downside break of the early-October peak surrounding 1.1495-90 before taking fresh entries. Meanwhile, buyers should wait for sustained trading past the 100-DMA resistance, near 1.1730 at the latest. That said, the RSI and MACD signals hint at the pair’s gradual recovery.
-
04:13
AUD/USD Price Analysis: Extends recovery above 0.6400 as risk-on impulse regains traction
- Clarity over risk profile has supported the commodity-linked currency.
- The DXY has refreshed its day low at 110.75 amid a risk-on profile.
- Advancing 20-and 50-EMAs add to the upside filters.
The AUD/USD pair has extended its recovery after overstepping the immediate hurdle of 0.6416 in the Tokyo session. The commodity-linked currency has witnessed a decent buying interest as the US dollar index (DXY) has dropped sharply and has renewed the day’s low at 110.75.
Meanwhile, the S&P500 futures have regained their entire morning losses. The recovery in the risk-on profile is supporting the antipodean against the greenback.
On a four-hour scale, the cross has entered into the prior highest auction area, which is considered the recent most traded range. The balanced profile is plotted in a range of 0.6362-0.6544. Entry of the asset in the highest auction area indicates that the asset is challenging the inventory adjustment phase and a make-or-break move is expected ahead.
The asset has taken support at around the critical support of 0.6400, which was acting as resistance earlier.
The 20-and 50-period Exponential Moving Averages (EMAs) at 0.6448 and 0.6363 respectively are advancing, which adds to the upside filters.
Meanwhile, the Relative Strength Index (RSI) (14) has slipped into the 40.00-60.00 range. An upside momentum will get triggered once it will reclaim the bullish zone in a 60.00-80.00 range.
Going forward, a decisive break above October 4 low at 0.6451 will strengthen the aussie bulls. This will drive the asset towards October 4 high at 0.6548, followed by the round-level resistance at 0.6600.
On the flip side, a downside break of the October 20 low at 0.6229 will drag the asset toward the fresh two-year low at 0.6170 and April 2020 low at 0.5991.
AUD/USD four-hour chart
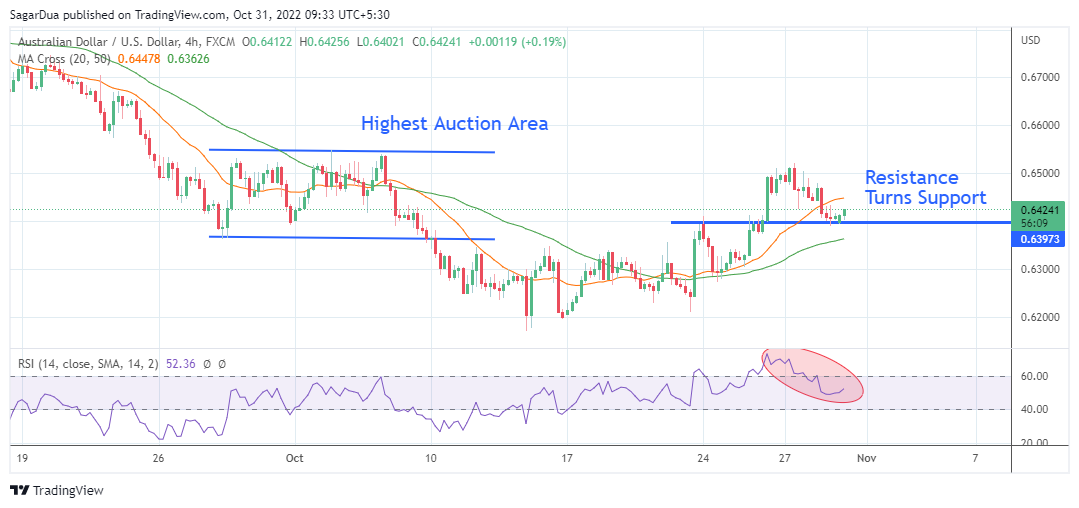
-
03:48
US State Department: Blinken and Wang discuss importance of communication
The US State Department said in a statement on Monday, Secretary of State Antony Blinken and China's Foreign Minister Wang Yi discussed the importance of maintaining open lines of communication and managing the US-China relationship responsibly.
In a call on Sunday with Wang, Blinken discussed Russia's war against Ukraine and the threats it poses to global security and economic stability, the State Department said.
Market reaction
Despite resurfacing covid lockdown worries and disappointing manufacturing and services data from China, AUD/USD is holding near-daily highs of 0.6425, partly benefiting from the US-China headlines while a pullback in the US dollar across the board also helps the aussie. The spot is up 0.19% on the day.
-
03:34
Gold Price Forecast: XAU/USD holds itself above $1,640 amid Fed’s pre-anxiety, PMIs eyed
- Gold price is auctioning above the $1,640.00 support amid ambiguous market mood.
- The Fed is expected to hike interest rates by 75 bps for the fourth time.
- ISM Manufacturing PMI gamut is seen lower than consensus which could impact the DXY.
Gold price (XAU/USD) is displaying a lackluster performance in the Tokyo session as the market impulse is delivering mixed responses. The precious metal is oscillating in a narrow range of $1,640.60-1,644.25, following the footprints of the rangebound US dollar index (DXY).
S&P500 futures are holding their Friday’s gains but have displayed a marginal correction in Tokyo, which seems insignificant. However, the alpha generated by US government bonds is gaining traction. The 10-year US Treasury yields have climbed to 4.04%.
Gold prices are trading sideways as anxiety ahead of Federal Reserve (Fed) monetary policy has shifted investors to the sidelines. As per the CME FedWatch tool, the chances of a 75 basis point (bps) rate hike stand at 82.3%. Giant investment banking firm, Goldman Sachs, vouch for a 75 bps rate hike this week and sees the desired terminal rate beyond 4.75% to 5%.
Apart from that, Tuesday’s PMI data also holds significant importance. As per the projections, ISM Manufacturing PMI data is seen lower at 50.0 vs. the prior release of 50.9. Also, the ISM New Orders Index will be a crucial catalyst that displays forward demand and is seen significantly higher at 49.1 against the former figure of 47.1.
Gold technical analysis
On an hourly scale, the gold price is playing around weekly lows at $1,638.15, recorded on Tuesday.
The precious metal is trading below the 20-and 50-period Exponential Moving Averages (EMAs) at $1,644.54 and $1,655.63 respectively, which adds to the downside filters.
Meanwhile, the Relative Strength Index (RSI) (14) is facing hurdles around 40.00, which indicates that the downside momentum is not over yet.
Gold hourly chart
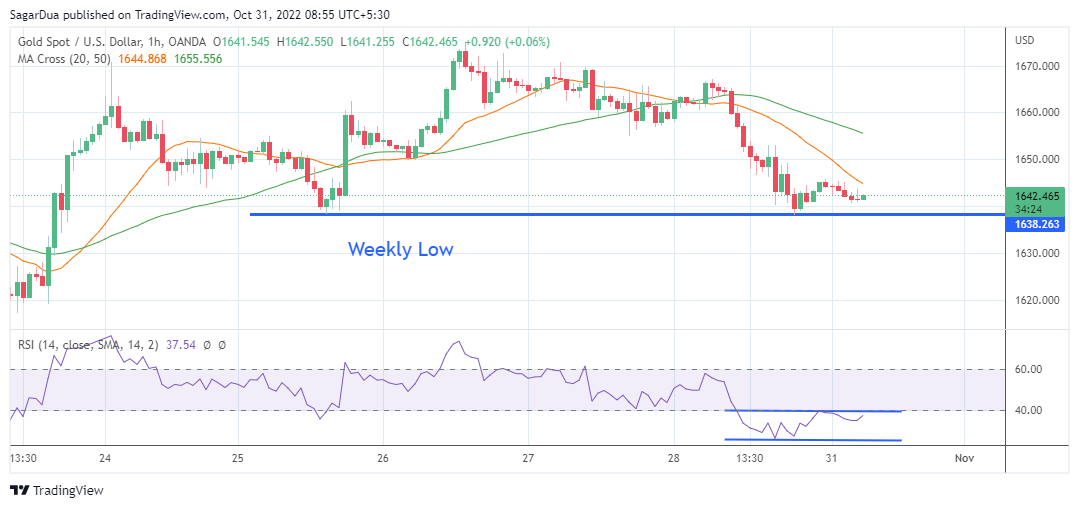
-
03:29
EUR/USD treads water around mid-0.9900s as traders await Euro zone GDP, inflation and Fed
- EUR/USD seesaws above a three-week-old previous resistance line after two-week uptrend.
- Market’s anxiety ahead of the top-tier EU data, FOMC keeps traders on the edge.
- Risk-negative headlines, firmer yields challenge buyers as DXY grinds higher.
- Bears will look for Eurozone recession to take entries but Fed’s favor for slower rate hike may keep buyers hopeful.
EUR/USD struggles for clear directions while trading inside a 20-pip range surrounding 0.9950 during early Monday. In doing so, the major currency pair portrays the market’s anxiety ahead of the key eurozone data and the Federal Open Market Committee (FOMC) meeting announcements.
That said, Friday’s US inflation data teased EUR/USD sellers but the underlying details suggest that there is room for the Fed to discuss easy rate hikes from December onwards, which in turn challenge the pair’s downside moves.
Also, the US 10-year Treasury yields seesaw near 4.00% after snapping the 10-week uptrend by the end of Friday. Additionally testing the EUR/USD traders are the mixed moves of the equities as the US equity future prints mild losses even after Dow Jones braces for the biggest monthly jump since 1976.
Talking above the risk-negative catalysts, news of Macau’s lockdown of a casino resort and fears emanating from Russia gain major attention during a sluggish session. “Russia, which invaded Ukraine on Feb. 24, halted its role in the Black Sea deal on Saturday for an ‘indefinite term’ because it could say it could not ‘guarantee the safety of civilian ships’ traveling under the pact after an attack on its Black Sea fleet,” reported Reuters. On the other hand, the concerns that the Fed might discuss slowing down on the rate hikes from December seem to challenge the pair buyers of late.
Looking forward, the first readings of the Eurozone’s third quarter (Q3) Gross Domestic Product, expected to ease to 0.2% versus 0.8% prior, as well as the October month’s HICP, likely to soften to 0.6% MoM compared to 1.2% prior, will be important for immediate directions. The reasons could be linked to the growing fears of economic recession in the bloc, which if confirmed could weigh on the EUR/USD prices.
It should, however, be noted that the Fed’s move will be more important for clear directions as talks over the US central bank’s easing on the further rate increases, currently expected to have 0.75% rate lift, could renew the EUR/USD pair’s upside moves.
Technical analysis
Given the bearish MACD signals and the downbeat RSI (14), not oversold, the EUR/USD prices are likely to extend the previous day’s downside break of the one-week-old ascending trend line, as well as the 21-SMA.
Hence, EUR/USD sellers could wait for a successful break of the 0.9960 immediate support line, previous resistance, for conviction. Following that, a downward trajectory towards an upward-sloping trend line from September 27, close to 0.9755, appears more likely. During the fall, the 50% and 38.2% Fibonacci retracement level of the pair’s September-October downside, near 0.9870 and 0.9790 in that order, will be crucial intermediate levels to watch.
-
03:10
JP Morgan: China markets offer better entry point than three months ago – SCMP
China still presents significant opportunities for global investors despite a market drubbing last week sparked by the Communist Party’s twice-a-decade leadership reshuffle. The headwinds hobbling the world’s second-largest economy “shall pass” over time, JPMorgan says, reported the South China Morning Post (SCMP).
The news quotes JP Morgan’s Chief Executive Mary Callahan Erdoes while also saying, “When investors face uncertainty, they need to have the patience and expertise to understand how China works.”
Key quotes
With the macro backdrop and the geopolitical issues around the world, lots of opportunities will present themselves.
If their portfolio calls for a global allocation, and they haven’t had exposure to certain areas of the world, like Asia, like China especially, this is a much better entry point to begin to phase in than it was three days or three months ago.
The results of the party Congress made some investors ask questions that they may not have had before.
There will be high winds that can cause a lot of damage and then eventually, this too shall pass.
Also read: USD/CNH grinds higher past 7.2800 as China PMIs fall, Fed’s move, US NFP eyed
-
02:55
Silver Price Analysis: XAG/USD stays defensive above $19.00 as bears keep the reins
- Silver price remains mildly offered while staying between 200-SMA and 50-SMA.
- Downbeat oscillators, sustained break of weekly ascending trend line keeps bears hopeful.
- Bulls need validation from $20.00 to retake control.
Silver price (XAG/USD) struggles to defend $19.00 as it seesaws inside a 20-pip area comprising the key SMAs during Monday’s Asian session.
Even so, bearish MACD signals join downbeat RSI (14), not oversold, to keep the sellers hopeful.
Above that, the previous day’s downside break of a one-week-old ascending support line, now resistance around $19.65, also favors the XAG/USD bears.
Even if the quote rises past $19.65 hurdle, a seven-week-old horizontal resistance area near $20.00, will be crucial for the silver buyers to cross before taking control. Following that, a run-up towards the monthly high of $21.24 can’t be ruled out.
Alternatively, a downside break of the 50-SMA level of $19.10, could poke the $19.00 threshold before directing the bears towards the monthly bottom surrounding $18.10.
Following that, the $18.00 round figure and previous monthly low near $17.55 will be in the spotlight.
Silver: Four-hour chart
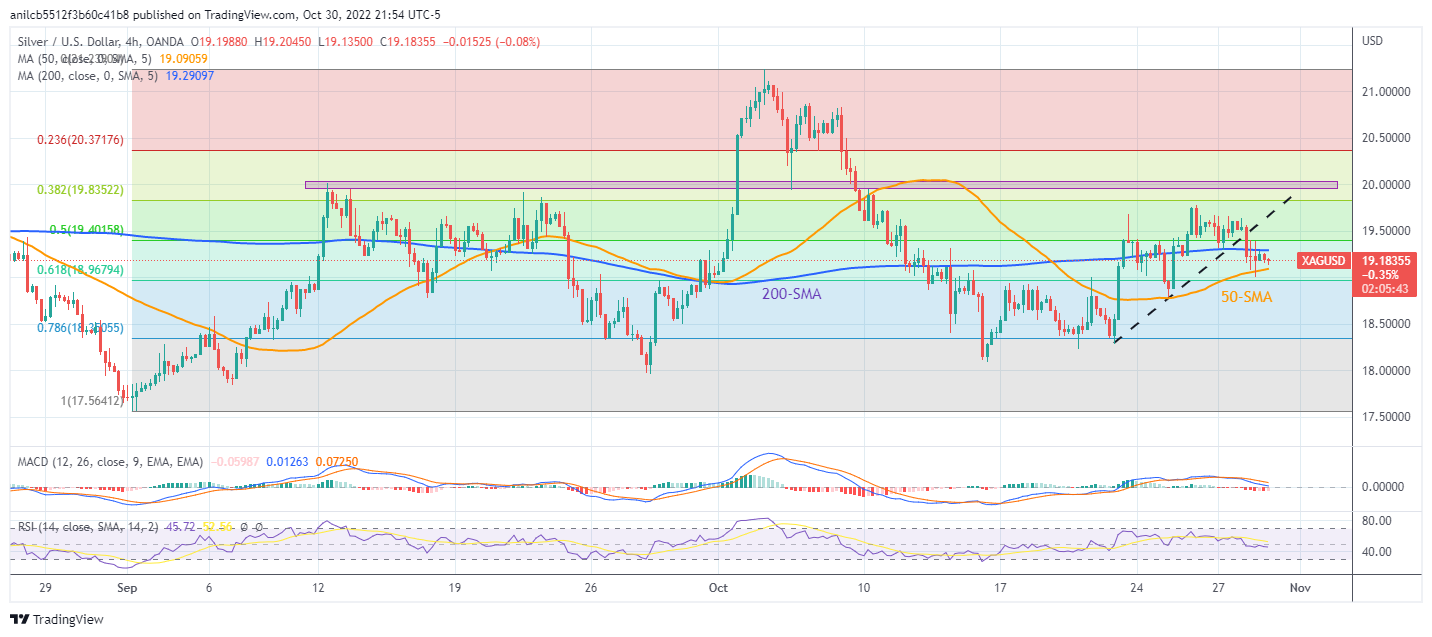
Trend: Further downside expected
-
02:41
USD/JPY steadies below 148.40 resistance amid sluggish yields ahead of FOMC, NFP
- USD/JPY struggles to overcome fortnight-old downtrend during two-day advances.
- Market’s remain cautious ahead of the key central bank meetings, data.
- Mixed data from Japan, BOJ’s dovish play keeps buyers hopeful unless Fed disappoints markets with less than 0.75% rate hike.
USD/JPY grinds higher past 148.00 during the second consecutive positive day, up 0.45% while retreating from the daily high of 148.26. The yen pair’s latest inaction could be linked to the market’s mixed sentiment, as well as anxiety ahead of the Federal Open Market Committee (FOMC) meeting announcements and the US jobs report for October.
That said, the US 10-year Treasury yields seesaw near 4.00% after snapping the 10-week uptrend by the end of Friday. Also challenging the USD/JPY traders is the mixed moves of the equities as the US equity future prints mild losses even after Dow Jones braces for the biggest monthly jump since 1976.
Earlier in the day, Japan’s Industrial Production came downbeat for September but Retail Sales defended the yen optimists. “Japan's factory output fell in September for the first time in four months as manufacturers grappled with rising raw materials costs and global economic slowdown, and is likely to fall again next month before picking up in November, the government said,” per Reuters.
Elsewhere, news of Macau’s lockdown of a casino resort and fears emanating from Russia underpin the USD/JPY upside, due to the US dollar’s safe-haven status. “Russia, which invaded Ukraine on Feb. 24, halted its role in the Black Sea deal on Saturday for an ‘indefinite term’ because it could say it could not ‘guarantee the safety of civilian ships’ traveling under the pact after an attack on its Black Sea fleet,” reported Reuters. On the other hand, the concerns that the Fed might discuss slowing down on the rate hikes from December seem to challenge the pair buyers of late.
It should, however, be noted that the Bank of Japan’s (BOJ) hesitance to alter the monetary policy versus the Fed’s hawkish mood keeps the USD/JPY buyers hopeful.
Technical analysis
Although a two-day-old ascending trend line keeps USD/JPY buyers hopeful unless the quote breaks the 146.90 support, the 200-HMA challenges the yen pair’s upside momentum near 148.40.
-
02:30
Commodities. Daily history for Friday, October 28, 2022
Raw materials Closed Change, % Silver 19.26 -1.58 Gold 1645.11 -1.02 Palladium 1896.75 -2.19 -
02:17
AUD/JPY Price Analysis: Retreats from weekly hurdle on softer China PMI
- AUD/JPY reverses from intraday high on downbeat China PMIs, unchanged Aussie Retail Sales favored buyers earlier in the day,
- RSI retreat jostles with bullish MACD signals to confuse traders but sustained trading above 200-HMA favor bulls.
- Multiple levels to challenge buyers beyond the monthly high.
AUD/JPY pares intraday gains while taking offers at around 94.90 during Monday’s Asian session. In doing so, the cross-currency pair takes a U-turn from the one-week-old symmetrical triangle’s resistance line after downbeat China PMI data.
China’s official NBS Manufacturing PMI for October dropped to 49.2 versus 50.0 expected and 50.1 prior. Further, the Non-Manufacturing PMI also slumped to 48.7 compared to 51.9 market forecasts and 50.6 previous readings. “China's factory activity unexpectedly fell in October, an official survey showed on Monday, weighed by softening global demand and strict COVID-19 restrictions, which hit production,” said Reuters following the data.
It should be noted, however, that the room for the quote’s further downside appears limited as the RSI (14) challenges the bullish MACD signals.
That said, the AUD/JPY bears may currently aim for the lower line of the stated triangle, close to 94.50. However, the 200-HMA level surrounding 94.40 could challenge the pair’s further downside.
On the contrary, an upside break of the immediate resistance line, forming part of the stated triangle near 95.10, will need validation from the daily top surrounding 95.15 to convince AUD/JPY buyers. Following that, a run-up toward the monthly high of 95.73 can’t be ruled out.
To sum up, the data-directed moves of the AUD/JPY appear ephemeral as technical details challenge the bears.
AUD/JPY: Hourly chart

Trend: Limited downside expected
-
02:08
USD/CAD Price Analysis: Bears eye a move lower in descending channel
- USD/CAD bears are in play but the resistance is holding.
- The bears eye a move lower withing the descending channel.
USD/CAD is in the hands of the bears within a descending channel on the daily time frame as the following analysis will illustrate. The price is recently come up for air but should the resistance hold up, there will be prospects of a move lower for the days ahead.
USD/CAD daily chart
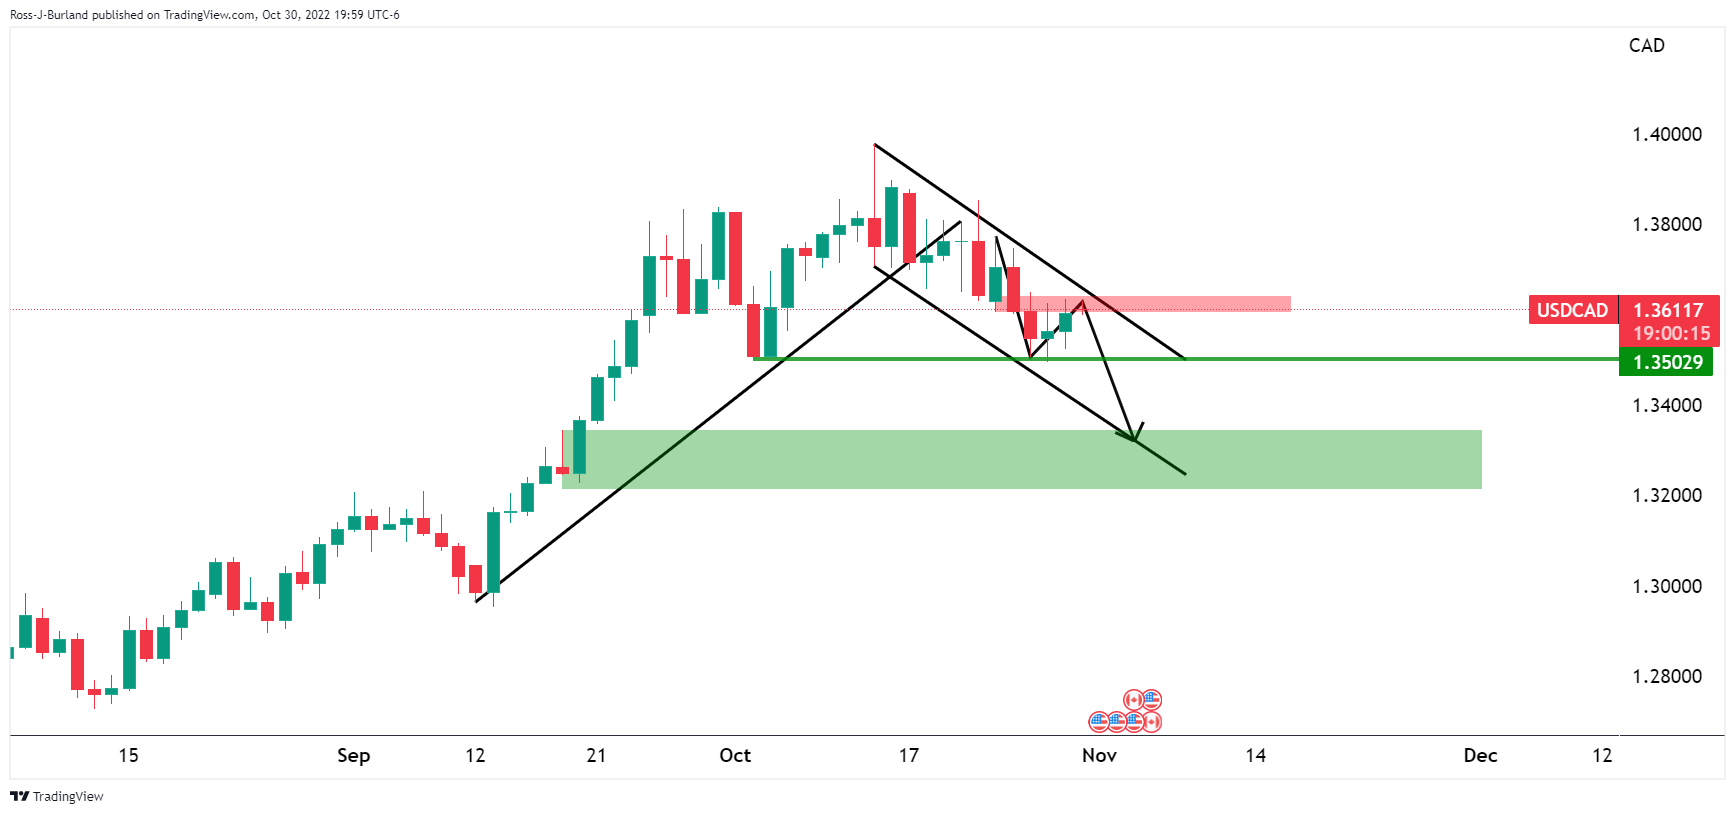
The price is testing a key horizontal resistance area currently and should this hold, a break of the support structure will open the prospects of a move towards 1.3200 for the week ahead.
USD/CAD H1 chart
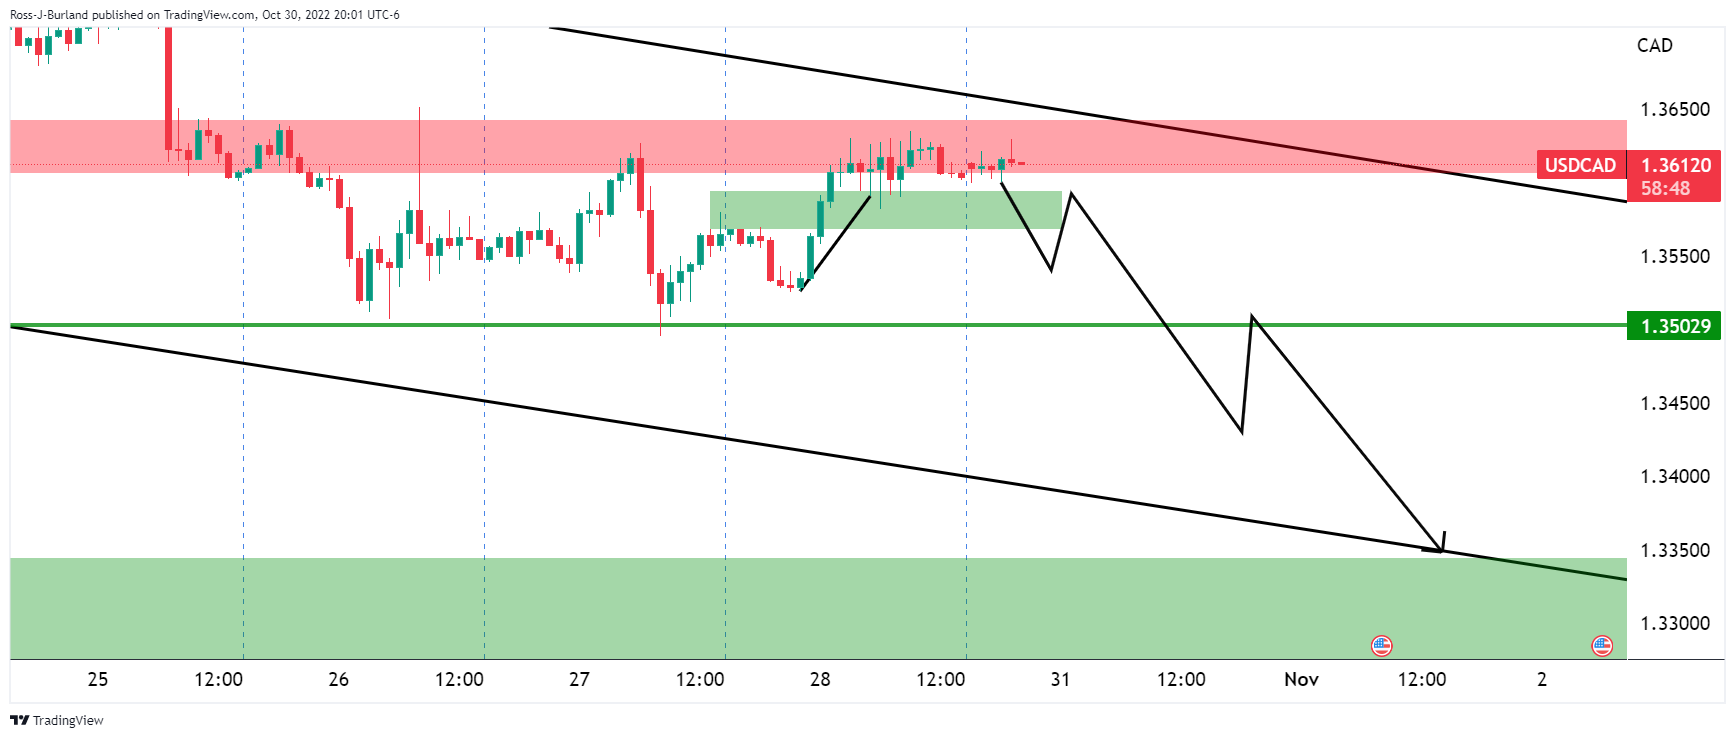
Meanwhile, the hourly coil needs to give yet there is little sign of that happening any time soon. The price may need to test deeper to the upside although a break of 1.3660 will likely seal the deal for an imminent move lower.
-
01:58
NZD/USD struggles around 0.5800 amid downbeat Chinese PMI data
- NZD/USD is displaying topsy-turvy moves after a downbeat release of China’s PMI data.
- China’s Manufacturing PMI slipped to 49.2 vs. 50.0 while Non-Manufacturing PMI dropped to 48.7 vs. 51.9 as expected.
- Kiwi’s weak projections for the labor cost index could dent the sentiment of households.
The NZD/USD pair has sensed selling pressure while attempting to overstep the critical hurdle of 0.5810 in the Tokyo session. The asset has witnessed stiff hurdles amid surpassing the immediate resistance of 0.5810. Downbeat Chinese PMI data weigh on kiwi bulls in collaboration with a rebound in risk-off mood amid accelerating anxiety ahead of the Federal Reserve (Fed)’s monetary policy.
China’s official Manufacturing PMI has landed lower at 49.2 vs. the projections of 50.0 and the prior release of 50.1, reported by the National Bureau of Statistics. Also, the Non-Manufacturing PMI has been recorded as significantly lower at 48.7 against the expectations of 51.9 and the former release of 50.6. It seems that the continuation of the no-tolerance Covid-19 policy has weighed pressure on economic activities.
The risk aversion theme is gaining traction as yields have rebounded after a bumpy ride. The 10-year US Treasury yields have accelerated to 4.05% while the S&P500 futures have extended their losses.
Also, the Fed is expected to hike interest rates by 75 basis points (bps) for the fourth time.
This week, the kiwi employment data will also remain in focus. The Employment Change for the third quarter is seen at 0.5% against the former print of 0%. While the Unemployment Rate could trim to 3.2% vs. 3.3% released earlier. The catalyst that could dampen the sentiment of households is a decline in the labor cost index, which is seen lower at 1% against the prior release of 1.3%.
Price pressures are skyrocketing in the kiwi economy and households need higher earnings to payout inflation-adjusted goods and services. Lower expansion in earnings would be unable to offset higher expenses, which could result in a slower demand in the NZ zone.
-
01:57
USD/CNH grinds higher past 7.2800 as China PMIs fall, Fed’s move, US NFP eyed
- USD/CNH picks up bids to print three-day uptrend.
- China’s official Non-Manufacturing PMI dropped to the lowest levels since May, marked the first contraction in five monthly.
- Covid woes, hawkish Fed bets add strength to the bullish bias.
- FOMC needs to defend further rate hikes to overcome bearish expectations.
USD/CNH keeps buyers on the table for the third consecutive day to Monday, up 0.23% intraday near 7.2850 by the press time, as China’s monthly activity data disappoints the offshore Chinese yuan (CNH) buyers. Also keeping the pair buyers hopeful are the concerns surrounding covid woes in the dragon nation and the fears of the hawkish Fed move.
That said, China’s official NBS Manufacturing PMI for October dropped to 49.2 versus 50.0 expected and 50.1 prior. Further, the Non-Manufacturing PMI also slumped to 48.7 compared to 51.9 market forecasts and 50.6 previous readings. “China's factory activity unexpectedly fell in October, an official survey showed on Monday, weighed by softening global demand and strict COVID-19 restrictions, which hit production,” said Reuters following the data.
The news of Macau’s lockdown of a casino resort and fears emanating from Russia also underpin the USD/CNH upside, due to the US dollar’s safe-haven status. “Russia, which invaded Ukraine on Feb. 24, halted its role in the Black Sea deal on Saturday for an ‘indefinite term’ because it could say it could not ‘guarantee the safety of civilian ships’ traveling under the pact after an attack on its Black Sea fleet,” reported Reuters.
It’s worth noting that the US Treasury yields are directionless after a downbeat weak and the US equity future print mild losses even after Dow Jones braces for the biggest monthly jump since 1976. Further, the US Dollar Index (DXY) prints a three-day uptrend around 110.80, up 0.10% intraday by the press time.
To sum up, the USD/CNH bulls may keep the reins amid comparatively weaker fundamentals of China versus the US. Even so, the looming concerns that the Fed might discuss slowing down on the rate hikes from December seem to challenge the pair buyers of late.
Technical analysis
A one-week-old horizontal resistance area surrounding 7.3000-3040 restricts short-term USD/CNH upside.
-
01:39
AUD/USD drops back to 0.6400 on downbeat China PMI, focus on RBA, Fed
- AUD/USD remains mildly bid after upbeat China PMIs for October.
- No disappointment from Aussie Retail Sales, mixed sentiment earlier favored bulls.
- RBA versus Fed divergence will be crucial as hawks could dominate on Wednesday’s FOMC while Aussie policymakers may hesitate.
AUD/USD reverses from intraday high with a 15-pip fall to 0.6402 as China’s activity numbers recalled bears after an upbeat start to the key week. The pair’s latest weakness also prints the three-day downtrend by the press time.
China’s official NBS Manufacturing PMI for October dropped to 49.2 versus 50.0 expected and 50.1 prior. Further, the Non-Manufacturing PMI also slumped to 48.7 compared to 51.9 market forecasts and 50.6 previous readings. Earlier in the day, Australia’s Retail Sales for September reprinted the 0.6% figures while matching the market forecasts.
Elsewhere, sluggish Treasury yields join mildly offered US stock futures and the market’s anxiety ahead of this week’s monetary policy meeting of the US Federal Reserve (Fed) and the Reserve Bank of Australia (RBA) to challenge the AUD/USD moves.
Furthermore, covid woes in China escalate as Macau locked down a casino resort. On the same line could be the fears emanating from Russia’s retreat from the grain deal. “Russia, which invaded Ukraine on Feb. 24, halted its role in the Black Sea deal on Saturday for an ‘indefinite term’ because it could say it could not ‘guarantee the safety of civilian ships’ traveling under the pact after an attack on its Black Sea fleet,” reported Reuters.
Amid these plays, the US Treasury yields are directionless after a downbeat weak and the US equity future print mild losses even after Dow Jones braces for the biggest monthly jump since 1976. Further, the US Dollar Index (DXY) prints a three-day uptrend around 110.80, up 0.10% intraday by the press time.
Moving on, the second-tier activity data from the US can entertain AUD/USD traders ahead of the RBA’s verdict, up for release on Tuesday. Should the Aussie central bank surprise markets by announcing a higher-than-expected 0.25% increase in the benchmark rate, the Aussie pair may reverse the latest downtrend.
Technical analysis
Unless breaking the 0.6370-60 support confluence, including the 21-DMA and a two-week-old ascending trend line, the AUD/USD pair may struggle to lure the bears.
-
01:39
China NBS Manufacturing and Non-Manufacturing PMIs (Oct): Disappointments rock AUD
The official Non-Manufacturing PMI and the Manufacturing Purchasing Managers Index PMIs have been released as follows:
- China October official services PMI falls to 48.7 vs 50.6 in September.
- China October official composite PMI 49.0.
- China October official manufacturing PMI at 49.2 (Reuters poll 50.0) vs 50.1 in September.
AUD/USD update
The price was stationary on domestic Retail Sales in line with expectations. However, there was a move at the turn of the hour which took the price to a fresh session high, well and truly closing the opening gap before the Chinese data was released to 0.6418.
However, we have seen a sharp drop in the data and it is also worth noting that Hang Seng China Index is heading for its lowest since 2005.
AUD/USD is under pressure in the red to 0.6405 with the day's lows eyed:

Why the data matters to traders
The monthly manufacturing PMI is released by China Federation of Logistics and Purchasing (CFLP) on the last day of every month. The official PMI is released before the Caixin Manufacturing PMI, which makes it even more of a leading indicator, highlighting the health of the manufacturing sector, considered as the backbone of the Chinese economy. The data is of high relevance for the financial markets throughout several asset classes, given China’s influence on the global economy.
China Federation of Logistics and Purchasing (CFLP) publishes the non-manufacturing PMI on a monthly basis. The gauge highlights the performance of China’s service sector, which has a significant impact on the global FX market, given the size of the Chinese economy. An expansion in the Chinese service sector activity points to signs of economic improvement and vice-versa.
-
01:30
China NBS Manufacturing PMI below expectations (50) in October: Actual (49.2)
-
01:30
China Non-Manufacturing PMI registered at 48.7, below expectations (51.9) in October
-
01:25
GBP/USD Price Analysis: Cable finds support at 20-EMA around 1.1600
- Cable bulls are eyeing more upside after a time correction to near the 20-EMA around 1.1600.
- The market mood seems still upbeat despite a rise in returns from US government bonds.
- The RSI (14) has shifted into the bullish range of 60.00-80.00, which indicates more upside ahead.
The GBP/USD pair has overstepped the immediate resistance of 1.1600 in the Asian session amid a subdued performance by the US dollar index (DXY). The DXY is performing lackluster in a limited range ahead of the monetary policy decision by the Federal Reserve (Fed).
Meanwhile, the risk-on impulse still seems solid despite an expansion in 10-year US Treasury yields to 4.05%. S&P500 futures have extended their losses to 0.3% after registering 4% weekly gains.
On a four-hour scale, pound bulls have displayed a perpendicular rally after a breakout of the symmetrical triangle chart pattern. The upward-sloping trendline of the chart pattern was placed from October 12 low at 1.0924 while the downward-sloping trendline was plotted from October 5 high at 1.1496.
The asset has rested after a sharp upside move to near the 20-period Exponential Moving Average (EMA) at 1.1580, which is providing a bargain opportunity to the market participants for the execution of longs. Also, the 50-period Exponential Moving Average (EMA) at 1.1400 is advancing, which adds to the upside filters.
Meanwhile, the Relative Strength Index (RSI) (14) is oscillating in a bullish range of 60.00-80.00, which indicates more upside ahead.
Going forward, a decisive break above Thursday’s high at 1.1640 will send the cable towards September 13 high at 1.1732, followed by the round-level resistance at 1.1900.
On the flip side, a downside below the round-level support of 1.1400 will drag the asset toward Tuesday’s low at 1.1269. A slippage below the latter will drag the cable towards a two-week low at 1.1060.
GBP/USD four-hour chart
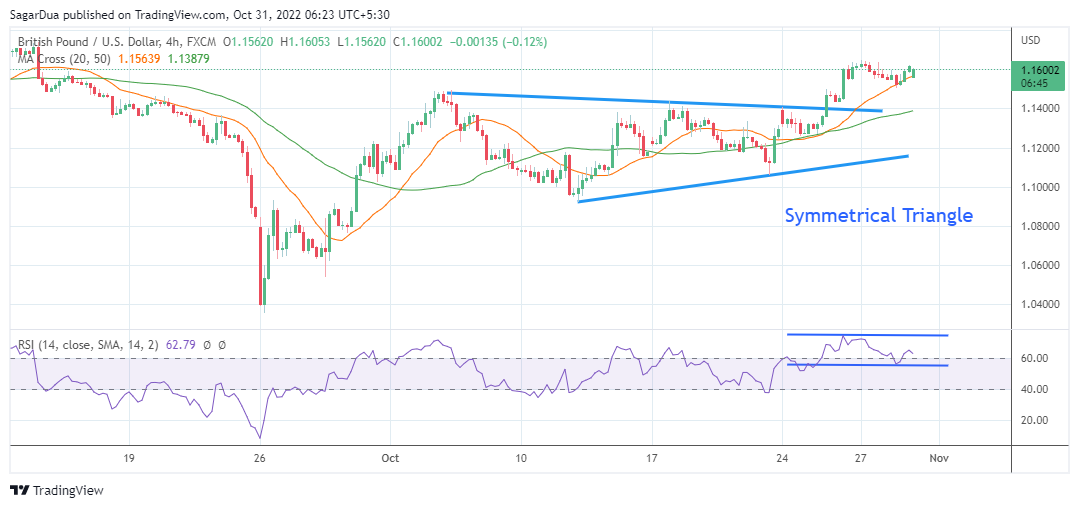
-
01:18
USD/CNY fix: 7.1768 vs. the last close of 7.2500
In recent trade today, the People’s Bank of China (PBOC) set the yuan (CNY) at 7.1768 vs. the last close of 7.2500. This is the weakest level since February 14, 2008.
About the fix
China maintains strict control of the yuan’s rate on the mainland.
The onshore yuan (CNY) differs from the offshore one (CNH) in trading restrictions, this last one is not as tightly controlled.
Each morning, the People’s Bank of China (PBOC) sets a so-called daily midpoint fix, based on the yuan’s previous day's closing level and quotations taken from the inter-bank dealer.
-
01:10
Gold Price Forecast: XAU/USD slides towards $1,638 support on firmer DXY ahead of Fed’s verdict, US NFP
- Gold price holds lower grind near intraday bottom, prints three-day downtrend around weekly horizontal support.
- Sour sentiment, hawkish Fed bets underpin US dollar as traders brace for the key data/events.
- Fed’s 75 bps move is price-in but clues for December will be crucial to watch for XAU/USD bears.
Gold price (XAU/USD) remains pressured towards $1,638 horizontal support during Monday’s Asian session, mildly offered by the press time. The yellow metal’s latest weakness could be linked to the US dollar’s broad strength amid the market’s risk-off mood, as well as anxiety ahead of the Federal Open Market Committee (FOMC) meeting results and the US jobs report for October.
While portraying the mood, the US Treasury yields are directionless after a downbeat weak and the US equity future print mild losses even after Dow Jones braces the biggest monthly jump since 1976. Further, the US Dollar Index (DXY) prints a three-day uptrend around 110.80, up 0.10% intraday by the press time.
Headlines surrounding the Russia-Ukraine grain deal with the United Nations (UN) seem to have challenged the risk appetite of late. “Russia, which invaded Ukraine on Feb. 24, halted its role in the Black Sea deal on Saturday for an ‘indefinite term’ because it could said it could not ‘guarantee safety of civilian ships’ traveling under the pact after an attack on its Black Sea fleet,” reported Reuters.
Also exerting downside pressure on the gold price could be Friday’s strong prints of the Fed’s preferred inflation gauge, namely the US Core Personal Consumption Expenditures (PCE) Price Index. However, the fifth quarterly fall in the US private consumption joins fears of the US Federal Reserve’s (Fed) slower rate hike starting from December to challenge the US dollar bulls. That said, economists at Goldman Sachs raised the Fed rates outlook and saw the peak at 5% in March. On the same line was the CME’s FedWatch Tool which suggests an 80% chance of the Fed’s 75 bps rate hike.
To sum up, gold prices are likely to remain pressured even as the market players expect hints of slower rate hikes from December during Wednesday’s FOMC.
Technical analysis
A sustained downside break of the 50-SMA joins bearish MACD signals and softer RSI (14), not oversold, to keep gold sellers hopeful of conquering the one-week-old horizontal support of around $1,638. Following that, a south-run towards the yearly low surrounding $1,614 and the $1,600 round figure appears on the table.
Meanwhile, an upside clearance of the 50-SMA resistance near $1,648 could trigger the XAU/USD rebound targeting the 200-SMA, around $1,665 by the press time. However, the 50% Fibonacci retracement of the pair’s September 12-28 downside, close to $1,675, precedes the monthly peak of $1,730, to challenge the gold buyers afterward.
Overall, gold remains bearish at the start of the key week.
Gold: Four-hour chart
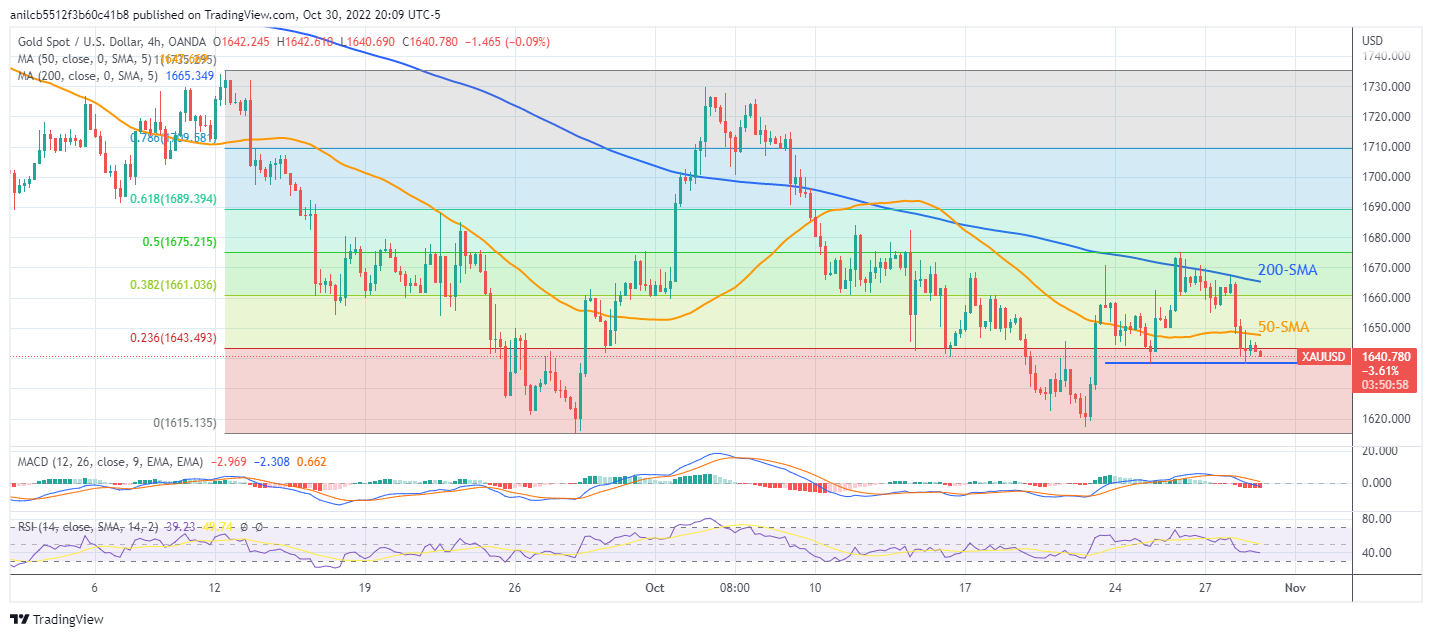
Trend: Further downside expected
-
00:47
AUD/USD remains sideways on flat Australian Retail Sales, RBA/Fed policy in focus
- AUD/USD oscillates above 0.6400 amid flat Australian Retail Sales data.
- A historic surge in inflation could compel the RBA to sound more hawkish.
- The Fed is set to hike interest rates by 75 bps for the fourth time.
The AUD/USD pair is displaying a lackluster performance despite the Australian Bureau of Statistics having reported the monthly Retail Sales data at 0.6% in line with the projections and the prior release. The Australian Retail Sales data is contaminated with mounting price pressures and unchanged retail sales indicate a decline in retail demand.
This week, the major event for Aussie investors will be the interest rate decision by the Reserve Bank of Australia (RBA). Last week, the Australian economy saw a historic surge in the inflation rate. Price growth in the third quarter landed at 7.3% against the projections of 7.0% and the prior release of 6.1%. As inflationary pressures have not displayed signs of exhaustion yet and also are increasing at an increasing rate, RBA Governor Philip Lowe could continue policy tightening further.
In October monetary policy, RBA policymakers voted for a lower rate hike to keep economic prospects steady while simultaneously working on the agenda of bringing price stability. It would be worth watching whether the RBA would continue October’s rate hike of 25 basis points (bps) or return to the 50 bps rate hike spell chosen earlier.
Meanwhile, the US dollar index (DXY) is near the day’s high at 110.8 as investors are shifting their focus toward the monetary policy of the Federal Reserve (Fed). The risk profile is turning averse as returns on US government bonds have accelerated. The 10-year US Treasury yields have recovered to 4.03%. While the S&P500 futures are facing a mild correction.
As price pressures have not displayed signs of a slowdown, the Fed will continue its ultra-hawkish tone and announce more policy-tightening measures. The Fed is expected to hike interest rates by 75 basis points (bps) consecutively for the fourth time.
-
00:34
EUR/USD Price Analysis: Bears struggle below the parity level
- EUR/USD remains sidelined, mildly offered, after printing two-week uptrend.
- Clear downside break of 21-SMA, one-week-old previous support favor sellers amid downbeat oscillators.
- Resistance-turned-support from early October restricts immediate downside.
EUR/USD struggles for clear directions around the mid-0.9900s even as bears keep the reins during Monday’s Asian session. In doing so, the major currency pair seesaws between the 21-SMA and the previous resistance line from October 07.
Given the bearish MACD signals and the downbeat RSI (14), not oversold, the EUR/USD prices are likely to extend the previous day’s downside break of the one-week-old ascending trend line, as well as the 21-SMA.
Hence, EUR/USD sellers could wait for a successful break of the 0.9960 immediate support line, previous resistance, for conviction.
Following that, a downward trajectory towards an upward-sloping trend line from September 27, close to 0.9755, appears more likely. During the fall, the 50% and 38.2% Fibonacci retracement level of the pair’s September-October downside, near 0.9870 and 0.9790 in that order, will be crucial intermediate levels to watch.
On the flip side, the 21-SMA hurdle surrounding the parity level of 1.0000 guards the EUR/USD pair’s immediate recovery before directing buyers towards the previous weekly resistance line, close to 1.0095 at the latest. It’s worth noting that the monthly high also strengthens the 1.0095 hurdle.
Should the EUR/USD bulls manage to cross the 1.0095 resistance, as well as the 1.0100 threshold, the odds of witnessing a rally towards the previous monthly peak near 1.0200 can’t be ruled out.
EUR/USD: Four-hour chart
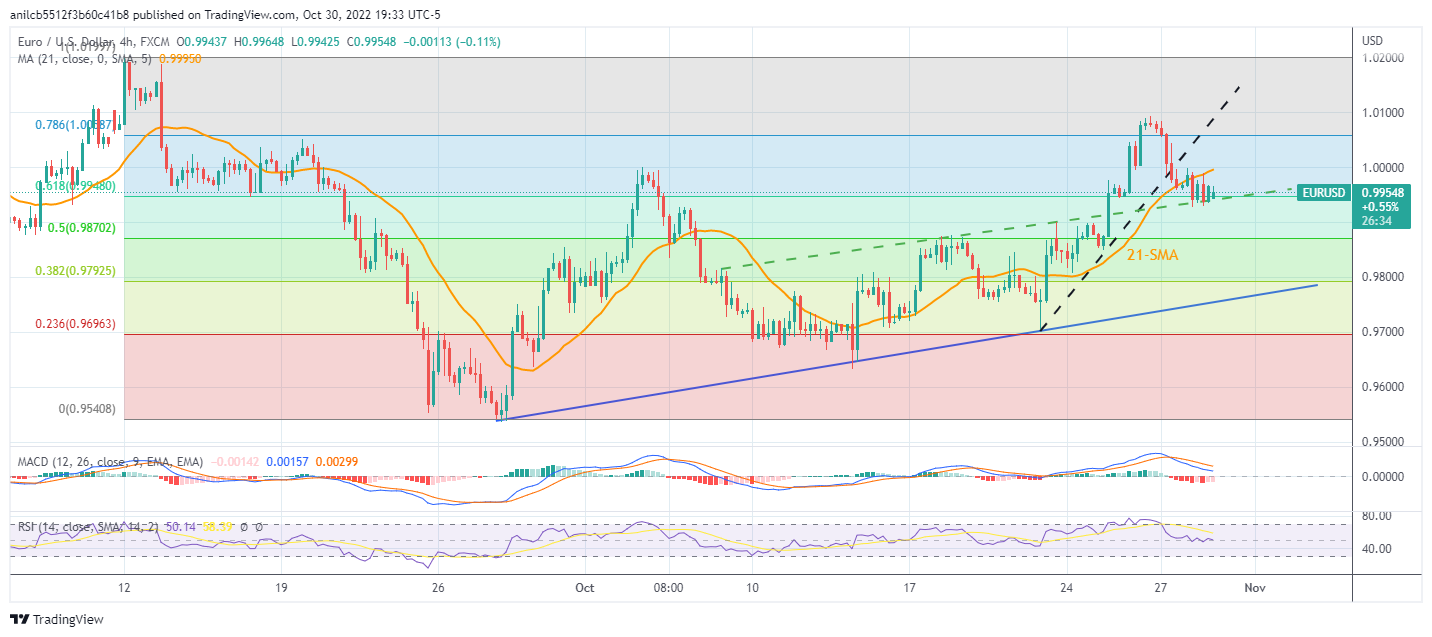
Trend: Further downside expected
-
00:32
Aussie Retail Sales arrive 0.6% as expected, no shakes in AUD/USD
Australia's Retail Sales growth has been released for September as follows:
0.6% vs. 0.6% expected and prior 0.6%.
AUD/USD update
Unchanged on the data and stable at 0.6405. The pair has stuck to a 0.609 and 0.6393 range for the day so far.
AUD/USD is below the dominant trendline but longs are in the market as per the past prior days of trade and inside bars of Wednesday's bullish candle and breakout.
AUD/USD daily & H1 chart
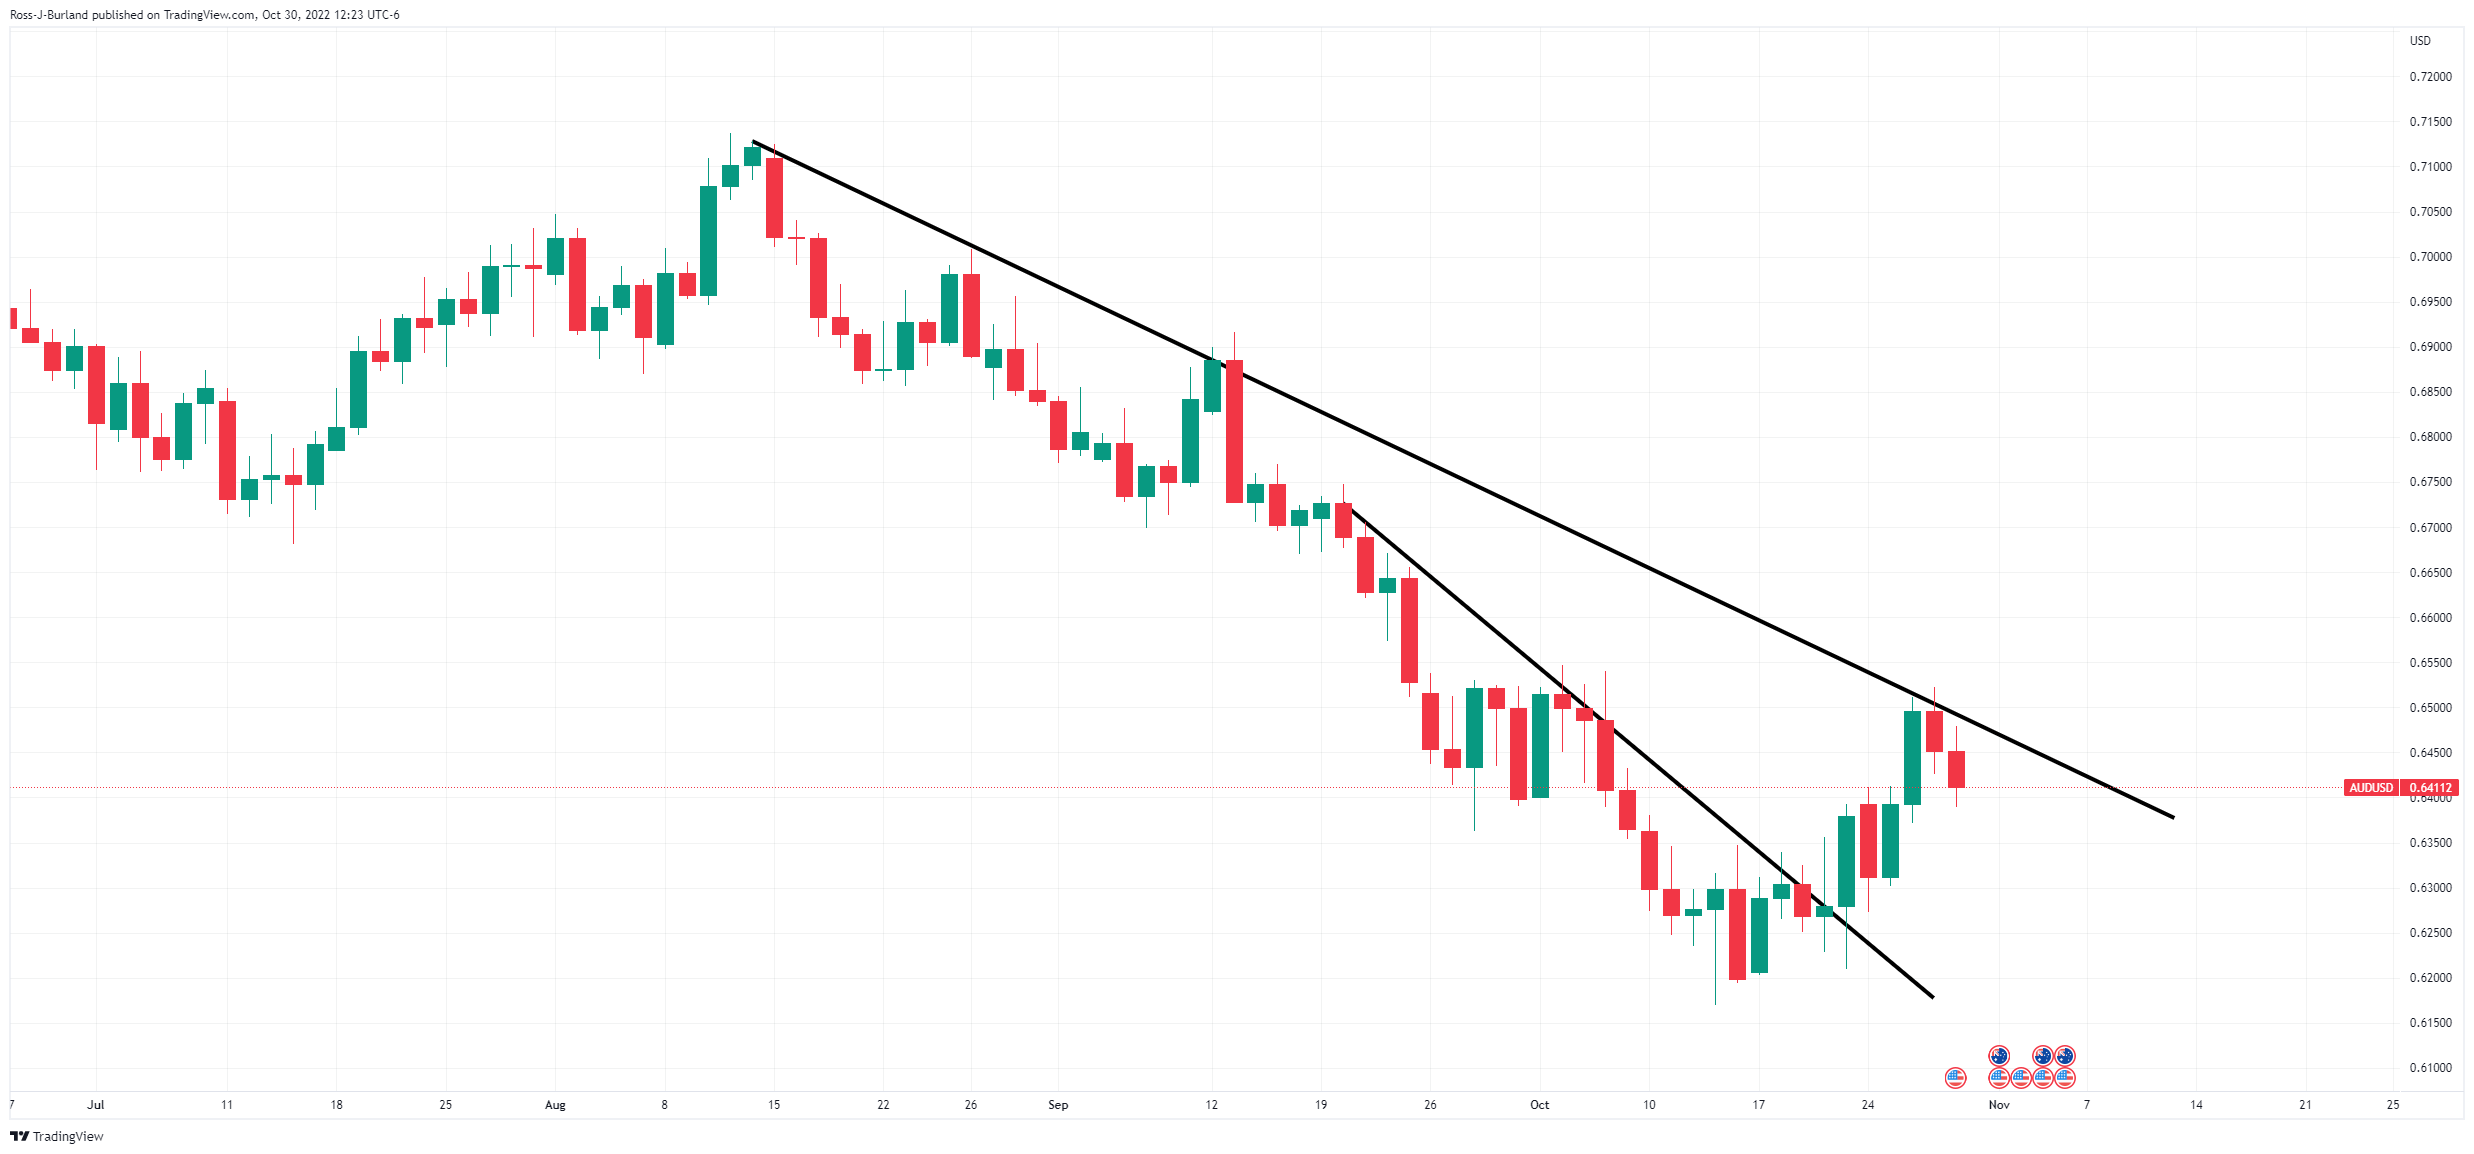
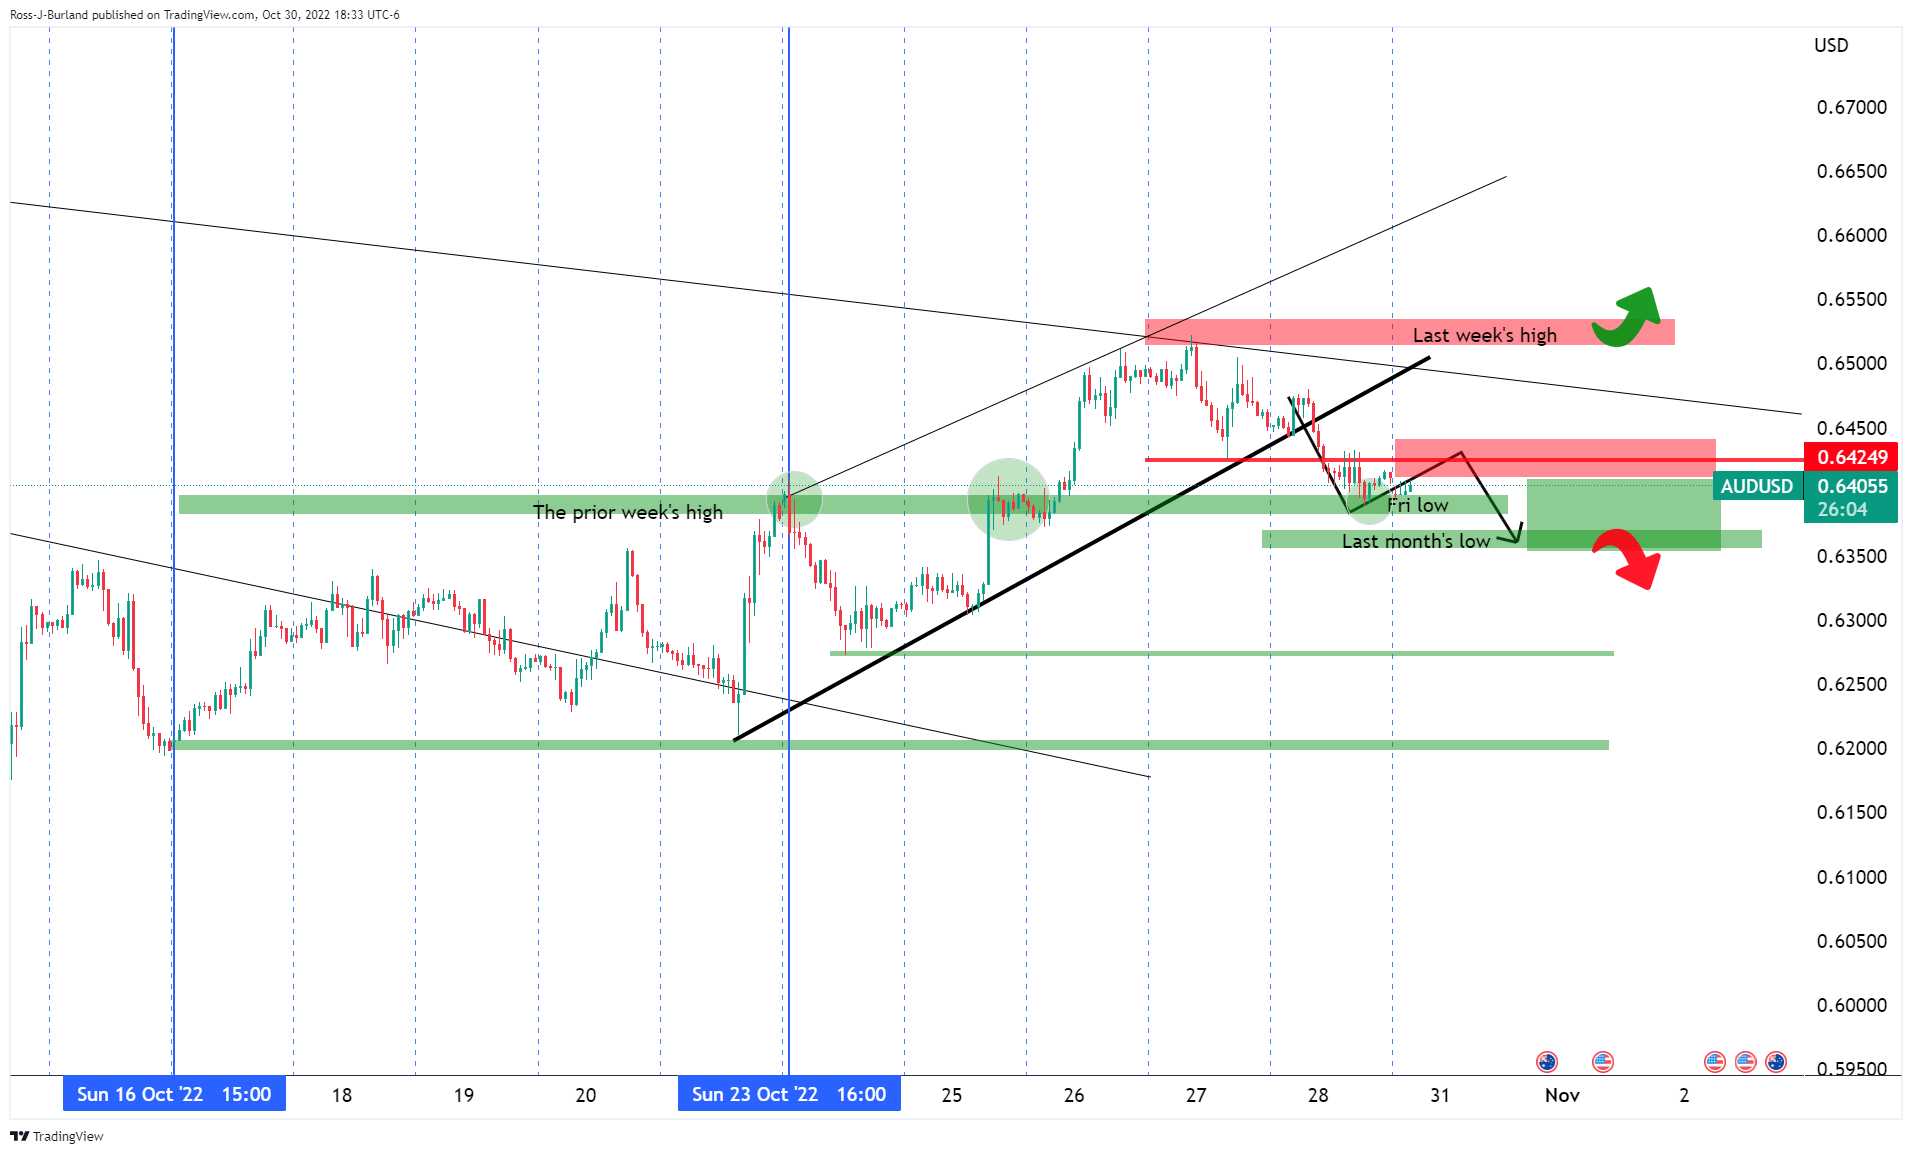
At this juncture, while on the backside of the trend, the bias is to the downside on a break of 0.6350.
About Aussie Retail Sales and why it matters
The Retail Sales released by the Australian Bureau of Statistics is a survey of goods sold by retailers based on a sampling of retail stores of different types and sizes and it's considered as an indicator of the pace of the Australian economy. It shows the performance of the retail sector over the short and mid-term. Positive economic growth anticipates bullish trends for the AUD, while a low reading is seen as negative or bearish.
The primary gauge of Australia’s consumer spending, Retail Sales, is released by the Australian Bureau of Statistics (ABS) about 35 days after the month ends. It accounts for approximately 80% of total retail turnover in the country and, therefore, has a significant bearing on inflation and GDP. This leading indicator has a direct correlation with inflation and growth prospects, impacting the Reserve Bank of Australia’s (RBA) interest rates decision and AUD valuation. The stats bureau uses the forward factor method, ensuring that the seasonal factors are not distorted by COVID-19 impacts
-
00:31
Australia Private Sector Credit (YoY) rose from previous 9.3% to 9.4% in September
-
00:30
Australia Private Sector Credit (MoM) came in at 0.7% below forecasts (0.8%) in September
-
00:30
Australia Retail Sales s.a. (MoM) meets forecasts (0.6%) in September
-
00:30
Stocks. Daily history for Friday, October 28, 2022
Index Change, points Closed Change, % NIKKEI 225 -240.04 27105.2 -0.88 Hang Seng -564.88 14863.06 -3.66 KOSPI -20.38 2268.4 -0.89 ASX 200 -59.4 6785.7 -0.87 FTSE 100 -26 7047.7 -0.37 DAX 32.1 13243.33 0.24 CAC 40 29.02 6273.05 0.46 Dow Jones 828.52 32861.8 2.59 S&P 500 93.76 3901.06 2.46 NASDAQ Composite 309.78 11102.45 2.87 -
00:26
GBP/JPY Price Analysis: Bulls take the price higher along the key dynamic support
- GBP/JPY bulls are in control, for the time being, and rising the trendline.
- The bears are waiting for a move below the critical support structure.
GBP/JPY has been breaking higher in the open on Monday and there are eyes for the 174.00s. However, for the near term, there are prospects of a correction and bears are waiting in the flanks for an opportunity to clean up the length that is vulnerable below 170.85 with 168.80 eyed. The following illustrates the market structures and bias on the weekly, daily and hourly charts.
GBP/JPY weekly chart
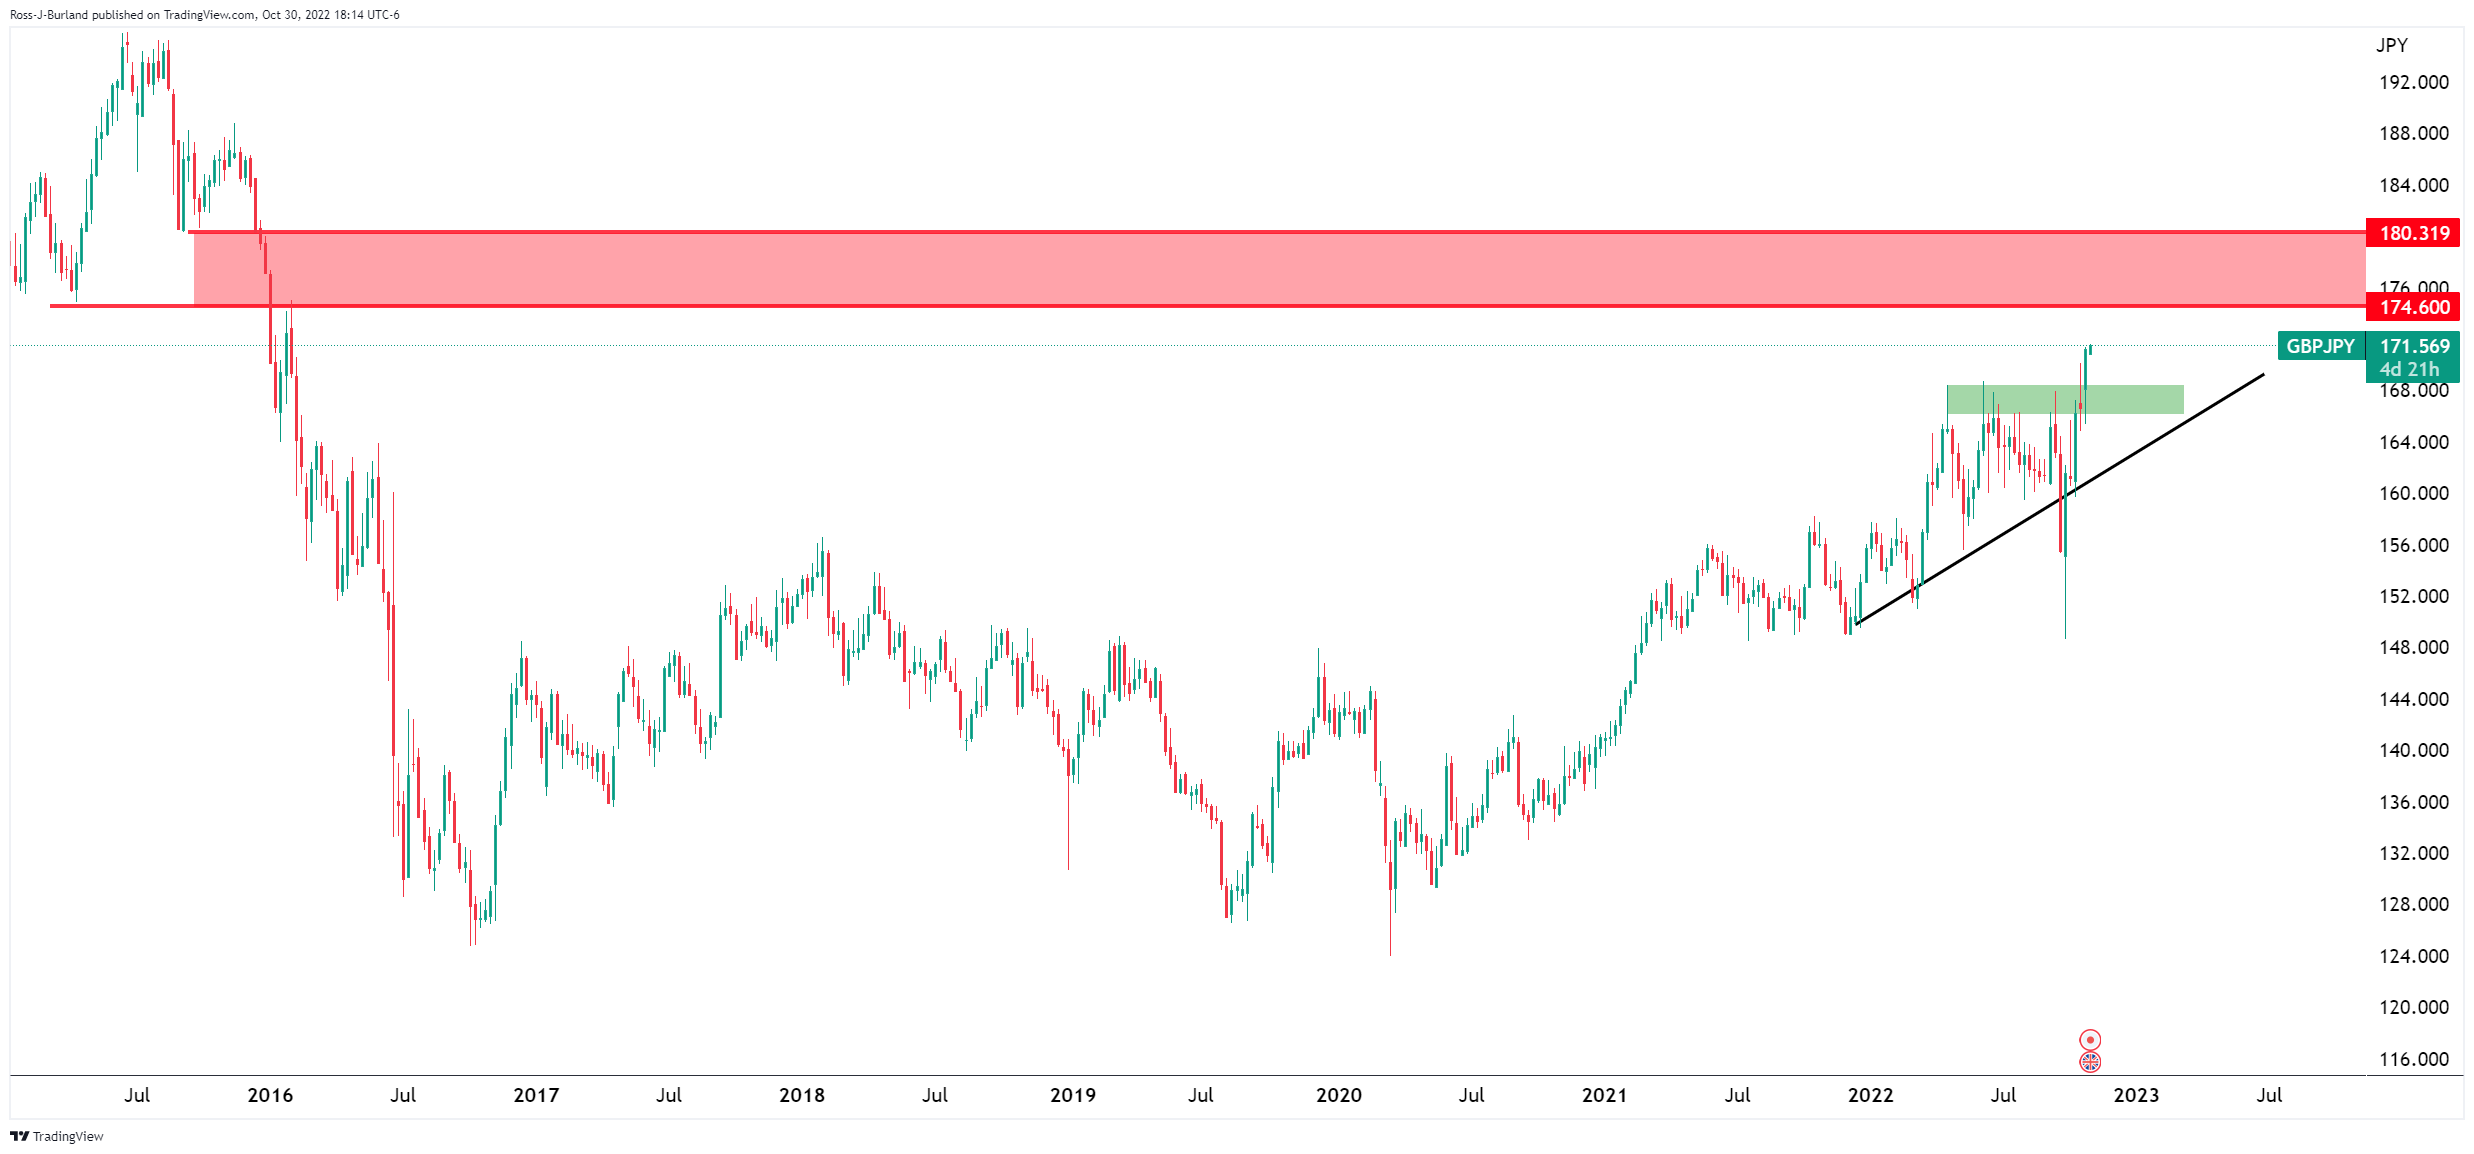
There is room for a move higher into weekly resistance while climbing the supporting trendline.
GBP/JPY daily chart
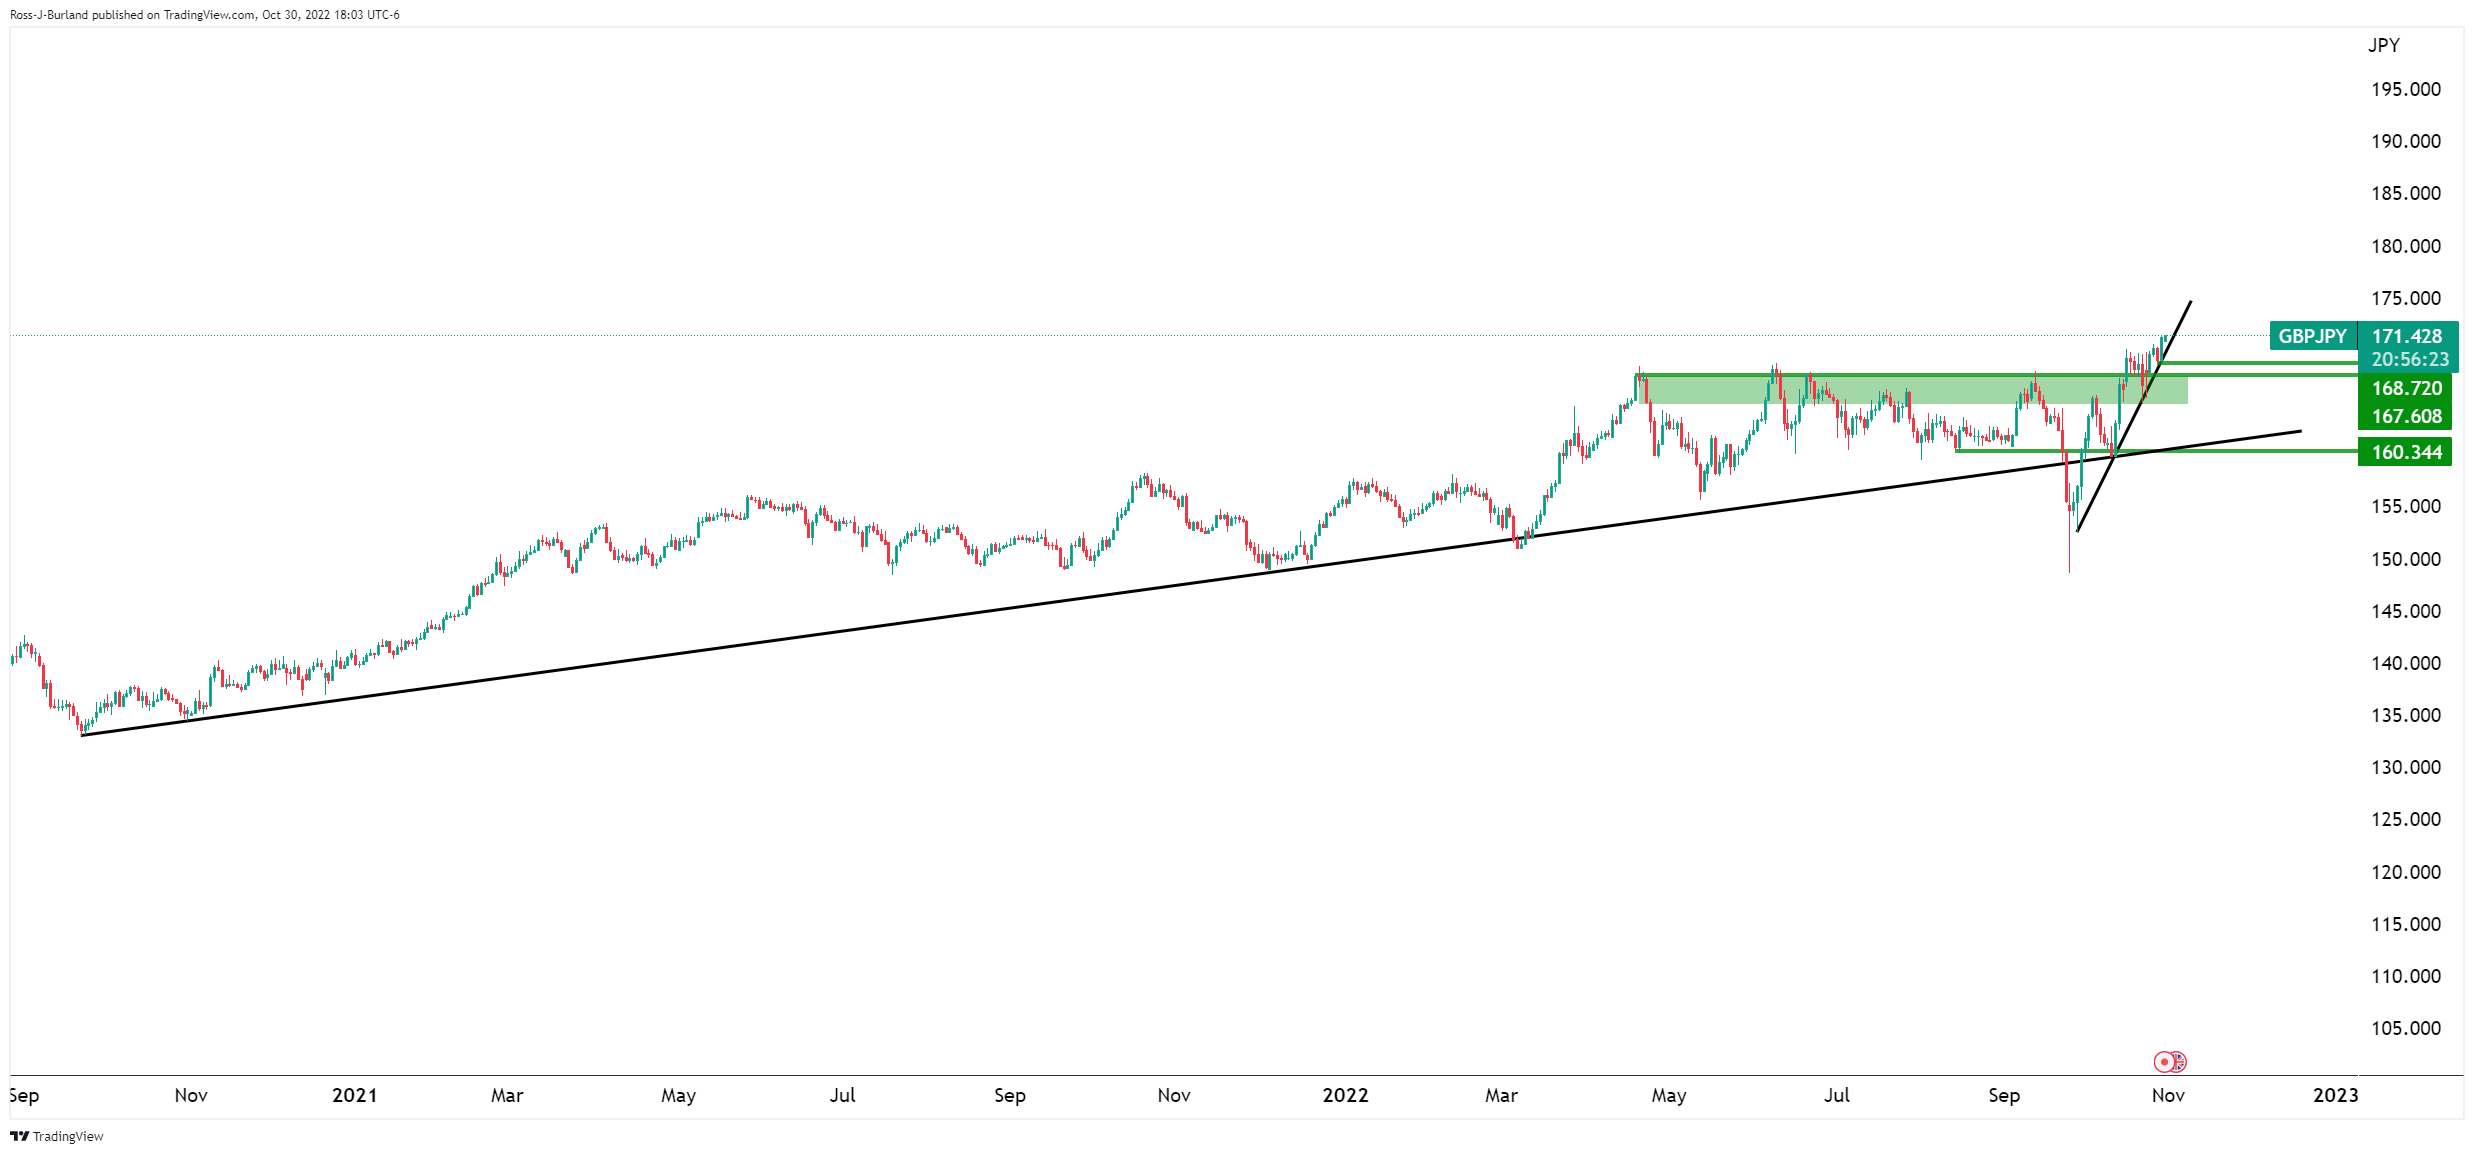
The daily chart shows that the price is hugging the trend but the price is decelerating on the bid.
GBP/JPY hourly chart
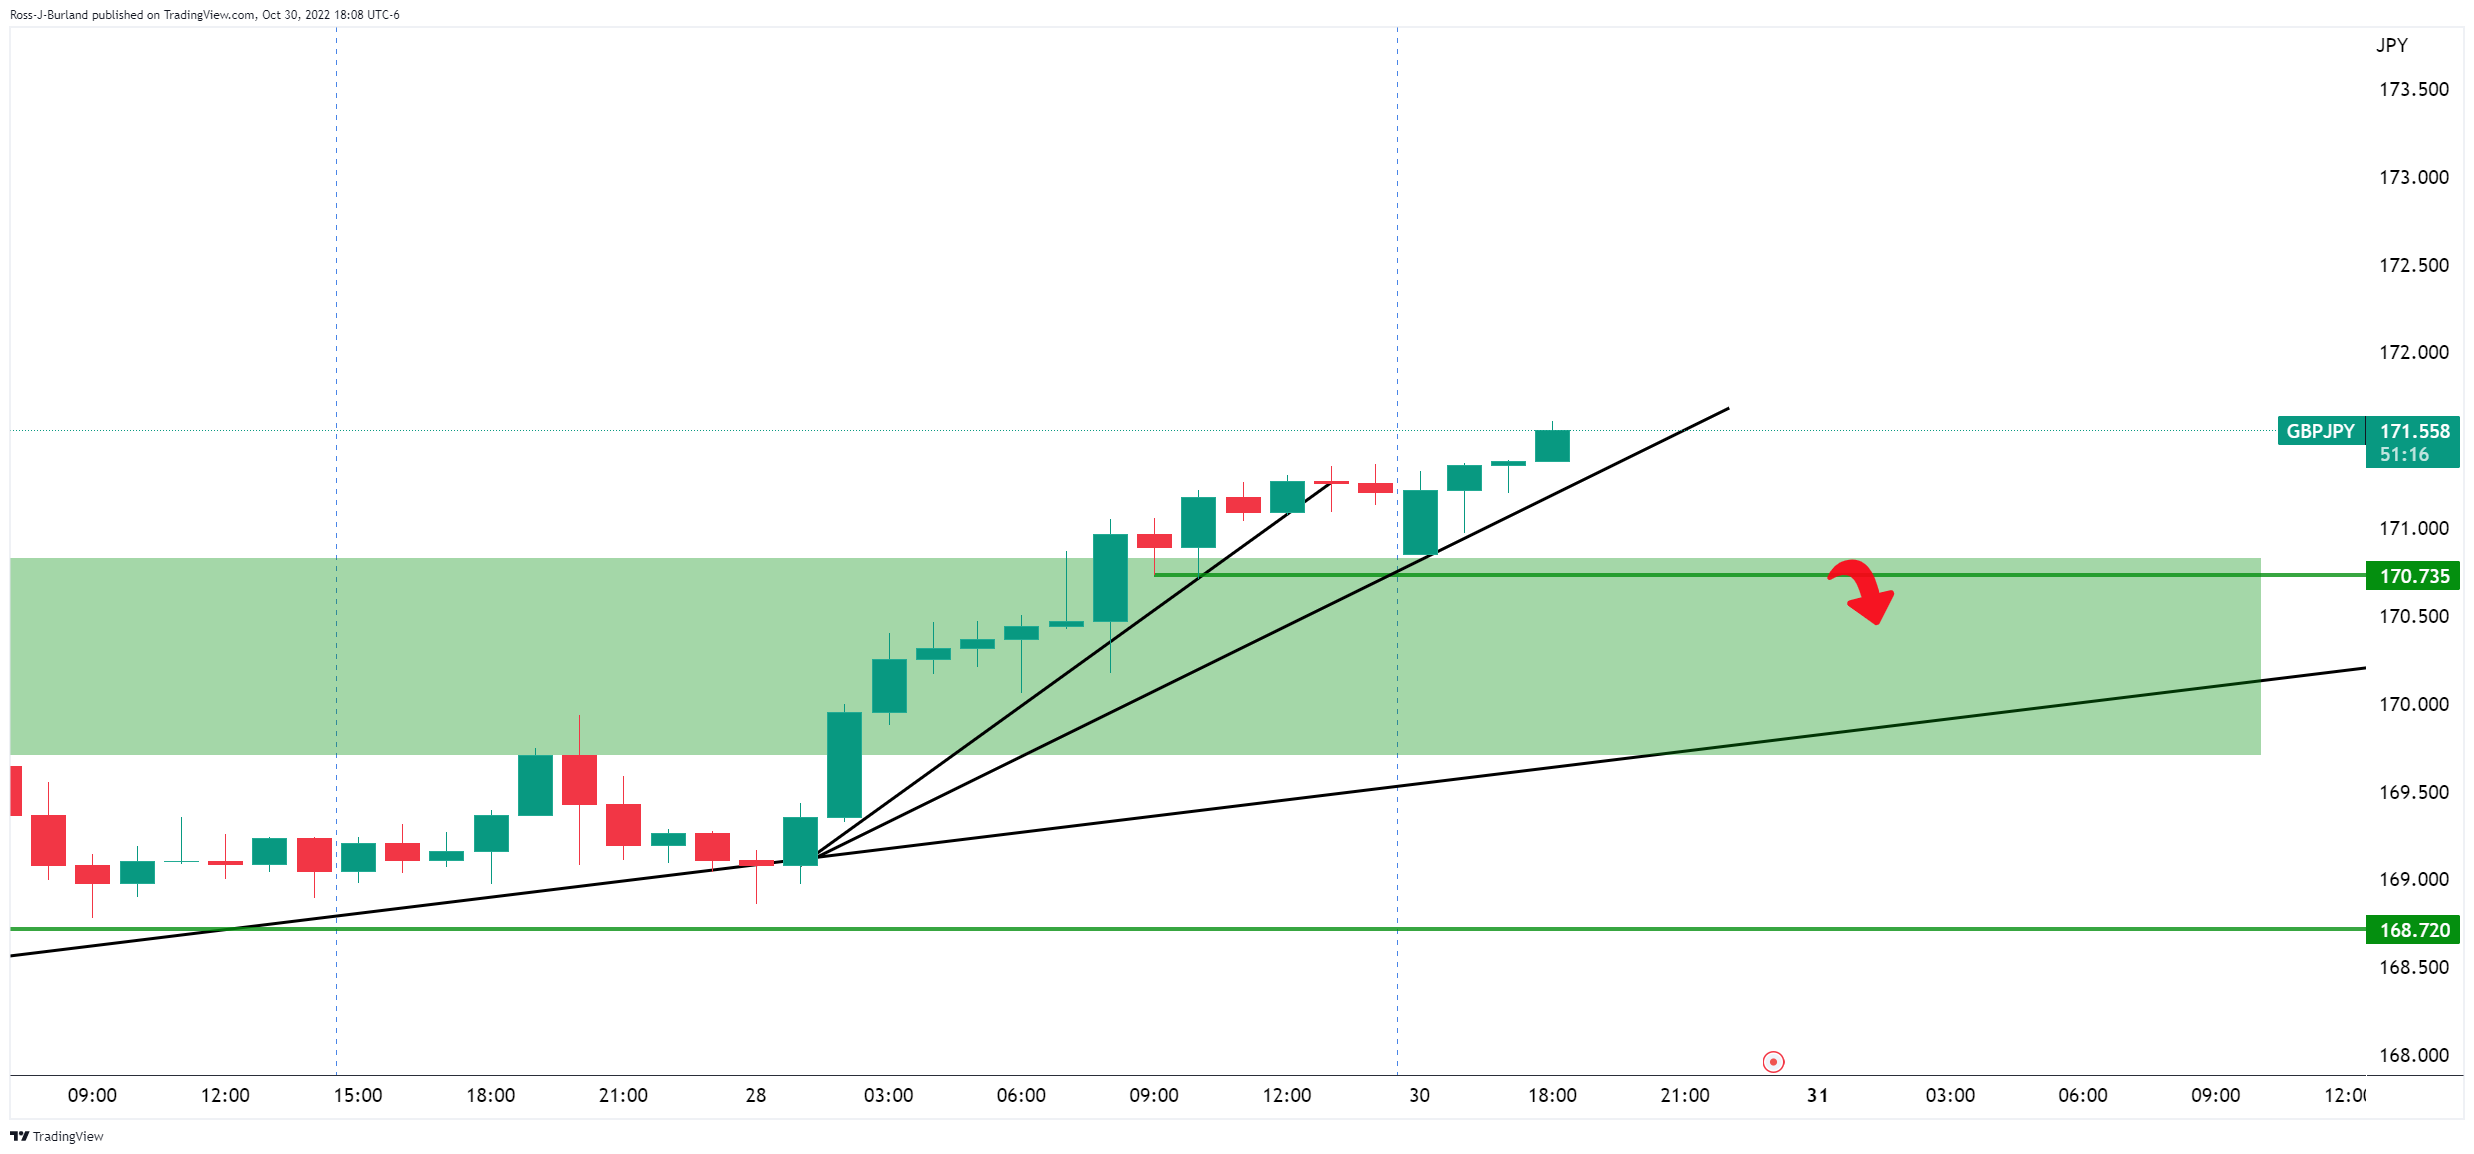
This is where the near-term opportunity might evolve. The price is reaching higher, but should there be a break of structure, there is plenty of length for the price to work through on the downside below the recent lows as marked on the chart at 170.85 with 168.80 eyed.
-
00:15
Currencies. Daily history for Friday, October 28, 2022
Pare Closed Change, % AUDUSD 0.6412 -0.62 EURJPY 146.986 0.8 EURUSD 0.9966 -0 GBPJPY 171.295 1.21 GBPUSD 1.16147 0.4 NZDUSD 0.58088 -0.28 USDCAD 1.3606 0.3 USDCHF 0.99597 0.57 USDJPY 147.481 0.79 -
00:14
USD/JPY eyes more gains above 148.00 despite solid Japan Retail Sales data
- USD/JPY is expected to deliver decent gains above 148.00 as Fed policy hogs the limelight.
- Japan’s Retail Trade data have outperformed their preliminary estimates.
- BOJ’s continuation of a dovish stance is hurting the Japanese yen.
The USD/JPY pair is hovering around the immediate hurdle of 147.90 in the early Tokyo session. The asset is continuously struggling to surpass the above-mentioned hurdle from Friday and is expected to surpass the same despite solid Japan’s Retail Trade data.
The monthly and annual Retail Trade have accelerated to 1.1% and 4.5% vs. the projections of 0.6% and 4.1% respectively. The Larger Retail Sales have soared to 4.1% against the estimates of 3.6%. Apart from that, annual Industrial Production has climbed to 9.8% in comparison to the consensus of 8.7%.
Meanwhile, the US dollar index (DXY) is displaying signs of volatility contraction in a 110.73-110.85 range as investors have shifted their focus to the interest rate decision by the Federal Reserve (Fed), which is due on Wednesday. The risk impulse is extremely upbeat despite a marginal fall in S&P500 futures as the index ended last week with significant gains amid the quarterly result season. The 10-year US Treasury yields have extended to 4.02% as Fed’s policy is shifting into the spotlight.
This week, the Fed is expected to hike its interest rates one more time by 75 basis points (bps) as price pressures have not reflected serious signs of a slowdown. A fourth consecutive 75 bps rate hike will push the interest rates to 3.75-4.00%.
What is hurting the Japanese yen is the ultra-dovish stance taken by the Bank of Japan (BOJ) in its monetary policy action on Friday. Citing external demand shocks and the inability in returning to pre-pandemic growth levels responsible, BOJ Governor Haruhiko Kuroda kept principle rates unchanged.
-
00:14
US Dollar Index bulls approach 111.00 amid risk aversion, pre-Fed anxiety ahead of NFP
- DXY picks up bids to print three-day uptrend despite snapping four-month winning streak.
- Geopolitical concerns join hawkish Fed bets to propel US dollar’s haven demand.
- Fed’s 75 bps rate hike is priced-in, which in turn highlights clues for Fed’s moves past December for fresh impulse.
US Dollar Index (DXY) extends the previous week’s rebound from a monthly low, mildly bid near 110.80 during Monday’s Asian session. In doing so, the greenback’s gauge versus the six major currencies benefits from the market’s rush for risk safety ahead of the key US data/events, as well as due to the fears emanating from the geopolitical concerns.
Headlines surrounding the Russia-Ukraine grain deal with the United Nations (UN) seem to have challenged the risk appetite of late. “Russia, which invaded Ukraine on Feb. 24, halted its role in the Black Sea deal on Saturday for an ‘indefinite term’ because it could said it could not ‘guarantee safety of civilian ships’ traveling under the pact after an attack on its Black Sea fleet,” reported Reuters.
Also keeping the DXY firmer was Friday’s strong prints of the Fed’s preferred inflation gauge, namely the US Core Personal Consumption Expenditures (PCE) Price Index. However, the fifth quarterly fall in the US private consumption joins fears of the US Federal Reserve’s (Fed) slower rate hike starting from December to challenge the US dollar bulls.
Recently, economists at Goldman Sachs raised the Fed rates outlook and saw the peak at 5% in March. On the same line was the CME’s FedWatch Tool which suggests an 80% chance of the Fed’s 75 bps rate hike during Wednesday’s Federal Open Market Committee (FOMC).
Amid these plays, the yields were down and the US equities braced for a good month with Dow Jones bracing the biggest monthly jump since 1976. Further, the S&P 500 Futures remain mildly offered near 3,910 amid the sluggish markets.
Looking forward, Wednesday’s Federal Open Market Committee (FOMC) will be crucial for DXY as traders seek the Fed’s next moves amid 75 bps rate expectations for this week’s meeting. Also important will be Friday’s US jobs report for October.
Technical analysis
50-DMA challenges short-term DXY recovery around 110.95 before challenging the previous support line from August, now the key resistance near 112.00. Meanwhile, sellers could aim for bearish moves past 110.00.
-
00:10
Australia TD Securities Inflation (YoY) increased to 5.2% in October from previous 5%
-
00:09
Australia TD Securities Inflation (MoM) dipped from previous 0.5% to 0.4% in October
-