Market news
-
23:53
Japan: BoJ Tankan. Non-Manufacturing Index, Quarter IV 18 (forecast 19)
-
23:50
Japan: BoJ Tankan. Manufacturing Index, Quarter IV 10 (forecast 10)
-
23:30
Australia: Westpac Consumer Confidence, December -3.9%
-
23:28
Currencies. Daily history for Dec 13’2016:
(pare/closed(GMT +3)/change, %)
EUR/USD $1,0624 -0,09%
GBP/USD $1,2656 -0,17%
USD/CHF Chf1,012 -0,11%
USD/JPY Y115,17 +0,13%
EUR/JPY Y122,38 +0,06%
GBP/JPY Y145,76 -0,01%
AUD/USD $0,7498 +0,04%
NZD/USD $0,7202 +0,19%
USD/CAD C$1,3129 0,00%
-
23:00
Schedule for today,Wednesday, Dec 14’2016 (GMT0)
00:30 Australia New Motor Vehicle Sales (MoM) November -2.4%
00:30 Australia New Motor Vehicle Sales (YoY) November 1.2%
04:30 Japan Industrial Production (MoM) (Finally) October 0.6% 0.1%
04:30 Japan Industrial Production (YoY) (Finally) October 1.5% -1.3%
08:15 Switzerland Producer & Import Prices, m/m November 0.1%
08:15 Switzerland Producer & Import Prices, y/y November -0.2%
09:30 United Kingdom Average earnings ex bonuses, 3 m/y October 2.4% 2.6%
09:30 United Kingdom Average Earnings, 3m/y October 2.3% 2.3%
09:30 United Kingdom Claimant count November 9.8 5
09:30 United Kingdom ILO Unemployment Rate October 4.8% 4.8%
10:00 Eurozone Industrial production, (MoM) October -0.8% 0.2%
10:00 Eurozone Industrial Production (YoY) October 1.2% 1%
10:00 Switzerland Credit Suisse ZEW Survey (Expectations) December 8.9
13:30 U.S. Retail sales November 0.8% 0.3%
13:30 U.S. Retail Sales YoY November 4.3%
13:30 U.S. Retail sales excluding auto November 0.8% 0.4%
13:30 U.S. PPI, m/m November 0.0% 0.1%
13:30 U.S. PPI, y/y November 0.8% 0.9%
13:30 U.S. PPI excluding food and energy, m/m November -0.2% 0.2%
13:30 U.S. PPI excluding food and energy, Y/Y November 1.2% 1.3%
14:15 U.S. Capacity Utilization November 75.3% 75.1%
14:15 U.S. Industrial Production (MoM) November 0.0% -0.2%
14:15 U.S. Industrial Production YoY November -0.9%
15:00 U.S. Business inventories October 0.1% -0.1%
15:30 U.S. Crude Oil Inventories December -2.389
19:00 U.S. Fed Interest Rate Decision 0.5%
19:00 U.S. FOMC Economic Projections
19:00 U.S. FOMC Statement
19:30 U.S. Federal Reserve Press Conferenc
21:30 New Zealand Business NZ PMI November 55.2
-
15:47
TD is buying USD/CAD dips below 1.31 on stretched valuation
"The songs remains the same for CAD: short covering rally buffeted diverging policy rates. The short squeeze is strongly rooted in the recovery in oil prices following a string of positive news headlines about production cuts. Many have wondered why USDCAD has lagged oil prices but we note that correlation between USDCAD and oil has recently broken down. For instance, oil price levels have only explained about 10% of the variance in USDCAD over the past 3m and close to zero over the past six months. This compares to about 50% over the past year but that number drops to around 35% when you look at the percentage return in USDCAD and oil.
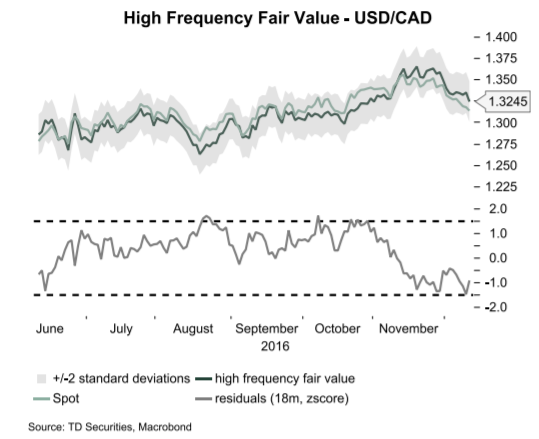
Even so, we believe that the importance of rate differentials and relative output gaps explains the breakdown in oil. Indeed, the BoC still sees about 1.5% worth of slack in the economy while most measures argue that the US economy is close to full capacity. Normally, both countries cycles move is lock-step. However, a mix of cyclical and structural factors have gnawed away at that relationship. This leaves us focused on rate differentials rather than oil and look for the widening rate spreads to continue to drive the pair higher.
We look to buy into dips below 1.31 based on stretched valuation".
Copyright © 2016 TD Securities, eFXnews™
-
15:22
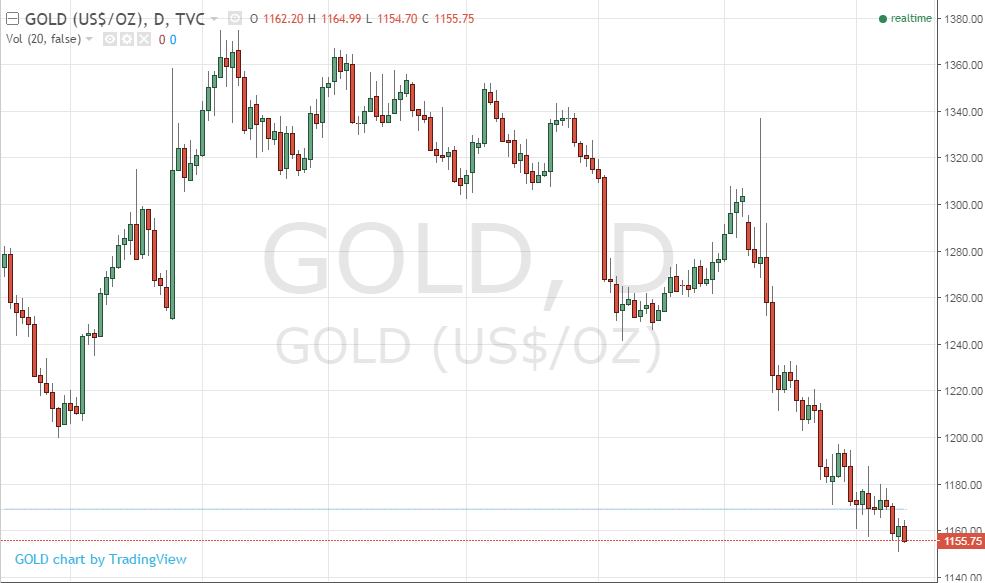
Gold falls ahead of tomorrow's major event
Gold prices fell Tuesday, as the Federal Reserve kicked off a two-day meeting that many investors believe will culminate in a rate increase, according to Dow Jones.
Gold for February delivery was recently down 0.5% at $1160.20 a troy ounce on the Comex division of the New York Mercantile Exchange.
Fed-funds futures showed that traders assigned a 97.2% probability that the central bank will raise rates at the end of its monetary policy meeting Wednesday, according to the CME. Gold struggles to compete with yield-bearing investments when rates rise.
"Gold may not be able to have a clear shot at going substantially higher until the conclusion of the (Fed meeting) on Wednesday," analysts at HSBC wrote in a note to investors.
-
14:54
US small business confidence climbed in November
Small-business owners' confidence about their economic situation climbed in November, according to a report Tuesday, as improvements in the outlook of business conditions and expectations of sales gains followed the election of Donald Trump in the presidential election, says Dow Jones.
The National Federation of Independent Business's small-business optimism index rose to 98.4 last month from October's 94.9, among the highest month-on-month jumps dating back to 2011 and the second-highest rating in that time. Economists surveyed by The Wall Street Journal expected the gauge to climb to 97.0.
-
13:45
Option expiries for today's 10:00 ET NY cut
EURUSD 1.0400 (EUR 993m) 1.0500 (504m) 1.0600 (1.23bn) 1.0700 (941m)
USDJPY 114.90 (USD 450m)
AUDUSD 0.7400 (AUD 664m) 0.7420 (505m)
USDCAD 1.3275-80 (USD 553m) 1.3465-75 (1.0bln)
USDSGD 1.4150 (USD 1.23bln)
-
13:35
US import and export prices lower in November
U.S. import prices fell 0.3 percent in November, the U.S. Bureau of Labor Statistics reported today, following increases of 0.4 percent and 0.1 percent the 2 previous months. The drop in November was primarily led by decreasing fuel prices. U.S. export prices also declined in November, edging down 0.1
percent, after a 0.2-percent increase the previous month.
The price index for overall exports edged down 0.1 percent in November, after increasing 0.2 percent in October and 0.3 percent in September. In November, declining nonagricultural prices led the overall decrease. U.S. export prices also fell over the past 12 months, decreasing 0.3 percent. Export prices have not risen on a 12-month basis since the index rose 0.4 percent between August 2013 and August 2014. -
13:30
U.S.: Import Price Index, November -0.3% (forecast -0.4%)
-
12:59
Orders
EUR/USD
Offers 1.0650-55 1.0685 1.0700 1.0730 1.0750 1.07851.0800 1.0820 1.0850
Bids 1.0600 1.0585 1.0550 1.0525-30 1.0500
GBP/USD
Offers 1.2700-05 1.2725-30 1.2750-55 1.2775 1.2800
Bids 1.2655-60 1.2625 1.2600 1.2585 1.2550-55 1.2530-35 1.2500 1.2480 1.2450
EUR/GBP
Offers 0.8400-05 0.8420-25 0.8450 0.8460-65 0.8480 0.8500 0.8535 0.8550
Bids 0.8355-60 0.8335 0.8300 0.8285 0.8250 0.8200-05
EUR/JPY
Offers 122.85 123.00 123.35 123.50 124.00 124.20 124.50
Bids 122.20 122.00 121.75 121.50 121.20 121.00 120.80-85 120.50
USD/JPY
Offers 115.55-60 115.80 116.00 116.25-30 116.50 116.80 117.00
Bids 115.00 114.75-80 114.50 114.20 114.00 113.80 113.50 113.30 113.00
AUD/USD
Offers 0.7500 0.7520-25 0.7550 0.7580 0.7600 0.7630 0.7650
Bids 0.7470 0.7445-50 0.7430 0.7400 0.7380 0.7355-60 0.7325-30 0.7300
-
12:25
Trump to nominate Rex Tillerson as Secretary of State
-
10:49
ECB Hansson: QE reduction was a very welcome change
-
10:20
The ZEW Indicator of Economic Sentiment for Germany has remained unchanged
The ZEW Indicator of Economic Sentiment for Germany has remained unchanged at a level of 13.8 points (long-term average: 24.0 points) in December 2016.
"The ZEW Indicator of Economic Sentiment remains at the same level; however, given the fact that the evaluation of the current situation has once again recorded an improvement, the overall assessment is quite positive. This is supported by the recently published positive GDP growth figures for the euro area in the third quarter. The considerable economic risks arising from the tense situation in the Italian banking sector, as well as the political risks surrounding upcoming elections in Europe, seem to have faded into the background at the moment," comments ZEW President Professor Achim Wambach.
-
10:19
Euro zone employment change lower than forecast
The number of persons employed increased by 0.2% in both the euro area (EA19) and the EU28 in the third quarter of 2016 compared with the previous quarter, according to national accounts estimates published by Eurostat, the statistical office of the European Union.
In the second quarter of 2016, employment rose by 0.4% in the euro area and by 0.3% in the EU28. These figures are seasonally adjusted. Compared with the same quarter of the previous year, employment increased by 1.2% in the euro area and by 1.1% in the EU28 in the third quarter of 2016 (after +1.3% and +1.4% respectively in the second quarter of 2016).
Eurostat estimates that, in the third quarter of 2016, 232.5 million men and women were employed in the EU28 (highest level ever recorded); of which 153.4 million were in the euro area (highest level since the fourth quarter of 2008). These figures are seasonally adjusted. These quarterly data on employment provide a picture of labour input consistent with the output and income measure of national accounts.
-
10:01
Eurozone: ZEW Economic Sentiment, December 18.1
-
10:00
Germany: ZEW Survey - Economic Sentiment, December 13.8 (forecast 14)
-
10:00
Eurozone: Employment Change, Quarter III 0.2% (forecast 0.3%)
-
09:43
Option expiries for today's 10:00 ET NY cut
EUR/USD 1.0400 (EUR 993m) 1.0500 (504m) 1.0600 (1.23bn) 1.0700 (941m)
USD/JPY 114.90 (USD 450m)
AUD/USD 0.7400 (AUD 664m) 0.7420 (505m)
USD/CAD 1.3275-80 (USD 553m) 1.3465-75 (1.0bln)
USD/SGD 1.4150 (USD 1.23bln)
Информационно-аналитический отдел TeleTrade
-
09:38
GBP/USD trying to stabilize above 1.27 after better inflation data
-
09:35
The price of goods bought and sold by UK manufacturers rose again
The price of goods bought and sold by UK manufacturers, as estimated by the Producer Price Index, rose again in the year to November 2016. This is the fifth consecutive increase following 2 years of falls and the largest increase since April 2012. Between October and November, total output prices showed no movement, compared with an increase of 0.7% the previous month.
Factory gate prices (output prices) for goods produced by UK manufacturers rose 2.3% in the year to November 2016, compared with an increase of 2.1% in the year to October 2016.
Core factory gate prices, which exclude the more volatile food, beverage, tobacco and petroleum products, rose 2.2% in the year to November 2016, the largest increase since February 2012.
-
09:32
UK CPI rose 1.2% in November due to higher prices of clothing, motor fuels
The Consumer Prices Index (CPI) rose by 1.2% in the year to November 2016, compared with a 0.9% rise in the year to October.
The rate in November was the highest since October 2014, when it was 1.3%.
Rises in the prices of clothing, motor fuels and a variety of recreational and cultural goods and services, most notably data processing equipment, were the main contributors to the increase in the rate.
These upward pressures were partially offset by falls in air and sea fares.
CPIH (not a National Statistic) rose by 1.4% in the year to November 2016, up from 1.2% in October.
-
09:31
United Kingdom: Producer Price Index - Input (MoM), November -1.1% (forecast -1.9%)
-
09:31
United Kingdom: Producer Price Index - Output (YoY) , November 2.3% (forecast 2.5%)
-
09:31
United Kingdom: Producer Price Index - Output (MoM), November 0.0% (forecast 0.2%)
-
09:30
United Kingdom: HICP, Y/Y, November 1.2% (forecast 1.1%)
-
09:30
United Kingdom: HICP, m/m, November 0.2% (forecast 0.2%)
-
09:30
United Kingdom: HICP ex EFAT, Y/Y, November 1.4% (forecast 1.3%)
-
09:30
United Kingdom: Retail prices, Y/Y, November 2.2% (forecast 2.1%)
-
09:30
United Kingdom: Retail Price Index, m/m, November 0.3% (forecast 0.2%)
-
09:30
United Kingdom: Producer Price Index - Input (YoY) , November 12.9% (forecast 13.5%)
-
09:15
Italian industrial production flat in October
In October 2016 the seasonally adjusted industrial production index was unchanged compared with the previous month. The percentage change of the average of the last three months with respect to the previous three months was +1.6.
The calendar adjusted industrial production index increased by 1.3% compared with October 2015 (calendar working days being 21 versus 22 days in October 2015); in the period January-October 2016 the percentage change was +1.1 compared with the same period of 2015.
The unadjusted industrial production index decreased by 1.8% compared with October 2015.
-
09:04
GBP/USD traders await important UK inflation data. CPI expected to rise 1.1% in November due to the pounds decline
-
08:32
Spain's inflation stable in November
Spain's inflation held steady in November as initially estimated, final data from the statistical office INE, cited by rttnes, showed Tuesday.
Consumer prices climbed 0.7 percent year-on-year in November, the same pace of growth as seen in October and in line with flash estimate. Prices have been rising for three straight months.
On a monthly basis, consumer prices moved up 0.4 percent instead of preliminary estimate of 0.3 percent. But this was slower than October's 1.1 percent increase.
-
08:01
Today’s events
-
At 18:01 GMT the United States will hold an auction of 30-year bonds
-
-
08:00
Reserve Bank of India May Cut Rates Early in 2017 - DBS
-
07:37
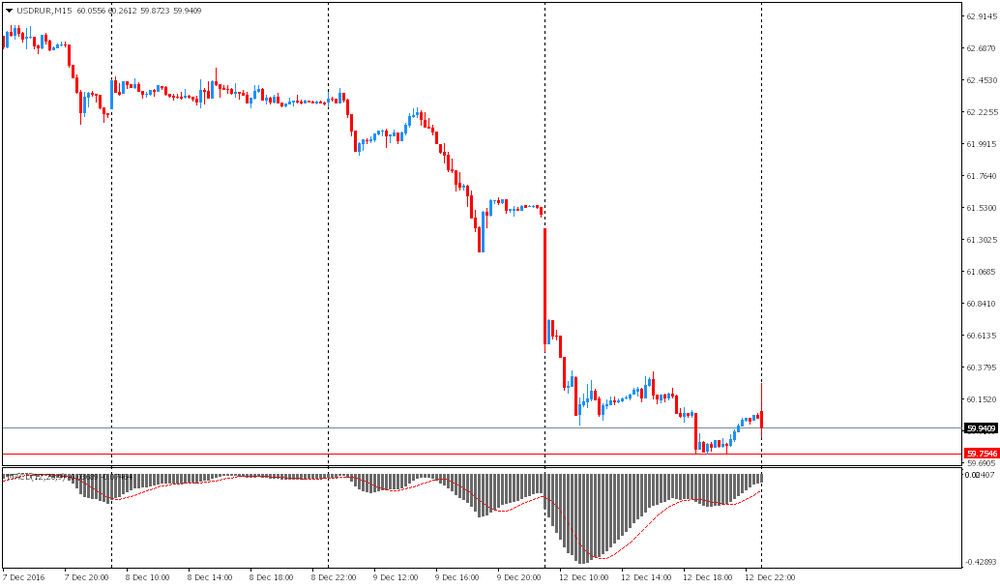
USD / RUR moves to yesterday’s low
In the first minutes after openinf USD/RUR was down to 59.76. It is worth noting that this morning, Brent crude traded unchanged.
-
07:33
Credit Agricole thinks this weak's Tankan Survey will provide an important signal for USD/JPY
"Investment spending and large manufacturers' forecasts for the USD/JPY are likely to be the highlights in this week's Tankan survey. Despite sentiment remaining above average, investment spending has not followed in 2016.
One of the reasons for this has been the stronger JPY. The JPY's recent weakening could improve the outlook for investment in Japan.
Large enterprises have progressively been lowering their forecasts for average USD/JPY in 2016, but the recent rally may have halted these revisions, which would be indicative of Japanese exporters not feeling pressured to sell USD/JPY on rallies for hedging purposes. It would also be a good sign for investment".
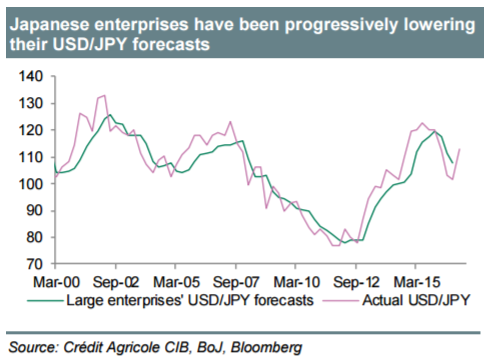
Copyright © 2016 Credit Agricole CIB, eFXnews™
-
07:26
Options levels on tuesday, December 13, 2016:
EUR/USD
Resistance levels (open interest**, contracts)
$1.0846 (1477)
$1.0809 (290)
$1.0757 (200)
Price at time of writing this review: $1.0644
Support levels (open interest**, contracts):
$1.0575 (2107)
$1.0536 (1142)
$1.0489 (1159)
Comments:
- Overall open interest on the CALL options with the expiration date March, 13 is 40668 contracts, with the maximum number of contracts with strike price $1,1500 (3166);
- Overall open interest on the PUT options with the expiration date March, 13 is 41889 contracts, with the maximum number of contracts with strike price $1,0000 (3481);
- The ratio of PUT/CALL was 1.03 versus 1.05 from the previous trading day according to data from December, 12
GBP/USD
Resistance levels (open interest**, contracts)
$1.2915 (271)
$1.2819 (463)
$1.2724 (416)
Price at time of writing this review: $1.2671
Support levels (open interest**, contracts):
$1.2580 (699)
$1.2484 (468)
$1.2387 (326)
Comments:
- Overall open interest on the CALL options with the expiration date March, 13 is 9756 contracts, with the maximum number of contracts with strike price $1,2600 (1115);
- Overall open interest on the PUT options with the expiration date March, 13 is 11952 contracts, with the maximum number of contracts with strike price $1,1500 (2946);
- The ratio of PUT/CALL was 1.23 versus 1.22 from the previous trading day according to data from December, 12
* - The Chicago Mercantile Exchange bulletin (CME) is used for the calculation.
** - Open interest takes into account the total number of option contracts that are open at the moment.
-
07:17
Australian house prices rose in Q3 by 1.5%
According to data released today by the Australian Bureau of Statistics, property prices in the 3rd quarter increased by 1.5% compared to the previous quarter. Most economists had expected the index to rise by 2.5% after rising 2.0% in the second quarter. In annual terms, house prices rose by 3.5%, which is well below the forecast of 4.6% and the previous value of 4.1%.
Sydney property prices rose by 2.6% q / q in Hobart by 2.3%, in Melbourne 1.7%, Adelaide 0.9%, Canberra by 0.8% and in Brisbane 0.2 %. Housing prices fell only in Perth and Darwin by 1.6% compared with the previous quarter.
-
07:13
Donald Trump remains winner of Wisconsin following statewide recount showing few changes in vote totals
-
07:13
China’s retail sales increased in November
Retail sales increased by 10.8%, after rising earlier by 10.0%. Economists had expected an increase of 10.1%. Retail sales - the indicator published by the National Bureau of Statistics of China and estimate the total amount of cash proceeds from the sale of consumer goods to end consumers. The index takes into account the total consumer goods delivered by various industries for households and social groups through a variety of channels in the retail trade. This is an important indicator that allows to study the changes in the retail market in China and reflects the level of economic well-being.
The report of the National Statistical Department noted that the volume of online retail sales rose from January to November 2016 compared to the same period last year by 26.2%.
-
07:08
German wholesale prices increased by 0.8% in November
As reported by the Federal Statistical Office (Destatis), the selling prices in wholesale trade increased by 0.8% in November 2016 from the corresponding month of the preceding year. In October and in September 2016 the annual rates of change were +0.5% and -0.3%, respectively.
From October 2016 to November 2016 the index rose by 0.1%.
-
07:06
German final CPI for November in line with expectations
Consumer prices in Germany were 0.8% higher in November 2016 than in November 2015. This means that the inflation remains at the two-year-high reached in the previous month. Compared with October 2016, the consumer price index rose by 0.1% in November 2016. The Federal Statistical Office (Destatis) thus confirms its provisional overall results of 29 November 2016.
The development of energy prices (-2.7% on November 2015) had a downward effect on the overall rise in prices in November 2016, as had been the case in the preceding months. The year-on-year decrease in energy prices thus accelerated (in October 2016 it had been -1.4% on October 2015). Compared with a year earlier, household energy prices were down in November 2016 (-2.9%, including charges for central and district heating: -6.9%; heating oil: -6.7%; gas: -4.1%), as were motor fuel prices (-2.2%). Excluding energy prices, the inflation rate in November 2016 would have been +1.2%.
-
07:01
Germany: CPI, m/m, November 0.1% (forecast 0.1%)
-
07:00
Germany: CPI, y/y , November 0.8% (forecast 0.8%)
-
02:00
China: Industrial Production y/y, November 6.2% (forecast 6.1%)
-
02:00
China: Retail Sales y/y, November 10.8% (forecast 10.1%)
-
02:00
China: Fixed Asset Investment, October 8.3% (forecast 8.3%)
-
00:30
Australia: National Australia Bank's Business Confidence, November 5
-
00:30
Australia: House Price Index (QoQ), Quarter III 1.5%
-