Market news
-
23:30
Australia: AiG Performance of Construction Index, April 51.9
-
22:29
Commodities. Daily history for May 04’2017:
(raw materials / closing price /% change)
Oil 45.49 -0.07%
Gold 1,228.40 -0.02%
-
22:28
Stocks. Daily history for May 04’2017:
(index / closing price / change items /% change)
Nikkei +135.18 19445.70 +0.70%
TOPIX +10.53 1550.30 +0.68%
Hang Seng -12.25 24683.88 -0.05%
CSI 300 -8.74 3404.39 -0.26%
Euro Stoxx 50 +41.63 3627.88 +1.16%
FTSE 100 +13.57 7248.10 +0.19%
DAX +119.94 12647.78 +0.96%
CAC 40 +71.42 5372.42 +1.35%
DJIA -6.43 20951.47 -0.03%
S&P 500 +1.39 2389.52 +0.06%
NASDAQ +2.79 6075.34 +0.05%
S&P/TSX -146.44 15396.70 -0.94%
-
22:27
Currencies. Daily history for May 04’2017:
(pare/closed(GMT +2)/change, %)
EUR/USD $1,0980 +0,87%
GBP/USD $1,2919 +0,41%
USD/CHF Chf0,9861 -0,83%
USD/JPY Y112,53 -0,12%
EUR/JPY Y123,56 +0,75%
GBP/JPY Y145,36 +0,28%
AUD/USD $0,7411 -0,15%
NZD/USD $0,6870 -0,20%
USD/CAD C$1,3748 +0,14%
-
21:58
Schedule for today, Friday, May 05’2017 (GMT0)
01:30 Australia RBA Monetary Policy Statement
07:00 Switzerland Foreign Currency Reserves March 683.18
12:30 Canada Unemployment rate April 6.7% 6.7%
12:30 Canada Employment April 19.4 10
12:30 U.S. Government Payrolls April 9
12:30 U.S. Average workweek April 34.3 34.4
12:30 U.S. Manufacturing Payrolls April 11 10
12:30 U.S. Private Nonfarm Payrolls April 89 185
12:30 U.S. Average hourly earnings April 0.2% 0.3%
12:30 U.S. Labor Force Participation Rate April 63%
12:30 U.S. Nonfarm Payrolls April 98 185
12:30 U.S. Unemployment Rate April 4.5% 4.6%
14:00 Canada Ivey Purchasing Managers Index April 61.1 62.3
15:30 U.S. FED Vice Chairman Stanley Fischer Speaks
16:45 U.S. FOMC Member Williams Speaks
17:00 U.S. Baker Hughes Oil Rig Count May
17:30 U.S. FOMC Member James Bullard Speaks
17:30 U.S. FOMC Member Charles Evans Speaks
17:30 U.S. FOMC Member Rosengren Speaks
17:30 U.S. Fed Chairman Janet Yellen Speaks
19:00 U.S. Consumer Credit March 15.21 15.75
-
20:08
Major US stock indices showed mixed dynamics
Major US stock indexes finished trading in different directions, but near the zero mark. Pressure on the market had a strong decline in quotations in the sector of basic materials. Investors also evaluated fresh statistics on the US economy and financial statements of large companies.
As it became known, new applications for unemployment benefits in the US fell more than expected last week, and the number of repeated applications for unemployment benefits fell to a 17-year low, indicating a tightening of the labor market, which could prompt the Fed to raise interest rates next month. Initial claims for unemployment benefits fell by 19,000 to 238,000, seasonally adjusted for the week ending April 29.
At the same time, labor productivity unexpectedly fell in the 1st quarter, which led to an increase in labor costs. The Ministry of Labor reported that labor productivity in the non-agricultural sector, which measures the hourly output per employee, decreased by 0.6% year-on-year. This was the weakest indicator for the year and followed an increase of 1.8% in the fourth quarter.
The cost of oil futures collapsed by almost 5%, reaching the lowest level since the end of November. Concerns over the growing global supplies and persistently high oil reserves actually offset most of the positions earned after OPEC reported the first eight-year oil production reduction agreement.
Most components of the DOW index showed a decrease (19 out of 30). Caterpillar Inc. shares fell more than others. (CAT, -2.21%). The leader of growth was UnitedHealth Group Incorporated (UNH, + 0.93%).
The S & P indexes have finished trading without a single dynamic. Most of all fell the sector of main materials (-1.8%). The highest increase was recorded in the consumer goods sector (+ 0.6%).
At closing:
DJIA -0.03% 20.951.24 -6.66
Nasdaq + 0.05% 6.075.34 + 2.79
S & P + 0.06% 2.389.54 +1.41
-
19:00
DJIA -0.15%20,925.42 -32.48 Nasdaq -0.02% 6,071.05 -1.50 S&P -0.05% 2,386.86 -1.27
-
16:00
European stocks closed: FTSE 100 +13.57 7248.10 +0.19% DAX +119.94 12647.78 +0.96% CAC 40 +71.42 5372.42 +1.35%
-
14:56
Moody's says long-term trends such as population aging and slowing growth in human capital and education are also behind decline in productivity growth
-
"While we expect productivity growth to rebound somewhat this year and next, there will be a notable impact on growth if it fails to improve"
-
Productivity growth slowdown remains a sizeable risk to global growth
-
-
14:35
Fitch - preliminary agreement between Greece, international creditors is positive step towards unlocking funds for Greece to meet july debt maturities
-
Greece agreement a positive step toward review completion
-
-
14:05
US New orders for manufactured durable goods in March increased $1.6 billion or 0.7 percent
New orders for manufactured durable goods in March increased $1.6 billion or 0.7 percent to $238.7 billion, the U.S. Census Bureau announced today. This increase, up three consecutive months, followed a 2.3 percent February increase. Excluding transportation, new orders decreased 0.2 percent. Excluding defense, new orders increased 0.1 percent. Transportation equipment, also up three consecutive months, drove the increase, $2.0 billion or 2.4 percent to $83.3 billion.
Shipments of manufactured durable goods in March, up four of the last five months, increased $0.6 billion or 0.2 percent to $239.8 billion. This followed a 0.2 percent February increase. Transportation equipment, up following two consecutive monthly decreases, led the increase, $0.4 billion or 0.5 percent to $81.7 billion.
-
14:00
U.S.: Factory Orders , March 0.2% (forecast 0.4%)
-
13:44
Option expiries for today's 10:00 ET NY cut
EURUSD: 1.0750-60 (520m) 1.0800 (421m) 1.0830 (497m) 1.0850-60 (1.1bln) 1.0890 ( 722m) 1.0900 (464m) 1.0950 (1.6bln ) 1.1100 (777m)
USDJPY: 111.20-30 (USD 185m) 112.00 (335m) 112.50 (457m)
GBPUSD: 1.3000-05 (GBP 361m)
USDCHF: 1.0000 (USD 185m)
AUDUSD: 0.7400 (AUD 182m) 0.7420-25 (192m) 0.7560 (341m)
USDCAD: 1.3680 (USD 300m)
NZDUSD: 0.6970 (NZD 198m)
-
13:42
Oil prices extend losses; brent, wti fall to the lowest since nov 30 OPEC supply cut deal
-
13:33
U.S. Stocks open: Dow +0.12%, Nasdaq +0.11%, S&P +0.13%
-
13:26
Before the bell: S&P futures +0.16%, NASDAQ futures +0.20%
U.S. stock-index futures rose, a day after the Fed left interest rates unchanged and expressed confidence in the strength of the U.S. economy.
Stocks:
Nikkei -
Hang Seng 24,683.88 -12.25 -0.05%
Shanghai 3,127.29 -8.06 -0.26%
S&P/ASX 5,876.37 -15.97 -0.27%
FTSE 7,256.68 +22.15 +0.31%
CAC 5,349.75 +48.75 +0.92%
DAX 12,622.11 +94.27 +0.75%
Crude $46.89 (-1.94%)
Gold $1,228.90 (-1.57%)
-
12:54
US unemployment claims continue to decline
In the week ending April 29, the advance figure for seasonally adjusted initial claims was 238,000, a decrease of 19,000 from the previous week's unrevised level of 257,000. The 4-week moving average was 243,000, an increase of 750 from the previous week's unrevised average of 242,250.
The advance seasonally adjusted insured unemployment rate was 1.4 percent for the week ending April 22, unchanged from the previous week's unrevised rate.
-
12:51
Wall Street. Stocks before the bell
(company / ticker / price / change ($/%) / volume)
ALCOA INC.
AA
31.51
-0.18(-0.57%)
5848
Amazon.com Inc., NASDAQ
AMZN
944
2.97(0.32%)
12828
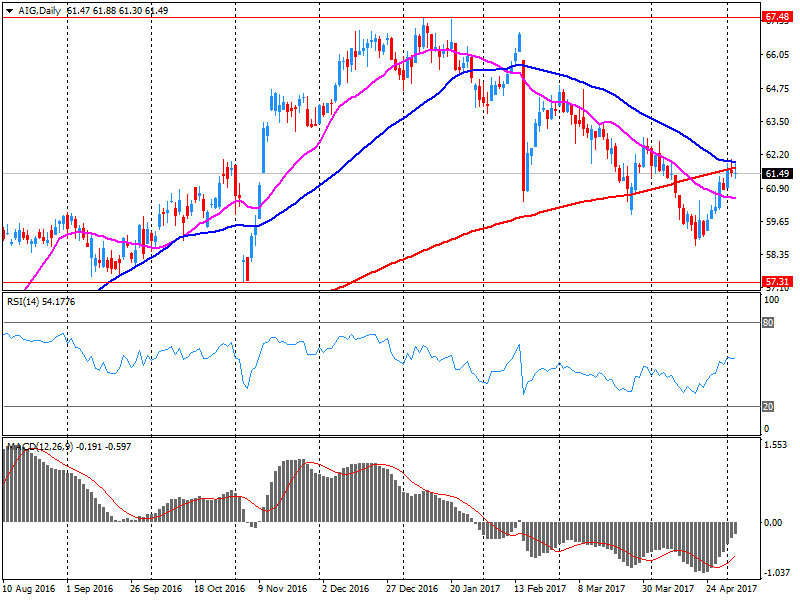
AMERICAN INTERNATIONAL GROUP
AIG
62.4
0.86(1.40%)
142820
Apple Inc.
AAPL
146.72
-0.34(-0.23%)
122715
AT&T Inc
T
38.48
0.08(0.21%)
15934
Barrick Gold Corporation, NYSE
ABX
16
-0.21(-1.30%)
118726
Caterpillar Inc
CAT
101.97
0.43(0.42%)
2003
Chevron Corp
CVX
106.03
-0.69(-0.65%)
619
Cisco Systems Inc
CSCO
34.36
0.11(0.32%)
10215
Citigroup Inc., NYSE
C
60.52
0.28(0.46%)
434480
Exxon Mobil Corp
XOM
82.68
-0.02(-0.02%)
5052
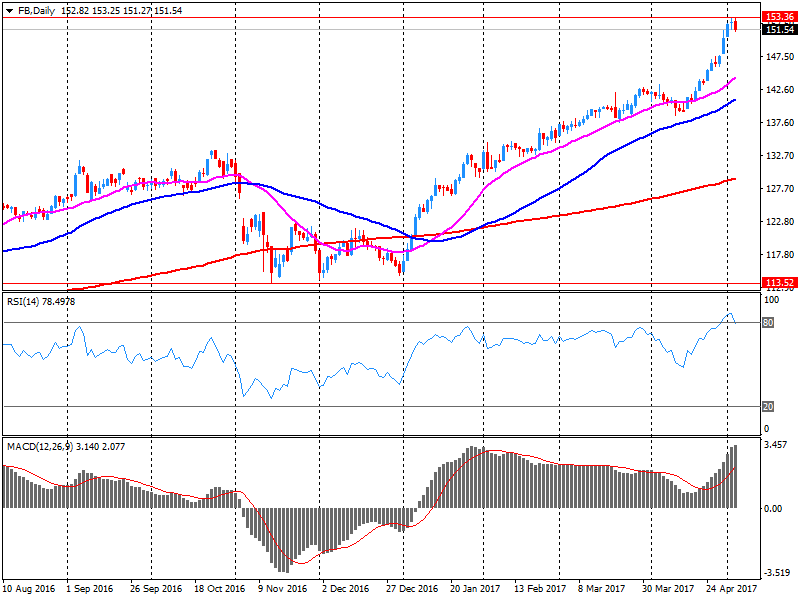
Facebook, Inc.
FB
150.13
-1.67(-1.10%)
1152797
FedEx Corporation, NYSE
FDX
191.5
1.58(0.83%)
200
Ford Motor Co.
F
11.09
0.02(0.18%)
17538
Freeport-McMoRan Copper & Gold Inc., NYSE
FCX
11.85
-0.17(-1.41%)
52295
General Electric Co
GE
29.28
0.05(0.17%)
4983
General Motors Company, NYSE
GM
33.64
0.16(0.48%)
1860
Goldman Sachs
GS
227.55
1.24(0.55%)
58712
Google Inc.
GOOG
925.51
-1.53(-0.17%)
7513
Intel Corp
INTC
37.1
0.12(0.32%)
12638
International Business Machines Co...
IBM
158.2
-0.43(-0.27%)
635
Johnson & Johnson
JNJ
123.61
0.28(0.23%)
962
JPMorgan Chase and Co
JPM
87.3
0.30(0.34%)
533581
Merck & Co Inc
MRK
63.55
-0.08(-0.13%)
2114
Microsoft Corp
MSFT
69.1
0.02(0.03%)
2334
Nike
NKE
54.94
0.41(0.75%)
595
Pfizer Inc
PFE
33.34
-0.13(-0.39%)
9518
Procter & Gamble Co
PG
86.11
-0.32(-0.37%)
100
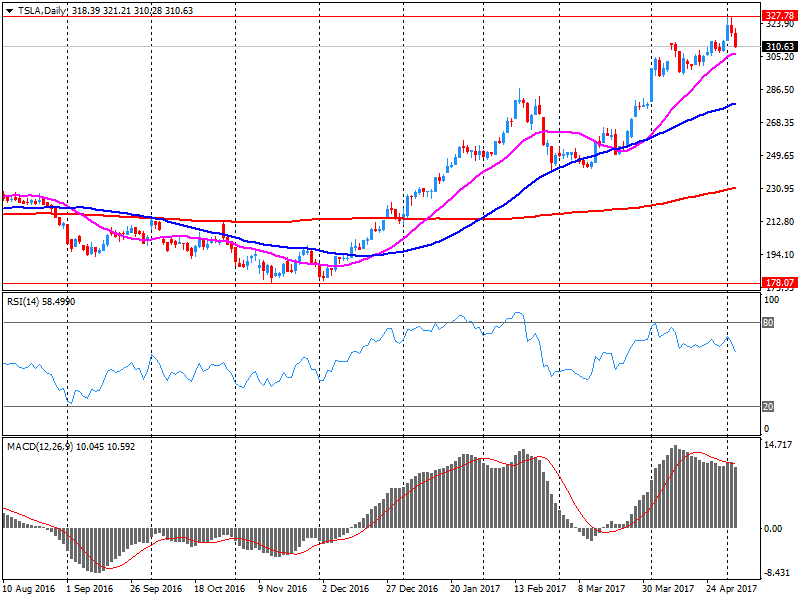
Tesla Motors, Inc., NASDAQ
TSLA
305
-6.02(-1.94%)
108217
Twitter, Inc., NYSE
TWTR
18.65
0.08(0.43%)
345490
Verizon Communications Inc
VZ
46.22
0.07(0.15%)
4170
Visa
V
92.94
0.50(0.54%)
511
Walt Disney Co
DIS
112
0.38(0.34%)
1117
Yandex N.V., NASDAQ
YNDX
26.73
-0.48(-1.76%)
2045
-
12:51
US trade balance deficit declined more than expected in March
The U.S. Census Bureau and the U.S. Bureau of Economic Analysis, through the Department of Commerce, announced today that the goods and services deficit was $43.7 billion in March, down $0.1 billion from $43.8 billion in February, revised. March exports were $191.0 billion, $1.7
billion less than February exports. March imports were $234.7 billion, $1.7 billion less than February imports.
The March decrease in the goods and services deficit reflected an increase in the goods deficit of $0.4 billion to $65.5 billion and an increase in the services surplus of $0.4 billion to $21.8 billion.
Year-to-date, the goods and services deficit increased $9.4 billion, or 7.5 percent, from the same period in 2016. Exports increased $38.0 billion or 7.1 percent. Imports increased $47.5 billion or 7.1 percent.
-
12:44
US nonfarm business sector labor productivity decreased at a 0.6-percent annual rate
Nonfarm business sector labor productivity decreased at a 0.6-percent annual rate during the first quarter of 2017, the U.S. Bureau of Labor Statistics
reported today, as output increased 1.0 percent and hours worked increased 1.6 percent.
Labor productivity, or output per hour, is calculated by dividing an index of real output by an index of hours worked by all persons, including employees,
proprietors, and unpaid family workers.
Unit labor costs in the nonfarm business sector increased 3.0 percent in the first quarter of 2017, reflecting a 2.4-percent increase in hourly compensation and a 0.6-percent decline in productivity. Unit labor costs increased 2.8 percent over the last four quarters.
-
12:42
Upgrades and downgrades before the market open
Upgrades:
Downgrades:
Other:
Facebook (FB) target raised to $170 from $165 at Stifel Research
Facebook (FB) target raised to $165 from $160 at Aegis Capital
-
12:30
U.S.: Initial Jobless Claims, 238 (forecast 247)
-
12:30
U.S.: International Trade, bln, March -43.7 (forecast -44.5)
-
12:30
U.S.: Unit Labor Costs, q/q, Quarter I 3% (forecast 2.5%)
-
12:30
Canada: Trade balance, billions, March -0.14 (forecast -0.85)
-
12:30
U.S.: Continuing Jobless Claims, 1964 (forecast 2000)
-
12:30
U.S.: Nonfarm Productivity, q/q, Quarter I -0.6% (forecast 0.2%)
-
12:22
Company News: American Intl (AIG) Q1 EPS beat analysts’ estimates
American Intl (AIG) reported Q1 FY 2017 earnings of $1.36 per share (versus $0.65 in Q1 FY 2016), beating analysts' consensus estimate of $1.07.
AIG rose to $62.25 (+1.15%) in pre-market trading.
-
12:18
Company News: Facebook (FB) Q1 results beat analysts’ forecasts
Facebook (FB) reported Q1 FY 2017 earnings of $1.04 per share (versus $0.77 in Q1 FY 2016), beating analysts' consensus estimate of $0.86.
The company's quarterly revenues amounted to $8.032 bln (+49.2% y/y), beating analysts' consensus estimate of $7.829 bln.
The company reiterated meaningful slowdown in advertisement growth revenue in 2017 and CapEx of $7.0-7.5 bln.
FB fell to $151.07 (-0.49%) in pre-market trading.
-
12:04
Company News: Tesla (TSLA) Q1 loss beats analysts’ estimate
Tesla (TSLA) reported Q1 FY 2017 loss of $1.33 per share (versus -$0.57 in Q1 FY 2016), missing analysts' consensus estimate of -$0.78.
The company's quarterly revenues amounted to $2.696 bln (+135.1% y/y), beating analysts' consensus estimate of $2.610 bln.
The company also noted its H1 FY2017 outlook remained unchanged at 47,000 to 50,000 deliveries.
TSLA fell to $305.50 (-1.77%) in pre-market trading.
-
12:00
Orders
EUR/USD
Offers: 1.0920 1.0935 1.0950-55 1.0980 1.1000 1.1030 1.1050
Bids: 1.0870 1.0850 1.0820 1 .0800 1.0780 1.0750 1.0700
GBP/USD
Offers: 1.2880-85 1.2900 1.2930 1.2950-60 1.2975 1.3000
Bids: 1.2830 1.2800 1.2775-80 1.2760 1.2750 1.2720 1.2700
EUR/JPY
Offers: 123.30 123.50 123.75 124.00 124.50 125.00
Bids: 122.80 122.50 122.35 122.20 122.00 121.85 121.65 121.50
EUR/GBP
Offers: 0.8460 0.8480-85 0.8500 0.8530 0.8550
Bids: 0.8435-40 0.8400 0.8385 0.8350
USD/JPY
Offers: 113.00 113.20 113.50 113.80 114.00
Bids: 112.65 112.50 112.30 112.00 111.80 111.50
AUD/USD
Offers: 0.7420-25 0.7550-55 0.7480 0.7500
Bids: 0.7385 0.7365 0.7350 0.7335 0.7300 0.7280 0.7250
-
09:02
Euro area retail sales rose 0.3% in March. The highest increase was registered in Hungary (+1.8%)
In March 2017 compared with February 2017, the seasonally adjusted volume of retail trade rose by 0.3% in the euro area (EA19), while it fell by 0.2% in the EU28, according to estimates from Eurostat, the statistical office of the European Union. In February the retail trade volume increased by 0.5% in the euro area and by 0.7% in the EU28. In March 2017 compared with March 2016 the calendar adjusted retail sales index increased by 2.3% in the euro area and by 2.5% in the EU28.
The 0.3% increase in the volume of retail trade in the euro area in March 2017, compared with February 2017, is due to rises of 0.4% for non-food products and of 0.2% for "Food, drinks and tobacco", while automotive fuel fell by 0.3%. In the EU28, the 0.2% decrease in the volume of retail trade is due to falls of 0.4% for automotive fuel and of 0.3% for non-food products, while "Food, drinks and tobacco" rose by 0.1%. Among Member States for which data are available, the highest increases in the total retail trade volume were registered in Hungary (+1.8%), Estonia (+1.6%) and Luxembourg (+1.5%), while the largest decreases were observed in Portugal (-2.3%), Slovenia and the United Kingdom (both -2.2%) as well as Finland (-2.1%).
-
09:00
Eurozone: Retail Sales (YoY), March 2.3% (forecast 2.1%)
-
09:00
Eurozone: Retail Sales (MoM), March 0.3% (forecast 0.1%)
-
08:46
United Kingdom: Net Lending to Individuals, bln, March 4.7 (forecast 4.5)
-
08:32
Fastest upturn in UK's service sector output since December 2016
UK service providers experienced a sustained rebound in business activity during April, supported by the fastest upturn in new work so far in 2017. Job creation also picked up to a four-month high, driven by renewed pressures on operating capacity. A strong pace of input cost inflation persisted in April, which contributed to the steepest rise in prices charged by service sector firms since July 2008. Meanwhile, service providers are confident about their prospects for growth over the year ahead, but the degree of optimism moderated for the third month running to its weakest since November 2016.
At 55.8 in April, up from 55.0 in March, the headline seasonally adjusted Markit/CIPS Services PMI Business Activity Index posted above the 50.0 no-change threshold for the ninth month in a row. The latest reading revealed the fastest upturn in service sector output since December 2016. The robust and accelerated rise in services activity was linked to resilient business-to-business demand, new product launches and, in some cases, another rise in sales to overseas clients.
-
08:30
United Kingdom: Purchasing Manager Index Services, April 55.8 (forecast 54.5)
-
08:30
United Kingdom: Consumer credit, mln, March 1624 (forecast 1300)
-
08:30
United Kingdom: Mortgage Approvals, March 66.84 (forecast 67.4)
-
08:08
Six year high for Euro area services PMI
Euro area economic growth accelerated to a sixyear high at the start of the second quarter. This was signalled by the final Markit Eurozone PMI Composite Output Index rising to 56.8 in April, up from 56.4 in March and the earlier flash estimate of 56.7. Activity has expanded for 46 months in a row. Output growth accelerated at manufacturers and service providers, with rates of increase hitting 72- month records in both cases.
The slightly sharper expansion was again registered in manufacturing. Underpinning growth of economic activity was a strong increase in incoming new business. New orders rose for the twenty-ninth month running, with the rate of expansion staying close to March's high.
-
08:07
The German service sector continued to expand strongly
The German service sector continued to expand strongly at the start of the second quarter, according to the April PMI survey data from IHS Markit. The rate of growth in total activity was littlechanged from March's recent peak, although new business expansion eased to a three-month low and the volume of outstanding work fell slightly. Consequently, companies increased their workforces at the slowest rate since January. Price pressures remained historically sharp, although the rates of inflation of input and output prices both slowed since March.
The seasonally adjusted Markit Germany Composite PMI Output Index remained well above the no-change mark of 50.0 in April, signalling a strong expansion in the combined output of the manufacturing and service sectors. At 56.7, down slightly from 57.1 in March, the Index pointed to the second-fastest rate of growth since May 2011.
-
08:00
Eurozone: Services PMI, April 56.4 (forecast 56.2)
-
07:55
Germany: Services PMI, April 55.4 (forecast 54.7)
-
07:51
France: Services PMI, April 56.7 (forecast 57.7)
-
07:45
Forex option contracts rolling off today at 14.00 GMT:
EURUSD: 1.0750-60 (520m) 1.0800 (421m) 1.0830 (497m) 1.0850-60 (1.1bln) 1.0890 ( 722m) 1.0900 (464m) 1.0950 (1.6bln ) 1.1100 (777m)
USDJPY: 111.20-30 (USD 185m) 112.00 (335m) 112.50 (457m)
GBPUSD: 1.3000-05 (GBP 361m)
USDCHF: 1.0000 (USD 185m)
AUDUSD: 0.7400 (AUD 182m) 0.7420-25 (192m) 0.7560 (341m)
USDCAD: 1.3680 (USD 300m)
NZDUSD: 0.6970 (NZD 198m)
-
07:44
April survey data pointed to further sharp monthly rises in activity and new business in the Spanish service sector - Markit
Higher workloads encouraged firms to expand their operating capacity, and to this end employment increased to the greatest extent in nine months. Companies generally expect these trends to be sustained, supporting further optimism around the 12-month outlook. Meanwhile, cost pressures continued to build and output prices were again raised at one of the fastest rates in the past decade.
The headline seasonally adjusted Business Activity Index ticked up to 57.8 in April, thereby signalling a sharp monthly rise in activity, and one that was slightly faster than seen in March (57.4). Activity has expanded continuously since November 2013, with the latest increase supported by improving economic conditions.
-
07:23
French Presidential Candidate Le Pen: Italy Would Welcome My Efforts To Renegotiate The Euro @LiveSquawk
-
06:54
Mixed start of trading expected on major European stock exchanges: DAX + 0.2%, CAC40 + 0.1%, FTSE -0.4%
-
06:40
Options levels on thursday, May 4, 2017
EUR/USD
Resistance levels (open interest**, contracts)
$1.1024 (3471)
$1.0988 (3998)
$1.0965 (4166)
Price at time of writing this review: $1.0886
Support levels (open interest**, contracts):
$1.0852 (1429)
$1.0804 (1593)
$1.0774 (1529)
Comments:
- Overall open interest on the CALL options with the expiration date June, 9 is 76554 contracts, with the maximum number of contracts with strike price $1,1000 (8365);
- Overall open interest on the PUT options with the expiration date June, 9 is 81380 contracts, with the maximum number of contracts with strike price $1,0700 (6234);
- The ratio of PUT/CALL was 1.06 versus 1.02 from the previous trading day according to data from May, 3
GBP/USD
Resistance levels (open interest**, contracts)
$1.3105 (2145)
$1.3009 (2930)
$1.2913 (1426)
Price at time of writing this review: $1.2845
Support levels (open interest**, contracts):
$1.2791 (1390)
$1.2694 (869)
$1.2596 (1501)
Comments:
- Overall open interest on the CALL options with the expiration date June, 9 is 26693 contracts, with the maximum number of contracts with strike price $1,3000 (2930);
- Overall open interest on the PUT options with the expiration date June, 9 is 30013 contracts, with the maximum number of contracts with strike price $1,2500 (5027);
- The ratio of PUT/CALL was 1.12 versus 1.15 from the previous trading day according to data from May, 3
* - The Chicago Mercantile Exchange bulletin (CME) is used for the calculation.
** - Open interest takes into account the total number of option contracts that are open at the moment.
-
06:31
Fed keeps target interest rate unchanged at 0.75-1.00 pct. Slowdown in first-quarter growth likely to be "transitory," still expects economy to expand at moderate pace
-
Fed repeats near-term risks to the economy appear "roughly balanced"
-
Repeats it will reinvest principal payments from its holdings until rate normalization is well under way
-
Vote in favor of policy was unanimous
-
Business fixed investment has firmed, job gains have been solid and fundamentals for consumption growth also solid
-
Inflation measured on 12-month basis has been running close to target
-
-
06:28
U.S. house majority leader Mccarthy says “big, significant progress” made on Obamacare repeal bill
-
06:27
RBA's Lowe says expect economic growth to pick up gradually, average around 3 pct or so over next few years
-
Want to see continuation of positive employment trends
-
Higher housing supply, transport infrastructure to help balance supply-demand
-
Employment growth has been a bit stronger of late, forward looking indicators positive
-
We should not expect interest rates always to be this low
-
Over time we could expect interest rates to rise in Australia
-
Recent increase in household debt to income has made economy less resilient to future shocks
-
Concerned about impact of sharp house price correction on household spending, economy
-
Higher the indebtedness the greater is the sensitivity of spending to shocks to income
-
-
06:08
China Composite PMI data signalled a further slowdown in growth momentum
The Caixin China Composite PMI data (which covers both manufacturing and services) signalled a further slowdown in growth momentum at the start of the second quarter. This was highlighted by the Composite Output Index posting 51.2 in April, down from 52.1 in March, and the lowest reading for ten months. Latest data saw a loss of momentum across both the manufacturing and service sectors during April.
While manufacturers recorded the weakest rise in production since last September, service providers saw the slowest increase in business activity for 11 months. Weak services growth was illustrated by the seasonally adjusted Caixin China General Services Business Activity Index registering at 51.5, down from 52.2 at the end of the first quarter, to signal only a modest rise in activity levels.
-
06:04
Australian trade balance surplus declined in March
In trend terms, the balance on goods and services was a surplus of $3,804m in March 2017, an increase of $265m (7%) on the surplus in February 2017.
In seasonally adjusted terms, the balance on goods and services was a surplus of $3,107m in March 2017, a decrease of $550m (15%) on the surplus in February 2017.
In seasonally adjusted terms, goods and services credits rose $776m (2%) to $33,343m. Non-monetary gold rose $443m (32%), rural goods rose $271m (7%) and non-rural goods rose $19m. Net exports of goods under merchanting fell $1m (2%). Services credits rose $45m (1%).
-
06:03
Swiss consumer sentiment in April is virtually at its long-term average
With an index value of -8 points, Swiss consumer sentiment in April 2017 is virtually at its long-term average, having been slightly more optimistic in January (-3 points). While expectations for overall economic developments are above average in April, they are less positive than they were in January. Expectations concerning the financial situation and savings possibilities of domestic households are also marginally bleaker. Compared with the last 18 months, however, consumer sentiment remains robust.
The consumer sentiment index from April 2017 stands at -8 points and therefore more or less at its long-term average (-9 points). This corresponds to a marginal downturn on January 2017 (-3 points), albeit at a relatively high level, with the consumer sentiment index having recorded significantly lower values throughout the six preceding quarters.
-
06:01
Switzerland: SECO Consumer Climate, Quarter II -8 (forecast 3)
-
05:27
Global Stocks
European stock markets finished down slightly from a 20-month high on Wednesday, holding lower after a reading on eurozone economic growth matched the market's expectations.
U.S. stocks closed mostly lower Wednesday after the Federal Reserve left interest rates unchanged, as widely expected, and deemed a recent patch of economic weakness as temporary. The main indexes traded in a narrow range over the past several sessions, unable to break to new highs.
Asian stocks tilted lower, with Australian stocks continuing to lag behind, as investors were largely unmoved by an as-expected policy announcement from the Federal Reserve.
-
01:45
China: Markit/Caixin Services PMI, April 51.5 (forecast 52.6)
-
01:30
Australia: Trade Balance , March 3.10 (forecast 3.4)
-
01:03
Australia: HIA New Home Sales, m/m, March -1.1%
-