Market news
-
23:30
Commodities. Daily history for Nov 14’2016:
(raw materials / closing price /% change)
Oil 43.72 +0.92%
Gold 1,221.00 -0.06%
-
23:29
Stocks. Daily history for Nov 14’2016:
(index / closing price / change items /% change)
Nikkei 225 17,672.62 +297.83 +1.71%
Shanghai Composite 3,210.10 +14.06 +0.44%
S&P/ASX 200 5,345.73 0.00 0.00%
FTSE 100 6,753.18 +22.75 +0.34%
CAC 40 4,508.55 +19.28 +0.43%
Xetra DAX 10,693.69 +25.74 +0.24%
S&P 500 2,164.20 -0.25 -0.01%
Dow Jones Industrial Average 18,868.69 +21.03 +0.11%
S&P/TSX Composite 14,598.45 +43.04 +0.30%
-
23:28
Currencies. Daily history for Nov 14’2016:
(pare/closed(GMT +3)/change, %)
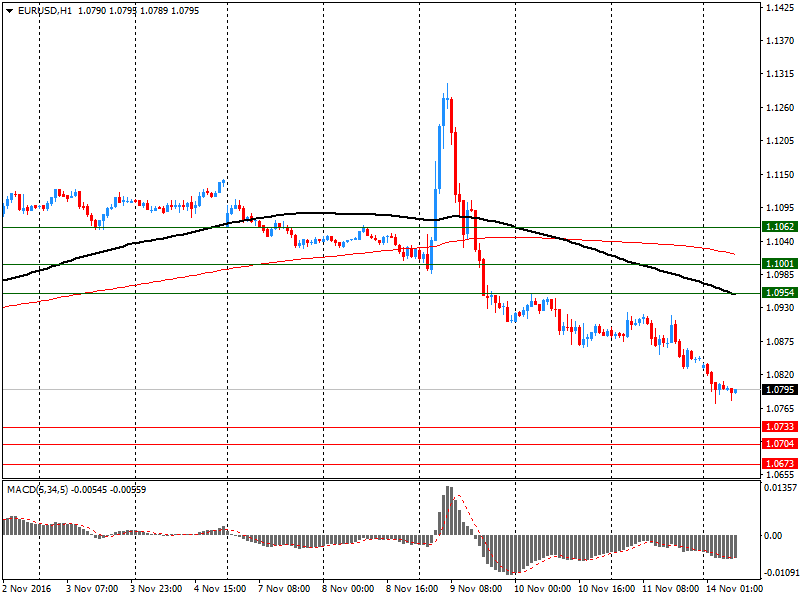
EUR/USD $1,0738 -1,01%
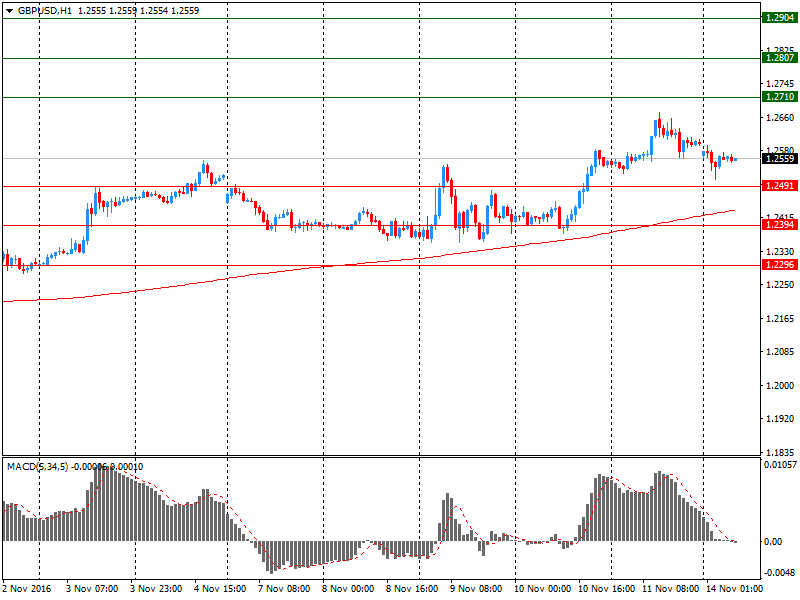
GBP/USD $1,2489 -0,86%
USD/CHF Chf0,9979 +0,99%
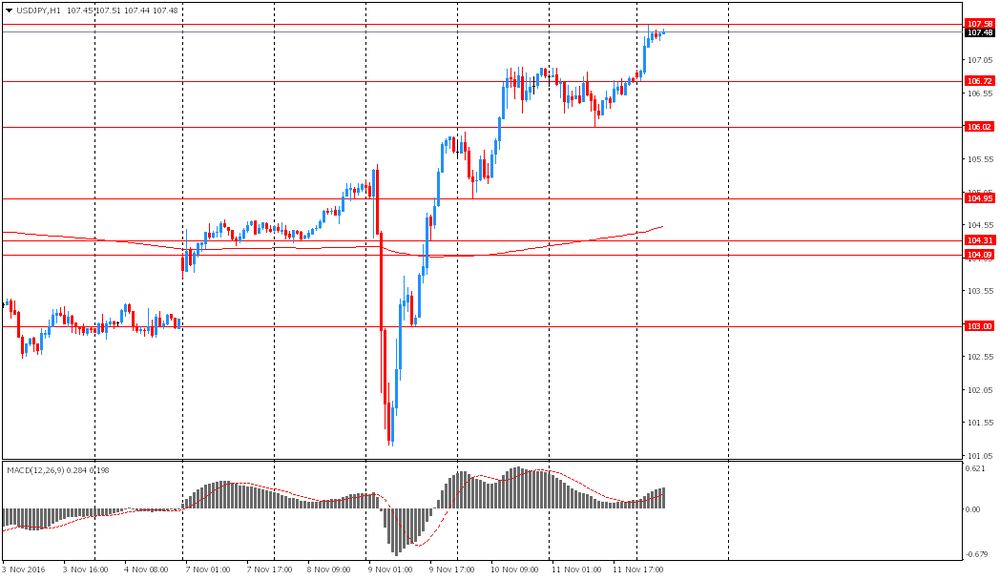
USD/JPY Y108,41 +1,56%
EUR/JPY Y116,39 +0,55%
GBP/JPY Y135,39 +0,72%
AUD/USD $0,7551 +0,11%
NZD/USD $0,7115 -0,10%
USD/CAD C$1,3555 +0,07%
-
22:58
Schedule for today, Tuesday, Nov 15’2016
00:30 Australia RBA Meeting's Minutes
07:00 Germany GDP (QoQ) (Preliminary) Quarter III 0.4% 0.3%
07:00 Germany GDP (YoY) (Preliminary) Quarter III 3.1% 1.8%
09:30 United Kingdom Producer Price Index - Output (MoM) October 0.2% 0.3%
09:30 United Kingdom Producer Price Index - Output (YoY) October 1.2% 1.7%
09:30 United Kingdom Producer Price Index - Input (MoM) October 0.0% 2.2%
09:30 United Kingdom Producer Price Index - Input (YoY) October 7.2% 9.6%
09:30 United Kingdom Retail Price Index, m/m October 0.2% 0.1%
09:30 United Kingdom Retail prices, Y/Y October 2% 2.2%
09:30 United Kingdom HICP, m/m October 0.2% 0.3%
09:30 United Kingdom HICP, Y/Y October 1% 1.1%
09:30 United Kingdom HICP ex EFAT, Y/Y October 1.5%
10:00 Eurozone ZEW Economic Sentiment November 12.3
10:00 Eurozone Trade balance unadjusted September 18.4
10:00 Eurozone GDP (QoQ) (Revised) Quarter III 0.3% 0.3%
10:00 Eurozone GDP (YoY) (Revised) Quarter III 1.6% 1.6%
10:00 Germany ZEW Survey - Economic Sentiment November 6.2 8.9
13:30 U.S. Import Price Index October 0.1% 0.3%
13:30 U.S. Retail sales October 0.6% 0.5%
13:30 U.S. Retail Sales YoY October 2.7%
13:30 U.S. Retail sales excluding auto October 0.5% 0.5%
13:30 U.S. NY Fed Empire State manufacturing index November -6.8 -2
15:00 U.S. Business inventories September 0.2% 0.2%
-
20:00
DJIA 18866.77 19.11 0.10%, NASDAQ 5224.48 -12.64 -0.24%, S&P 500 2165.64 1.19 0.05%
-
17:25
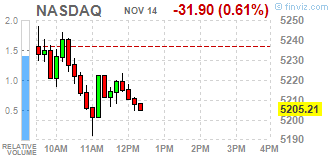
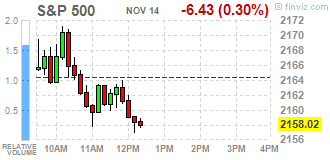
Wall Street. Major U.S. stock-indexes slightly fell
Major U.S. stock-indexes slightly fell. The S&P 500 and the Dow Jones industrial average pared early gains and were little changed on Monday as investors looked for more clarity on President-elect Donald Trump's policies. The tech-heavy Nasdaq Composite was lower, adding to last week's losses. The Dow, which capped off its best week in five years on Friday, hit a another record-high just after the start of trading. Since Trump's triumph last Tuesday, investors have been betting on his campaign promises to simplify regulation in the health and financial sectors and boost spending on infrastructure.
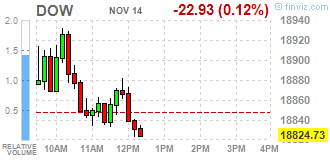
Most of Dow stocks in negative area (19 of 30). Top gainer - UnitedHealth Group Incorporated (UNH, +3.61%). Top loser - Visa Inc. (V, -4.59%).
Most of S&P sectors also in negative area. Top gainer - Conglomerates (+1.7%). Top loser - Technology (-1.3%).
At the moment:
Dow 18782.00 -5.00 -0.03%
S&P 500 2154.75 -6.75 -0.31%
Nasdaq 100 4690.25 -57.75 -1.22%
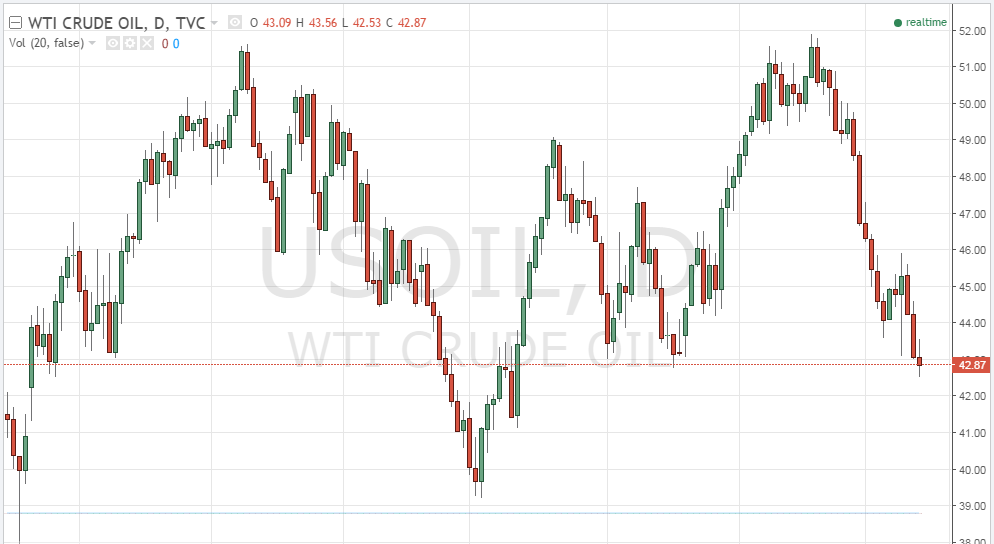
Oil 42.34 -1.07 -2.46%
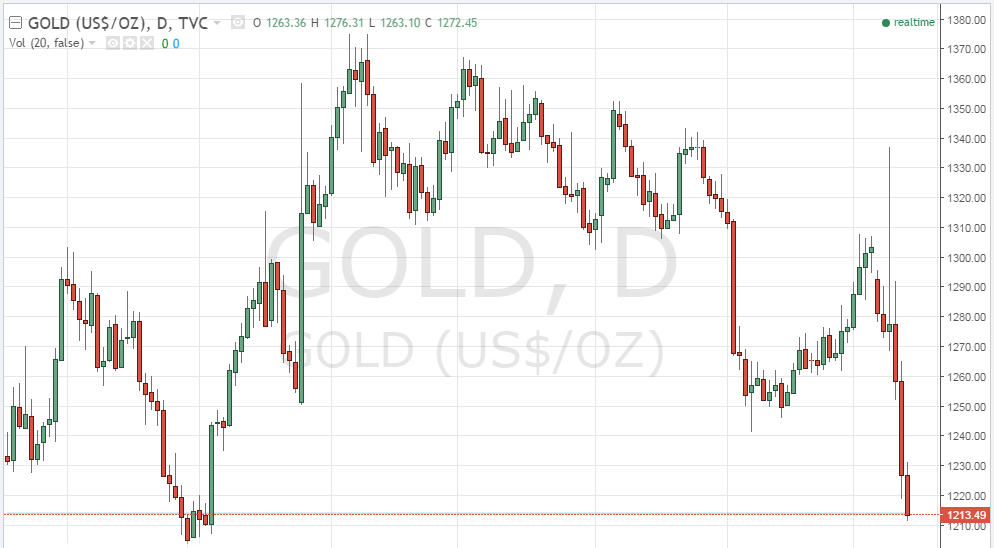
Gold 1219.20 -5.10 -0.42%
U.S. 10yr 2.21 +0.09
-
17:00
European stocks closed: FTSE 6753.18 22.75 0.34%, DAX 10693.69 25.74 0.24%, CAC 4508.55 19.28 0.43%
-
16:35
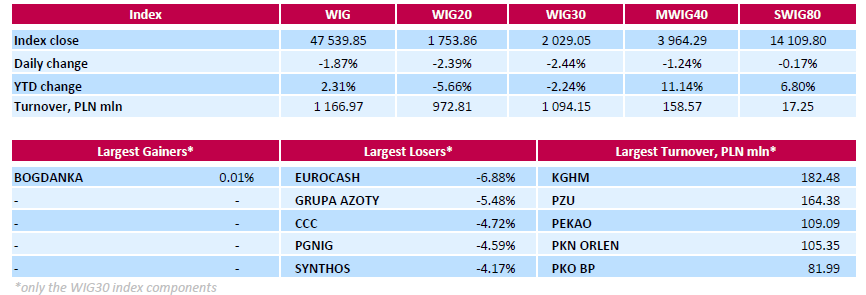
WSE: Session Results
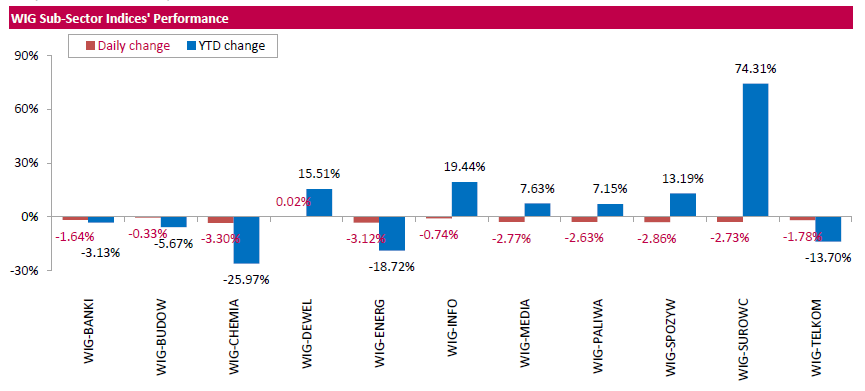
Polish equity market closed lower on Monday. The broad market benchmark, the WIG Index, plunged by 1.87%. The WIG sub-sector indices were mainly lower with chemicals (-3.3%) lagging behind.
The large-cap companies' measure, the WIG30 Index, fell by 2.62%. Thermal coal producer BOGDANKA (WSE: LWB) was sole gainer within the index constituents, edging up 0.01%. At the same time, FMCG-wholesaler EUROCASH (WSE: EUR) and chemical producer GRUPA AZOTY (WSE: ATT) suffered the steepest drops, down 6.88% and 5.48% respectively. Other major underperformers were footwear retailer CCC (WSE: CCC), oil and gas producer PGNIG (WSE: PGN), chemical producer SYNTHOS (WSE: SNS), agricultural producer KERNEL (WSE: KER), and two gencos PGE (WSE: PGE) and ENERGA (WSE: ENG), which lost between 3.88% and 4.72%.
-
16:16
No comments from ECB Governor Draghi on monetary policy
-
15:50
Crude oil futures have stabilized somewhat
Crude oil futures continued to collapse Monday morning amid a stronger dollar and after the IEA warned about a worsening supply glut, according to rttnews.
Meanwhile, OPEC's Monthly Oil Market Report revealed daily oil production for the cartel of 33.64 million barrels for October.
That's up by 240,000 bpd from September.
Elsewhere, the IEA predicted a 500,000-barrel increase in oil production outside the cartel for 2017.
WTI light sweet crude oil was down 72 cents at $42.70 a barrel, its lowest since mid-summer.
-
15:26
Gold continue to decline
Gold price was trading down Monday in London, pressured by a stronger U.S. dollar in the aftermath of Donald Trump's victory in the U.S. presidential election, says Dow Jones.
The Wall Street Journal Dollar Index, which weighs the dollar against a basket of other currencies, was up 0.8%. A stronger dollar is bearish for gold, which is priced in the greenback.
"Gold is still facing considerable headwind: the U.S. dollar is continuing to appreciate," said analysts at Commerzbank.
The prospect of the U.S. Federal Reserve hiking interest rates in December is also pressuring investor sentiment in gold, which doesn't bear interest so struggles to compete when rates rise.
Traders in the market for Fed-funds futures, derivatives used to bet on the timing of Fed interest-rate decisions, reflect an 81% probability of a rate rise by December, according to CME Group.
Among other precious metals, silver fell 0.9% to $17.23 an ounce, platinum shed 0.3% to $940.60 an ounce, and palladium fell 1.5% to $674.20 an ounce.
-
15:00
The dollar appreciated sharply against the euro reaching 5 of January high, helped by increased probability of a Fed hike in December as well as an increase in US bond yields
Expect "buy the rumors, sell the facts" for USD on a Dec hike. Currently the EUR / USD traded at $ 1.0715
-
14:51
WSE: After start on Wall Street
The week on the Warsaw market did not start well. The trading for a few hours is not able to pick up from the session lows. Adding to this the style of today's descent (width, rotation, scale) it does not look good. In the initial phase of the session we were not able to take advantage of the relatively positive sentiment on core markets and in particular the surprisingly positive start of trading in Europe, which was inspired by a better behavior of the US contracts. Entry into afternoon phase of trading in Europe was held under the sign of far more modest than previously growth, and at the same time leaving the level of resistance, visible especially in Germany and France.
The market in the US opens with increase, but the beginning looks neutral on the background of recent observed volatility.
An hour before the end of today's trading the WIG20 index was at the level of 1,759 points (-2.06%).
-
14:45
Nordea has a comprehensive review regarding the dollar. US productivity to play an important role
"While little is known about scope of Trumps future policies yet, the direction is known. Markets diverged - but not permanently. Trump is NOT Reagan, and Yellen is NOT Volcker, hence the implications for the USD and rates are different going forward...
Trump managed to cause significant divergences in Markets last week: despite the base commodity prices, inflation breakevens, equity prices shooting up, the USD outperformed broadly. Will Trump make the USD great again?
While everyone focused on inflation expectations rising, the main cause of the USD strength was the rise in the USD real rates. The Market went from expecting just one Fed hike within a year to almost two hikes. The longer maturity Treasury real yields rose, e.g. the 10Y real yield came up 16bps in just a week! Hence, the broad USD strength.
But is there a justification for higher USD real yields? So far, the impression from the media has been that Trump will be another Republican Reagan who will produce an "economic miracle" by introducing supply side policies, and he will replace Yellen with Taylor or another central banker who will hike rates...maybe like Volcker did in 80s? A big myth hanging around is that Republicans in general are better for the USD ("strong USD is in the US best interests"). Well, they are not.
If there is one factor justifying higher real yields with "stronger USD and higher equity prices" is NOT which party holds presidency, but the rising US productivity. Have you seen the US productivity lately? Decade lows, and the recent capital investment patterns offer no hope for major improvement in years ahead. By contrast, during the Reagan years, and in the run-up to the dot-com bubble burst, where the US economy looked like a miracle, we indeed saw the USD stronger with rising equity prices, so a rise in real USD yields was justified. Is there a reason to believe Trump will achieve the same productivity burst again? Meh.
While little is known about exact polices, we may at least disentangle the policy shifts with Trump. Sketch a simple supply and demand framework. Depict the demand curve shifting to the right - as a realization of Trump's proposal of unfunded fiscal spending. Now, the supply side curve should shift to the right due to the proposed deregulation of financial sector, tax cuts. More growth! Not so fast.
The key difference between Reagan and Trump is that Reagan was pro-free trade and immigration. So what Trump may achieve domestically on the supply side, he may well kill with the foreign policy - anti-trade, anti-immigration measures. And given the power and realistic chances Trump has over changing the domestic supply factors quickly (killing Obamacare, Dodd-Frank…) over foreign (dismantling trade deals, imposing barriers), it does seem that the supply curve may eventually shift to the left, at least initially - i.e., less real growth, and potentially more inflation.
Will the fiscal extravagance cause the US growth miracle? Doubtful. What we may end up having with Trump is a flash-in-the-pan fiscal easing binge. But soon it will hit the wall, as will be met by circumstances, again, totally different than those of the starting point for Reagan: a larger twin deficit (need FOREIGN funding, including China), and the US public debt/GDP over three times larger. The US already got its sovereign downgrade back in 2011. Not sure Trump sees it as a way to make America great again.
Fed response? Yellen speaks on Capitol Hill this Thursday. For now, it seems Yellen will serve the full term until February 2018. Yellen is not Volcker, and it's not the roaring 80s in terms of growth and inflation. There is thus no reason for Fed to become more hawkish now. In fact, quite the opposite - domestic economic uncertainty largest since the US downgrade, and the monetary conditions have tightened after the US election, with the stronger USD and higher rates. So, if anything, more of the same in Markets will be met by Fed playing down, not up, expectations for tightening. This should be a natural killer of the market divergences we saw last week".
Copyright © 2016 Nordea, eFXnews™
-
14:33
U.S. Stocks open: Dow +0.23%, Nasdaq -0.10%, S&P +0.12%
-
14:27
Before the bell: S&P futures +0.27%, NASDAQ futures +0.06%
U.S. stock-index futures inched up as a slump in crude prices sapped some momentum from investors' surging appetite for riskier assets.
Global Stocks:
Nikkei 17,672.62 +297.83 +1.71%
Hang Seng 22,222.22 -308.87 -1.37%
Shanghai 3,210.10 +14.06 +0.44%
FTSE 6,752.16 +21.73 +0.32%
CAC 4,506.42 +17.15 +0.38%
DAX 10,723.30 +55.35 +0.52%
Gold $42.77 (-1.47%)
Crude $1,221.40 (-0.24%)
-
14:17
US 2-Year Yield Briefly Brushes Over 1% on Fed Outlook
-
14:15
Russia's GDP Shrinks 0.4% in Third Quarter
-
13:57
Wall Street. Stocks before the bell
(company / ticker / price / change ($/%) / volume)
ALCOA INC.
AA
29.53
0.23(0.785%)
330
ALTRIA GROUP INC.
MO
61.89
0.13(0.2105%)
3595
Amazon.com Inc., NASDAQ
AMZN
744.78
5.77(0.7808%)
25016
Apple Inc.
AAPL
108.19
-0.24(-0.2213%)
97997
AT&T Inc
T
36.59
0.08(0.2191%)
8340
Barrick Gold Corporation, NYSE
ABX
14.74
-0.10(-0.6739%)
115163
Boeing Co
BA
149
0.48(0.3232%)
1146
Caterpillar Inc
CAT
93.29
0.28(0.301%)
7214
Chevron Corp
CVX
106.35
-0.29(-0.2719%)
1810
Cisco Systems Inc
CSCO
31.42
0.06(0.1913%)
7504
Citigroup Inc., NYSE
C
53.09
0.26(0.4921%)
267959
E. I. du Pont de Nemours and Co
DD
69.57
0.36(0.5202%)
685
Exxon Mobil Corp
XOM
85.38
-0.29(-0.3385%)
6612
Facebook, Inc.
FB
119.35
0.33(0.2773%)
133164
Ford Motor Co.
F
12.24
-0.04(-0.3257%)
26080
Freeport-McMoRan Copper & Gold Inc., NYSE
FCX
14.17
0.23(1.6499%)
208937
General Electric Co
GE
30.82
0.11(0.3582%)
36271
General Motors Company, NYSE
GM
33.82
-0.20(-0.5879%)
5761
Goldman Sachs
GS
204.94
1.00(0.4903%)
18585
Google Inc.
GOOG
758
3.98(0.5278%)
9745
Home Depot Inc
HD
130.55
0.70(0.5391%)
2216
HONEYWELL INTERNATIONAL INC.
HON
113.68
0.43(0.3797%)
184
Intel Corp
INTC
34.63
0.02(0.0578%)
2262
International Business Machines Co...
IBM
161.96
0.69(0.4279%)
3114
International Paper Company
IP
45.79
0.13(0.2847%)
100
Johnson & Johnson
JNJ
119
0.53(0.4474%)
1314
JPMorgan Chase and Co
JPM
77.05
0.36(0.4694%)
25692
McDonald's Corp
MCD
114.55
0.33(0.2889%)
950
Merck & Co Inc
MRK
64.2
0.25(0.3909%)
3617
Microsoft Corp
MSFT
59.15
0.13(0.2203%)
59590
Pfizer Inc
PFE
33.09
0.50(1.5342%)
30448
Procter & Gamble Co
PG
83.71
0.13(0.1555%)
2365
Starbucks Corporation, NASDAQ
SBUX
54
0.07(0.1298%)
4548
Tesla Motors, Inc., NASDAQ
TSLA
188
-0.56(-0.297%)
11387
Twitter, Inc., NYSE
TWTR
18.85
0.30(1.6173%)
225765
Visa
V
82.55
0.67(0.8183%)
290
Yahoo! Inc., NASDAQ
YHOO
40.3
-0.12(-0.2969%)
367
Yandex N.V., NASDAQ
YNDX
18.42
-0.29(-1.55%)
945
-
13:52
Upgrades and downgrades before the market open
Upgrades:
Citigroup (C) upgraded to Overweight from Equal-Weight at Morgan Stanley
Downgrades:
Other:
-
13:50
Option expiries for today's 10:00 ET NY cut
EURUSD 1.0800 (EUR 985m) 1.0900 (544m) 1.0925 (297m) 1.0945-50 (799m) 1.1000 (1.2bn) 1.1020 (1.03bn) 1.1025 (429m) 1.1045-50 (574m) 1.1075 (477m)1.1200 (535m) 1.1230 (572m) 1.1250 (1.62bn)
USDJPY 103.00 (1.11bn) 104.10 (360m) 104.10-20 (840m) 105.00 (1.03bn) 106.00 (560m) 106.50 (646m)
GBPUSD 1.2500 (GBP 216m) 1.2560 (303m) 1.2625 (356m)
USDCHF 0.9600 (USD 286m)
AUDUSD 0.7400 (500m) 0.7475 (218m) 0.7600 (308m) 0.7700 (352m)
USDCAD 1.3200 (540m) 1.3350 (239m) 1.3400 (220m) 1.3600 (431m) 1.3800 (600m)
NZDUSD 0.7200 (NZD 300m) 0.7300 (400m)
EURJPY 116.25 (EUR 279m)
AUDJPY 79.50 (AUD 260m)
-
13:24
European session review: the US dollar continued to appreciate against most major currencies
The following data was published:
(Time / country / index / period / previous value / forecast)
10:15 Switzerland manufacturers and import price index y / y in October -0.1% -0.2%
12:00 Eurozone Industrial Production m / m in September to 1.8% -1.0% -0.8%
12:00 Eurozone Industrial Production y / y in September 2.2% 1.0% 1.2%
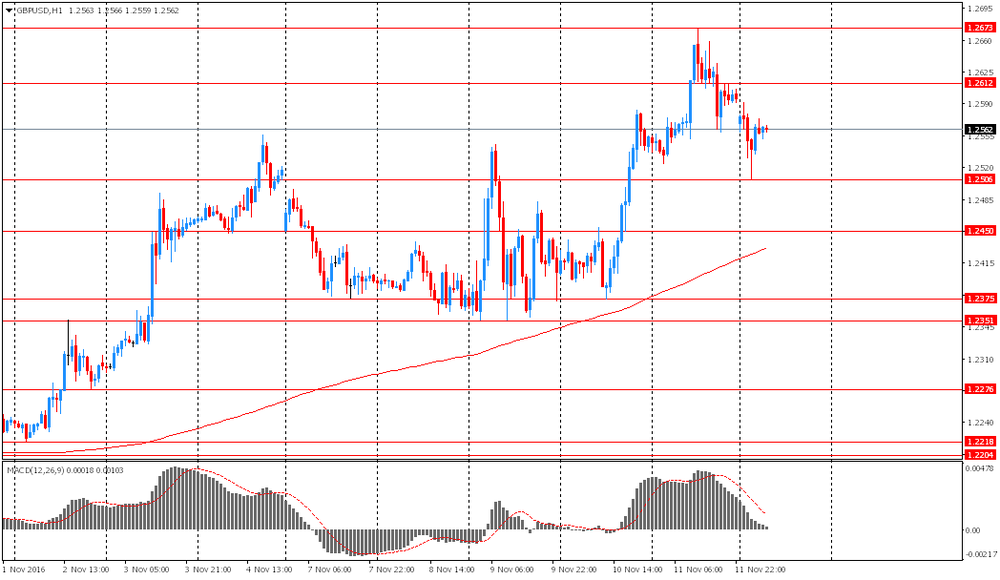
The pound retreated from session low against the US dollar, but still shows a decline. In the absence of new catalysts trading dynamics was dictate by risk appetite and sentiment. Later today, Theresa May will give a speach in which it must discuss the issue of trade relations between the United States and Britain. Later this week, investors will pay attention to the October inflation data from UK. Consumer prices in September grew at the fastest pace in almost two years, and most experts expect further acceleration of inflation due to the weakening of the pound after Brexit. Economists expect annual inflation to rise to 1.1% in Octobe vs 1% in September. In addition, markets will wait for the October data for the UK labor market, which in combination with data on retail sales is likely to move the pound significantly. According to forecasts, the unemployment rate remained at around 4.9%, while average earnings growth accelerated to 2.4% from 2.3%.
The dollar rose against the yen significantly by updating 7 of June high. Many experts believe that if the situation remains favorable in the markets it is unlikely that anything will prevent the Fed to raise rates in December. According to the futures market, now the likelihood of tighter monetary policy in December is 81.1% against 71.5% on Friday.
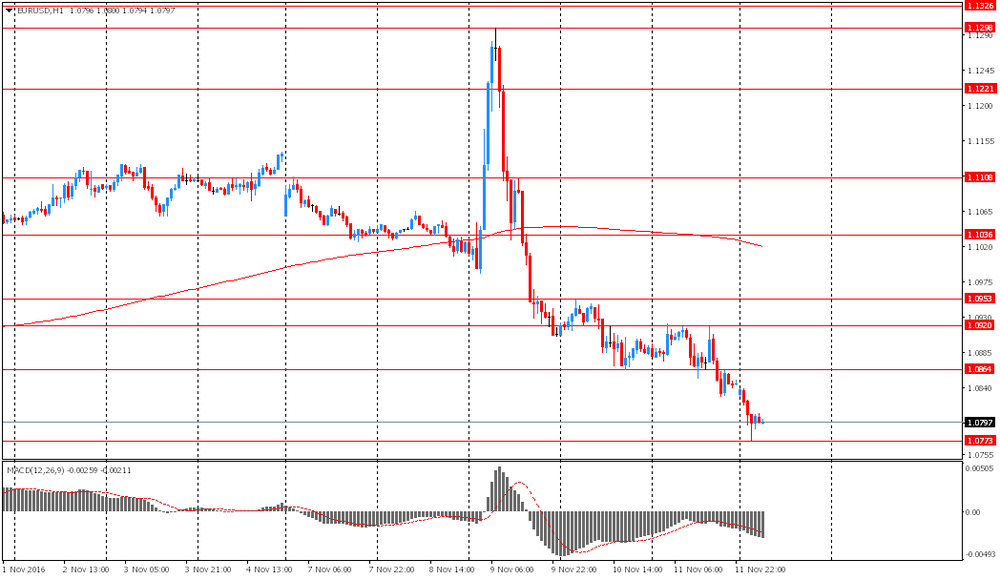
EUR / USD: during the European session, the pair fell to $ 1.0725, but then recovered to $ 1.0785
GBP / USD: during the European session, the pair fell to $ 1.2460 and then retreated to $ 1.2535
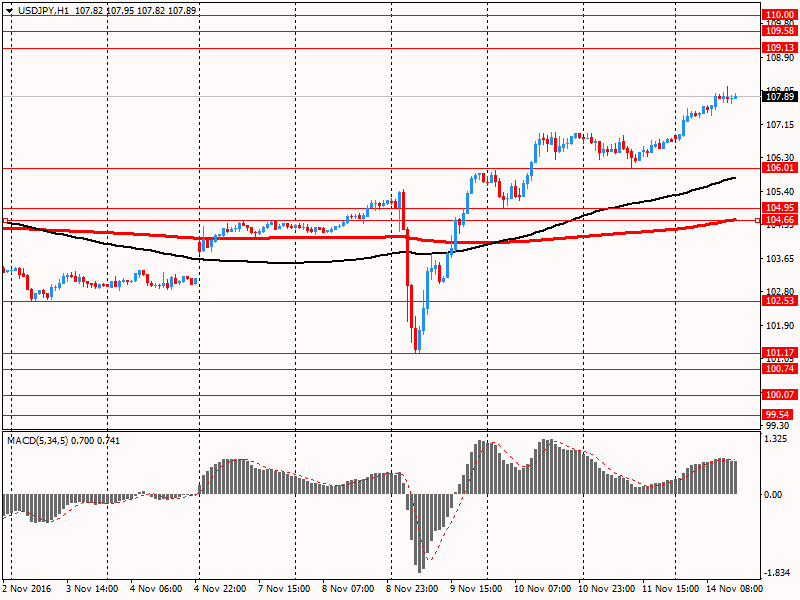
USD / JPY: during the European session the pair rose to Y108.14
-
12:50
Orders
EUR/USD
Offers 1.0780 1.0800 1.0825-30 1.0850 1.0865 1.0900 1.0925-30 1.0950 1.0980-851.1000
Bids 1.0750 1.0720 1.0700 1.0680 1.0650 1.0630 1.0600
GBP/USD
Offers 1.2500 1.2530 1.2550 1.2580-85 1.2600 1.2620 1.2650 1.2685 1.2700
Bids 1.2450 1.2420 1.2400 1.2375-80 1 .2350 1.2330 1.2300
EUR/GBP
Offers 0.8630-35 0.8660 0.8680 0.8700 0.8730 0.8750 0.8785 0.8800
Bids 0.8580-85 0.8550 0.8500 0.8450 0.0.8430 0.8400
EUR/JPY
Offers 116.30 116.50-55 117.00 117.30 117.50 118.00 118.45-50 119.00
Bids 115.80 115.60 115.30 115.00 114.80 114.50 114.20 114.00
USD/JPY
Offers 107.70 107.85 108.00 108.50 109.00 109.15-20 109.50
Bids 107.30 107.00 106.80-75 106.50 106.20 106.00 105.75-80 105.50 105.20 105.00
AUD/USD
Offers 0.7560-65 0.7580 0.7600 0.7630 0.7660 0.7685 0.7700 0.7730 0.7750
Bids 0.7520 0.7500 0.7475-80 0.7450 0.7420-25 0.7400
-
12:29
Citi still favor GBP/USD shorts. Says bounce driven by investors' distraction
"The election, high court ruling and less dovish BoE have distracted investors playing GBP shorts.
There is some speculation that the Trump win can translate into a better political position for the UK vis-à-vis the EU, but the logic is not convincing. US-UK trade has not been an issue. Trade weighted rate differentials have moved against GBP since last week and should stay low without material local stimulus. The Autumn Statement in two weeks is significant in this regard, but doesn't look a catalyst. We think rates and FX vol stay supported while Brexit back-and-forth persists. The January Supreme Court ruling we suspect will not alleviate policy uncertainty. As much makes us hesitant to expect direct investment inflows yet.
We still favor shorts in GBPUSD".
Copyright © 2016 CitiFX, eFXnews™
-
12:03
WSE: Mid session comment
The Warsaw market from the very beginning of the session grabs clear shortness of breath, unable to fully take advantage of a favorable environment, which is consolidating at key resistance of core markets indices. But this is not a surprise, the WSE fits clearly in the attitude of emerging markets where trade is taking increasingly lower levels. To the weakness of blue chips attached worse attitude of the broad market in the form of small and medium-sized companies. In addition, in Western Europe there was also deterioration in sentiment in the noon phase of trading, although increases there are still maintained. Locally, in the case of blue chips not much left from the post-election rally and at the level of the WIG20 index we are back to the area of lows from the beginning of November, when the market feared a victory of Trump.
At the halfway point of today's trading the WIG20 index was at the level 1,767 points (-1,67%), with the turnover of PLN 465 million.
-
11:46
Major stock indices in Europe show a positive trend
European stocks are rising again after two days of decline, helped by an increase in prices of mining companies and banks against the background of investors' optimism that the newly elected US President will stimulate growth in the world's largest economy. However, the index is also supported by mergers and acquisitions (M & A).
Particular attention of investors is also drawn by statistical data for the euro area. Eurostat showed that the seasonally adjusted volume of industrial production in the euro zone fell in September by 0.8% after rising 1.8% in the previous month (revised from + 1.6%). Experts predicted a drop of 1.0%. Meanwhile, among the EU countries, industrial production fell by 0.7% after rising 1.6% in the previous month. On an annual basis, industrial production increased by 1.2% in the euro area and by 1.2% in the EU. It was expected that production in the euro zone will grow by 1.0% after rising 2.2% in August (revised from + 1.8%). Among Member States for which data are available, the largest decline in industrial production were registered in Denmark (-8.1%), Germany (-1.9%) and Greece (-1.8%). Top growth was observed in Sweden (+ 7.6%), Ireland (+ 6.4%) and Estonia (+ 5.2%).
The composite index of the largest companies in the region Stoxx Europe Index 600 rose 0.6 percent.
Mining shares demonstrate the best performance among 19 industry groups Stoxx Europe 600 Index, due to an increase in metal prices. Shares of Rio Tinto Group, Glencore Plc and BHP Billiton Ltd rose by at least 2.4 percent.
Bank shares also increased markedly, mainly due to the rise of UBS Group and HSBC Holdings Plc.
The capitalization of Siemens increased 1.9 percent after the purchase of Mentor Graphics Corp for $ 4.5 billion. This step will allow Siemens to expand their opportunities for industrial software.
Novartis shares fell 0.4 percent after people familiar with the matter, said that the Swiss pharmaceutical company is in talks to acquire US Amneal Pharmaceuticals LLC.
The cost of Intrum Justitia AB jumped 12 percent as the largest debt collector in Europe said that acquires Lindorff for $ 1.96 billion.
At the moment:
FTSE 100 +40.65 6771.08 + 0.60%
DAX +40.14 10708.09 + 0.38%
CAC 40 +20.99 4510.26 + 0.47%
-
10:39
Constancio: Turning Point Would be 'Good Indicator' That Headline CPI Benefitting From Domestic Factors
-
Don't See Need to React Specifically to Rising Yield Curve
-
Sees Heightened Uncertainty Following Trump Victory
-
Growth Will Increase in Short Term in US
-
We Would Like to See a Turning Point in Core Inflation
-
-
10:34
Industrial production fell by 0.8% in the euro area
In September 2016 compared with August 2016, seasonally adjusted industrial production fell by 0.8% in the euro area (EA19) and by 0.7% in the EU28, according to estimates from Eurostat, the statistical office of the European Union. In August 2016 industrial production rose by 1.8% in the euro area and by 1.6% in the EU28. In September 2016 compared with September 2015, industrial production increased by 1.2% in both zones.
The decrease of 0.8% in industrial production in the euro area in September 2016, compared with August 2016, is due to production of durable consumer goods falling by 5.6%, capital goods by 2.2%, intermediate goods by 0.7% and energy by 0.2%, while production of non-durable consumer goods rose by 0.3%. In the EU28, the decrease of 0.7% is due to production of durable consumer goods falling by 3.7%, capital goods by 1.6%, energy by 0.6%, non-durable consumer goods by 0.4% and intermediate goods by 0.1%. Among Member States for which data are available, the largest decreases in industrial production were registered in Denmark (-8.1%), Germany (-1.9%) and Greece (-1.8%), and the highest increases in Sweden (+7.6%), Ireland (+6.4%) and Estonia (+5.2%).
-
10:00
Eurozone: Industrial production, (MoM), September -0.8% (forecast -1.0%)
-
10:00
Eurozone: Industrial Production (YoY), September 1.2% (forecast 1.0%)
-
09:26
Oil is trading lower
This morning, the New York futures for Brent dropped 0.48% to $ 43.20 and WTI fell 0.36% to $ 44.59 per barrel. Thus, the black gold is traded in the red zone on the background of an increase in production in the OPEC countries, as well as an increase in the number of drilling rigs in the United States. Recall Friday, the cartel said that in October, oil production was higher by nearly 240 thousand barrels per day as compared to September, up to 33.64 million barrels per day. On Thursday, November 10, the International Energy Agency (IEA) also stated that total production of oil increased 230 thousand barrels per day as compared to September, to a record high of 33.83 million barrels per day.
-
09:06
Swiss producer price index fell by 0.1
The overall index of producer and import prices rose in October 2016 from the previous month by 0.1 percent, reaching 99.8 points (base December 2015 = 100). While the producer price index fell by 0.1 percent, the import price index increased by 0.3 percent. The slight increase in the total amount is mainly due to higher prices of petroleum products. Compared to October 2015, the price level of the whole range of domestic and imported products fell by 0.2 percent. This is evident from the figures of the Federal Statistical Office (FSO).
-
09:01
Option expiries for today's 10:00 ET NY cut
EUR/USD 1.0800 (EUR 985m) 1.0900 (544m) 1.0925 (297m) 1.0945-50 (799m),1.1000 (1.2bn) 1.1020 (1.03bn) 1.1025,(429m) 1.1045-50 (574m), 1.1075 (477m)1.1200 (535m) 1.1230 (572m) 1.1250 (1.62bn)
USD/JPY 103.00 (1.11bn) 104.10 (360m) 104.10-20 (840m), 105.00 (1.03bn) 106.00 (560m) 106.50 (646m)
GBP/USD 1.2500 (GBP 216m) 1.2560 (303m) 1.2625 (356m)
USD/CHF 0.9600 (USD 286m)
AUD/USD 0.7400 (500m) 0.7475 (218m) 0.7600 (308m) 0.7700 (352m)
USD/CAD 1.3200 (540m) 1.3350 (239m) 1.3400 (220m), 1.3600 (431m) 1.3800 (600m)
NZD/USD 0.7200 (NZD 300m) 0.7300 (400m)
EUR/JPY 116.25 (EUR 279m)
-
08:51
Major stock exchanges trading in the green zone: FTSE + 0.9%, DAX + 0.8%, CAC40 + 0.9%, FTMIB + 0.9%, IBEX + 0.9%
-
08:36
EUR/USD Falls to 10-Month Low of $1.0762
-
08:18
WSE: After opening
WIG20 index opened at 1794.23 points (-0.14%)*
WIG 48626.04 0.37%
WIG30 2089.27 0.46%
mWIG40 4029.09 0.38%
*/ - change to previous close
The cash market started the day from a discount of 0.14% to 1,794 points, but quickly rises above, piercing even the psychological level of 1,800 points.
The beginning of the session on the Warsaw Stock Exchange is the answer to better performance of core markets, namely the maintenance of nearby peaks, which opens the way to the theoretically possible attack. The first violin again plays KGHM, reacting to Friday's turmoil in the copper market, which look like classic solstice. The market is very volatile and these fluctuations after the one day break must find a new balance.
After fifteen minutes of trading the WIG20 index was at the level of 1,799 points (+0,17%).
-
08:17
Deutsche Bank thinks it’s time for EUR/USD to head to parity
"We have been structurally bearish EUR/USD for a long time but scaled back our confidence levels this year as the Fed turned dovish and the ECB ran out of easing options. The Trump victory has changed things.
We now feel more confident that EUR/USD will break out of its 1.05-1.15 range and trade through parity next year.
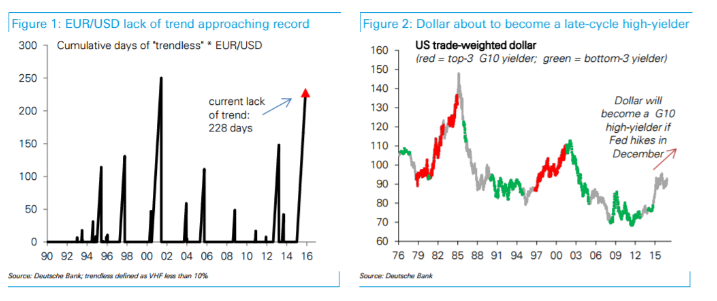
First, it is high time EURUSD started to move again. The duration of the current lack of trend is approaching a record high (chart 1). When EURUSD last broke out of such a prolonged range corporate hedgers and asset allocators were caught off guard and the EUR moved 10% within the following few weeks.
Second, the dollar is approaching its sweet spot for a late-cycle rally. Big dollar moves are less dependent on the change in short-end yields but on the absolute level: whenever the dollar becomes a top-3 G10 high-yielder it rallies as yieldseeking inflows return. A Fed rate hike this December will make the dollar the third highest yielding currency in the world, a strong dollar positive (chart 2).
Finally, divergence is back. Even before Trump, the risks to US growth were tilted to the upside (chart 3). More fiscal and regulatory easing would add further upside risk to the growth and Fed outlook. Meantime European risks are tilted to the downside given a deteriorating credit impulse and political outlook (chart 4). The recent rise in European real rates increases the odds of a more dovish ECB.
Our EUR/USD forecasts remain at 1.05 and 95 cents for end-16 and end-17 respectively".
Copyright © 2016 DB, eFXnews™
-
08:16
Switzerland: Producer & Import Prices, y/y, October -0.2%
-
08:09
Today’s events
-
At 12:00 GMT the ECB Vice-President Vitor Constancio will deliver a speech
-
At 18:45 GMT the ECB president Mario Draghi will deliver a speech
-
At 21:00 GMT ECB Board Member Peter Praet will deliver a speech
-
-
08:06
Asian session review: The Australian dollar traded lower
The Australian dollar was down against the US dollar after weak data from China. The Index of industrial production, published by the National Bureau of Statistics, rose in October by 6.1% on an annualized basis as well as in September, but was slightly below analysts' forecast of 6.2%. Since the beginning of this year, industrial production in China increased by 6% in annual terms. In addition, in October the retail sales in China fell to 10.0% from the previous value of 10.7% year on year. Analysts had expected the index to coincide with the value of September. Retail sales from the beginning of the year were also weaker than forecast, down from 10.4% to 10.3%.
At the same time, support for the Australian currency was a growth in iron ore prices, which is the largest section of Australian exports. On Friday, its value increased by 7.4%. The price for Australian coking coal since the beginning of this year has tripled, exceeding US $ 300 per tonne.
Nikkei rose more than 1.6% after the publication of strong data on Japan's GDP. As reported today by Japan's Cabinet Office, gross domestic product in the third quarter increased by 0.5%, from the previous value of 0.2%. In annual terms, the indicator rose by 2.2%, after rising 0.7% in the second quarter. Economists had expected Japan's economy grew by 0.9% y/y.
EUR / USD: during the Asian session the pair fell to $ 1.0775
GBP / USD: during the Asian session the pair fell to $ 1.2505
USD / JPY: rose to Y107.60 in the Asian session
-
07:33
Housing prices in New Zealand rose by 4% in October
According to data released today by the Institute of Real Estate of New Zealand (REINZ), seasonally adjusted house prices rose in October by 4% compared with the previous month. In annual terms, the average price of real estates has risen by 10.9%. The country's largest city, Auckland, saw a rise of 16% compared to October 2015.
However, a spokesman for REINZ, Bryan Thomson said there was a reduction in sales of houses in October by 14% compared to the same period of last year. According to the website realestate.co.nz were sold 7.400 less real estate.
-
07:26
Japan's GDP in the third quarter, above expectations
According to data released by the Cabinet of Ministers of Japan, the country's GDP in the third quarter increased by 0.5%, from the previous value of 0.2%. In annual terms, the indicator rose by 2.2% in the third quarter, after rising 0.7% in the second quarter. Economists had expected Japan's economy to grew by 0.9% y/y. Japanese gross domestic product estimates the growth or decline of the economy and is a key macroeconomic indicator of market activity.
-
07:24
Bank of Japan Governor, Kuroda: Closely monitor whether banks profitability decline affects financial intermediation
-
We will continue to carefully monitor the impact of negative interest rates on banks
-
Markets seem to like Trump's victory
-
Little is known about Trump's policy, so it is premature to comment on that
-
Hopefully Trump's policy will contribute positively to the world and the US economy
-
GDP data showed that Japan's economy is firmly on its feet
-
GDP data indicate a moderate uptrend
-
Trans-Pacific Partnership will clearly be a boon for Japan
-
The disappearance of the downward pressure from oil prices will allow the inflation of consumer prices in Japan to return to positive territory
-
-
07:22
Australian Dollar Falls as Investors Pile Into U.S. Assets After Trump Victory
-
07:20
WSE: Before opening
The Warsaw Stock Exchange into the new week comes with the need to catch up the one missing day of trading. On Friday, during our national holiday the global financial market worked and a lot on it happened. Investors are still trying to discount the possible changes associated with Donald Trump winning. The market is counting on increased spending financed by increased issuance of bonds while reducing taxes. As a result increase the bonds profitability, strengthens the dollar, and the assets of emerging markets have come under pressure. On Friday, the MSCI Emerging Markets index went down by 2.9% and broke the important support. It's not the best news for the Warsaw Stock Exchange.
Morning mood is very positive. Contracts in the US gain of 0.6%, which should lead to positive openings in Europe.
In Asia, the Nikkei gaining only and the other emerging parquets are under pressure. Copper prices remain very volatile but the balance puts the price of metal near the close on Thursday, which means a relatively neutral impact on our market.
-
07:19
China's industrial production and retail sales grew less-than-expected in October
China's industrial production and retail sales grew less-than-expected in October, while fixed asset investment growth improved slightly, figures from the National Bureau of Statistics revealed Monday, cited by rttnews.
Industrial production increased 6.1 percent year-on-year in October, at the same pace of growth as seen in September. This was slower than the 6.2 percent expansion economists had expected.
At the same time, retail sales growth eased to 10 percent from 10.7 percent in September, signaling a slowdown in domestic demand. A similar growth was last seen in May. The annual pace of expansion was expected to stabilize at 10.7 percent.
-
07:18
New Zealand: Severe earthquake hits Hanmer Springs, felt widely across
-
06:05
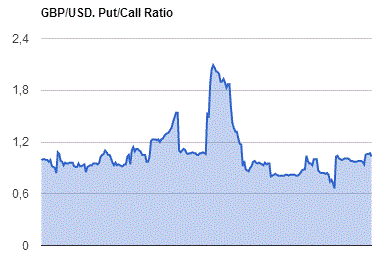
Options levels on monday, November 14, 2016:
EUR/USD
Resistance levels (open interest**, contracts)
$1.1062 (2151)
$1.1001 (1407)
$1.0954 (659)
Price at time of writing this review: $1.0795
Support levels (open interest**, contracts):
$1.0733 (2824)
$1.0704 (4919)
$1.0673 (2429)
Comments:
- Overall open interest on the CALL options with the expiration date December, 9 is 62687 contracts, with the maximum number of contracts with strike price $1,1400 (6325);
- Overall open interest on the PUT options with the expiration date December, 9 is 57567 contracts, with the maximum number of contracts with strike price $1,0800 (4919);
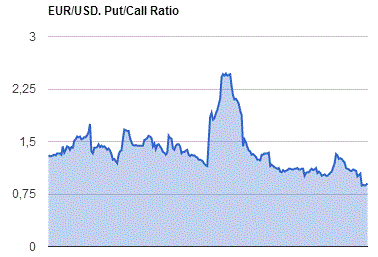
- The ratio of PUT/CALL was 0.92 versus 0.90 from the previous trading day according to data from November, 11
GBP/USD
Resistance levels (open interest**, contracts)
$1.2904 (630)
$1.2807 (1161)
$1.2710 (1442)
Price at time of writing this review: $1.2559
Support levels (open interest**, contracts):
$1.2491 (2915)
$1.2394 (1287)
$1.2296 (3618)
Comments:
- Overall open interest on the CALL options with the expiration date December, 9 is 34127 contracts, with the maximum number of contracts with strike price $1,3400 (2560);
- Overall open interest on the PUT options with the expiration date December, 9 is 34710 contracts, with the maximum number of contracts with strike price $1,2300 (3618);
- The ratio of PUT/CALL was 1.02 versus 1.03 from the previous trading day according to data from November, 11
* - The Chicago Mercantile Exchange bulletin (CME) is used for the calculation.
** - Open interest takes into account the total number of option contracts that are open at the moment.
-
04:36
Japan: Industrial Production (MoM) , September 0.6%
-
04:35
Japan: Industrial Production (YoY), September 1.5%
-
02:00
China: Industrial Production y/y, October 6.1% (forecast 6.2%)
-
02:00
China: Retail Sales y/y, October 10.0% (forecast 10.7%)
-
02:00
China: Fixed Asset Investment, September 8.3% (forecast 8.2%)
-