Noticias del mercado
-
16:20
US construction spending tumbled well below forecasts in June - Marketwatch
Spending on construction tumbled 0.6% in June, with declines spread evenly across the private and public sectors, the Commerce Department said Monday. That was well below forecasts. Economists surveyed by Econoday had expected a 0.6% increase. Outlays are still 6.2% higher for the first six months of the year compared to the same period in 2015. Housing seems to be holding its own: private residential construction was up 2.6% during the month, making it one of the strongest categories.
-
16:05
US ISM manufacturing declined to 52.6
Economic activity in the manufacturing sector expanded in July for the fifth consecutive month, while the overall economy grew for the 86th consecutive month, say the nation's supply executives in the latest Manufacturing ISM Report On Business.
"The July PMI registered 52.6 percent, a decrease of 0.6 percentage point from the June reading of 53.2 percent. The New Orders Index registered 56.9 percent, a decrease of 0.1 percentage point from the June reading of 57 percent. The Production Index registered 55.4 percent, 0.7 percentage point higher than the June reading of 54.7 percent. The Employment Index registered 49.4 percent, a decrease of 1 percentage point from the June reading of 50.4 percent. Inventories of raw materials registered 49.5 percent, an increase of 1 percentage point from the June reading of 48.5 percent.
The Prices Index registered 55 percent, a decrease of 5.5 percentage points from the June reading of 60.5 percent, indicating higher raw materials prices for the fifth consecutive month. Manufacturing registered growth in July for the fifth consecutive month, as 12 of our 18 industries reported an increase in new orders in July (same as in June), and nine of our 18 industries reported an increase in production in July (down from 12 in June)" - Bradley J. Holcomb, CPSM, CPSD, chair of the Institute for Supply Management.
-
16:00
U.S.: ISM Manufacturing, July 52.6 (forecast 53)
-
16:00
U.S.: Construction Spending, m/m, June -0.6% (forecast 0.5%)
-
15:51
U.S. manufacturers signalled a relatively strong start to the third quarter
U.S. manufacturers signalled a relatively strong start to the third quarter of 2016. Output growth picked up markedly since June, driven by a robust and accelerated expansion of incoming new work. While domestic demand remained the key source of growth in July, there were also signs of renewed momentum in external markets.
Reflecting this, new export sales expanded at the fastest pace since September 2014. Increased workloads also contributed to rising payroll numbers and a solid upturn in input buying during July.
The seasonally adjusted Markit final U.S. Manufacturing Purchasing Managers' Index™ (PMI™) registered 52.9 in July, up from 51.3 in the previous month and comfortably above the postcrisis low seen in May (50.7).
The final PMI reading for July was unchanged from the earlier 'flash' reading (52.9). Improving business conditions reflected stronger rates of output, new order and employment growth during the latest survey period. July data signalled a sustained rebound in production volumes across the manufacturing sector. Higher levels of output have been recorded in each of the past two months, with the latest expansion the fastest since November 2015. Anecdotal evidence cited greater inflows of new work and supportive economic conditions.
-
15:45
U.S.: Manufacturing PMI, July 52.9 (forecast 52.9)
-
15:35
Option expiries for today's 10:00 ET NY cut
EUR/USD 1.1025 (EUR 570m) 1.0970 (350m) 1.1125 (680m)
USD/JPY 102.00 (USD 740m) 102.50 (420m)
GBP/USD 1.3000 (GBP 545m) 1.3225 (200m) 1.3300 (275m)
USD/CAD 1.3095 (USD 230m)
AUD/NZD 1.0650 ( AUD 413m)
-
14:35
European session review: the pound fell after weak data on industrial activity
The following data was published:
(Time / country / index / period / previous value / forecast)
France 7:50 PMI in the manufacturing sector (the final data) July 48.3 48.6 48.6
Germany 7:55 PMI in the manufacturing sector (the final data) July 54.5 53.7 53.8
8:00 Eurozone PMI in the manufacturing sector (the final data) July 52.8 51.9 52
8:30 UK PMI Manufacturing Index July 52.1 49.1 48.2
The British pound fell against the dollar after data confirmed the reduction of manufacturing activity in July, down more than the initial estimation, reinforcing fears about the prospects for economic growth.
The British manufacturing sector has been hit by the uncertainty associated with "Brexit", both production and orders declined, and the activity was the weakest since the beginning of 2013, showed Markit data.
The final purchasing managers' index for the manufacturing sector fell to 48.2 from 52.4 in June, noting the lowest level since February 2013. Preliminary estimate for the index was 49.1.
PMI value below 50 indicates a reduction in activity. It was only the second time since the beginning of 2013, when the index fell below the neutral mark, according to Markit.
Production dropped at the strongest pace since October 2012, with reductions in all areas.
While domestic demand has suffered from pre- and post-Brexit uncertainty, export orders rose for the second month in a row, mainly due to the recent decline in the exchange rate and efforts of companies to provide new contracts.
However, employment fell the seventh consecutive month. The weaker new orders and a decline in outstanding business volumes also suggest that employment could still fall in the coming months, Markit said.
Purchasing price inflation rose to a maximum of five years in July, due to the increase sterling induced import prices and higher prices for metals and commodities. As a result, selling prices increased at the fastest pace in two years.
"The trend of weakening orders and rising costs of inflation in the future to present a problem for manufacturers," said Markit senior economist Rob Dobson.
"On this account, the weak figures are powerful arguments in favor of quick action policies to prevent recession and will hopefully play a role in restoring confidence and achieve a speedy recovery."
Weak data triggered concerns about the strength of the UK economy and the increased expectations of a rate cut by the Bank of England's meeting monetary policy this week.
Euro traded slightly lower against the US dollar after the release of mixed data on manufacturing activity in the euro area.
Eurozone manufacturing activity grew at a slower pace in July, but the growth rate was faster than the initial estimate showed on Monday.
The manufacturing purchasing managers index fell to 52.0 in July from 6-month high of 52.8 in June. The preliminary reading for July was 51.9.
A reading above 50 indicates expansion. The Index signaled the expansion for 37 consecutive months.
The main factor behind the fall was weaker positive contributions from new orders growth. Although the pace of job creation were slightly lower, they were the fastest in the last five years.
Slower growth was recorded in three of the "big four" economies, namely Germany, Italy and Spain. At the same time, the decline in France continued.
Manufacturing PMI from Markit / BME for Germany fell to 53.8 in July from a 28-month high of 54.5 in On the other hand, the French industrial activity continued to decline in July. The final PMI rose to 48.6, according to initial estimates, from 48.3 in June.
The latter figure was the highest in the last four months, and pointed to a moderate rate of deterioration of operating conditions.
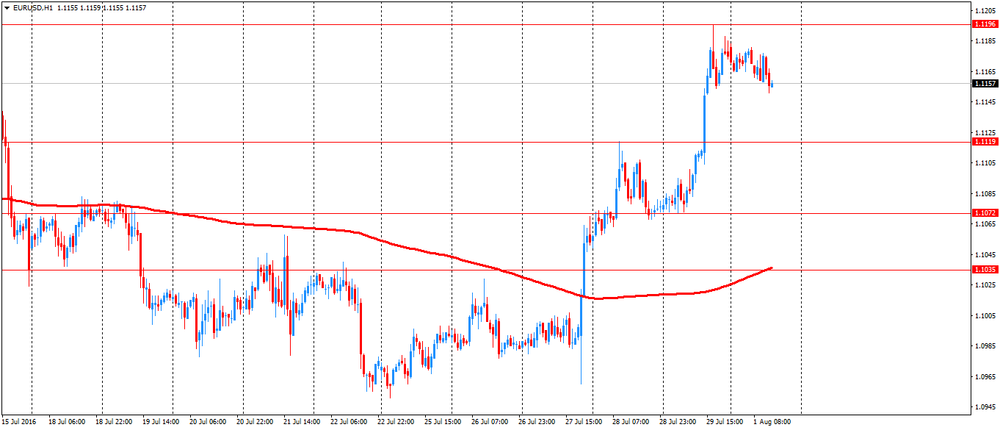
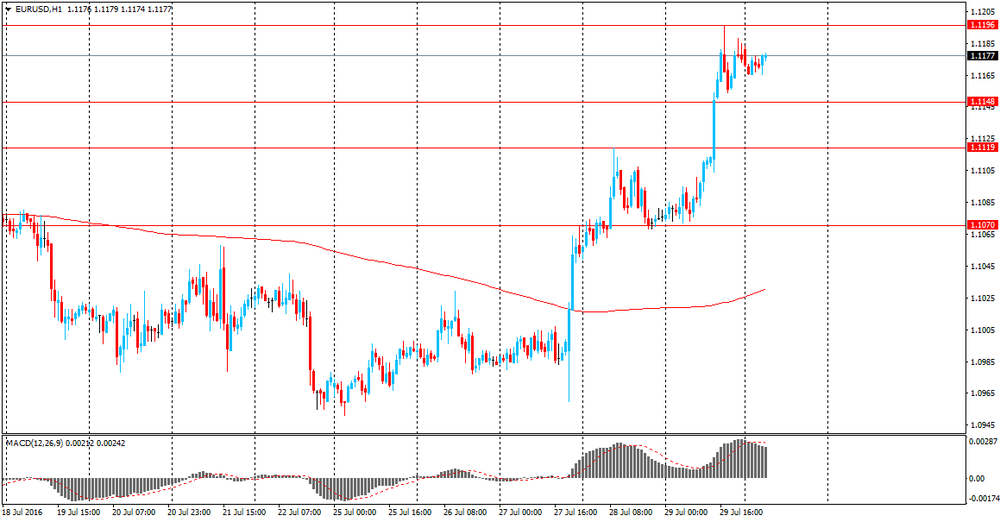
EUR / USD: during the European session, the pair fell to $ 1.1156
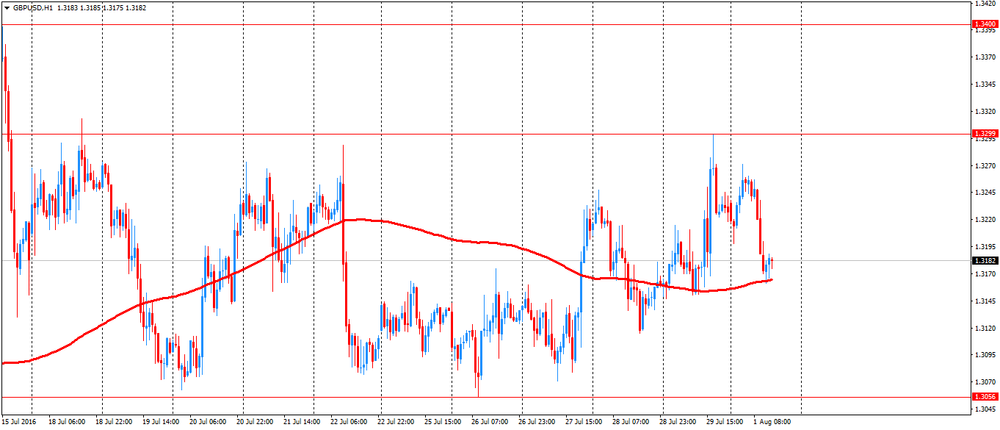
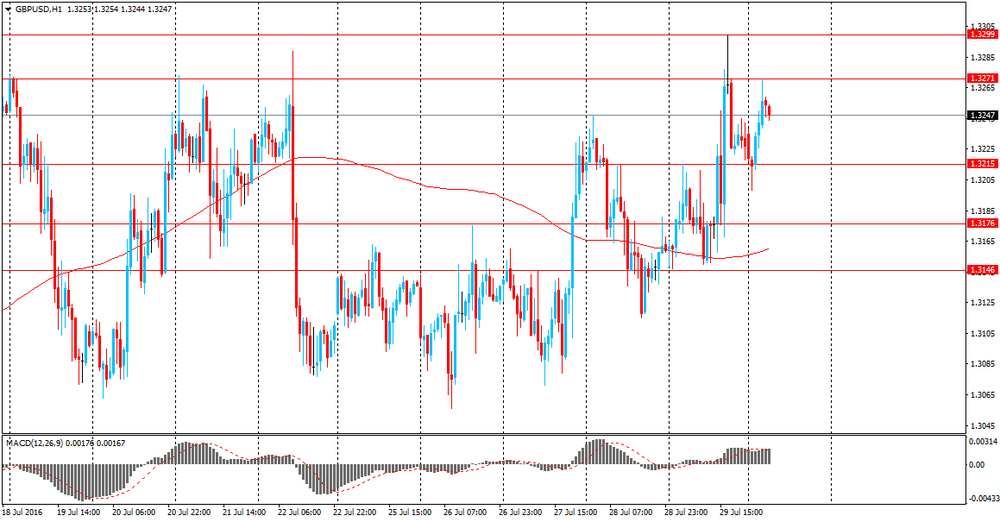
GBP / USD: during the European session, the pair fell to $ 1.3161
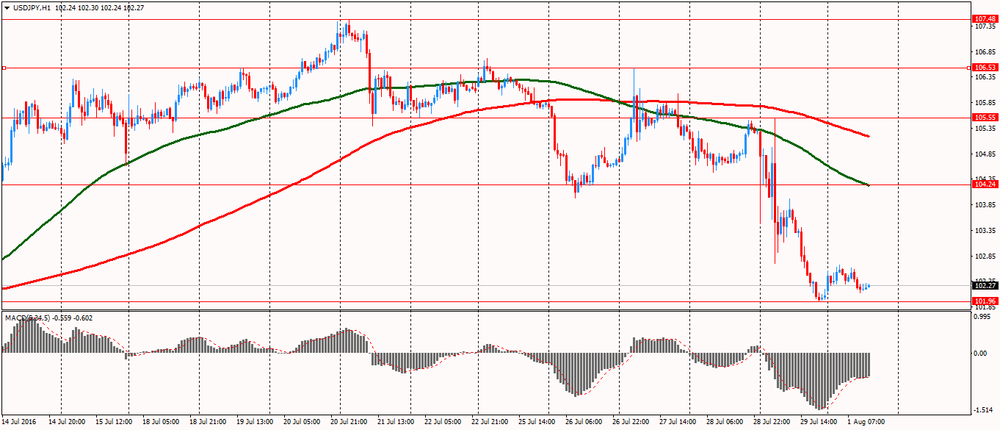
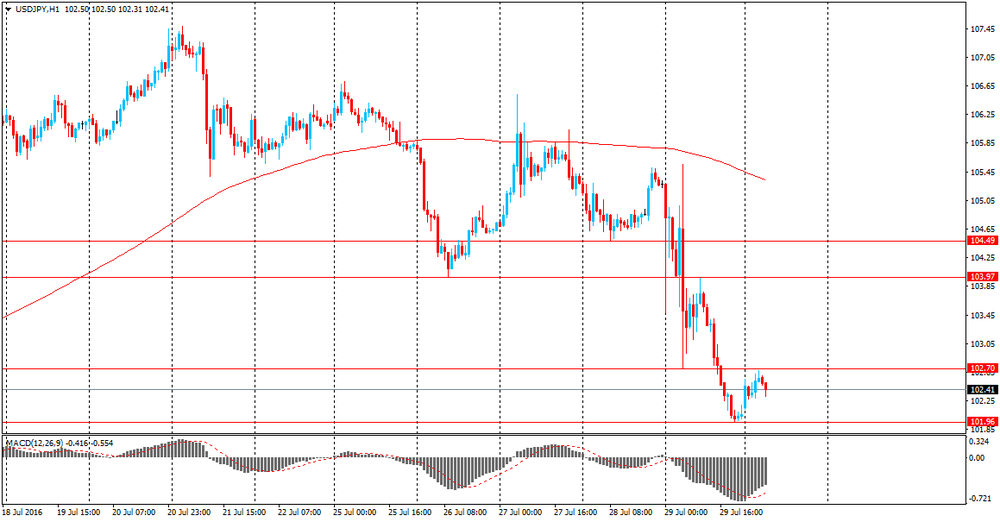
USD / JPY: during the European session, the pair fell to Y102.12
-
13:50
Orders
EUR/USD
Offers : 1.1180-85 1.1200 1.1230 1.1250 1.1280 1.1300-05 1.1335-40 1.1400
Bids: 1.1150-60 1.1120 1.1100 1.1085 1.1050 1.1035 1.1020 1.1000
GBP/USD
Offers : 1.3220 1.3250 1.3270 1.3285 1.3300 1.3320 1.3350-60 1.3400
Bids: 1.3200 1.3180 1.3150 1.3130 1.3100 1.3085 1.3050 1.3020 1.3000
EUR/GBP
Offers : 0.8475 0.8485 0.8500 0.8525 0.8550 0.8580 0.8600
Bids: 0.8420 0.8400 0.8385 0.8350 0.8330 0.8300
EUR/JPY
Offers : 114.80 115.00 115.20 115.50 115.80 116.00 116.50 116.80 117.00
Bids: 114.20 114.00 113.75 113.50 113.00 112.80 112.60 112.00
USD/JPY
Offers : 102.75-80 103.00 103.30 103.50 103.85 104.00 104.50 104.85 105.00
Bids: 102.20 102.00 101.75-80 101.50 101.00 100.80 100.50 100.00
AUD/USD
Offers : 0.7620 O.7635 0.7650-55 0.7700 0.7720 0.7750
Bids: 0.7580 0.7550 0.7535 0.7520 0.7500 0.7480-85 0.7450 0.7420 0.7400
-
11:51
AUD Dips An Attractive Buy, RBA to disappoint - Citi
"1.50% is greater than zero and 0.75 is less than 1.10. These two certainties form the backbone of our AUD-positive view and are among the reasons why we anticipate that the currency will appreciate well above 0.80 vs. the USD.
In an environment in which ever easier G4 policy is boosting asset prices and driving investors to seek yield, AUD presents an attractive mix of low political risk, high credit standing and significantly positive yield. Indeed, Australia may represent the best mix of these attributes of any of its peers. Given that valuation for AUD remains far more attractive than was the case in previous years when the currency approached highs near 1.10, we expect the currency to attract heavier inflows as longer-term investors begin to respond to recent market and policy developments.
A marginal decline in interest rates or moderate AUD appreciation is unlikely to change this merits and valuation based calculus. Thus domestic threats to AUD, such as cutting rates from 1.75% to 1.50%, are second tier.
...The tactical conclusion is that those looking for the RBA and underlying developments to rein in AUD's performance may be disappointed amid the broader AUD-positive macro backdrop. We are not among those looking for the RBA to ease at its policy meeting this week, with the recent positive surprise on Australian CPI creating additional breathing room for the RBA to be patient. However, even if the RBA surprises us and fulfills market expectations on a possible move, it is not clear that this would represent a significant blow to AUD. Interest rates will still be higher than those elsewhere and much of the rest of the reasoning for AUD buying would be unchanged. Indeed, many investors who have been slow to participate in recent moves might simply view any dip in AUD as providing a more attractive entry point on valuation grounds". - efxnews.
-
11:17
Review of financial and economic press: Head of the Federal Reserve Bank of New York called the three risk factors for higher interest rate
Newspaper. ru
The head of the Federal Reserve Bank of New York William Dudley called the main risks of interest rate increase, reports Reuters. In particular, he called the stability of the dollar, the impact of international developments in the economic and financial spheres as well as the risks associated with the haste of these solutions. He also expressed his opinion about the possible tightening approach in the monetary sphere.
Deutsche Bank entered the top ten worst results of the stress test
Deutsche Bank was recognized as one of the worst credit institutions in Europe as a result of the stress test. This is stated in the report of the European Banking Supervision Service (EBA).
Exxon Mobil's quarterly profit fell 59%
Exxon Mobil announced a 59% fall in quarterly profit for April - June 2016 due to lower raw material prices, reports Reuters.
D / W
Air France strike touched 150 thousand passengers
Due to the cancellation of about 900 flights Air France suffered losses of tens of millions euros
BBC
Theresa May promising to defeat the "evil of modern slavery"
Theresa May said that Britain will lead the fight against modern slavery and promised that ridding the world of this "barbaric evil" will be one of the priorities of her premiership.
-
10:43
Germany’s manufacturing activity shows moderate improvement
The final seasonally adjusted Markit/BME Germany Manufacturing Purchasing Managers - a single-figure snapshot of the performance of the manufacturing economy - posted above the 50.0 no-change mark for the twentieth successive month in July, thereby signalling continued growth in Germany's goods-producing sector. Despite falling from June's 28-month high of 54.5 to 53.8, the index remained above its long-run series average (51.9).
Part of the fall in the headline PMI was attributed to a slower rise in new order intakes. Nevertheless, the latest increase in new work was the secondstrongest in 28 months. New export orders also continued to rise during the month, with nearly onequarter of the survey panel reporting an expansion. As was the case with total new business, the rate of increase slowed slightly.
Manufacturers reported an acceleration in output growth at the start of the third quarter, which they generally linked to rising demand and the processing of backlogs. The pace of expansion was the fastest since April 2014. Rising demand in turn helped companies to reduce their finished goods stocks further.
-
10:41
Option expiries for today's 10:00 ET NY cut
EUR/USD 1.1025 (EUR 570m) 1.0970 (350m) 1.1125 (680m)
USD/JPY 102.00 (USD 740m) 102.50 (420m)
GBP/USD 1.3000 (GBP 545m) 1.3225 (200m) 1.3300 (275m)
USD/CAD 1.3095 (USD 230m)
AUD/NZD 1.0650 ( AUD 413m)
-
10:41
Euro Zone manufacturing PMI little changed in July
At 52.0 in July, down from June's six-month high of 52.8, the final Markit Eurozone Manufacturing PMI came in slightly above its earlier flash estimate of 51.9. The PMI has now signalled expansion for 37 consecutive months.
The main factor underlying the drop in the headline index was a softer positive contribution from new order growth. Incoming new business rose at a weaker pace than in June and to a lesser extent than the average for the year-to-date. Although the rate of job creation also ticked lower, it remained among the fastest registered over the past five years. This partly reflected further solid growth in production volumes, which held steady at June's six-month peak, and a further accumulation of backlogs of work. Inflows of new Countries ranked by Manufacturing PMI.
Ireland manufacturing data released August 2nd export business* also improved during the latest survey month, albeit at a marginally slower pace, in part aided by the weak euro exchange rate.
-
10:36
UK manufacturing PMI lowest since 2013
The UK manufacturing sector started the third quarter on a weaker footing. Levels of production and incoming new orders both contracted, as the impact of increased business uncertainty on the domestic market offset an exchange rate supported increase in new export business. At 48.2 in July, down from 52.4 in June, the seasonally adjusted Markit/CIPS Purchasing Managers' Index fell to its lowest level since February 2013.
The reading was also below the earlier flash estimate of 49.1. This is only the second time since early-2013 that the PMI has fell to a sub-50.0 level. The decline in production was the steepest since October 2012, with contractions across the consumer, intermediate and investment goods sectors. The intermediate goods sector saw the sharpest drops in both output and new orders. Investment goods manufacturers also saw a moderate decrease in new work received during July, although this partly reflected some payback from June's marked increase.
There was, a modest increase in new orders to consumer goods producers, albeit at a substantially reduced pace of growth than in the prior survey month.
-
10:30
United Kingdom: Purchasing Manager Index Manufacturing , July 48.2 (forecast 49.1)
-
10:00
Eurozone: Manufacturing PMI, July 52 (forecast 51.9)
-
09:55
Germany: Manufacturing PMI, July 53.8 (forecast 53.7)
-
09:50
France: Manufacturing PMI, July 48.6 (forecast 48.6)
-
09:30
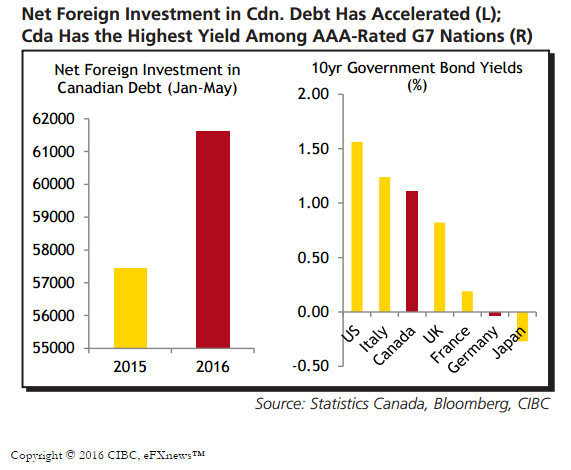
CAD Supported On Inflows Vs EUR, GBP - CIBC
"So far this year foreign investors having been piling into Canadian debt at a striking rate. Year-to-date inflows into Canadian debt are running roughly $4 bn ahead of the pace seen in 2015. In some ways, though, that's not surprising since Canada is one of only two AAArated credits among G7 countries.
With the other being Germany, who's 10-year yield currently sits in negative territory, international investors are viewing Canada as both safe and rewarding.
Looking ahead, with the BoE and ECB likely to ease policy later in the year, and the BoJ already adding some stimulus earlier this week, the pace of inflows could remain healthy, supporting the Canadian dollar against those currencies".
-
09:24
Major stock exchanges open higher: FTSE 100 6,740.59 + 19.53 + 0.29%, DAX 10,428.97 + 91.47 + 0.88%
-
08:56
Asian session review: tight ranges across the board
During the Asian session, the US dollar traded in a narrow range against major currencies after widespread fall on Friday as weak data on economic growth have exacerbated doubts about the likely increase in US Federal Reserve interest rates this year.
The US Commerce Department announced that US economic growth stalled in the second quarter. According to seasonally adjusted data, gross domestic product grew by 1.2% annually in the second quarter. The last reading was well below the average forecast (+ 2.6%). We also add that economic growth for the first quarter was revised downward to + 0.8% from + 1.1%. The economy expanded by less than 2% for three consecutive quarters. Despite the fact that the recession was over seven years ago, the growth rate has not accelerated since. The average annual growth rate during the current business cycle remains the weakest since 1949.
The weakness of the economy has increased concerns about whether it will be able to transfer the increase in rates this year. On Wednesday, the US Federal Reserve left monetary policy unchanged.
Futures on interest rates on Friday indicate that investors see 12% chance of a rate hike in September, compared with 18% a day ago, according to CME Group.
The Australian dollar rose after the publication of positive data on the index of business activity in the manufacturing sector of China from Caixin. The index rose in July to 50.6, higher than analysts expectations of 48.7 and the previous value of 48.6. This is the first increase in the index for the last 17 months. New orders increased, but new export orders fell again. The unemployment rate rose, showing a significant loss of jobs. According to Markit Economics China's economy began to show signs of stabilization due to the gradual implementation of fiscal policy. However, the pressure on economic growth remain, and supportive fiscal and monetary policy should be continued.
Also, the Chinese Federation of Logistics and Supply were published data on the index of business activity in the service sector, according to which the index rose to 53.9 from 53.7 the previous value.
The index of activity in the manufacturing sector of the Australia, published by the Australian Industry Group, was 56.4 in July, higher than the previous value of 51.8. The group explores the results of a survey of 200 hundred producers in the aspect of assessment of business conditions including employment, production, orders, prices and stocks, as well as short-term planning. A reading above 50 is positive for the Australian dollar. New orders increased by 4.7 points, employment had grown to the highest level since December 2014. Sales increased by 6.5 points, which is the highest rate since September 2009. Inventories rose by 1.4 points. Exports increased by 9.6 points on the month to its highest level since March 2008
Sales of new homes in Australia in June increased by 8.2% after a decline of -4.4% in May. This indicator expresses the volume of new home sales in Australia. It evaluates the conditions of the housing market. Thus, the high value of the index is a positive factor for the Australian currency..
According to Australia's Housing Association new home sales rose in June after two months of decline. Sales of detached houses increased by 7.2%, while sales of apartments by 11.5%.
The yen weakened against the dollar as investors took profits after the Japanese currency on Friday rose sharply as the Bank of Japan decided on additional measures that fell short of investors' expectations. The central bank announced its intention to increase the purchase of ETF, but left interest rates and the amount of the bond purchase program unchanged.
It became known that the index of business activity in the manufacturing sector of Japan in July amounted to 49.3 points, which is higher than the previous value of 48.1 and economists' expectations of 49.0. However, this indicator is below 50 for the fifth month in a row on a background of weak demand. In addition, the strong yen is a negative impact on exports.
Production and new orders fell again, but at a slower pace. Slightly more positively proved the employment component, which has recently reached a historic high.
EUR / USD: during the Asian session, the pair was trading in the $ 1.1160-65 range
GBP / USD: during the Asian session, the pair was trading in the $ 1.3200-40 range
USD / JPY: during the Asian session, the pair was trading in Y102.15-50 range
-
08:38
Fed, Dudley: USD strength creating challenges for exporters
- Financial market conditions matter for setting policy
- Global developments also important for US outlook
- Federal Reserve monetary policy can impact far beyond US borders
- Should be cautious in raising rates, flatter path appropriate
- Global recovery since crisis has been disappointing
- US economy being held back by slower global growth
- USD strength creating challenges for exporters
- US quite close to employment and inflation objectives
- Inflation somewhat below objective but making progress
-
08:33
Inflation gauge from TD Securities Australia fell in July
Inflation expectations fell by 0.3% after rising 0.6% in June. In annual terms, inflation rose by 1.0%, lower than the previous value of 1.5%.
Information from the TD Securities inflation published by the Faculty of Economics and Commerce at the University of Melbourne estimates the level of inflation in the Australian economy. Overall, the decline is a negative factor for the Australian dollar.
-
08:23
Chinese manufacturing sector showed increased activity in July
July survey data signalled a renewed upturn in operating conditions faced by Chinese manufacturers, with output, new orders and buying activity all returning to growth. However, employment continued to decline and at a solid pace, which in turn contributed to the quickest rise in outstanding business since March 2011. Meanwhile, increased prices for raw materials led to a marked rise in average input costs, which companies generally passed on to clients in the form of higher output charges. At 50.6 in July, the seasonally adjusted Purchasing Managers' Index™ (PMI™) - a composite indicator designed to provide a single-figure snapshot of operating conditions in the manufacturing economy - rose from 48.6 in June to signal a renewed improvement in operating conditions. Though only slight, it was the first strengthening in the health of the sector since February 2015.
-
08:16
Japan’s index of business activity in the manufacturing sector rose slightly
The index of business activity in the manufacturing sector in July amounted to 49.3 points, which is slightly higher than the previous value of 49.0. Nikkei PMI provides a preliminary assessment of the health of the manufacturing sector in Japan - an important indicator of business conditions and the general economic conditions in Japan.
This indicator is below 50 for the fifth month in a row on a background of weak demand. In addition, the strong yen is a negative impact on exports.
Production and new orders fell again, but at a slower pace. Slightly more positively proved the employment component, which has recently reached a historic high.
-
07:06
Options levels on monday, August 1, 2016:
EUR/USD
Resistance levels (open interest**, contracts)
$1.1277 (3067)
$1.1250 (3864)
$1.1230 (2902)
Price at time of writing this review: $1.1180
Support levels (open interest**, contracts):
$1.1121 (1840)
$1.1084 (2976)
$1.1041 (3091)
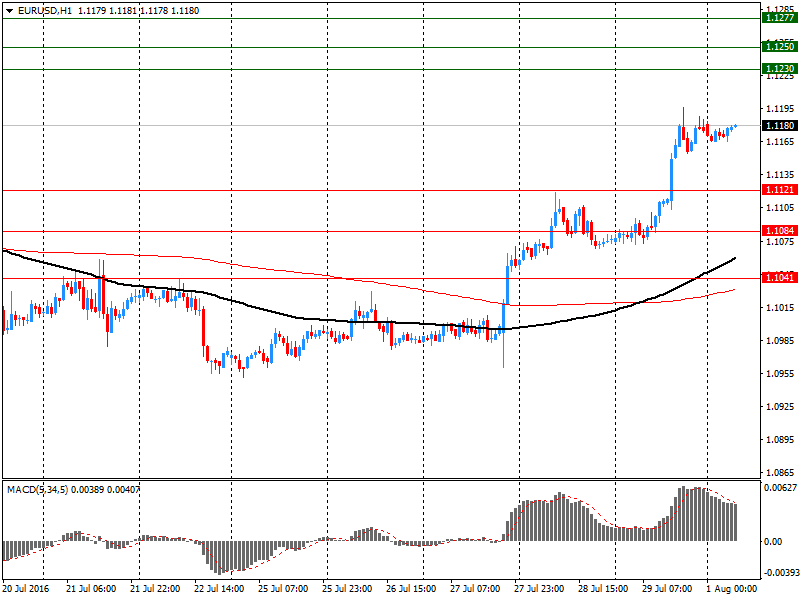
Comments:
- Overall open interest on the CALL options with the expiration date August, 5 is 39781 contracts, with the maximum number of contracts with strike price $1,1200 (3864);
- Overall open interest on the PUT options with the expiration date August, 5 is 52250 contracts, with the maximum number of contracts with strike price $1,0900 (6812);
- The ratio of PUT/CALL was 1.31 versus 1.31 from the previous trading day according to data from July, 29
GBP/USD
Resistance levels (open interest**, contracts)
$1.3503 (1860)
$1.3405 (2068)
$1.3309 (1572)
Price at time of writing this review: $1.3250
Support levels (open interest**, contracts):
$1.3191 (585)
$1.3094 (2423)
$1.2997 (1805)
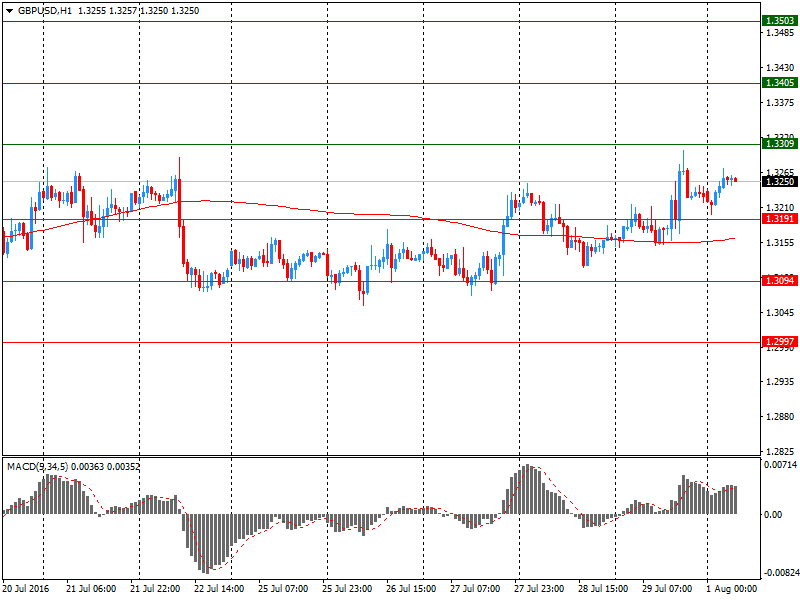
Comments:
- Overall open interest on the CALL options with the expiration date August, 5 is 28060 contracts, with the maximum number of contracts with strike price $1,3400 (2068);
- Overall open interest on the PUT options with the expiration date August, 5 is 26062 contracts, with the maximum number of contracts with strike price $1,2950 (3065);
- The ratio of PUT/CALL was 0.93 versus 0.94 from the previous trading day according to data from July, 29
* - The Chicago Mercantile Exchange bulletin (CME) is used for the calculation.
** - Open interest takes into account the total number of option contracts that are open at the moment.
-
04:00
Japan: Manufacturing PMI, July 49.3 (forecast 49)
-
03:46
China: Markit/Caixin Manufacturing PMI, July 50,6
-
03:01
China: Manufacturing PMI , July 49,9 (forecast 50)
-
03:00
Australia: HIA New Home Sales, m/m, June 8.2%
-
03:00
China: Non-Manufacturing PMI, July 53.9
-
01:32
Australia: AIG Manufacturing Index, July 56.4
-
00:31
Currencies. Daily history for Jul 29’2016:
(pare/closed(GMT +3)/change, %)
EUR/USD $1,1175 +0,89%
GBP/USD $1,3227 +0,51%
USD/CHF Chf0,9693 -1,15%
USD/JPY Y102,06 -3,15%
EUR/JPY Y114,06 -2,23%
GBP/JPY Y134,96 -2,65%
AUD/USD $0,7599 +1,25%
NZD/USD $0,7206 +1,82%
USD/CAD C$1,3032 -0,93%
-
00:00
Schedule for today, Monday, Aug 01’2016:
(time / country / index / period / previous value / forecast)
00:30 Australia MI Inflation Gauge, m/m July 0.6%
01:00 Australia HIA New Home Sales, m/m June -4.4%
01:00 China Manufacturing PMI July 50 50
01:00 China Non-Manufacturing PMI July 53.7
01:45 China Markit/Caixin Manufacturing PMI July 48.6
02:00 Japan Manufacturing PMI (Finally) July 48.1 49
07:50 France Manufacturing PMI (Finally) July 48.3 48.6
07:55 Germany Manufacturing PMI (Finally) July 54.5 53.7
08:00 Eurozone Manufacturing PMI (Finally) July 52.8 51.9
08:30 United Kingdom Purchasing Manager Index Manufacturing July 52.1 49.1
13:45 U.S. Manufacturing PMI (Finally) July 51.3 52.9
14:00 U.S. Construction Spending, m/m June -0.8% 0.5%
14:00 U.S. ISM Manufacturing July 53.2 53
-