Noticias del mercado
-
23:59
Schedule for today, Wednesday, Aug 10’2016
(time / country / index / period / previous value / forecast)
00:30 Australia Westpac Consumer Confidence August -3%
01:30 Australia Home Loans June -1% 2.4%
03:05 Australia RBA's Governor Glenn Stevens Speech
06:45 France Industrial Production, m/m June -0.5% 0.2%
14:00 U.S. JOLTs Job Openings June 5.5 5.52
14:30 U.S. Crude Oil Inventories August 1.413
18:00 U.S. Federal budget July 6 -129.9
21:00 New Zealand RBNZ Interest Rate Decision 2.25% 2%
21:00 New Zealand RBNZ Rate Statement
21:05 New Zealand RBNZ Press Conference
-
16:48
US inventories unexpectedly showing an increase
Reflecting a jump in inventories of non-durable goods, the Commerce Department released a report on Tuesday unexpectedly showing an increase in U.S. inventories of wholesale goods in the month of June.
The report said wholesale inventories rose by 0.3 percent in June following an upwardly revised 0.2 percent increase in May.
Economists had expected inventories to come in unchanged compared to the 0.1 percent uptick that had been reported for the previous month.
The unexpected increase in wholesale inventories came as inventories of non-durable goods surged up by 1.1 percent in June after inching up by 0.1 percent in May.
Inventories of drugs and druggists' sundries and farm product raw materials showed significant increases during the month.
On the other hand, the report said inventories of durable goods fell by 0.3 percent in June after rising by 0.2 percent in May.
A drop in inventories of electrical and electronic goods offset an increase in inventories of lumber and other construction materials - RTT news.
-
16:46
US: the index of economic optimism from IBD / TIPP rose sharply in August
The data showed that the index of economic optimism in the US, calculated by the newspaper Investor's Business Daily and research firm TechnoMetrica, rose in August by 2.9 points, or 6.4%, reaching 48.4 points. Economists had expected the index to rise to 46.2 points. It is worth emphasizing the last value is 1.6 points higher than the 12-month average (46.8 points), but still 0.6 points lower than the all time average (49.0 points). Tndex value above 50 indicates optimism, while below 50, pessimism.
Economic Optimism Index is comprised of three main components. This month, two components have improved: the sub-six-month economic outlook index rose 8.0 points, or 21.8%, to 44.7 points, while the sub-index of the personal financial outlook for the next six months rose to 0.8 points , or 1.4%, to 58.0 points. Meanwhile, the sub-index of confidence in federal economic policies fell by 0.2 points, or 0.5%, to 42.7 points.
"The economic confidence of americans rose again in August after a strong deterioration in the last month caused by concerns about the global economy after Brexit. Despite the fact that the economic recovery continues its seventh year run, the trust will continue to be shaky at best, which is reflected in the continued level of pessimism in our index. 48 percent of respondents believe that the economic situation does not improve, while 49 percent believe that improves. in addition, 59 percent of respondents said that the economy is not in recession, and 37 percent reported the opposite, "- said Raghavan Maur, president of TechnoMetrica.
-
16:40
-
16:01
United Kingdom: NIESR GDP Estimate, July 0.3%
-
16:00
U.S.: Wholesale Inventories, June 0.3% (forecast 0.1%)
-
15:45
Option expiries for today's 10:00 ET NY cut
EURUSD 1.0800 (EUR 261m) 1.1099-1.1100 (435m)
USDJPY 102.00 (USD 825m) 104.00 (570m) 104.50 (348m)
GBPUSD 1.2800 (GBP 203m) 1.2900-05 (270m) 1.2950 (275m) 1.2960-65 (248m)
USDCHF 0.9615 (USD 240m) 1.0000 (600m)
AUDUSD 0.7600 (AUD 225m) 0.7625 (260m)
USDCAD 1.3100-05 (USD 470m) 1.3200 (1.1bln)
EURJPY 111.35 (EUR 370m)
AUDJPY 78.83 (AUD 241m)
-
15:40
US labour productivity is underrated and this is why
Labour productivity in the United States continued to decline in the spring of this year, to record a third consecutive quarterly decline, which could jeopardize the growth rate of wages in the whole economy in the coming years. This was stated by the Ministry of Labour.
The data showed that the level of labor productivity in the agricultural sector - the gauge of production of goods and services for one hour of work - decreased in the 2nd quarter by 0.5% compared to the 1st quarter (seasonally adjusted). The reason for this change has been a more rapid growth in the hours worked than in output. Recall that in the first quarter productivity fell by 0.6%.
In annual terms, the labor productivity decreased by 0.4%, recording the first annual decline in three years.
Unit labor costs among the non-agricultural enterprises in the second quarter rose by 2.0% after falling 0.2% in the first quarter (revised from + 4.5%). Compared to 2015, unit labor costs rose by 2.1% Economists had expected productivity to rise by 0.5%, while labor costs to increase by 1.8%.
The rate of growth of labor productivity is a key factor in determining how quickly wages and the economy can grow as a whole. Strong productivity gains, as noted in the late 1990s and early 2000s, can lead to sustainable economic growth and wage inflation. But sluggish growth performance may restrain wage growth and economic expansion. According to the data, average annual productivity growth from 2007 to 2015 was 1.3%, which is less than half the pace recorded from 2000 to 2007.
-
14:30
U.S.: Nonfarm Productivity, q/q, Quarter II -0.5% (forecast 0.5%)
-
14:30
U.S.: Unit Labor Costs, q/q, Quarter II 2% (forecast 1.8%)
-
14:21
Canda: July’s housing starts continued to pick up pace
The trend measure of housing starts in Canada was 201,936 units in July compared to 197,847 in June, according to Canada Mortgage and Housing Corporation (CMHC). The trend is a six-month moving average of the monthly seasonally adjusted annual rates of housing starts.
"July's housing starts continued to pick up pace, as construction strengthened in BC and Ontario's multi-unit segments," said Aled ab Iorwerth, CMHC's Deputy Chief Economist. "This reflects continued strong demand for lower-priced homes and low inventories of completed and unsold new units."
-
14:19
European session review: the US dollar strengthened against the pound
The following data was published:
(Time / country / index / period / previous value / forecast)
5:45 Switzerland's unemployment rate (not seasonally adjusted) July 3.1% 3.1% 3.1%
6:00 Germany Current Account 18.4 26.3 bln in June
6:00 Germany Trade balance (not seasonally adjusted), 24.9 billion on June 21
6:00 Japan Change in orders for equipment (preliminary data), y / y in July -19.9% -19.6%
8:30 UK Industrial Production m / m in June -0.6% 0.1% 0.1%
8:30 UK Industrial Production y / y in June 1.4% 1.6% 1.6%
8:30 UK Manufacturing production m / m in June -0.6% -0.2% -0.3%
8:30 UK Manufacturing production, y / y in June 1.5% 1.3% 0.9%
8:30 UK total trade balance in June -4.2 -5.1
The pound depreciated significantly against the dollar, updating the monthly lows. Certain influence on the dynamics of trade had statistics on Britain. The Office for National Statistics said that industrial output rose by 0.1 percent compared to May, confirming the forecasts of economists. At the end of May the production declined by 0.6 percent (revised from -0.5 percent). Output in the manufacturing sector decreased by 0.3 percent, which was slower than the fall of 0.6 percent in May. Experts predicted a decrease of 0.2 percent. Annual industrial production growth accelerated to 1.6 percent, in line with expectations, compared with 1.4 per cent. Manufacturing output increased by 0.9% y/y, after rising 1.5 percent in May. Analysts had expected an increase of 1.3 percent. For the three-month period to June, the volume of industrial production increased by 2.1 percent. This was the highest growth since the third quarter of 1999.
A separate report showed that the deficit in trade in goods widened in June to 12,4 billion in May (revised from 9,880 billion). Last change reflects an increase in exports by 1.0 billion pounds to 24.6 billion., as well as increased imports of 1.8 billion pounds to 37.0 billion. The surplus on trade in services remained unchanged at 7.3 billion pounds. As a result, the overall trade deficit amounted to 5.1 billion.
In focus were also statements by the Bank of England and member of the Monetary Policy Committee Ian McCafferty, who pointed to the possibility of expanding monetary stimulus measures if the state of the British economy deteriorates. Recall, last week the Bank of England lowered the benchmark interest rate to a record low level and increased the volume of bond purchases to soften the negative impact of Brexit. In general, the last stimulus program indicates a strong concern for the Bank of England officials about the economic outlook.
The euro is trading flat vs usd. Recall, the Federal Statistical Office of Germany stated that exports rose in June by 0.3% compared to May, while imports by 1.0%. The trade surplus amounted to 21.7 billion euros against 22.1 billion euros in May. At the end of the 2nd quarter exports grew by 0.7%, while imports decreased by 1.6%.
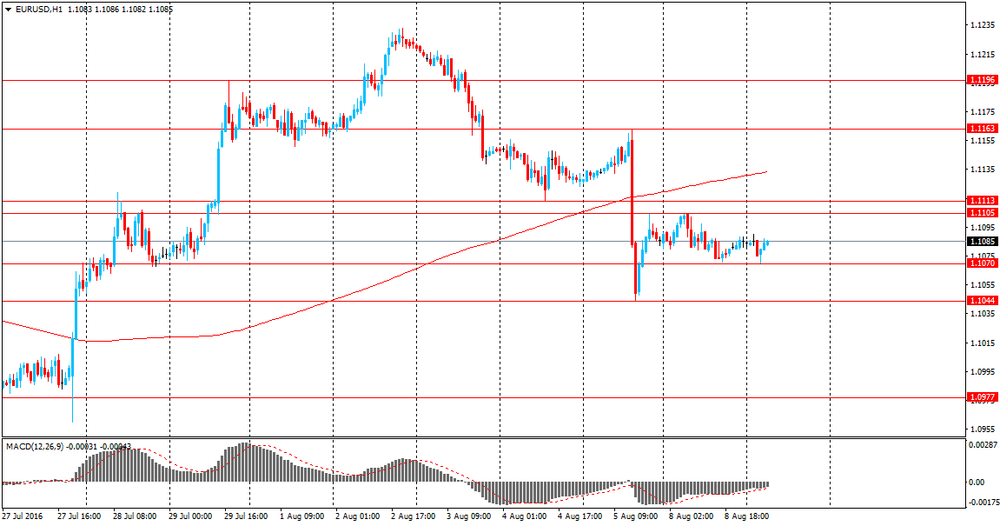
EUR / USD: during the European session, the pair rose to $ 1.1097, but then fell back to $ 1.1075
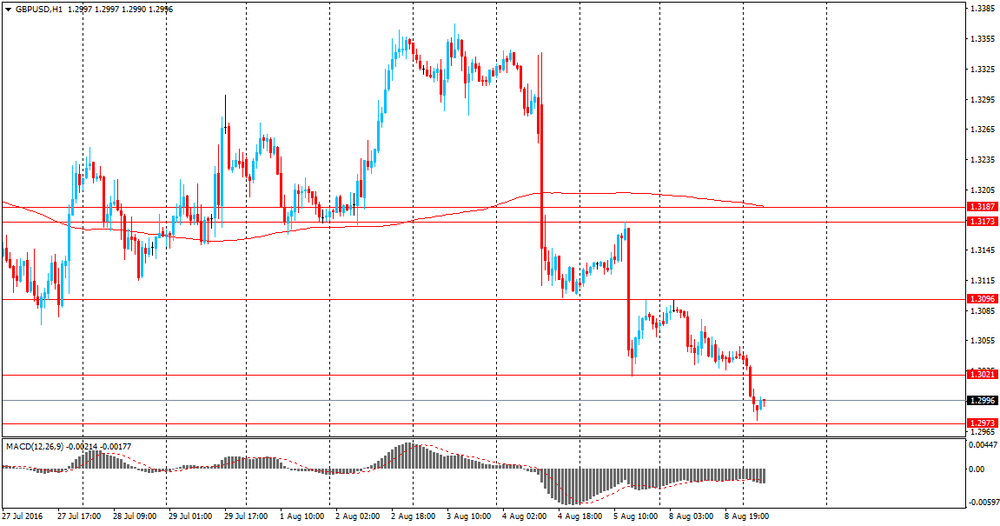
GBP / USD: during the European session, the pair fell to $ 1.2960
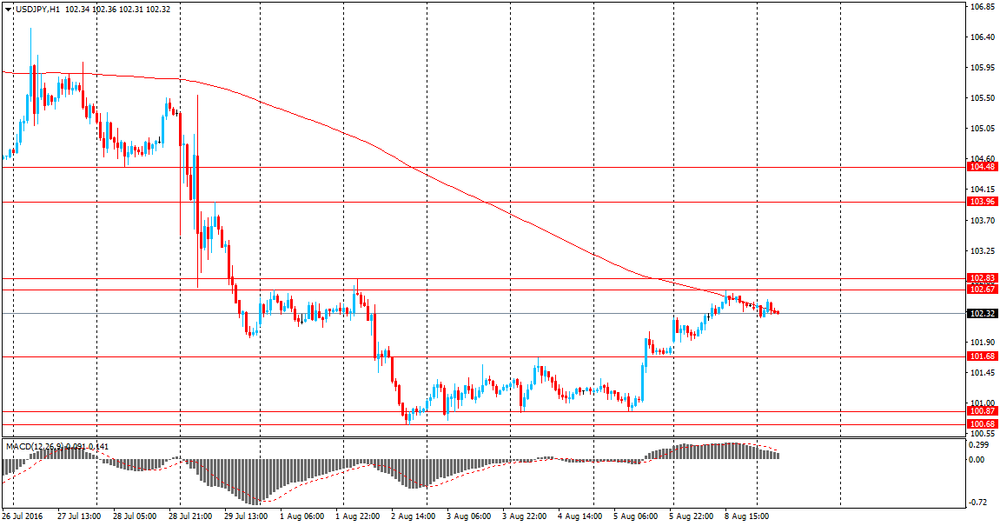
USD / JPY: during the European session, the pair fell to Y102.14
-
14:14
Canada: Housing Starts, July 198.4 (forecast 195)
-
13:45
Orders
EUR/USD
Offers 1.1085 1.1100 1.1120 1.1155-60 1.1180 1.1200
Bids 1.1070 1.1050-55 1.1020-25 1.1000-05 1.0980 1.0950-60
GBP/USD
Offers 1.3000 1.3020 1.3045-50 1.3080 1.3100-05 1.3130 1.3150
Bids 1.2950 1.2930 1.2900-05 1.2880 1.2865 1.2850
EUR/GBP
Offers 0.8550 0.8580 0.8600 0.8630 0.8650
Bids 0.8520 0.8500 0.8475-80 0.8450 0.8430 0.8400 0.8350
EUR/JPY
Offers 113.85 114.00 114.50 114.80 115.00
Bids 113.20 113.00 112.85 112.50 112.00-10 111.50 111.00
USD/JPY
Offers 102.60 102.80-85 103.00 103.30 103.50-60 103.85 104.00
Bids 102.25-30 102.00 101.65-70 101.50 101.20 101.00 100.70-75100.50
AUD/USD
Offers 0.7670 0.7685 0.7700 0.7720 0.7750
Bids 0.7620 0.7600 0.7585 0.7565 0.7570 0.7550 0.7520 0.7500
-
13:42
US: The Index of Small Business Optimism increased slightly
The Index of Small Business Optimism increased 0.1 points to 94.6, still well below the 40 year average of 98. Four of the 10 Index components posted a gain, four declined and two were unchanged. GDP growth in the last three quarters has averaged 1 percent, not a recession but only matching the growth in the population. The outlook for business conditions six months from the current period continued to improve, gaining 16 percentage points since January but still in negative territory - more owners expecting deterioration than improvement.
-
11:46
USD/CAD: Risks 'Largely' To The Upside From Current Levels - Credit Agricole
"The CAD has remained on the sidelines of the recent USD sell-off. While CAD's daily correlation with oil has weakened, crude's further decline has prevented the CAD from strengthening over the past two weeks. Further downside may be limited from here but conditions for a rebound are also lacking in our view, which implies that oil will not be offering much support to the Canadian economy and currency soon.
Meanwhile, the BoC will likely remain in a wait-and-see mode at least until it sees Q3 data. We think policymakers may be excessively optimistic on the impact of fiscal spending while a combination of a neutral policy stance and falling inflation expectations may trigger an unwanted tightening in real rates in Canada. Furthermore an over-leveraged consumer and further signs of housing market excesses in BC are paradoxically helping CAD by restraining the BoC in the short-term but they are a looming risk to the economy and currency over the medium-term.
We continue to see risks as largely favouring USD/CAD upside from current levels" - efxnews.
-
10:44
UK's trade balance deficit increased sharply
The UK's deficit on trade in goods and services was estimated to have been £5.1 billion in June 2016, a widening of £0.9 billion from May 2016. Exports increased by £1.0 billion and imports increased by £1.9 billion. Imports reached a record high of £48.9 billion.
The deficit on trade in goods was £12.4 billion in June 2016, widening by £0.9 billion from May 2016. This widening reflected an increase in exports of £1.0 billion to £24.6 billion and an increase in imports of £1.8 billion to £37.0 billion.
Between Quarter 1 (January to March) 2016 and Quarter 2 (April to June) 2016, the total trade deficit for goods and services widened by £0.4 billion to £12.5 billion.
Between Quarter 1 2016 and Quarter 2 2016 the deficit on trade in goods widened by £0.1 billion to a deficit of £34.4 billion. Exports increased by £4.1 billion (5.8%) and imports increased by £4.1 billion (4.0%).
-
10:42
UK manufacturing production down 0.3% in June
Total production output is estimated to have increased by 2.1% between Quarter 1 (Jan to Mar) 2016 and Quarter 2 (Apr to Jun) 2016.
The largest contribution to the quarterly increase in total production came from manufacturing, which increased by 1.8%. The largest contribution to the increase in manufacturing came from the manufacture of transport equipment, which increased by 5.6%.
Total production output is estimated to have increased by 1.6% in June 2016 compared with June 2015. There were increases in all of the main sectors, with the largest contribution coming from manufacturing (the largest component of production), which increased by 0.9%.
Total production output is estimated to have increased by 0.1% in June 2016 compared with May 2016. There were increases in 3 of the 4 main sectors, with the only downward contribution coming from manufacturing, which decreased by 0.3%. There were decreases in 9 of the 13 manufacturing subsectors, with the largest contribution coming from the manufacture of transport equipment, which decreased by 1.0%.
-
10:31
United Kingdom: Total Trade Balance, June -5.1
-
10:30
United Kingdom: Industrial Production (MoM), June 0.1% (forecast 0.1%)
-
10:30
United Kingdom: Manufacturing Production (YoY), June 0.9% (forecast 1.3%)
-
10:30
United Kingdom: Industrial Production (YoY), June 1.6% (forecast 1.6%)
-
10:30
United Kingdom: Manufacturing Production (MoM) , June -0.3% (forecast -0.2%)
-
10:21
Option expiries for today's 10:00 ET NY cut
EUR/USD 1.0800 (EUR 261m) 1.1099-1.1100 (435m)
USD/JPY 102.00 (USD 825m) 104.00 (570m) 104.50 (348m)
GBP/USD 1.2800 (GBP 203m) 1.2900-05 (270m) 1.2950 (275m) 1.2960-65 (248m)
USD/CHF 0.9615 (USD 240m) 1.0000 (600m)
AUD/USD 0.7600 (AUD 225m) 0.7625 (260m)
USD/CAD 1.3100-05 (USD 470m) 1.3200 (1.1bln)
EUR/JPY 111.35 (EUR 370m)
AUD/JPY 78.83 (AUD 241m)
-
09:28
Today’s events:
At 15:30 GMT the United States will hold an auction of 4-week bills.
At 17:00 GMT the United States will hold an auction of 3-year bonds.
At 20:30 GMT the report of the American Petroleum Institute (API) on oil stocks.
Also today, UK will hold an auction of 30-year government bonds.
-
08:52
Asian session review: the pound fall in anticipation of manufacturing data
During today's Asian session, the US dollar traded in a narrow range against the euro and the yen, while maintaining stability.
The pound was lower against the US dollar, despite the positive data on retail sales from the UK. According to British Retail Consortium retail sales increased by 1.1% year on year. Analysts had expected a decline to -0.7%. The previous value was also negative and amounted to -0.5%.
A report on retail sales, published by the British Retail Consortium, estimates changes in the actual retail sales companies, members of the consortium on the basis of regularly provided reliable information. This indicator shows the trend in the retail sector.
The BRC report states that recorded growth in retail sales is contrary to the UK talk about slowing consumer spending after Brexit. The growth of retail sales in July was the strongest since January of this year.
Also, the course of trading was influence by pricing in of today's statistics on industrial production in the UK. It is projected that by the end of June, industrial production increased by 0.2% in monthly terms and by 1.6% y/y. Meanwhile, production in the manufacturing sector is likely to contract by 0.2% in the month and increased by 1.3% per annum.
The Australian dollar has weakened since the beginning of the session, as the published results of the latest survey conducted by NAB showed that the index of business conditions in Australia fell in July to 8 with the previous value of 11, and the index of confidence in the business community dropped to 4 from 5 June.
Business conditions and confidence in business circles in Australia worsened amid growing uncertainty over the long-term prospects for the Australian economy.
NAB chief economist Alan Oster said the long-term risks are increasing, and it is likely to force the Reserve Bank of Australia to lower interest rates twice this year. Oster also said that short-term trends in the economy are satisfactory.
The Consumer Price Index of China, published by the National Bureau of Statistics of China, increased by 0.2% in July after falling 0.1% the previous month. This had an influence on commodity currencies. Analysts had expected an increase of 0.1%. In annual terms, the inflation indicator rose 1.8%. The pace of consumer price growth slowed slightly compared with +1.9% in June. The main factor that put pressure on the annual inflation was slowing food prices.
The result is a detailed summary of the data of urban and rural indices of consumer prices. The purchasing power of the Chinese currency is reduced under the influence of inflation. CPI - a key indicator of inflation and changes in purchasing trends. A decline in the consumer price index is a sign that inflation is becoming a destabilizing factor in the economy and could potentially provoke the People's Bank of China to tighten monetary policy and fiscal policy. In general, a high value is positive for China's currency.
Inflation remains well below the maximum target of 3% this year, giving the central bank room for easing monetary policy against the backdrop of the economic downturn.
Yu Qiumei, Senior Statistician at National Bureau of Statistics of China noted that a great influence on prices in the last month had heavy rains and flooding of the Yangtze basin. "Powerful rains significantly affected the processes of production and transport of fresh vegetables, which led to a rather strong increase in their prices in a number of regions".
Also, the National Bureau of Statistics of China released data on producer price index, which in July fell by 1.7% after falling 2.6% in June. Analysts had expected a decline to -2.0%
EUR / USD: during the Asian session, the pair was trading in the $ 1.1070-75 range.
GBP / USD: during the Asian session, the pair was trading in $ 1.2965-90 range.
USD / JPY: during the Asian session, the pair was trading in Y102.25-102.45 range.
-
08:39
The Fed Likely To Stay Behind The Curve; Staying USD Bearish - Morgan Stanley
"As long as US inflation expectations remain low, the Fed is unlikely to raise rates early.
In this respect, the 5Y/5Y inflation swap rising by 4bp on Friday was muted compared to the 10bp rise in the nominal US 5-year yield, driving real US yields higher. This is a short-term USD positive, but this support is unlikely to last long as the Fed may have no intention of allowing real rates to rise pre-emptively. An economy running high debt levels and relatively low returns on investment fares best when bond yields follow inflation expectations.
Hence, the Fed is likely to stay behind the curve, suggesting US real yields coming down again. However, it is not only the Fed which makes us USD-bearish".
-
08:33
Business confidence in Australia ebbed in July
Business confidence in Australia ebbed in July, the latest survey from National Australia Bank revealed on Tuesday with an index score of +4.
That's down from the downwardly revised +5 in June (originally +6).
The index for business conditions also took a hit, slipping to +8 from the downwardly revised +11 in the previous month (originally +12).
For the first half of the year, business confidence is roughly unchanged - RTT.
-
08:32
BoE's McCafferty: BoE should have a gradual approach as it’s hard to determine correct amount of stimulus - Times
-
08:29
Retail sales in UK remain strong in July
According to British Retail Consortium retail sales increased by 1.1% year on year. Analysts had expected a decline to -0.7%. The previous value was also negative and amounted to -0.5%.
A report on retail sales, published by the British Retail Consortium, estimates changes in the actual retail sales companies, members of the consortium on the basis of regularly provided reliable information. This indicator shows the trend in the retail sector.
The BRC report states that recorded growth in retail sales is contrary to the UK talk about slowing consumer spending after Brexit. The growth of retail sales in July was the strongest since January of this year.
-
08:28
Options levels on tuesday, August 9, 2016:
EUR/USD
Resistance levels (open interest**, contracts)
$1.1253 (4070)
$1.1196 (1738)
$1.1156 (802)
Price at time of writing this review: $1.1076
Support levels (open interest**, contracts):
$1.1029 (3089)
$1.0977 (4454)
$1.0944 (4390)
Comments:
- Overall open interest on the CALL options with the expiration date September, 9 is 45139 contracts, with the maximum number of contracts with strike price $1,1250 (4827);
- Overall open interest on the PUT options with the expiration date September, 9 is 52772 contracts, with the maximum number of contracts with strike price $1,1050 (4454);
- The ratio of PUT/CALL was 1.17 versus 1.15 from the previous trading day according to data from August, 8
GBP/USD
Resistance levels (open interest**, contracts)
$1.3305 (2316)
$1.3207 (1846)
$1.3111 (941)
Price at time of writing this review: $1.2989
Support levels (open interest**, contracts):
$1.2892 (1712)
$1.2795 (1978)
$1.2697 (932)
Comments:
- Overall open interest on the CALL options with the expiration date September, 9 is 28737 contracts, with the maximum number of contracts with strike price $1,3300 (2316);
- Overall open interest on the PUT options with the expiration date September, 9 is 23245 contracts, with the maximum number of contracts with strike price $1,2800 (1978);
- The ratio of PUT/CALL was 0.81 versus 0.80 from the previous trading day according to data from August, 8
* - The Chicago Mercantile Exchange bulletin (CME) is used for the calculation.
** - Open interest takes into account the total number of option contracts that are open at the moment.
-
08:26
Mixed start of trading expected on the major stock exchanges in Europe: DAX-0.2%, CAC40 -0.1%, FTSE + 0.1%
-
08:25
China's consumer price index above expectations in July
The Consumer Price Index, published by the National Bureau of Statistics of China, increased by 0.2% in July after falling 0.1% the previous month. Analysts had expected an increase of 0.1%. In annual terms, the inflation indicator rose 1.8%. The pace of consumer price growth slowed slightly compared with +1.9% in June. The main factor that put pressure on the annual inflation was slowing food prices.
The result is a detailed summary of the data of urban and rural indices of consumer prices. The purchasing power of the Chinese currency is reduced under the influence of inflation. CPI - a key indicator of inflation and changes in purchasing trends. A decline in the consumer price index is a sign that inflation is becoming a destabilizing factor in the economy and could potentially provoke the People's Bank of China to tighten monetary policy and fiscal policy. In general, a high value is positive for China's currency.
Inflation remains well below the maximum target of 3% this year, giving the central bank room for easing monetary policy against the backdrop of the economic downturn.
Yu Qiumei, Senior Statistician at National Bureau of Statistics of China noted that a great influence on prices in the last month had heavy rains and flooding of the Yangtze basin. "Powerful rains significantly affected the processes of production and transport of fresh vegetables, which led to a rather strong increase in their prices in a number of regions".
Also, the National Bureau of Statistics of China released data on producer price index, which in July fell by 1.7% after falling 2.6% in June. Analysts had expected a decline to -2.0%
-
08:19
Swiss unemployment stable at 3.1% in July
According to surveys conducted by the State Secretariat for Economic Affairs the unemployment rate remained at 3.1 % in June. Compared to the previous month , unemployment increased by 5'556 persons ( + 4.2% ) . Youth unemployment in July 2016 ( 15 to 24 year ) increased by 1,316 persons ( + 8.3% ) to 17'107 . Compared to the same month last year registered a decrease by 75 persons ( -0.4 %).
-
08:16
German trade balance lower than forecasts
Germany exported goods to the value of 106.8 billion euros and imported goods to the value of 82.0 billion euros in June 2016. Based on provisional data, the Federal Statistical Office (Destatis) also reports that German exports increased by 1.2% and imports by 0.3% in June 2016 year on year. Compared with May 2016, exports increased by a calendar and seasonally adjusted 0.3%, and imports by 1.0%.
The foreign trade balance showed a surplus of 24.9 billion euros in June 2016. In June 2015, the surplus amounted to 23.9 billion euros. In calendar and seasonally adjusted terms, the foreign trade balance recorded a surplus of 21.7 billion euros in June 2016.
According to provisional results of the Deutsche Bundesbank, the current account of the balance of payments showed a surplus of 26.3 billion euros in June 2016, which takes into account the balances of trade in goods including supplementary trade items (+26.8 billion euros), services (-2.7 billion euros), primary income (+4.4 billion euros) and secondary income (-2.1 billion euros). In June 2015, the German current account showed a surplus of 25.3 billion euros.
-
08:01
Germany: Trade Balance (non s.a.), bln, June 24.9
-
08:01
Japan: Prelim Machine Tool Orders, y/y , July -19.6%
-
08:00
Germany: Current Account , June 26.3
-
07:46
Switzerland: Unemployment Rate (non s.a.), July 3.3% (forecast 3.1%)
-
03:31
Australia: National Australia Bank's Business Confidence, July 4
-
03:30
China: CPI y/y, July 1.8% (forecast 1.8%)
-
03:30
China: PPI y/y, July -1.7% (forecast -2.0%)
-
00:28
Currencies. Daily history for Aug 08’2016:
(pare/closed(GMT +3)/change, %)
EUR/USD $1,1085 -0,01%
GBP/USD $1,3041 -0,28%
USD/CHF Chf0,9826 +0,21%
USD/JPY Y102,40 +0,59%
EUR/JPY Y113,53 +0,57%
GBP/JPY Y133,56 +0,40%
AUD/USD $0,7654 +0,48%
NZD/USD $0,7149 +0,11%
USD/CAD C$1,3162 -0,08%
-
00:04
Schedule for today, Tuesday, Aug 09’2016
(time / country / index / period / previous value / forecast)
01:30 Australia National Australia Bank's Business Confidence July 6
01:30 China PPI y/y July -2.6% -2.0%
01:30 China CPI y/y July 1.9% 1.8%
05:45 Switzerland Unemployment Rate (non s.a.) July 3.1%
06:00 Germany Current Account June 17.5
06:00 Germany Trade Balance (non s.a.), bln June 21
06:00 Japan Prelim Machine Tool Orders, y/y July -19.9%
08:30 United Kingdom Industrial Production (MoM) June -0.5% 0.2%
08:30 United Kingdom Industrial Production (YoY) June 1.4% 1.6%
08:30 United Kingdom Manufacturing Production (MoM) June -0.5% -0.2%
08:30 United Kingdom Manufacturing Production (YoY) June 1.7% 1.3%
08:30 United Kingdom Total Trade Balance June -2.263
12:15 Canada Housing Starts July 218.3
12:30 U.S. Unit Labor Costs, q/q (Preliminary) Quarter II 4.5% 1.8%
12:30 U.S. Nonfarm Productivity, q/q(Preliminary) Quarter II -0.6% 0.5%
14:00 United Kingdom NIESR GDP Estimate July 0.6%
14:00 U.S. Wholesale Inventories June 0.1% 0%
23:50 Japan Core Machinery Orders June -1.4% 3.1%
23:50 Japan Core Machinery Orders, y/y June -11.7% -4.2%
-