Notícias do Mercado
-
23:50
Japan: Current Account, bln, December 0.797 (forecast 1.018)
-
23:27
Currencies. Daily history for Feb 06’2018:
(raw materials / closing price /% change)
Oil 63.92 -0.36%
Gold 1,326.90 -0.72%
-
23:26
Currencies. Daily history for Feb 07’2018:
(index / closing price / change items /% change)
Nikkei +35.13 21645.37 +0.16%
TOPIX +6.50 1749.91 +0.37%
Hang Seng -272.22 30323.20 -0.89%
CSI 300 -98.39 4050.50 -2.37%
KOSPI -56.75 2396.56 -2.31%
Euro Stoxx 50 +59.60 3454.52 +1.76%
FTSE 100 +138.02 7279.42 +1.93%
DAX +197.77 12590.43 +1.60%
CAC 40 +94.09 5255.90 +1.82%
DJIA -19.42 24893.35 -0.08%
S&P 500 -13.48 2681.66 -0.50%
NASDAQ -63.90 7051.98 -0.90%
S&P/TSX -33.35 15330.58 -0.22%
-
23:24
Currencies. Daily history for Feb 07’2018:
(pare/closed(GMT +2)/change, %)
EUR/USD $1,2264 -0,91%
GBP/USD $1,3880 -0,50%
USD/CHF Chf0,9431 +0,75%
USD/JPY Y109,33 -0,21%
EUR/JPY Y134,08 -1,13%
GBP/JPY Y151,754 -0,71%
AUD/USD $0,7820 -1,08%
NZD/USD $0,7234 -1,47%
USD/CAD C$1,2565 +0,57%
-
23:06
Schedule for today, Thursday, Feb 08’2018 (GMT0)
03:00 China Trade Balance, bln January 54.69 54.1
05:00 Japan Eco Watchers Survey: Current January 53.9 55.2
05:00 Japan Eco Watchers Survey: Outlook January 52.7 53.5
07:00 Germany Current Account December 25.4
07:00 Germany Trade Balance (non s.a.), bln December 23.7
08:45 Germany German Buba President Weidmann Speaks
09:00 Australia RBA's Governor Philip Lowe Speaks
09:50 U.S. FOMC Member Kaplan Speak
12:00 United Kingdom BoE Interest Rate Decision 0.5% 0.5%
12:00 United Kingdom Asset Purchase Facility 435 435
12:00 United Kingdom BOE Inflation Letter
12:00 United Kingdom Bank of England Minutes
13:00 U.S. FOMC Member Harker Speaks
13:15 Canada Housing Starts January 217 210
13:30 Canada New Housing Price Index, YoY December 3.4%
13:30 Canada New Housing Price Index, MoM December 0.1% 0.1%
13:30 U.S. Continuing Jobless Claims January 1953 1945
13:30 U.S. Initial Jobless Claims February 230 232
14:00 U.S. FOMC Member Kashkari Speaks
17:45 Canada Gov Council Member Wilkins Speaks
-
21:11
The main US stock indexes finished trading in negative territory
The main US stock indexes bargained for most of the session with an increase, but finished trading in negative territory amid a new wave of risk aversion.
Important statistical data that could have an impact on the mood of market participants, was not published.
A certain influence was made by the statements of the President of the Federal Reserve Bank of New York William Dudley and the president of the Federal Reserve Bank of Chicago, Charles Evans. Dudley said that the sharp fluctuations of the stock market, observed in recent days, did not change his assessment of the economy and the outlook for monetary policy. However, Dudley said that the Fed leaders should monitor the situation. "If quotes in the stock market fall significantly and remain low, it will really affect the prospects for the economy, as well as my opinion on the further course of monetary policy," added Dudley.
Meanwhile, Evans said that he would prefer not to change rates until mid-2018, to be sure of a steady increase in inflation. "If in the middle of the year the Fed leaders have more confidence in the growth of inflation, further increases in rates will be justified," Evans said.To remind, this year Evans does not have the right to vote in the FOMC when making decisions on the rate.
Oil prices fell more than 2% to a monthly low, after data from the United States unexpectedly indicated an increase in petroleum products stocks, and increased concerns over excess supply during the weaker demand season. The US Energy Ministry reported that in the week of January 27 - February 2, oil reserves increased by 1.895 million barrels to 20.254 million barrels. Analysts had expected an increase in inventories of 3.189 million barrels. Oil reserves in the Cushing terminal were reduced by 711,000 barrels, to 36.3 million barrels.
Most components of the DOW index finished trading in positive territory (18 out of 30). The leader of growth was the shares of The Boeing Company (BA, + 2.51%). Outsider were the shares of Apple Inc. (AAPL -1.85%).
Most sectors of the S & P index recorded an increase. The conglomerate sector grew most (+ 0.8%). The largest decline was in the commodity sector (-1.9%).
At closing:
DJIA -0.08% 24,893.35 -19.42
Nasdaq -0.90% 7,051.98 -63.90
S & P -0.50% 2,681.66 -13.48
-
20:01
DJIA +0.22% 24,967.93 +55.16 Nasdaq -0.58% 7,074.61 -41.27 S&P -0.15% 2,691.10 -4.04
-
20:00
U.S.: Consumer Credit , December 18.45 (forecast 20)
-
20:00
New Zealand: RBNZ Interest Rate Decision, 1.75% (forecast 1.75%)
-
17:00
European stocks closed: FTSE 100 +138.02 7279.42 +1.93% DAX +197.77 12590.43 +1.60% CAC 40 +94.09 5255.90 +1.82%
-
15:32
U.S. commercial crude oil inventories increased by 1.9 million barrels from the previous week
U.S. commercial crude oil inventories (excluding those in the Strategic Petroleum Reserve) increased by 1.9 million barrels from the previous week. At 420.3 million barrels, U.S. crude oil inventories are in the middle of the average range for this time of year.
Total motor gasoline inventories increased by 3.4 million barrels last week, and are in the middle of the average range. Both finished gasoline inventories and blending components inventories increased last week. Distillate fuel inventories increased by 3.9 million barrels last week and are in the middle of the average range for this time of year. Propane/propylene inventories decreased by 4.1 million barrels last week, but are in the middle of the average range. Total commercial petroleum inventories increased by 4.4 million barrels last week
-
15:30
U.S.: Crude Oil Inventories, February 1.895 (forecast 3.189)
-
14:32
U.S. Stocks open: Dow -0.44% Nasdaq -0.40%, S&P -0.36%
-
14:21
Before the bell: S&P futures -0.45%, NASDAQ futures -0.39%
U.S. stock-index futures were lower on Tuesday, as an almost 2 percent gain in the previous session was not enough to calm the nerves following the worst one day fall in six years on Monday.
Global Stocks:
Nikkei 21,645.37 +35.13 +0.16%
Hang Seng 30,323.20 -272.22 -0.89%
Shanghai 3,309.58 -61.07 -1.81%
S&P/ASX 5,876.80 +43.50 +0.75%
FTSE 7,216.13 +74.73 +1.05%
CAC 5,197.83 +36.02 +0.70%
DAX 12,506.42 +113.76 +0.92%
Crude $63.17 (-0.35%)
Gold $1,325.90 (-0.27%)
-
13:58
Canadian municipalities issued $8.1 billion in building permits in December, up 4.8%
Canadian municipalities issued $8.1 billion in building permits in December, up 4.8% following a 7.3% decline in November. The December increase stemmed from higher construction intentions in the residential sector. Across Canada, all components climbed in 2017, up 10.4% from the previous year, led by the multi-family dwelling component.
Construction intentions for single-family homes led the rise in December. Canadian municipalities issued $2.8 billion in permits for single-family dwellings, rising 8.9% from the previous month and the largest month-over-month increase in 2017. Ontario reported the largest gain, up 15.7% from the previous month. Permits issued for new single-family housing developments in the census metropolitan areas (CMAs) of Kitchener-Cambridge-Waterloo and Barrie helped offset the 12.1% decline in the CMA of Toronto.
-
13:42
Wall Street. Stocks before the bell
(company / ticker / price / change ($/%) / volume)
3M Co
MMM
232.75
-0.88(-0.38%)
12047
ALCOA INC.
AA
49.03
-0.40(-0.81%)
166
ALTRIA GROUP INC.
MO
66.51
-0.02(-0.03%)
5257
Amazon.com Inc., NASDAQ
AMZN
1,441.00
-1.84(-0.13%)
73922
American Express Co
AXP
93.51
-0.67(-0.71%)
5711
Apple Inc.
AAPL
162.54
-0.49(-0.30%)
249069
AT&T Inc
T
36.81
-0.02(-0.05%)
16528
Barrick Gold Corporation, NYSE
ABX
13.51
0.02(0.15%)
18327
Boeing Co
BA
338.5
-2.41(-0.71%)
17578
Caterpillar Inc
CAT
155.85
-0.56(-0.36%)
17138
Chevron Corp
CVX
116.82
-0.36(-0.31%)
5554
Cisco Systems Inc
CSCO
40.04
-0.13(-0.32%)
28607
Citigroup Inc., NYSE
C
74.53
-0.29(-0.39%)
10223
Exxon Mobil Corp
XOM
78.25
-0.10(-0.13%)
29078
Facebook, Inc.
FB
184.4
-0.91(-0.49%)
80880
Ford Motor Co.
F
10.7
-0.06(-0.56%)
78286
Freeport-McMoRan Copper & Gold Inc., NYSE
FCX
18.7
-0.04(-0.21%)
25689
General Electric Co
GE
15.3
0.03(0.20%)
73152
General Motors Company, NYSE
GM
41.7
-0.16(-0.38%)
2420
Goldman Sachs
GS
258.2
-0.50(-0.19%)
12598
Google Inc.
GOOG
1,078.00
-2.60(-0.24%)
8166
Hewlett-Packard Co.
HPQ
21.4
-0.03(-0.14%)
1517
Home Depot Inc
HD
190.93
-0.11(-0.06%)
7761
HONEYWELL INTERNATIONAL INC.
HON
152
0.60(0.40%)
1713
Intel Corp
INTC
44.62
-0.29(-0.65%)
31259
International Business Machines Co...
IBM
154.91
-0.43(-0.28%)
12053
International Paper Company
IP
59.63
0.06(0.10%)
300
Johnson & Johnson
JNJ
131.15
-0.68(-0.52%)
7063
JPMorgan Chase and Co
JPM
111.63
-0.48(-0.43%)
14659
McDonald's Corp
MCD
164.01
-1.17(-0.71%)
6618
Merck & Co Inc
MRK
55.12
-0.34(-0.61%)
5822
Microsoft Corp
MSFT
90.5
-0.83(-0.91%)
56181
Nike
NKE
64.7
-0.52(-0.80%)
5449
Pfizer Inc
PFE
35.06
-0.22(-0.62%)
10624
Procter & Gamble Co
PG
82.26
-0.12(-0.15%)
7518
Starbucks Corporation, NASDAQ
SBUX
55.25
-0.06(-0.11%)
4122
Tesla Motors, Inc., NASDAQ
TSLA
337.1
3.13(0.94%)
46378
The Coca-Cola Co
KO
44.6
-0.07(-0.16%)
15262
Travelers Companies Inc
TRV
138.72
-2.13(-1.51%)
5245
Twitter, Inc., NYSE
TWTR
26
0.76(3.01%)
150005
United Technologies Corp
UTX
128.62
-1.19(-0.92%)
6297
UnitedHealth Group Inc
UNH
222.5
-2.68(-1.19%)
3944
Verizon Communications Inc
VZ
50.51
-0.32(-0.63%)
5342
Visa
V
119.58
-0.39(-0.33%)
15468
Wal-Mart Stores Inc
WMT
100.61
-0.29(-0.29%)
5610
Walt Disney Co
DIS
108.08
1.91(1.80%)
129989
Yandex N.V., NASDAQ
YNDX
37.15
-0.15(-0.40%)
1774
-
13:39
Analyst coverage initiations before the market open
Apple (AAPL) initiated with a Neutral at Goldman; target $161
HP (HPQ) initiated with a Neutral at Goldman; target $25
Cisco Systems (CSCO) initiated with a Buy at Goldman; target $48
-
13:38
Target price changes before the market open
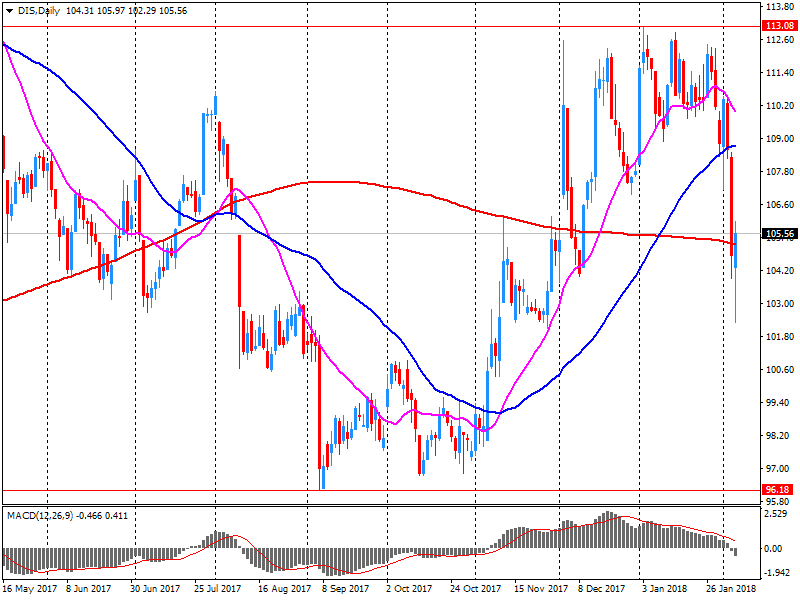
Walt Disney (DIS) target raised to $125 from $122 at B. Riley FBR
-
13:37
Upgrades before the market open
Chevron (CVX) upgraded to Outperform from Market Perform at Wells Fargo
-
13:30
Canada: Building Permits (MoM) , December 4.8% (forecast 2%)
-
12:19
Company News: Walt Disney (DIS) quarterly earnings beat analysts’ estimate
Walt Disney (DIS) reported Q1 FY 2018 earnings of $1.89 per share (versus $1.55 in Q1 FY 2017), beating analysts' consensus estimate of $1.61.
The company's quarterly revenues amounted to $15.351 bln (+3.8% y/y), generally in-line with analysts' consensus estimate of $15.474 bln.
DIS rose to $108.00 (+1.72%) in pre-market trading.
-
11:39
Frankfurt - Fed's Kaplan says market corrections are healthy
-
Market valuations high relative to history
-
No implication yet for underlying economy
-
-
10:34
ECB's Lautenschlaeger says we don't comment on single fluctuations of the stock market
-
We have to look into reasons before we say anything about stock market move
-
-
10:32
Italian retail trade index showed falls in December
Year-on-year estimates of retail trade index showed falls in December 2017, decreasing by 0.1% in terms of value and 0.9% in terms of volume. For the whole of 2017, value of sales grew by 0.2% while volume contracted by 0.6%.
Looking at the quarterly movement (Quarter 4), the 3 months to December 2017 pattern stays relatively flat (+0.1%). In the same period the volume of retail trade decreased by 0.2%, due to a decline in food sales.
The month-on-month picture reported falls in December 2017 as both value index and volume index decreased by 0.3%.
-
10:32
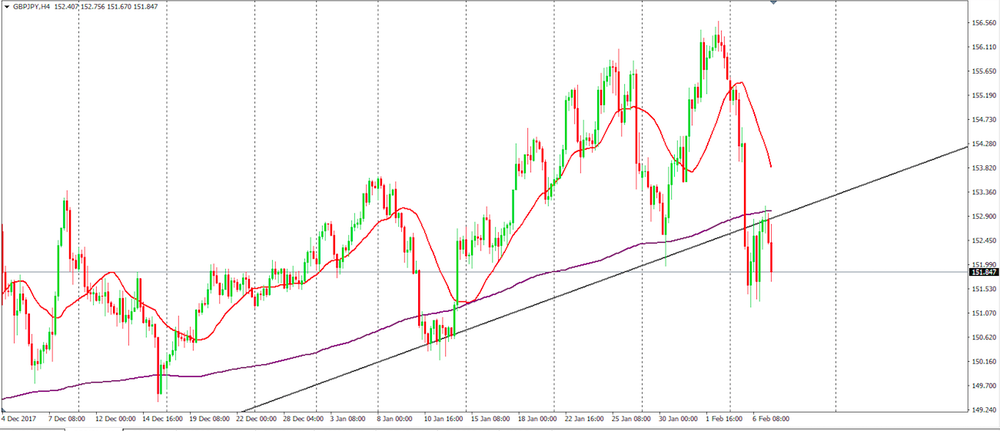
GBP/JPY Analysis
On 4-hour time frame chart we can see that the price has broken the upside trend line which the price has been following for several days.
Also, we can see that the price has tested once again the trend line below and therefore we could see a new bearish movement soon.
So, we can expect a further bearish movement on GBP/JPY close to 150.000
-
10:30
UK house price index declined 0.6% m/m
Prices in the last three months to January were 2.2% higher than in the same three months a year earlier, although the annual change in January was lower than in December (2.7%).
House prices remained unchanged in the recent quarter (November-January) from the previous quarter (August-October); on this measure prices are down from the 1.3% quarterly rise recorded in December.
On a monthly basis, prices fell for the second consecutive month in January (by 0.6% following a 0.8% decrease in December).
The average price of £223,285 at the beginning of the year is 1.9% higher than in January 2017 (£219,217), however, the current price has edged down after recording £226,408 - highest on record - in November.
-
10:26
Germany’s CDU/CSU, SPD Are Said to Reach Coalition Deal: Spiegel
-
08:30
United Kingdom: Halifax house price index, January -0.6% (forecast 0.2%)
-
08:30
United Kingdom: Halifax house price index 3m Y/Y, January 2.2% (forecast 2.4%)
-
08:02
Switzerland: Foreign Currency Reserves, January 731.4
-
07:55
Options levels on wednesday, February 7, 2017
EUR/USD
Resistance levels (open interest**, contracts)
$1.2489 (1543)
$1.2464 (2812)
$1.2438 (3519)
Price at time of writing this review: $1.2390
Support levels (open interest**, contracts):
$1.2326 (2980)
$1.2286 (5193)
$1.2242 (5230)
Comments:
- Overall open interest on the CALL options and PUT options with the expiration date February, 9 is 137521 contracts (according to data from February, 6) with the maximum number of contracts with strike price $1,2200 (7546);
GBP/USD
Resistance levels (open interest**, contracts)
$1.4095 (580)
$1.4066 (1710)
$1.4023 (2377)
Price at time of writing this review: $1.3966
Support levels (open interest**, contracts):
$1.3914 (766)
$1.3887 (749)
$1.3856 (1323)
Comments:
- Overall open interest on the CALL options with the expiration date February, 9 is 42924 contracts, with the maximum number of contracts with strike price $1,3600 (3471);
- Overall open interest on the PUT options with the expiration date February, 9 is 38751 contracts, with the maximum number of contracts with strike price $1,3400 (3038);
- The ratio of PUT/CALL was 0.90 versus 0.92 from the previous trading day according to data from February, 6
* - The Chicago Mercantile Exchange bulletin (CME) is used for the calculation.
** - Open interest takes into account the total number of option contracts that are open at the moment.
-
07:46
France: Trade Balance, bln, December -3.5 (forecast -4.9)
-
07:08
Eurostoxx 50 futures up 1.00 pct, DAX futures up 1.05 pct, CAC 40 futures up 0.95 pct, FTSE futures up 0.40 pct
-
07:07
German industrial production down 0.6% in December
In December 2017, production in industry was down by 0.6% from the previous month on a price, seasonally and working day adjusted basis according to provisional data of the Federal Statistical Office (Destatis). In November 2017, the corrected figure shows an increase of 3.1% (primary +3.4%) from October 2017.
In December 2017, production in industry excluding energy and construction was down by 0.7%. Within industry, the production of capital goods decreased by 2.6% and the production of consumer goods by 0.5%. The production of intermediate goods showed an increase by 1.5%. Energy production was up by 1.4% in December 2017 and the production in construction decreased by 1.7%.
-
07:02
Germany: Industrial Production s.a. (MoM), December -0.6% (forecast -0.5%)
-
06:28
Global Stocks
European stock markets closed sharply lower and suffered a seventh straight decline on Tuesday, after a historic selloff in the U.S. the prior day sparked a global market rout.
The U.S. stock market halted its death spiral to close higher Tuesday after a wild day of trading that saw the Dow ricocheting more than 1,000 points, underscoring a new regime of volatility on Wall Street.
Asian stocks rebounded Wednesday after equities in the U.S. roared back in a late-day rally, as investors returned to buying into weakness. "The only surprise about the current market volatility is that it hasn't happened sooner," said Richard Titherington, chief investment officer for emerging-market stocks in Asia at J.P. Morgan Asset & Wealth Management.
-
06:19
Senate democratic leader Schumer says senators have made progress toward budget deal that would increase caps on domestic, military spending
-
Says republicans promise immigration debate on senate floor next week
-
-
06:16
UK economy to grow 1.9 pct in 2018 and 2019 vs november forecasts of +1.7 pct for both years - NIESR
-
06:15
Australian AIG construction index rose more than expected in January
The seasonally adjusted Australian Performance of Construction Index increased by 1.5 points to 54.3 points in January (readings above 50 points indicate expansion). This signalled industry-wide growth for a 12th consecutive month and at a slightly higher pace than in December 2017.
Data for January revealed an improvement in demand, with the new orders sub-index returning to growth after drifting into mildly negative territory in December.
The activity sub-index remained in expansion in January, at a broadly unchanged rate from December. This was associated with further growth in deliveries from suppliers.
-
06:10
10-year U.S. treasury yield at 2.784 percent vs U.S. close of 2.766 percent on tuesday
-
05:16
Japan: Coincident Index, December 120.7 (forecast 118.2)
-
05:01
Japan: Leading Economic Index , December 107.9 (forecast 108.1)
-
00:16
Japan: Labor Cash Earnings, YoY, December 0.7% (forecast 0.7%)
-